17th Symposium of AER, Yalta, Crimea, Ukraine, Sept. 24-29, 2007.
14
17th Symposium of AER, Yalta, Crimea, Ukraine, Sept. 24-29, 2007 A dvanced A nalysisofthe C EA -N EA /O EC D V V ER -1000 C oolantTransient Benchm ark w ith the C oupled System C ode A TH LET/BIPR -V V ER S. Nikonov 1 , M. L izorkin 1 , S. L angenbuch 2 , K. Velkov 2 1 RRC KI, 123182 Moscow, Russia 2 GRS mbH, 85748 Garching, Germany
-
Upload
aubrie-bradley -
Category
Documents
-
view
223 -
download
3
Transcript of 17th Symposium of AER, Yalta, Crimea, Ukraine, Sept. 24-29, 2007.

17th Symposium of AER, Yalta, Crimea, Ukraine, Sept. 24-29, 2007
Advanced Analysis of the CEA-NEA/OECD VVER-1000 Coolant Transient Benchmark with the Coupled System Code ATHLET/BIPR-VVER
S. Nikonov 1, M. Lizorkin1, S. Langenbuch2, K. Velkov2
1 RRC KI, 123182 Moscow, Russia 2 GRS mbH, 85748 Garching, Germany

17th Symposium of AER, Yalta, Crimea, Ukraine, Sept. 24-29, 2007
CONTENT
Introduction
ATHLET/BIPR-VVER reactor pressure vessel model
- mixing at assembly head
Exercise 1 of Phase 2 of the CEA-NEA/OECD VVER-1000 Coolant Transient Benchmark
Thermocouple correlation
Further developments
Summary

17th Symposium of AER, Yalta, Crimea, Ukraine, Sept. 24-29, 2007
INTRODUCTION
The nodalization of the RPV and a correct description of the mixing phenomena in the RPV plays a very big role on the accuracy of the predicted local core parameters which are needed to check the acceptance critera.
Recent studies proved that additional modelling of the assembly outlets by the coupled code ATHLET/BIPR-VVER is necessary in order to take into account the fluid mixing phenomena at the thermocouple location
Correlation based on measured thermal-couples‘ values at core outlet (for VVER-1000) with the real coolant temperatures at those positions are necessary for correct comparison
In order to meet all these additional requirements, new models have been included in the coupled code ATHLET/BIPR-VVER and an international Benchmark problem based on experimental data is recalculated

17th Symposium of AER, Yalta, Crimea, Ukraine, Sept. 24-29, 2007
NODALIZATION OF THE REACTOR VESSEL (OPTIMAL nodalization schema)
16 down comers modelled with 16 parallel thermal-hydraulic channels (PTHC) with cross flows (CF).
• 16x7= 112 bottom plenums (2 levels) modelled with 118 PTHCs with CFs which describe the volume of the reactor bottom part with the perforated elliptical bottom plate up to the fuel assembly support plate
163 + 163 = 326 PTHC in the core (2:1) – 2 PTHC per assembly
– 163 for the assembly flow
– 163 for the control rod guide tube flow
3 different types of guide tube channels
– Empty
– Burnable absorbers
– Control rods
DW_CAM-001DW_CAM-010

17th Symposium of AER, Yalta, Crimea, Ukraine, Sept. 24-29, 2007
158(14) 159(14) 160(14) 161(14) 162(14) 163(14)
149(15) 150( 0) 151( 3) 152( 0) 153( 9) 154( 0) 155( 4) 156( 0) 157(13)
139(15) 140( 4) 141( 0) 142( 7) 143( 1) 144( 2) 145( 8) 146( 0) 147( 3) 148(13)
128(15) 129( 0) 130( 8) 131( 0) 132( 0) 133( 5) 134( 0) 135( 0) 136( 7) 137( 0) 138(13)
116(15) 117( 9) 118( 2) 119( 0) 120(10) 121( 0) 122( 0) 123(10) 124( 0) 125( 1) 126( 9) 127(13)
103(15) 104( 0) 105( 1) 106( 6) 107( 0) 108( 0) 109( 6) 110( 0) 111( 0) 112( 6) 113( 2) 114( 0) 115(13)
89(15) 90( 3) 91( 7) 92( 0) 93( 0) 94( 6) 95( 0) 96( 0) 97( 6) 98( 0) 99( 0) 100( 8) 101( 4) 102(13)
76( 0) 77( 0) 78( 0) 79(10) 80( 0) 81( 0) 82( 5) 83( 0) 84( 0) 85(10) 86( 0) 87( 0) 88( 0)
62(16) 63( 4) 64( 8) 65( 0) 66( 0) 67( 6) 68( 0) 69( 0) 70( 6) 71( 0) 72( 0) 73( 7) 74( 3) 75(12)
49(16) 50( 0) 51( 2) 52( 5) 53( 0) 54( 0) 55( 6) 56( 0) 57( 0) 58( 5) 59( 1) 60( 0) 61(12)
37(16) 38( 9) 39( 1) 40( 0) 41(10) 42( 0) 43( 0) 44(10) 45( 0) 46( 2) 47( 9) 48(12)
26(16) 27( 0) 28( 7) 29( 0) 30( 0) 31( 6) 32( 0) 33( 0) 34( 8) 35( 0) 36(12)
16(16) 17( 3) 18( 0) 19( 8) 20( 2) 21( 1) 22( 7) 23( 0) 24( 4) 25(12)
7(16) 8( 0) 9( 4) 10( 0) 11( 9) 12( 0) 13( 3) 14( 0) 15(12)
1(11) 2(11) 3(11) 4(11) 5(11) 6(11) (0) – empty guide tubes;
(1-10) – control rod group numbers;
(11-16) – burnable absorbers.
Location of the different types of guide tube channels in the core

17th Symposium of AER, Yalta, Crimea, Ukraine, Sept. 24-29, 2007
48 bypass THC
24 axial nodes in the active core
2 upper plenums and 1 reactor head
163 +163 = 326 heat structures (HS) in the core
– 163 HS for the fuel assemblies
– 163 HS for the guide tubes
Neutronically the core is modelled 1:1 (1 node per assembly in X-Y plane)
All other details concerning nodalization and modelling of the primary and secondary loop can be seen in:
S. Nikonov, Lizorkin M., Kotsarev A., Langenbuch S., Velkov K., Optimal Nodalization Schemas of VVER-1000 Reactor Pressure Vessel for the Coupled Code ATHLET-BIPR8KN, 16th Symposium of AER, Bratislava, September 2006.
17th Symposium of AER, Yalta, Crimea, Ukraine, Sept. 24-29, 2007
TRANSIENT: Isolation (closure of SIV-1 and FW valve)Isolation (closure of SIV-1 and FW valve) of SG-1 of SG-1 at reactor power of 9.36% Pnom of 9.36% Pnom (Benchmark V1000CT – Phase 2, Exersice 1)
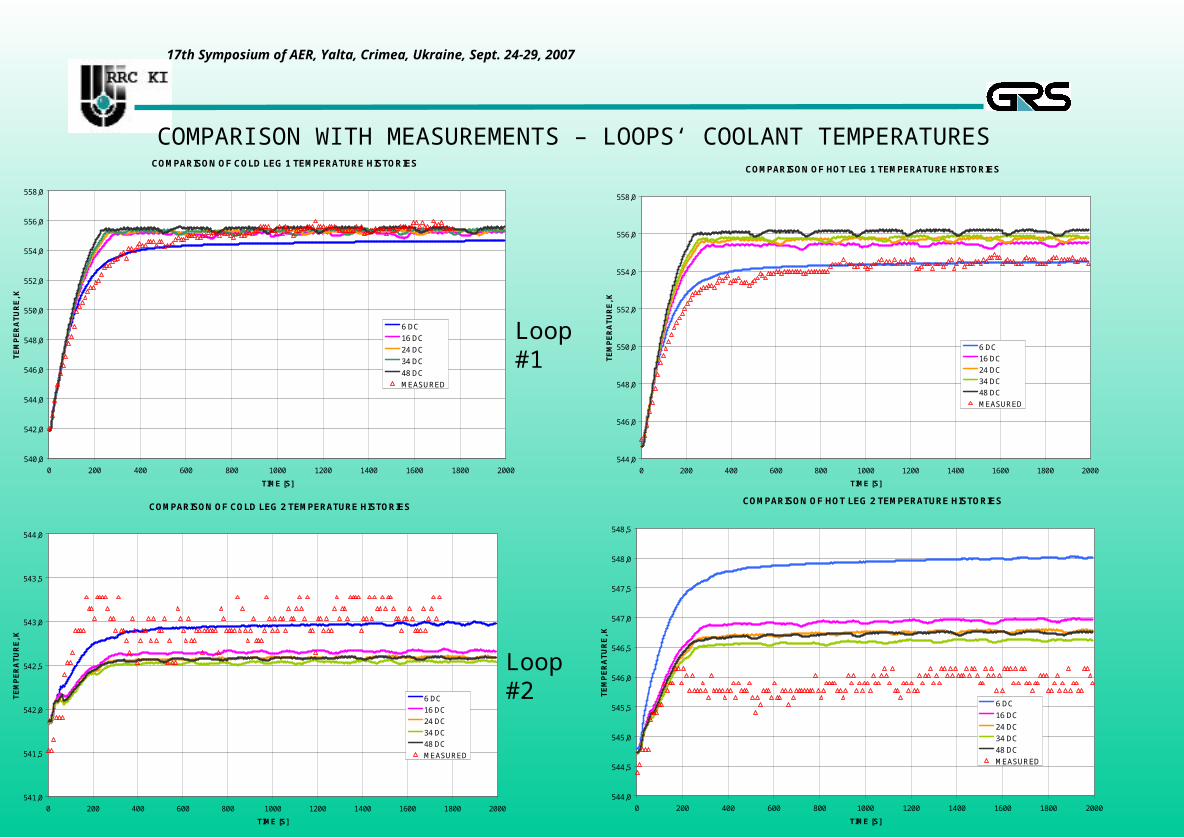
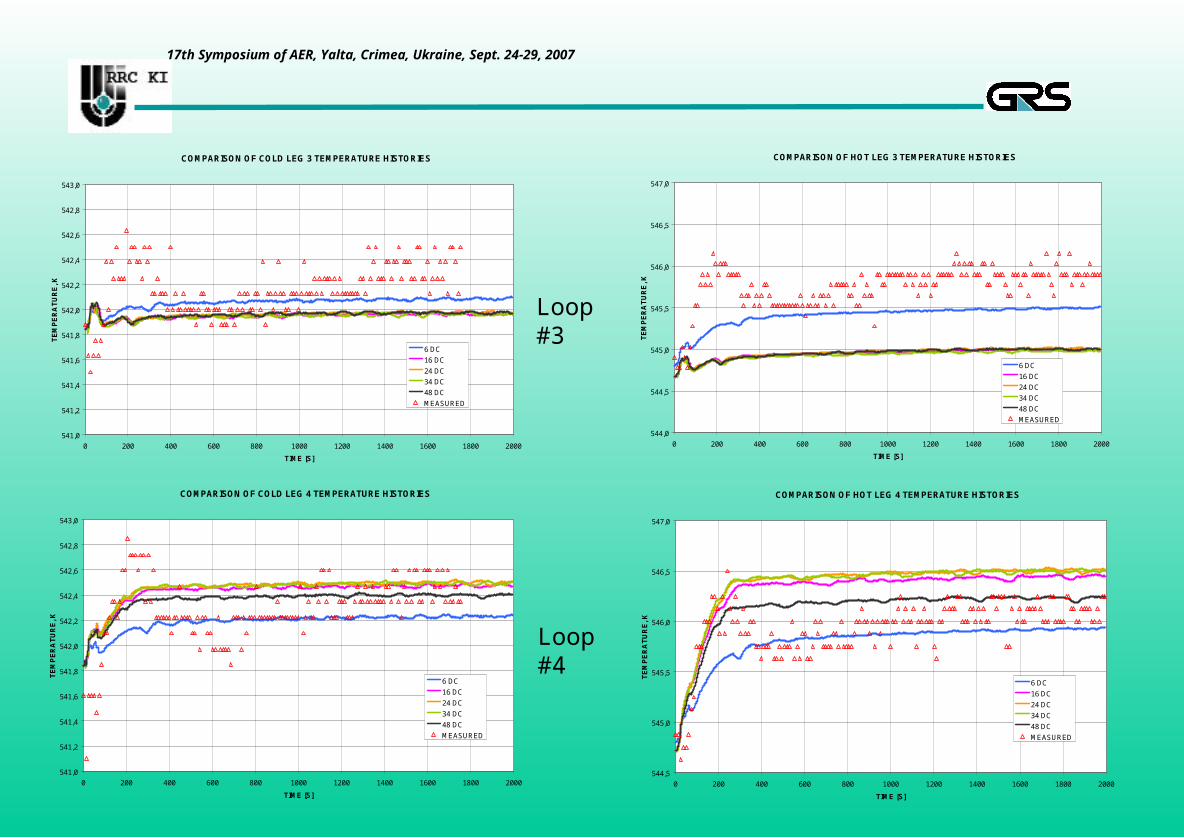
Comparison of the cold and hot legs’ temperature agree very well with the measurements. The maximum differences are 1.8 K. These differences are small considering the reported measurements’ error of 2.0 K.
The differences in the predicted local coolant temperatures at the begin and at the end of the transient compared with the measured one are small. At t=0 s the maximum assembly coolant temperature deviation is 1.4 K, and at the end of the transient – 5.8 K.
17th Symposium of AER, Yalta, Crimea, Ukraine, Sept. 24-29, 2007
COMPARISON OF COLD LEG 1 TEMPERATURE HISTORIES
540,0
542,0
544,0
546,0
548,0
550,0
552,0
554,0
556,0
558,0
0 200 400 600 800 1000 1200 1400 1600 1800 2000
TIME [S]
TE
MP
ER
AT
UR
E, K
6 DC
16 DC
24 DC
34 DC
48 DC
MEASURED
COMPARISON OF HOT LEG 1 TEMPERATURE HISTORIES
544,0
546,0
548,0
550,0
552,0
554,0
556,0
558,0
0 200 400 600 800 1000 1200 1400 1600 1800 2000
TIME [S]
TE
MP
ER
AT
UR
E, K
6 DC
16 DC
24 DC
34 DC
48 DC
MEASURED
COMPARISON OF COLD LEG 2 TEMPERATURE HISTORIES
541,0
541,5
542,0
542,5
543,0
543,5
544,0
0 200 400 600 800 1000 1200 1400 1600 1800 2000
TIME [S]
TE
MP
ER
AT
UR
E, K
6 DC
16 DC
24 DC
34 DC
48 DC
MEASURED
COMPARISON OF HOT LEG 2 TEMPERATURE HISTORIES
544,0
544,5
545,0
545,5
546,0
546,5
547,0
547,5
548,0
548,5
0 200 400 600 800 1000 1200 1400 1600 1800 2000
TIME [S]
TE
MP
ER
AT
UR
E, K
6 DC
16 DC
24 DC
34 DC
48 DC
MEASURED
COMPARISON WITH MEASUREMENTS – LOOPS‘ COOLANT TEMPERATURES
Loop #1
Loop #2
17th Symposium of AER, Yalta, Crimea, Ukraine, Sept. 24-29, 2007
COMPARISON OF COLD LEG 3 TEMPERATURE HISTORIES
541,0
541,2
541,4
541,6
541,8
542,0
542,2
542,4
542,6
542,8
543,0
0 200 400 600 800 1000 1200 1400 1600 1800 2000
TIME [S]
TE
MP
ER
AT
UR
E, K
6 DC
16 DC
24 DC
34 DC
48 DC
MEASURED
COMPARISON OF HOT LEG 3 TEMPERATURE HISTORIES
544,0
544,5
545,0
545,5
546,0
546,5
547,0
0 200 400 600 800 1000 1200 1400 1600 1800 2000
TIME [S]
TE
MP
ER
AT
UR
E, K
6 DC
16 DC
24 DC
34 DC
48 DC
MEASURED
COMPARISON OF COLD LEG 4 TEMPERATURE HISTORIES
541,0
541,2
541,4
541,6
541,8
542,0
542,2
542,4
542,6
542,8
543,0
0 200 400 600 800 1000 1200 1400 1600 1800 2000
TIME [S]
TE
MP
ER
AT
UR
E,
K
6 DC
16 DC
24 DC
34 DC
48 DC
MEASURED
COMPARISON OF HOT LEG 4 TEMPERATURE HISTORIES
544,5
545,0
545,5
546,0
546,5
547,0
0 200 400 600 800 1000 1200 1400 1600 1800 2000
TIME [S]
TE
MP
ER
AT
UR
E, K
6 DC
16 DC
24 DC
34 DC
48 DC
MEASURED
Loop #3
Loop #4

17th Symposium of AER, Yalta, Crimea, Ukraine, Sept. 24-29, 2007
OUTLET COOLANT TEMPERATURE AT ASSEMBLY #64
270
272
274
276
278
280
282
0 200 400 600 800 1000 1200 1400 1600 1800 2000
TIME [S]
TE
MP
ER
AT
UR
E [
C]
ASSEMBLY
G. TUBE
OUTLET COOLANT TEMPERATURE AT ASSEMBLY #79
270
271
272
273
274
275
276
0 200 400 600 800 1000 1200 1400 1600 1800 2000
TIME [S]
TE
MP
ER
AT
UR
E [
C]
ASSEMBLY
G. TUBE
OUTLET COOLANT TEMPERATURE AT ASSEMBLY #80
269
270
271
272
273
274
275
276
0 200 400 600 800 1000 1200 1400 1600 1800 2000
TIME [S]
TE
MP
ER
AT
UR
E [
C]
ASSEMBLY
G. TUBE
OUTLET COOLANT TEMPERATURE AT ASSEMBLY #89
270
270,5
271
271,5
272
272,5
273
273,5
274
0 200 400 600 800 1000 1200 1400 1600 1800 2000
TIME [S]
TE
MP
ER
AT
UR
E [
C]
ASSEMBLY
G. TUBE
Comparison of outlet coolant temperature histories for different types of assemblies with different guide tube channel usage

17th Symposium of AER, Yalta, Crimea, Ukraine, Sept. 24-29, 2007
Mean(oC)
Max(oC)
Min(oC)
Max -Min(oC)
MaximumDeviation (oC)(Assembly #)
MinimumDeviation (oC)(Assembly #)
SIGMA
Experiment 275.08 285.50 270.40 15.10
Assemblies 275.86 288.26 271.00 17.26 6.40 ( 51) -3.49 ( 31) 4.0259
Guide tubes 275.06 286.97 270.35 16.62 5.69 ( 51) -4.12 ( 31) 3.4922
10% mixing 275.13 287.09 270.41 16.68 5.75 ( 51) -4.06 ( 31) 3.4809
20% mixing 275.19 287.19 270.46 16.73 5.80 ( 51) -4.02 ( 31) 3.4805
30% mixing 275.24 287.27 270.50 16.76 5.85 ( 51) -3.98 ( 31) 3.4867
40% mixing 275.29 287.34 270.54 16.80 5.89 ( 51) -3.94 ( 31) 3.4968
50% mixing 275.33 287.40 270.57 16.83 5.92 ( 51) -3.91 ( 31) 3.5091
60% mixing 275.36 287.45 270.60 16.85 5.95 ( 51) -3.88 ( 31) 3.5225
70% mixing 275.39 287.50 270.63 16.80 5.98 ( 51) -3.86 ( 31) 3.5364
80% mixing 275.41 287.54 270.65 16.90 6.00 ( 51) -3.84 ( 31) 3.5505
Comparison of different flow mixing relations on the model accuracy for the end of the experiment
17th Symposium of AER, Yalta, Crimea, Ukraine, Sept. 24-29, 2007
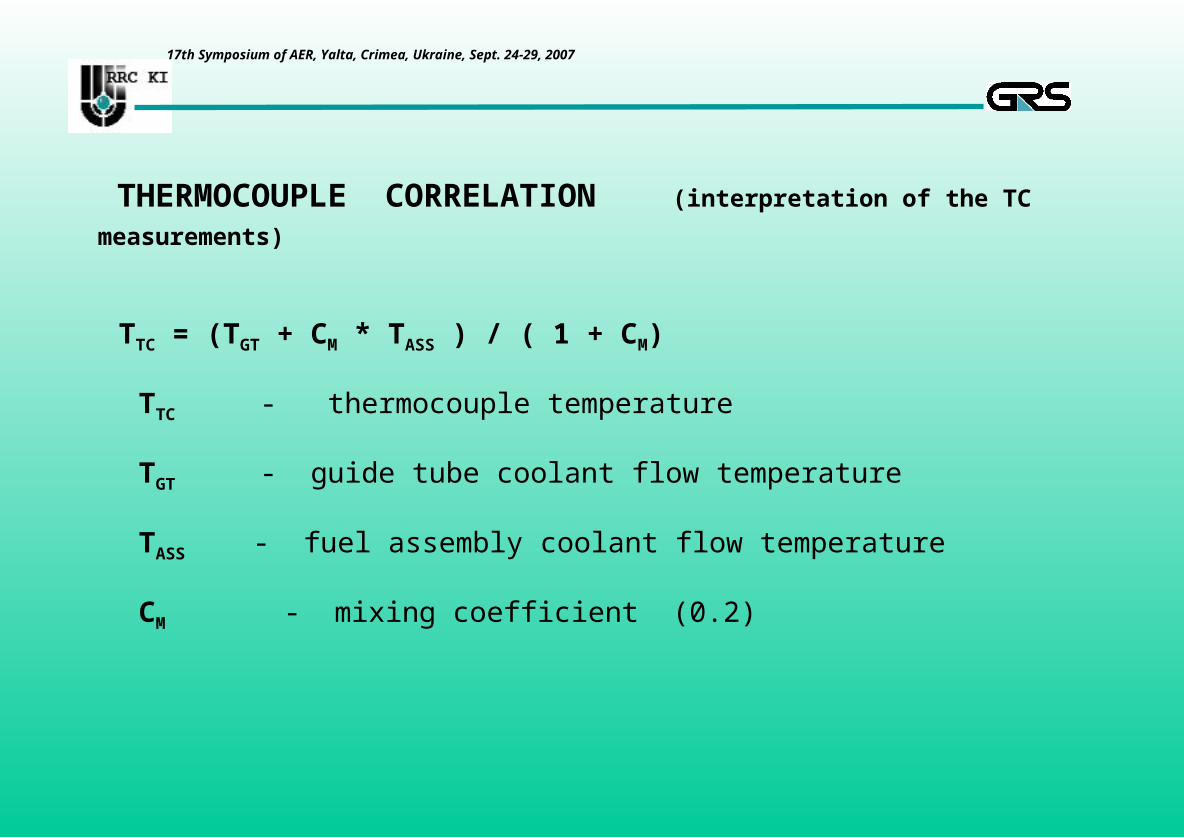
THERMOCOUPLE CORRELATION (interpretation of the TC measurements)
TTC = (TGT + CM * TASS ) / ( 1 + CM)
TTC - thermocouple temperature
TGT - guide tube coolant flow temperature
TASS - fuel assembly coolant flow temperature
CM - mixing coefficient (0.2)

17th Symposium of AER, Yalta, Crimea, Ukraine, Sept. 24-29, 2007
FURTHER DEVELOPMENTS
Confirmation of the TC correlation for nominal and intermediate reactor power (in preparation )
The TC correlation is derived from
data set with a heat up of only 3 oC
and reactor power of 9.4 % Pnom
Dependence of the mixing coefficient at assembly head from the type of the guide tube application (empty, inserted rods, CRs insertion depth, burnable absorbers)
Study the influence of different coolant temperature in the guide tubes on the accuracy of the microscopic cross section generation and homogenization procedures
COOLANT TEMPERATURE AT THC #89
268
269
270
271
272
273
274
0 200 400 600 800 1000 1200 1400 1600 1800 2000
TIME [S]
TE
MP
ER
AT
UR
E[C
]
INLET
OUTLET
17th Symposium of AER, Yalta, Crimea, Ukraine, Sept. 24-29, 2007
SUMMARY
A method is developed which allows to take into account the correct interpretation of the TC measurements (still subjected to validation)
Additional modelling in the coupled code ATHLET/BIPR-VVER is developed to meet the requirements of the correct description of the fluid mixing phenomena at the places where the TCs are located (additional PTHC introduced)
The Exercises of Phase 2 of the CEA-NEA/OECD VVER-1000 Coolant Transient are recalculated introducing the new TC correlation and the data are compared with the old ones
The coupled system code ATHLET/BIPR-VVER is able to predict the coolant temperature at the assembly outlet within a rather high accuracy even though ATHLET system code is based on 1-D thermal-hydraulic pipe models