176 shiv kumar
19
Analysis of PV Efficiency with Incremental Conductance MPPT Technique under Non-Linear Loading Conditions P.Sivakumar A.Abdullah K.Yogeshraj
-
Upload
4th-international-conference-on-advances-in-energy-research-icaer-2013 -
Category
Business
-
view
169 -
download
0
Transcript of 176 shiv kumar

Analysis of PV Efficiency with Incremental Conductance MPPT Technique under Non-
Linear Loading Conditions
P.Sivakumar
A.Abdullah
K.Yogeshraj
M.Arutchelvi

OBJECTIVE Enhanced Energy utilization of PV
sources during nonlinear loads
Analysis of PV array with conventional
MPPT technique
Modification of instantaneous
conductance with respect to variable
conductance value
Cost efficient energy utilization

Functional Block Diagram
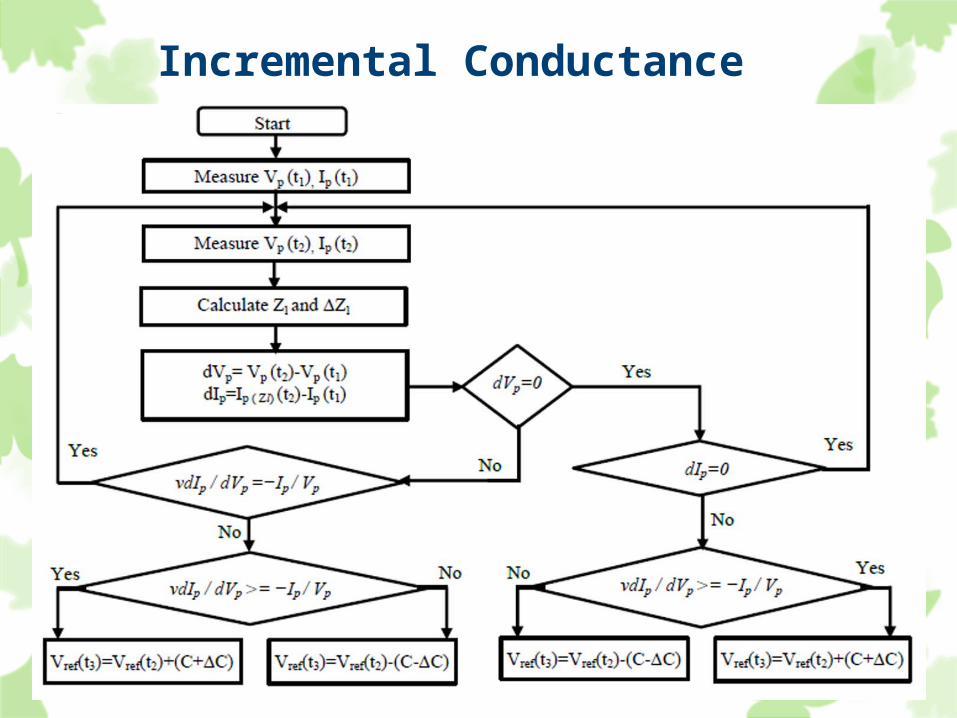
Incremental Conductance

The output voltage and output current from the PV
panel are measured using sensors to calculate the
conductance (C=Ip/Vp) and incremental conductance
(ΔC=ΔIp/ΔVp).
The slope of the PV array power curve is zero at the
MPP, positive on its left, and negative on the right.
The panel current Ip as a function of load impedance
is calculated as,
lsh
psp
j
pspsphZp Z
R
IRV
AKT
IRVqIII
l
)1)
)((exp()(
Simulation Results
The simulation circuit consists of a 150mH
inductor and 22µF capacitors for Buck-Boost
converter stage, 5mH inductor and a 90µF
capacitor for Boost converter stage, 0.5mH
inductor for Buck converter stage.
A resistive load of 125Ω was used commonly for
all stages. The system was simulated under
controlled and un-controlled converter loads.

PV Model
PV MODEL
R1
2
S-
1
S+
v+ -
V
RP n Rse
s -+
Isc
i+ -
IM
s -+
ID
s -+
I
f(u)Fcn1 f(u)Fcn
3Ise
2
Voc
1
R

Electrical Parameters of the PV Cell under STP
Maximum Power P MAX=100WP
Voltage at MPP VMPP=17.8V
Current at MPP IMPP=5.62A
Open Circuit Voltage VOC=21.8V
Short Circuit Current ISC=6.2A
Temperature Coefficient of ISC =2.46×10⁻³
A/˚C

Inverter Model
M1 M3
M2M4
INVERTER
4
o/pNeutral
3
o/pPhase
2
DC i/p+ve
1
DC i/p-ve
Out1
Out2
PulseGeneration g D
S
g DS
g DS
g DS
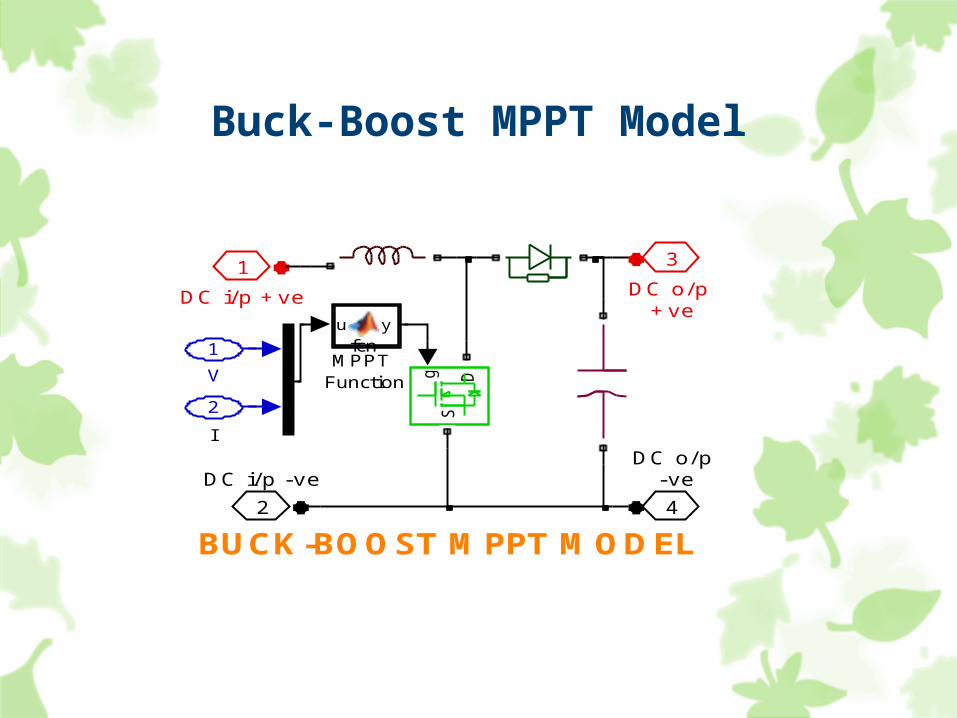
Buck-Boost MPPT Model
I
BUCK-BOOST MPPT MODEL4
DC o/p -ve
3
DC o/p +ve
2
DC i/p -ve
1
DC i/p +ve
g DS
u y
fcnMPPT
Function
2
1
V
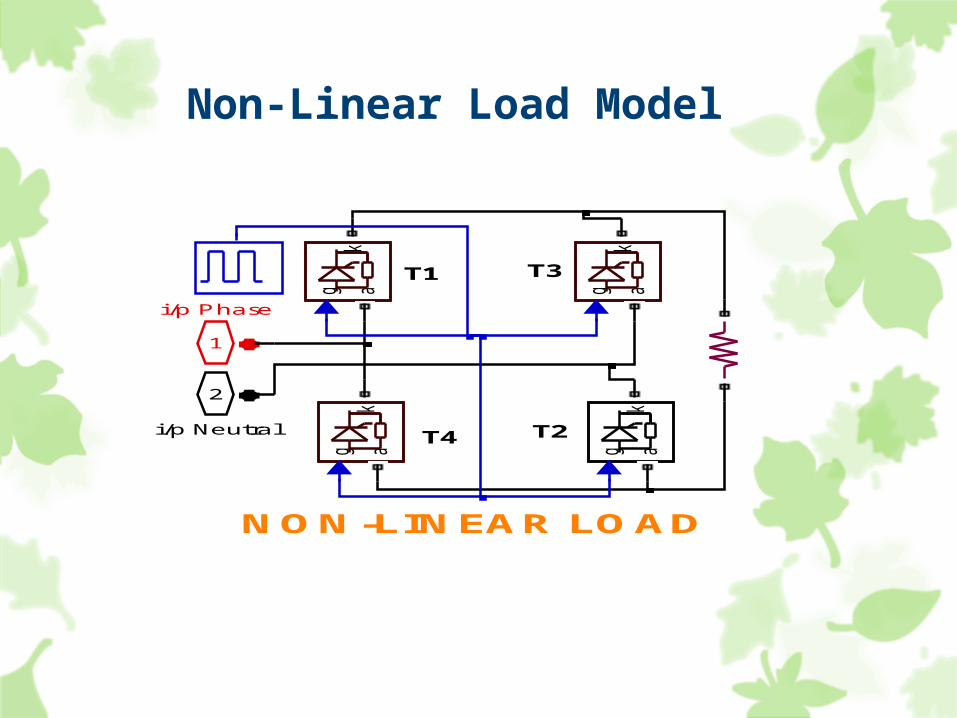
T1 T3
T2 T4
NON-LINEAR LOAD
2
i/p Neutral
1
i/p Phase
g ak
g ak
g ak
g ak
Non-Linear Load Model

Discrete,Ts = Ts s.
powergui
v+-
v+-
VOLT
sim
RES
PV MODEL
NON-LINEAR LOAD
DC i/p +v e
DC i/p -v e
o/p Phase
o/p Neutral
INVERTER
IMM
[Pac]
[Vac]
[Vdc]
[Iac]
[Pdc]
[Idc]
[Pdc]
[Iac]
[Vac]
[Idc]
[Vdc]
[Idc]
[Idc]
[Vdc]
[Pac]
[Iac]
[Vac]
[Vdc]
V
I
DC i/p -v e
DC i/p +v e
DC o/p +v e
DC o/p -v e
DC-DC BUCK-BOOSTMPPT
i+ -
i+ -
Overall Simulation

Current and Voltage waveforms using a DC-DC Buck-Boost converter with controlled converter load.
Current and Voltage waveforms using a DC-DC Buck converter with fully controlled converter load
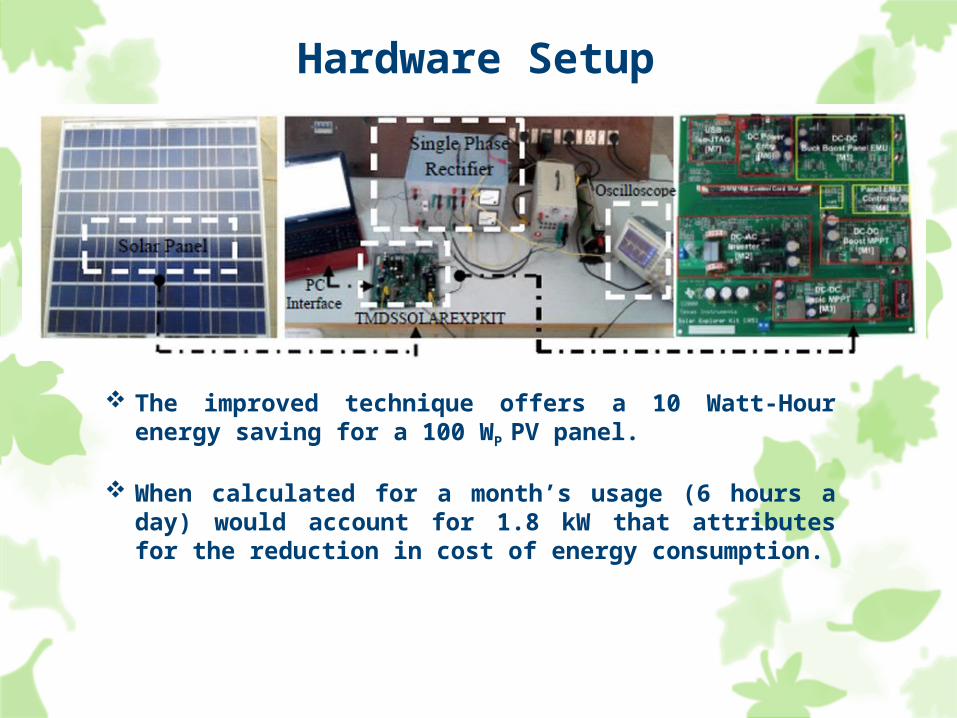
Hardware Setup
The improved technique offers a 10 Watt-Hour energy saving for a 100 WP PV panel.
When calculated for a month’s usage (6 hours a day) would account for 1.8 kW that attributes for the reduction in cost of energy consumption.
Experimental Results
The experimental results were obtained from the setup
consisting of a PV source with DC-DC buck-boost MPPT
connected to a PWM inverter feeding a fully controlled
converter load.
TMDSSOLAREXPKIT, which has a solar inverter with a
MPPT Boost DC-DC converter, was used for MPPT
control and the processor control card TMS320F28035

Variation of Efficiency
RMS Current(Amps)
RMS Voltage(Amps) Mean
Current(Amps)
Mean Voltage(Volts)
RMS Power
(Watts)
Mean Power(e)
(Watts)
MeanPower(i)
(Watts)
Efficiency(Existing)
(%)
Efficiency(Improved)
(%)
(1) 17.6 443 11.5 416 7796 4790 6200 61.2 78.3
(2) 13.3 511 11.5 416 6796 4790 6200 61.2 78.3
(3) 9 540 6 540 4860 3240 3600 40.8 46.5
(4) 7 540 6 540 3780 3240 3600 40.8 46.5
(5) 26 430 24 290 11180 6960 7900 89.8 96.6
(6) 24 400 24 290 9600 6960 7900 89.8 96.6

Conclusion From the experiment and simulation result it is
clear that the IC technique fails to attain
Maximum power point when PV is loaded with
non-linear load
By varying the conductance along with the
load conductance the efficiency of the system
is improved
A 2kWh saving would result in the reduction of
898 INR for the same calculated duration of
utilization based on the tariff of Tamilnadu
Generation and Distributed Corporation
limited, India.
It is a Enhanced cost Efficient system.

?

Thank you
Go green Initiative , letz support green energy