Pessimistic reports regarding the success ofmen- (Edgerton ...
Upload
trinhhuongCategory
view
216download
1
Data Warehouse: Student Success Reports User Guide
1
Data Warehouse User Guide
Student Success Reports
Last Revised: 03/24/17

Data Warehouse: Student Success Reports User Guide
2
REVISION CONTROL
Revision History:
Revision Date Revised By Summary of Revisions Section(s) Revised 03/07/17 Preeti Patil Guide created. Click here to
enter Revision 03/08/17 Preeti Patil Added Chapter 6 , 7 Click here to
enter Revision 03/15/17 Preeti Patil Made necessary changes in chapter 7. Added
chapters 8 , 9
Review / Approval History
Review Date Reviewed By Action (Reviewed, Recommended or Approved) 3/28/17 Scott Heil
Ravi Pisupati Approved
Document Title:
Author:
File Reference:
Data Warehouse Student Success Reports User Guide
IT Training & Support
17_SDW_Student_Success_Reports.docx

Data Warehouse: Student Success Reports User Guide
3
Table of Contents
REVISION CONTROL .............................................................................................................................................2
Revision History:.............................................................................................................................................2
1.0 Student Success Dashboard Overview .....................................................................................................5
1.1 Important Information about These Reports .................................................................................................5
1.2 Available Reports ............................................................................................................................................5
1.3 Accessing the Student Success Reports......................................................................................................7
2.0 Cohort Comparison .....................................................................................................................................8
Reading the Chart ............................................................................................................................................... 10
Reading the Table ............................................................................................................................................... 11
3.0 Cohort Comparison – College ..................................................................................................................... 12
Reading the Table: .............................................................................................................................................. 15
4.0 Cohort Comparison - Ethnicity ................................................................................................................ 16
Reading the Chart ............................................................................................................................................... 18
Reading the Table ............................................................................................................................................... 19
5.0 Cohort Comparison – Parent Education ................................................................................................ 20
Reading the Chart ............................................................................................................................................... 22
Reading the Table ............................................................................................................................................... 23
6.0 First – Time Freshman Cohort - Detail.................................................................................................... 24
Reading the Chart ............................................................................................................................................... 27
Cohort Summary Chart ...................................................................................................................................... 28
Gender Chart ....................................................................................................................................................... 29
Ethnicity Chart .................................................................................................................................................... 30
URM ...................................................................................................................................................................... 31
Prior GPA Range Chart ...................................................................................................................................... 32
Parent Education Chart ...................................................................................................................................... 33
College (Latest) Chart ........................................................................................................................................ 34

Data Warehouse: Student Success Reports User Guide
4
College (Entry) Chart .......................................................................................................................................... 35
Cohort Summary Table: ..................................................................................................................................... 35
Gender Table: ...................................................................................................................................................... 36
Ethnicity Table: ................................................................................................................................................... 37
URM Table: .......................................................................................................................................................... 37
Prior GPA Range Table: ..................................................................................................................................... 38
Parent Education Table: ..................................................................................................................................... 39
Latest College ..................................................................................................................................................... 39
College At Entry .................................................................................................................................................. 40
7.0 2 Dimensional Detail ................................................................................................................................. 41
Reading the Chart ............................................................................................................................................... 43
2-Dimensional Chart ........................................................................................................................................... 45
2-Dimensional Table ........................................................................................................................................... 45
8.0 Student Search .......................................................................................................................................... 47
9.0 Graduation Rate ........................................................................................................................................ 48

Data Warehouse: Student Success Reports User Guide
5
1.0 Student Success Dashboard Overview
This user guide assumes basic knowledge of SJSU’s Student Data Warehouse (SDW). User guides and tutorials on the basic features of the data warehouse are available at the IT Training website: http://its.sjsu.edu/resources/student-data-warehouse/index.html
Data in the Data Warehouse is refreshed nightly; therefore all Data Warehouse reports reflect numbers/information as of the previous night.
1.1 Important Information about These Reports The Student Success reports allow users to view graduation rates for cohorts of first-time full-time freshmen and new undergraduate transfers. Additionally users can view these graduation rates for a specific college, ethnicity, parent education level, underrepresented status, EOP participation, or prior institution type. Detail for each cohort (degree count, enrolled count, and not graduated & not enrolled count) is also available. Cohort membership and the students' background characteristics come from the census-based definitions (ERS) as reported to the CSU system and the public. However, enrollment and degree statuses reported here are based on current PeopleSoft records, so the figures shown may not match the official numbers exactly.
1.2 Available Reports The following reports are currently available for the Student Success dashboard: • Cohort Comparison: The Cohort Comparison report shows charts and tables with a comparison of cohorts from fall 2004 – present on values such as initial cohort size, degree count, % graduated, enrolled count, % enrolled & not graduated, not graduated & not enrolled count, and % not graduated & not enrolled. Users can choose to see this information for first-time full-time freshman cohorts or for new undergraduate transfer cohorts. Group comparisons are available by college, student ethnicity, and parent education level, • Cohort Detail: The Cohort Detail report shows charts and tables with a comparison of entering cohorts from fall 2004 to the present on values such as college, cohort size, degree count, % graduated, enrolled count (current term), % enrolled & not graduated, not graduated & not enrolled count, and % not graduated & not enrolled. It includes the option to view both undergraduate and graduate student cohorts. Users can specify for which cohorts they wish to see this information and to view numbers by most recent college (based on latest major), most recent major, college at entry, gender, ethnicity, underrepresented status, high school GPA range, prior institution type, parent education level, Pell grant recipients, entrance test scores, resident status, and EOP participation. • 2-Dimensional Detail: The 2-Dimensional Detail report shows charts and tables with a comparison of cohorts from fall 2004 – present on values such as initial cohort size, degree count, % graduated, enrolled count, % enrolled & not graduated, not graduated & not enrolled count, and % not graduated & not enrolled. Users can choose to see this information for first-time full-time freshman cohorts or for new undergraduate transfer cohorts. Users can also specify two dimensions on which to view the data from among the following: cohort type, most recent college (based on latest major), most recent major, college at entry, gender, ethnicity,

Data Warehouse: Student Success Reports User Guide
6
underrepresented status, high school GPA range, prior institution type, parent education level, Pell grant recipients, entrance test scores, resident status, and EOP participation. • Student Search: The Student Search report allows users to enter the student ID (SJSUOne) of one or more students to view detail information on those students including name, cohort, initial enrollment type, last enrolled term, degree term (if graduated), email, phone number, cell phone number, major at entry, major (latest), gender, ethnicity, underrepresented status, parent education level, units earned, units attempted (current term), units attempted (future term), cumulative GPA, degree candidate term, degree checkout consideration term & status, and EOP participation. The results cover only students who entered a fall degree-seeking cohort from 2004 or later. • Graduation Rate: The Graduation Rate report allows users to view selected first-time freshman graduation rates by major and cohort year. A summary table shows the university-wide cumulative graduation rate for the selected cohort, and the user can specify whether to see programs with lower than average graduation rates.

Data Warehouse: Student Success Reports User Guide
7
1.3 Accessing the Student Success Reports
Processing Steps Screenshots
Step 1: Login to the OBIEE portal of SJSU and from the Data Warehouse homepage, click on the Dashboards menu.
Step 2: In the CSU Reports section, select Student Success.

Data Warehouse: Student Success Reports User Guide
8
2.0 Cohort Comparison
The Cohort Comparison report shows charts and tables with a comparison of cohorts from fall 2004 – present on values such as initial cohort size, degree count, % graduated, enrolled count, % enrolled & not graduated, not graduated & not enrolled count, and % not graduated & not enrolled. Users can choose to see this information for first-time full-time freshman cohorts or for new undergraduate transfer cohorts.
Processing Steps Screenshots
Running the Report. Step 1: On the Admissions dashboard, click on Application Profile. Step 2: The report will automatically run with your personal settings if you have set them up. If you have not set up your personal settings, the report will show information for the default terms. The default terms are all of the admissions terms currently in progress.

Data Warehouse: Student Success Reports User Guide
9
Step 3: To change the enrollment type, use the drop-down menu to make a selection.
Step 4: Click Apply to run the report. For more information on how to use filters in Data Warehouse, view the Data Warehouse Filtering user guide or web tutorial.
Step 5: The updated report appears.

Data Warehouse: Student Success Reports User Guide
10
Reading the Chart The Cohort Comparison chart shows the percentage graduated versus percentage enrolled versus percentage not graduated & not enrolled for each cohort listed on the y-axis on the left. The legend on the right indicates what each color represents on the chart: green for percentage graduated in that cohort, blue for percentage enrolled & not graduated in that cohort, and red for percentage not graduated & not enrolled in that cohort. The chart also provides markers at the 80% and 50%
Step 6: Select an Academic Career from the drop-down menu to narrow down your report results to either only undergraduates or only post-baccalaureates (if desired).
Hover your mouse over the chart and a pop-up will appear giving you the specific value for that point on the chart.
Step 7a: It may take several minutes for your data to appear. While the system is working to provide your results, you may see a “Searching” message.

Data Warehouse: Student Success Reports User Guide
11
Reading the Table The Cohort Comparison table shows the detailed counts that are summarized in the Cohort Comparison chart.
Step 8: The updated report appears.
Field Description Cohort Description The catalog year for the cohort. Enrollment Type Description The type of students in the cohort: either first-time full-time freshman or new
undergraduate transfer. Initial Cohort Size The number of students initially in the cohort. Graduate Count The number of students in the cohort who have graduated. % Graduated The percentage of students in the cohort who have graduated. Enrolled Count The number of students in the cohort who are enrolled in the current term. % enrolled & Not Graduated The percentage of students in the cohort who are enrolled in the current term and
have not graduated. Not Graduated Not Enrolled Count The number of students in the cohort who have not graduated and are not
enrolled in the current term.

Data Warehouse: Student Success Reports User Guide
12
3.0 Cohort Comparison – College
The Cohort Comparison - College report shows charts and tables with a comparison of cohorts from fall 2004 – present on values such as initial cohort size, degree count, % graduated, enrolled count, % enrolled & not graduated, not graduated & not enrolled count, and % not graduated & not enrolled. These values are broken down by academic college. Users can choose to see this information for first-time full-time freshman cohorts or for new undergraduate transfer cohorts. Users can also specify that they want to see this information for all academic colleges or for a specific college.
% Not Graduated & Not Enrolled The percentage of students in the cohort who have not graduated and are not enrolled in the current term.
Processing Steps Screenshots
Running the Report. Step 1: On the Admissions dashboard, click on Cohort Comparison.

Data Warehouse: Student Success Reports User Guide
13
Step 2: Select the required value from College dropdown. The report will automatically run with your personal settings if you have set them up. If you have not set up your personal settings, the report will show information for the default terms. The default terms are all of the admissions terms currently in progress.
Step 3: To change the enrollment type, use the drop-down menu to make a selection.
Step 4: To select a specific academic college, use the drop-down menu to make a selection.
Step 5: Click Apply to run the report. For more information on how to use filters in Data Warehouse, view the Data Warehouse Filtering user guide or web tutorial.

Data Warehouse: Student Success Reports User Guide
14
Step 6: The updated report appears.
Reading the Chart The Cohort Comparison – College chart shows the percentage graduated versus percentage enrolled versus percentage not graduated & not enrolled for each cohort listed on the y-axis on the left for the college(s) you selected in the filters at the top of the page. The legend on the right indicates what each color represents on the chart: green for percentage graduated in that cohort, blue for percentage enrolled & not graduated in that cohort, and red for percentage not graduated & not enrolled in that cohort. The chart also provides markers at the 80% and 50%. This chart will show you the exact same data as the Cohort

Data Warehouse: Student Success Reports User Guide
15
Reading the Table: The Cohort Comparison – College table shows the detailed counts that are summarized in the chart.
Comparison chart unless you select a specific college from the drop-down menu. Hover your mouse over the chart and a pop-up will appear giving you the specific value for that point on the chart.
Field Description Cohort Description The catalog year for the cohort. College(Entry) The type of college in the cohort. Initial Cohort Size The number of students initially in the cohort. Graduate Count The number of students in the cohort who have graduated. % Graduated The percentage of students in the cohort who have graduated. Enrolled Count The number of students in the cohort who are enrolled in the current term. % enrolled & Not Graduated The percentage of students in the cohort who are enrolled in the current term and
have not graduated. Not Graduated Not Enrolled Count The number of students in the cohort who have not graduated and are not

Data Warehouse: Student Success Reports User Guide
16
4.0 Cohort Comparison - Ethnicity
The Cohort Comparison - Ethnicity report shows charts and tables with a comparison of cohorts from fall 2004 – present on values such as initial cohort size, degree count, % graduated, enrolled count, % enrolled & not graduated, not graduated & not enrolled count, and % not graduated & not enrolled. These values are broken down by student ethnicity. Users can choose to see this information for first-time full-time freshman cohorts or for new undergraduate transfer cohorts. Users can also specify that they want to see this information for all ethnicities or a specific ethnicity.
enrolled in the current term. % Not Graduated & Not Enrolled The percentage of students in the cohort who have not graduated and are not
enrolled in the current term.
Processing Steps Screenshots
Running the Report. Step 1: On the Admissions dashboard, click on Cohort Comparison.

Data Warehouse: Student Success Reports User Guide
17
Step 2: Select the required value from Ethnicity dropdown. The report will automatically run with your personal settings if you have set them up. If you have not set up your personal settings, the report will show information for the default terms. The default terms are all of the admissions terms currently in progress.
Step 3: To change the enrollment type, use the drop-down menu to make a selection.
Step 4: To select a specific ethnicity, use the drop-down menu to make a selection.
Step 5: Click Apply to run the report. For more information on how to use filters in Data Warehouse, view the Data Warehouse Filtering user guide or web tutorial.

Data Warehouse: Student Success Reports User Guide
18
Step 6: The updated report appears.
Reading the Chart The Cohort Comparison – Ethnicity chart shows the percentage graduated versus percentage enrolled versus percentage not graduated & not enrolled for each cohort listed on the y-axis on the left for the ethnicity or ethnicities you selected in the filters at the top of the page. The legend on the right indicates what each color represents on the chart: green for percentage graduated in that cohort, blue for percentage enrolled & not graduated in that cohort, and red for percentage not graduated & not enrolled in that cohort. The chart also provides

Data Warehouse: Student Success Reports User Guide
19
Reading the Table The Cohort Comparison – Ethnicity table shows the detailed counts that are summarized in the chart.
markers at the 80% and 50%. This chart will show you the exact same data as the Cohort Comparison chart unless you select a specific ethnicity from the drop-down menu. Hover your mouse over the chart and a pop-up will appear giving you the specific value for that point on the chart.
Field Description Cohort Description The catalog year for the cohort. Ethnicity Describes the Ethnicity of the Cohort. Initial Cohort Size The number of students initially in the cohort. Graduate Count The number of students in the cohort who have graduated. % Graduated The percentage of students in the cohort who have graduated. Enrolled Count The number of students in the cohort who are enrolled in the current term. % enrolled & Not Graduated The percentage of students in the cohort who are enrolled in the current term and
have not graduated. Not Graduated Not Enrolled Count The number of students in the cohort who have not graduated and are not

Data Warehouse: Student Success Reports User Guide
20
5.0 Cohort Comparison – Parent Education
The Cohort Comparison – Parent Education report shows charts and tables with a comparison of cohorts from fall 2004 – present on values such as initial cohort size, degree count, % graduated, enrolled count, % enrolled & not graduated, not graduated & not enrolled count, and % not graduated & not enrolled. These values are broken down by level of parent education. Users can choose to see this information for first-time full-time freshman cohorts or for new undergraduate transfer cohorts. Users can also specify that they want to see this information for all levels of parent education or for a specific level of parent education.
enrolled in the current term. % Not Graduated & Not Enrolled The percentage of students in the cohort who have not graduated and are not
enrolled in the current term.
Processing Steps Screenshots
Running the Report. Step 1: On the Admissions dashboard, click on Cohort Comparison.

Data Warehouse: Student Success Reports User Guide
21
Step 2: Select the required value from Parent Education dropdown. The report will automatically run with your personal settings if you have set them up. If you have not set up your personal settings, the report will show information for the default terms. The default terms are all of the admissions terms currently in progress.
Step 3: To change the enrollment type, use the drop-down menu to make a selection.
Step 4: To select a specific Parent Education, use the drop-down menu to make a selection.
Step 5: Click Apply to run the report. For more information on how to use filters in Data Warehouse, view the Data Warehouse Filtering user guide or web tutorial.

Data Warehouse: Student Success Reports User Guide
22
Step 6: The updated report appears.
Reading the Chart The Cohort Comparison – Ethnicity chart shows the percentage graduated versus percentage enrolled versus percentage not graduated & not enrolled for each cohort listed on the y-axis on the left for the ethnicity or ethnicities you selected in the filters at the top of the page. The legend on the right indicates what each color represents on the chart: green for percentage graduated in that cohort, blue for percentage enrolled & not graduated in that cohort, and red for percentage not graduated & not enrolled in that cohort. The chart also provides

Data Warehouse: Student Success Reports User Guide
23
Reading the Table The Cohort Comparison – Parent Education table shows the detailed counts that are summarized in the chart.
markers at the 80% and 50%. This chart will show you the exact same data as the Cohort Comparison chart unless you select a specific ethnicity from the drop-down menu. Hover your mouse over the chart and a pop-up will appear giving you the specific value for that point on the chart.
Field Description Cohort Description The catalog year for the cohort. Parent Ed Describes the Parent Education of the Cohort. Initial Cohort Size The number of students initially in the cohort. Graduate Count The number of students in the cohort who have graduated. % Graduated The percentage of students in the cohort who have graduated. Enrolled Count The number of students in the cohort who are enrolled in the current term. % enrolled & Not Graduated The percentage of students in the cohort who are enrolled in the current term and
have not graduated. Not Graduated Not Enrolled Count The number of students in the cohort who have not graduated and are not
enrolled in the current term.

Data Warehouse: Student Success Reports User Guide
24
6.0 Cohort Detail
The Cohorts Detail report shows charts and tables with a comparison of cohorts from fall 2004 – present on values such as college, cohort size, degree count, % graduated, enrolled count (current term), % enrolled & not graduated, not graduated & not enrolled count, and % not graduated & not enrolled. Users can specify for which cohorts they wish to see this information and to view numbers by college (latest), college (entry), gender, ethnicity, underrepresented status, prior institution type, parent education level, and EOP participation.
% Not Graduated & Not Enrolled The percentage of students in the cohort who have not graduated and are not enrolled in the current term.
Processing Steps Screenshots
Running the Report. Step 1: On the Admissions dashboard, click on Cohort Detail.

Data Warehouse: Student Success Reports User Guide
25
Step 2: Select the required value from Parent Education dropdown. The report will automatically run with your personal settings if you have set them up. If you have not set up your personal settings, the report will show information for the default terms. The default terms are all of the admissions terms currently in progress.
Step 3: To add/remove cohorts from the report, click on the Cohort Description drop-down menu. Place a checkmark next to each cohort you wish to include in your report. Un-check any cohorts you want to remove from your report. Step 4: Once you have selected all of the cohorts you want to include on the report, click Apply to run the report. For more information on how to use filters in Data Warehouse, view the Data Warehouse Filtering user guide or web tutorial.

Data Warehouse: Student Success Reports User Guide
26
Step 5: The updated report appears.
Change the “View Number By” according to the need and the report gets updated accordingly.

Data Warehouse: Student Success Reports User Guide
27
Reading the Chart The default setting for the charts (and tables below) is by College (latest). Use the View Numbers By drop-down menu above the chart to view the chart and table broken down by Cohort Summary, Gender, Ethnicity, Underrepresented Status, Prior Institution Type, Parent Education, College (entry), or EOP Participation.
Hover your mouse over the chart and a pop-up will appear giving you the specific value for that point on the chart.

Data Warehouse: Student Success Reports User Guide
28
Cohort Summary Chart The Cohort Summary chart shows the percentage graduated versus percentage enrolled versus percentage not graduated & not enrolled for each cohort listed on the y-axis on the left. The legend on the right indicates what each color represents on the chart: green for percentage graduated in that cohort, blue for percentage enrolled & not graduated in that cohort, and red for percentage not graduated & not enrolled in that cohort. For reference, the chart also provides markers at 80% and 50%.

Data Warehouse: Student Success Reports User Guide
29
Gender Chart The Gender chart shows the percentage graduated versus percentage enrolled versus percentage not graduated & not enrolled for each cohort listed on the y-axis on the left for each gender. The legend on the right indicates what each color represents on the chart: green for percentage graduated in that cohort, blue for percentage enrolled & not graduated in that cohort, and red for percentage not graduated & not enrolled in that cohort. For reference, the chart also provides markers at 80% and 50%.

Data Warehouse: Student Success Reports User Guide
30
Ethnicity Chart The Ethnicity chart shows the percentage graduated versus percentage enrolled versus percentage not graduated & not enrolled for each cohort listed on the y-axis on the left for each ethnicity. There are two ethnicity breakdowns to choose from. Ethnic1 classifies all students by the primary ethnic description they provided at the time of admission following the CSU methodology for official reporting. Ethnic2 reports students who are not US residents as a separate category, following the federal IPEDS methodology. The legend on the right indicates what each color represents on the chart: green for percentage graduated in that cohort, blue for percentage enrolled & not graduated in that cohort, and red for percentage not graduated & not enrolled in that cohort. For reference, the chart also provides markers at 80% and 50%.

Data Warehouse: Student Success Reports User Guide
31
URM The URM chart shows the percentage graduated versus percentage enrolled versus percentage not graduated & not enrolled for each cohort listed on the y-axis on the left based on URM status. URM students are those of African American, Native American, or Hispanic/Latino backgrounds. Non-URM are all others. The legend on the right indicates what each color represents on the chart: green for percentage graduated in that cohort, blue for percentage enrolled & not graduated in that cohort, and red for percentage not graduated & not enrolled in that cohort. For reference, the chart also provides markers at 80% and 50%.
Data Warehouse: Student Success Reports User Guide
32
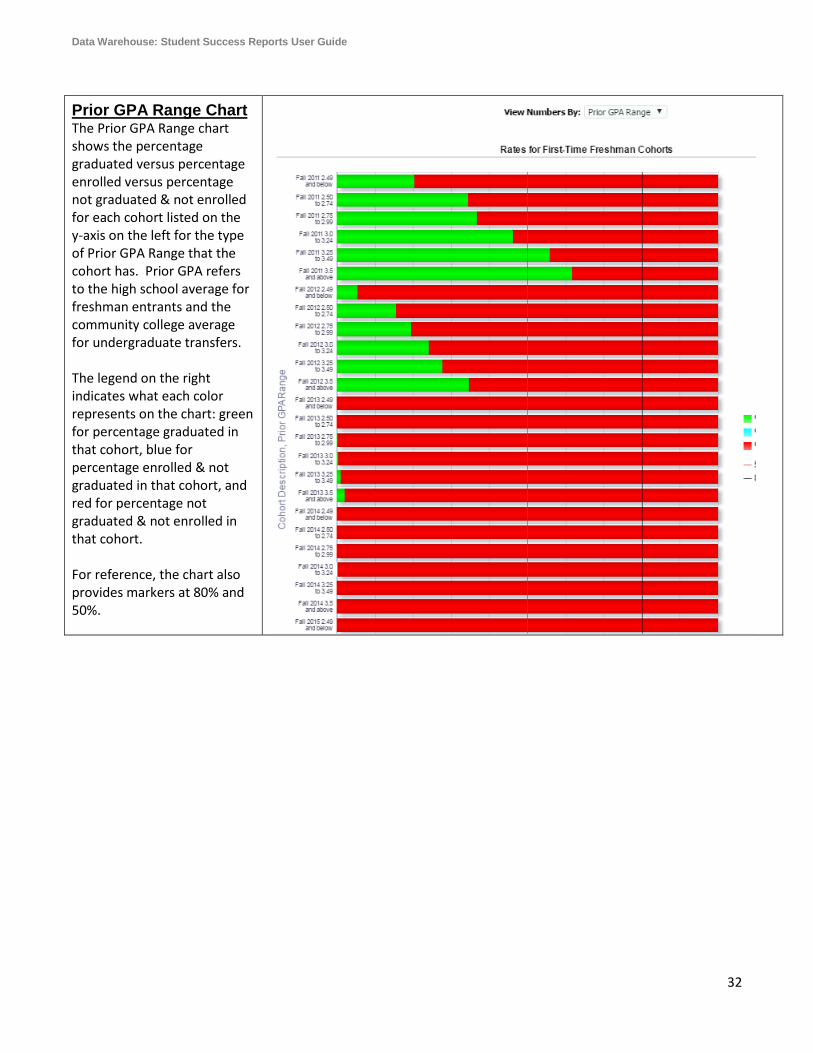
Prior GPA Range Chart The Prior GPA Range chart shows the percentage graduated versus percentage enrolled versus percentage not graduated & not enrolled for each cohort listed on the y-axis on the left for the type of Prior GPA Range that the cohort has. Prior GPA refers to the high school average for freshman entrants and the community college average for undergraduate transfers. The legend on the right indicates what each color represents on the chart: green for percentage graduated in that cohort, blue for percentage enrolled & not graduated in that cohort, and red for percentage not graduated & not enrolled in that cohort. For reference, the chart also provides markers at 80% and 50%.

Data Warehouse: Student Success Reports User Guide
33
Parent Education Chart The Parental Education chart shows the percentage graduated versus percentage enrolled versus percentage not graduated & not enrolled for each cohort listed on the y-axis on the left for the level of parent education. The legend on the right indicates what each color represents on the chart: green for percentage graduated in that cohort, blue for percentage enrolled & not graduated in that cohort, and red for percentage not graduated & not enrolled in that cohort. For reference, the chart also provides markers at 80% and 50%.

Data Warehouse: Student Success Reports User Guide
34
Latest College Chart The Latest College chart shows the percentage graduated versus percentage enrolled versus percentage not graduated & not enrolled for each cohort listed on the y-axis on the left for the college that the student’s current major is in. The legend on the right indicates what each color represents on the chart: green for percentage graduated in that cohort, blue for percentage enrolled & not graduated in that cohort, and red for percentage not graduated & not enrolled in that cohort. For reference, the chart also provides markers at 80% and 50%.

Data Warehouse: Student Success Reports User Guide
35
Cohort Summary Table: Users can view Cohort Details for based on information of Parents Details provided by the student in each Cohort.
College at Entry Chart The College at Entry chart shows the percentage graduated versus percentage enrolled versus percentage not graduated & not enrolled for each cohort listed on the y-axis on the left for the college that the student’s initial major was in. The legend on the right indicates what each color represents on the chart: green for percentage graduated in that cohort, blue for percentage enrolled & not graduated in that cohort, and red for percentage not graduated & not enrolled in that cohort. For reference, the chart also provides markers at 80% and 50%.

Data Warehouse: Student Success Reports User Guide
36
Gender Table: Users can view Cohort Details for based on information of Parents Details provided by the student in each Cohort.
Field Description Cohort Description The catalog year for the cohort. Size The number of students in the cohort. Degree Count The number of students in the cohort who have been awarded a degree. % Graduated The percentage of students in the cohort who have graduated. Enrolled Count The number of students in the cohort who are enrolled in the current term. % Enrolled The percentage of students in the cohort who are enrolled in the current term. Not Graduated & Not Enrolled Count
The number of students in the cohort who have not graduated and are not enrolled in the current term.
% Not Graduated & Not Enrolled The percentage of students in the cohort who have not graduated and are not enrolled in the current term.
Field Description Cohort Description The catalog year for the cohort. GPA The gender of the students. Size The number of students in the cohort for the specified gender. Degree Count The number of students in the cohort for the specified gender who have been
awarded a degree. % Graduated The percentage of students in the cohort for the specified gender who have
graduated. Enrolled Count The number of students in the cohort for the specified gender who are enrolled in
the current term. % Enrolled The percentage of students in the cohort for the specified gender who are enrolled
in the current term. Not Graduated & Not Enrolled Count
The number of students in the cohort for the specified gender who have not graduated and are not enrolled in the current term.
% Not Graduated & Not Enrolled The percentage of students in the cohort for the specified gender who have not graduated and are not enrolled in the current term.

Data Warehouse: Student Success Reports User Guide
37
Ethnicity Table: Users can view Cohort Details for based on information of Parents Details provided by the student in each Cohort.
URM Table: Users can view Cohort Details for based on information of Parents Details provided by the student in each Cohort.
Field Description Cohort Description The catalog year for the cohort. ParentED The highest level of education completed by the student’s parent. Size The number of students in the cohort for the specified level of parent education. Degree Count The number of students in the cohort for the specified level of parent education
who have been awarded a degree. % Graduated The percentage of students in the cohort for the specified level of parent
education who have graduated. Enrolled Count The number of students in the cohort for the specified level of parent education
who are enrolled in the current term. % Enrolled The percentage of students in the cohort for the specified level of parent
education who are enrolled in the current term. Not Graduated & Not Enrolled Count
The number of students in the cohort for the specified level of parent education who have not graduated and are not enrolled in the current term.
% Not Graduated & Not Enrolled The percentage of students in the cohort for the specified level of parent education who have not graduated and are not enrolled in the current term.

Data Warehouse: Student Success Reports User Guide
38
Prior GPA Range Table: Users can view Cohort Details for based on information of Parents Details provided by the student in each Cohort.
Field Description Cohort Description The catalog year for the cohort. URM The URM category in the Cohort : Non-URM and URM Size The number of students in the cohort for the specified category of URM. Degree Count The number of students in the cohort for the specified category of URM who have
been awarded a degree. % Graduated The percentage of students in the cohort for specified category of URM who have
graduated. Enrolled Count The number of students in the cohort for the specified category of URM who are
enrolled in the current term. % Enrolled The percentage of students in the cohort for the specified category of URM who are
enrolled in the current term. Not Graduated & Not Enrolled Count
The number of students in the cohort for the specified category of URM who have not graduated and are not enrolled in the current term.
% Not Graduated & Not Enrolled
The percentage of students in the cohort for the specified category of URM who have not graduated and are not enrolled in the current term.
Field Description Cohort Description The catalog year for the cohort. Prior GPA Range The range of prior GPA in the cohort. Size The number of students in the cohort for the specified range of GPA. Degree Count The number of students in the cohort for the specified range of GPA who have
been awarded a degree. % Graduated The percentage of students in the cohort for the specified range of GPA who have
graduated. Enrolled Count The number of students in the cohort for the specified range of GPA who are
enrolled in the current term. % Enrolled The percentage of students in the cohort for the specified range of GPA who are
enrolled in the current term. Not Graduated & Not Enrolled Count
The number of students in the cohort for the specified range of GPA who have not graduated and are not enrolled in the current term.
% Not Graduated & Not Enrolled The percentage of students in the cohort for the specified range of GPA who have

Data Warehouse: Student Success Reports User Guide
39
Parent Education Table: Users can view Cohort Details for based on information of Parents Details provided by the student in each Cohort.
Latest College Users can view Cohort Details for different latest Colleges and the data associated with the specific college in specific Cohort.
not graduated and are not enrolled in the current term.
Field Description Cohort Description The catalog year for the cohort. ParentED The highest level of education completed by the student’s parent. Size The number of students in the cohort for the specified level of parent education. Degree Count The number of students in the cohort for the specified level of parent education
who have been awarded a degree. % Graduated The percentage of students in the cohort for the specified level of parent
education who have graduated. Enrolled Count The number of students in the cohort for the specified level of parent education
who are enrolled in the current term. % Enrolled The percentage of students in the cohort for the specified level of parent
education who are enrolled in the current term. Not Graduated & Not Enrolled Count
The number of students in the cohort for the specified level of parent education who have not graduated and are not enrolled in the current term.
% Not Graduated & Not Enrolled The percentage of students in the cohort for the specified level of parent education who have not graduated and are not enrolled in the current term.

Data Warehouse: Student Success Reports User Guide
40
College At Entry Users can view Cohort Details for different Colleges at entry and the data associated with the specific college in specific Cohort.
Field Description Cohort Description The catalog year for the cohort. College (latest) The name of the academic college that the student’s in SJSU. Size The number of students in the cohort for the specified academic college. Degree Count The number of students in the cohort for the specified college who have been
awarded a degree. % Graduated The percentage of students in the cohort for the specified college who have
graduated. Enrolled Count The number of students in the cohort for the specified college who are enrolled in
the current term. % Enrolled The percentage of students in the cohort for the specified college who are enrolled
in the current term. Not Graduated & Not Enrolled Count
The number of students in the cohort for the specified college who have not graduated and are not enrolled in the current term.
% Not Graduated & Not Enrolled The percentage of students in the cohort for the specified college who have not graduated and are not enrolled in the current term.
Field Description Cohort Description The catalog year for the cohort. College (entry) The code for the academic college that the student’s major is in SJSU. Size The number of students in the cohort for the specified academic college. Degree Count The number of students in the cohort for the specified college who have been
awarded a degree. % Graduated The percentage of students in the cohort for the specified college who have
graduated. Enrolled Count The number of students in the cohort for the specified college who are enrolled in
the current term. % Enrolled The percentage of students in the cohort for the specified college who are enrolled
in the current term. Not Graduated & Not Enrolled Count
The number of students in the cohort for the specified college who have not graduated and are not enrolled in the current term.
% Not Graduated & Not Enrolled The percentage of students in the cohort for the specified college who have not graduated and are not enrolled in the current term.

Data Warehouse: Student Success Reports User Guide
41
7.0 2 Dimensional Detail
The 2-Dimensional Detail report shows charts and tables with a comparison of cohorts from fall 2004 – present on values such as initial cohort size, degree count, % graduated, enrolled count, % enrolled & not graduated, not graduated & not enrolled count, and % not graduated & not enrolled. Users can choose to see this information for first-time full-time freshman cohorts or for new undergraduate transfer cohorts. Users can also specify two dimensions on which to view the data from among the following: cohort summary, gender, ethnicity, underrepresented status, prior institution type, parent education, college (latest), college (entry), EOP participation, and Freshman Programs participation.
Processing Steps Screenshots
Running the Report. Step 1:
On the Admissions dashboard, click on 2 Dimensional Detail. Step 2: The report will automatically run with your personal settings if you have set them up. If you have not set up your personal settings, the report will run for First-time, full-time freshmen. Fall 2011. Fall 2012, Fall 2013. Cohort Summary and Gender.

Data Warehouse: Student Success Reports User Guide
42
Step 3: To change the enrollment type, use the drop-down menu to make a selection.
Step 4: To change the Cohort type, use the drop-down menu to make a selection.
Step: 5 To change the Dimension types, use the Dimension 1 and Dimension 2 drop-down menu to make a selection.

Data Warehouse: Student Success Reports User Guide
43
Step 6: The updated report appears.
Reading the Chart The default setting for the charts (and tables below) is by Cohort Summary and Gender. Use the Dimension 1 and Dimension 2 drop-down menus to view the chart broken down by two of the following: Cohort Summary, Gender, Ethnicity, and many more.

Data Warehouse: Student Success Reports User Guide
44
Once you have made your selections, you will be viewing the chart on two dimensions. For example, the chart on the right shows all first-time, full-time freshmen from Fall 2009, Fall 2010, Fall 2011 with Dimension 1 as URM and Dimension 2 as Gender
Hover your mouse over the chart and a pop-up will appear giving you the specific value for that point on the chart.

Data Warehouse: Student Success Reports User Guide
45
2-Dimensional Table The sample below is an example of one pairing of dimensions; the data on your report will vary depending on which dimensions you select.
Users can click on a count to view information on the specific students who are a part of that count. For example, clicking on the number of students in the Not Graduated & Not Enrolled Count column for the American Indian Women row for Fall 2007 would bring up a list of all undergraduate students who identify as American Indian and as women who were new transfer students in Fall 2007 who have not graduated and are not currently enrolled in classes.
2-Dimensional Chart The 2-Dimensional chart shows the percentage graduated versus percentage enrolled versus percentage not graduated & not enrolled for each cohort listed on the y-axis on the left for the two dimensions that you selected. The legend on the right indicates what each color represents on the chart: green for percentage graduated in that cohort, blue for percentage enrolled & not graduated in that cohort, and red for percentage not graduated & not enrolled in that cohort. For reference, the chart also provides markers at 80% and 50%.

Data Warehouse: Student Success Reports User Guide
46
Field Description Cohort Description The catalog year for the cohort. Dimension 1 The first dimension you selected above; in this example the identified ethnicity for
the student. Dimension 2 The second dimension you selected above; in this example the identified ethnicity
for the student. Size The number of students in the cohort for the specified range of GPA. Degree Count The number of students in the cohort for the specified range of GPA who have
been awarded a degree. % Graduated The percentage of students in the cohort for the specified range of GPA who have
graduated. Enrolled Count The number of students in the cohort for the specified range of GPA who are
enrolled in the current term. % Enrolled The percentage of students in the cohort for the specified range of GPA who are
enrolled in the current term. Not Graduated & Not Enrolled Count
The number of students in the cohort for the specified range of GPA who have not graduated and are not enrolled in the current term.
% Not Graduated & Not Enrolled The percentage of students in the cohort for the specified range of GPA who have not graduated and are not enrolled in the current term.

Data Warehouse: Student Success Reports User Guide
47
8.0 Student Search
The Student Search report allows users to enter the student identification number (SJSUOne) of one or more students to view detail information on those students including name, cohort, initial enrollment type, last enrolled term, degree term (if graduated), email, phone number, cell phone number, major at entry, major (latest), gender, ethnicity, underrepresented status, parent education level, units earned, units attempted (current term), units attempted (future term) , cumulative GPA, degree candidate term, degree checkout consideration term & status, and EOP participation.
Processing Steps Screenshots
Running the Report. Step 1:
On the Admissions dashboard, click on Student Search tab.
Step 2: Type one or more student IDs (SJSUOne) into the form field. Then click Apply.
Step 3: The student’s or students’ information appears. Be sure to scroll all the way to the right to view all of the relevant information.

Data Warehouse: Student Success Reports User Guide
48
9.0 Graduation Rate
The Graduation Rate Report allows the user to check the Graduation rate of a specific Cohort .
Processing Steps Screenshots
Running the Report. Step 1:
On the Admissions dashboard, click on Graduation Rate tab.
Step 2: Select the Cohort from Cohort Description drop down. Enter the number of records you want to see in % graduated is in bottom. Click on Apply.
Step 3: The updated Graduation Rate by Cohort report appears here.
Step 4: The updated Majors with GPA band for the specified Cohort appear.