17. Gulf of Alaska Skates - National Oceanic and ... · PDF file17. Gulf of Alaska Skates by ....
52
17. Gulf of Alaska Skates by Olav Ormseth and Beth Matta NMFS Alaska Fisheries Science Center, Seattle WA Executive Summary Summary of Major Changes Changes in the input data: 1. Total catch weight for GOA skates is updated with 2006 and partial 2007 data. 2. Biomass estimates from the 2007 GOA bottom trawl survey are incorporated. 3. Life history information has been updated with recent research results. Changes in assessment methodology: There are no changes to the Tier 5 assessment methodology. Changes in assessment results: We do not recommend any directed fishing for skates in the GOA, due to high incidental catch in groundfish and halibut fisheries and the lack of accurate information regarding the composition of the skate catch. Total skate biomass in the GOA decreased between the 2005 and 2007 NMFS GOA trawl surveys, altering the Tier 5 assessment results. The recommendations for 2008 and 2009 for skates based on the three most recent survey biomass estimates and M=0.10 are: Area Big Skate Longnose Skate M 0.1 0.1 Avg Biomass Western 8,422 1,043 Central 27,536 27,209 Eastern 8,434 10,239 ABC Western 632 78 Central 2,065 2,041 Eastern 633 768 Gulfwide 3,329 2,887 OFL Western 842 104 Central 2,754 2,721 Eastern 843 1,024 Gulfwide 4,439 3,849 Other Skates M 0.1 Avg Biomass Gulfwide 28,057 ABC Gulfwide 2,104 OFL Gulfwide 2,806
Transcript of 17. Gulf of Alaska Skates - National Oceanic and ... · PDF file17. Gulf of Alaska Skates by ....
17. Gulf of Alaska Skates
by Olav Ormseth and Beth Matta
NMFS Alaska Fisheries Science Center, Seattle WA
Executive Summary
Summary of Major Changes
Changes in the input data: 1. Total catch weight for GOA skates is updated with 2006 and partial 2007 data. 2. Biomass estimates from the 2007 GOA bottom trawl survey are incorporated. 3. Life history information has been updated with recent research results.
Changes in assessment methodology: There are no changes to the Tier 5 assessment methodology.
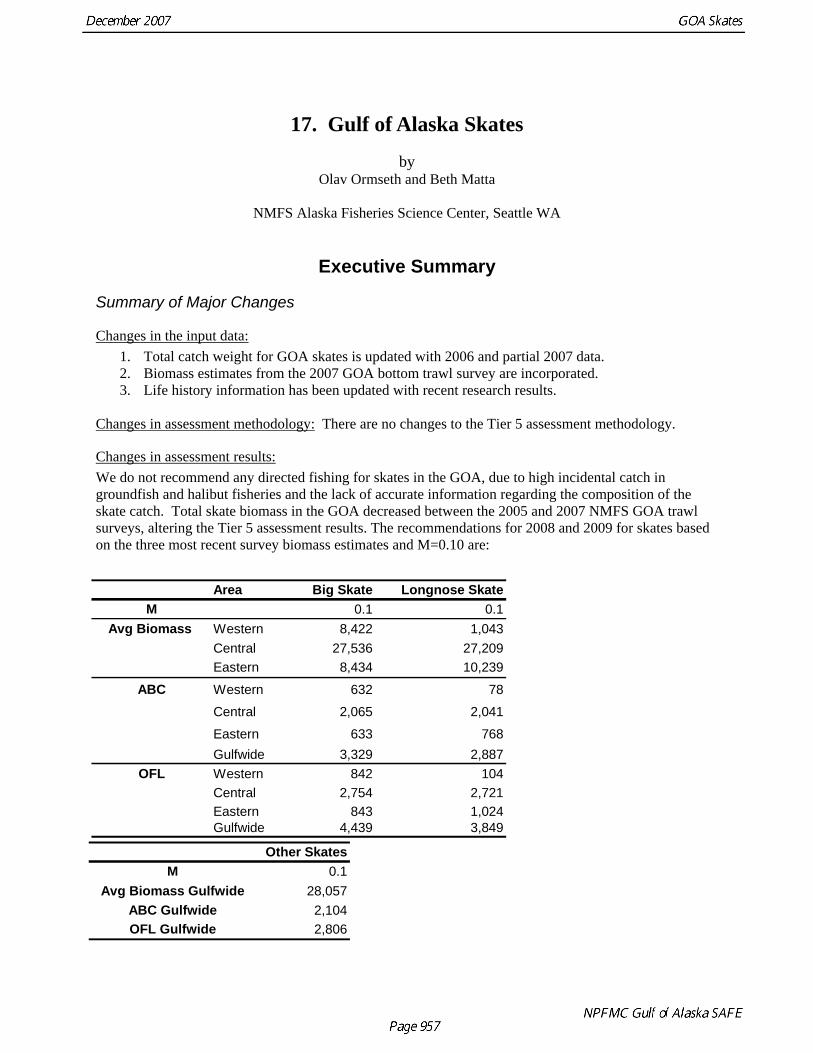
Changes in assessment results: We do not recommend any directed fishing for skates in the GOA, due to high incidental catch in groundfish and halibut fisheries and the lack of accurate information regarding the composition of the skate catch. Total skate biomass in the GOA decreased between the 2005 and 2007 NMFS GOA trawl surveys, altering the Tier 5 assessment results. The recommendations for 2008 and 2009 for skates based on the three most recent survey biomass estimates and M=0.10 are:
Area Big Skate Longnose SkateM 0.1 0.1
Avg Biomass Western 8,422 1,043Central 27,536 27,209Eastern 8,434 10,239
ABC Western 632 78
Central 2,065 2,041
Eastern 633 768Gulfwide 3,329 2,887
OFL Western 842 104Central 2,754 2,721Eastern 843 1,024Gulfwide 4,439 3,849
Other SkatesM 0.1
Avg Biomass Gulfwide 28,057ABC Gulfwide 2,104OFL Gulfwide 2,806
Responses to SSC Comments
SSC comments specific to the GOA Skates assessment: From the December 2005 SSC minutes: 1) The SSC requests clarification on Figure 16-16 as to how the overall mortality rate of 0.2 was determined. Response: The caption has been updated to clarify the methods used to determine overall mortality rate. 2) Also, figure captions in this chapter should indicate data sources. For instance, the SSC was uncertain whether figures on diet represented estimates from NMFS summer food habits samples or outputs from ECOPATH models. Response: Figure captions have been updated to supply the requested information.
SSC comments on assessments in general: There were no general comments in the 2005 or 2006 minutes applicable to GOA skates.
Introduction
Description, scientific names, and general distribution Skates (family Rajidae) are cartilaginous fishes which are related to sharks. They are dorsoventrally depressed animals with large pectoral “wings” attached to the sides of the head, and long, narrow whiplike tails (Figure 17-1). At least 15 species of skates in three genera (Raja, Bathyraja, and Amblyraja) are found in Alaskan waters and are common from shallow inshore waters to very deep benthic habitats (Eschmeyer et al., 1983; Stevenson et al. 2007). In general, Raja species are most common and diverse in lower latitudes and shallower waters from the Gulf of Alaska to the Baja peninsula, while Bathyraja species are most common and diverse in the higher latitude habitats of the Bering Sea and Aleutian Islands, as well as in the deeper waters off the U.S. west coast. Table 17-1 lists the species found in Alaska, with their depth distributions and selected life history characteristics (which are outlined in more detail below). In the Gulf of Alaska (GOA), the most common skate species are two Raja species, the big skate R.. binoculata and the longnose skate R.. rhina, and three Bathyraja species, the Aleutian skate, B. aleutica, the Bering skate B. interrupta, and the Alaska skate B. parmifera. The general range of the big skate extends from the Bering Sea to southern Baja California in depths ranging from 2 to 800 m. The longnose skate has a similar range, from the southeastern Bering Sea to Baja California in 9 to 1069 m depths (Love et al 2005). While these two species have wide depth ranges, they are generally found in shallow waters in the Gulf of Alaska. One deep-dwelling Amblyraja species, the roughshoulder skate A. badia, ranges throughout the north Pacific from Japan to Central America at depths between 846 and 2322 m; the four other species in the genus Raja are not found in Alaskan waters (Love et al 2005; Stevenson et al. 2007). Within the genus Bathyraja, only two of the 13+ north Pacific species are not found in Alaska. Of the remaining 11+ species, only three are commonly found in the Gulf of Alaska. The Aleutian skate ranges throughout the north Pacific from northern Japan to northern California, and has been found in waters 16 to 1602 m deep. The Alaska skate is restricted to higher latitudes from the Sea of Okhotsk to the eastern Gulf of Alaska in depths from 17-392 m (Stevenson et al. 2007). The range of the Bering skate is difficult to determine at this time as it may actually be a complex of species, with each individual species occupying a different part of its general range from the western Bering Sea to southern California (Love et al 2005; Stevenson et al. 2007). The species within this assemblage occupy different habitats and regions within the GOA groundfish Fishery Management Plan (FMP) area. In this assessment, we distinguish habitat primarily by depth for GOA skates. The highest biomass of skates is found in the shallowest continental shelf waters of less than 100 m depth, and is dominated by the big skate, Raja binoculata (Figure 17-2). In continental shelf waters from 100-200 m depth, longnose skates (R. rhina) dominate skate biomass, and Bathyraja skate species are dominant in the deeper waters extending from 200 to 1000 m or more in depth. The Aleutian skate, B. aleutica, is the biomass dominant species within the GOA Bathyraja complex, followed by the Bering skate (B. interrupta) and then by the Alaska skate (B. parmifera) (Table 17-2).
Management units Since the beginning of domestic fishing in the late 1980s up through 2003, all species of skates in the Gulf of Alaska were managed under the “Other species” FMP category. Catch within this category has historically been limited by a Total Allowable Catch (TAC) for all Other species calculated as 5% of the sum of the TACs for GOA target species (Table 17-3). The Other species category was established to monitor and protect species groups that are not currently economically important in North Pacific groundfish fisheries, but which were perceived to be ecologically important and of potential economic importance as well. Although the composition of this category has varied over the course of FMP
management, the configuration of sharks, skates, sculpins, squid, and octopus was relatively stable until 2004, when GOA skates were removed from the category for separate management in response to a developing fishery (see below). There were efforts to manage skates separately prior to the development of the skate target fishery in 2003. In 1999, FMP Amendments 63/63 were initiated to remove the shark and skate species groups from the Other species category in both the BSAI and GOA to better protect these vulnerable, long-lived species (NPFMC 1999). Based on the 1999 stock assessments for Other species, the Plan Teams recommended that all Other species be considered in an expanded FMP amendment to establish TACs at the species group level. While this amendment was being revised, the Council recommended to NMFS that Other species be placed on “bycatch only” status to prevent a directed fishery from developing in the interim. NMFS determined that it did not have regulatory authority for such an action, so aggregate other species TACs remained in place up through 2003 in the GOA despite efforts to limit directed fisheries and develop more protective management within this category. FMP amendments to re-define the ABC, OFL and TAC setting process for skate species in the GOA were completed in 2003 as a result of a developing target fishery for two skate species (see below). The remaining species in the GOA Other species category continue to be managed under an aggregate TAC set at 5% of the sum of all target species TACs. The NPFMC has appointed a committee to address management of nontarget species and species complexes. Skate management units have continued to evolve in 2004 and 2005 based on stock assessment and Plan Team input. In 2004, the skate species which were the targets of the 2003 fishery, big and longnose skates, were managed together under a single TAC in the Central GOA where the fishery had been concentrated in 2003. The remaining skates were managed as an “Other skates” species complex in the Central GOA, and all skates including big and longnose skates were managed as an “Other skates” species complex in the Western and Eastern GOA in 2004. As identification of species in the fisheries improved, skate management became more specific. In 2005, big skates were managed as a single species group throughout the GOA, as were longnose skates. Furthermore, to address concerns about disproportionate harvest of skates, big skate and longnose skate TACs were managed separately for the Western, Central, and Eastern GOA. The remaining skates (in the genus Bathyraja) were managed as a gulfwide species complex in 2005 because they were not the targets of the fishery and they are more difficult to identify. The remaining nontarget skates in the GOA are managed as “Other skates,” but we also use the term “Bathyraja skates” interchangeably in this assessment. Since 2005, directed fishing has been prohibited for all skate species in the GOA.
Life history and stock structure (skates in general) Skate life cycles are similar to sharks, with relatively low fecundity, slow growth to large body sizes, and dependence of population stability on high survival rates of a few well developed offspring (Moyle and Cech 1996). Sharks and skates in general have been classified as “equilibrium” life history strategists, with very low intrinsic rates of population increase implying that sustainable harvest is possible only at very low to moderate fishing mortality rates (King and McFarlane, 2003). Within this general equilibrium life history strategy, there can still be considerable variability between skate species in terms of life history parameters (Walker and Hislop, 1998). While smaller sized species have been observed to be somewhat more productive, large skate species with late maturation (11+ years) are most vulnerable to heavy fishing pressure (Walker and Hislop, 1998; Frisk et al 2001; Frisk et al 2002). The most extreme cases of overexploitation have been reported in the North Atlantic, where the now ironically named common skate Dipturus batis has been extirpated from the Irish Sea (Brander, 1981) and much of the North Sea (Walker and Hislop, 1998) and the barndoor skate Raja laevis has disappeared from much of its range off New England (Casey and Myers, 1998). The mixture of life history traits between smaller and larger skate species has led to apparent population stability for the aggregated “skate” group in many areas where fisheries occur, and this combined with the common practice of managing skate species
within aggregate complexes has masked the decline of individual skate species in European fisheries (Dulvy et al, 2000). Similarly, in the Atlantic off New England, declines in barndoor skate abundance were concurrent with an increase in the biomass of skates as a group (Sosebee, 1998). Several recent studies have explored the effects of fishing on a variety of skate species in order to determine which life history traits might indicate the most effective management measures for each species. While full age structured modeling is difficult for many of these relatively information poor species, Leslie matrix models parameterized with information on fecundity, age/size at maturity, and longevity have been applied to identify the life stages most important to population stability. Major life stages include the egg stage, the juvenile stage, and the adult stage (summarized here based on Frisk et al 2002). All skate species are oviparous (egg-laying), investing considerably more energy per large, well protected embryo than commercially exploited groundfish. The large, leathery egg cases incubate for extended periods (months to a year) in benthic habitats, exposed to some level of predation and physical damage, until the fully formed juveniles hatch. The juvenile stage lasts from hatching through maturity, several years to over a decade depending on the species. The reproductive adult stage may last several more years to decades depending on the species. Age and size at maturity and adult size/longevity appear to be more important predictors of resilience to fishing pressure than fecundity or egg survival in the skate populations studied to date. Frisk et al (2002) estimated that although annual fecundity per female may be on the order of less than 50 eggs per year (extremely low compared with teleost groundfish), there is relatively high survival of eggs due to the high parental investment, and therefore egg survival did not appear to be the most important life history stage contributing to population stability under fishing pressure. Juvenile survival appears to be most important to population stability for most North Sea species studied (Walker and Hilsop, 1998), and for the small and intermediate sized skates from New England (Frisk et al 2002). For the large and long lived barndoor skates, adult survival was the most important contributor to population stability (Frisk et al 2002). In all cases, skate species with the largest adult body sizes (and the empirically related large size/age at maturity, Frisk et al 2001) were least resilient to high fishing mortality rates. This is most often attributed to the long juvenile stage during which relatively large yet immature skates are exposed to fishing mortality, and also explains the mechanism for the shift in species composition to smaller skate species in heavily fished areas. Comparisons of length frequencies for surveyed North Sea skates from the mid and late 1900s led Walker and Hilsop (1998, p. 399) to the conclusion that “all the breeding females, and a large majority of the juveniles, of Dipturus batis, R. fullonica and R. clavata have disappeared, whilst the other species have lost only the very largest individuals.” Although juvenile and adult survival may have different importance by skate species, all studies found that one metric, adult size, reflected overall sensitivity to fishing. After modeling several New England skate populations, Frisk et al (2002, p. 582) found “a significant negative, nonlinear association between species total allowable mortality, and species maximum size.” To summarize, there are clear implications for sustainable management of skates even though their populations and life histories have not been studied in as much detail as other exploited marine species. After an extensive review of population information for many elasmobranch species, Frisk et al (2001, p. 980) recommended that precautionary management be implemented especially for the conservation of large species:
“(i) size based fishery limits should be implemented for species with either a large size at maturation or late maturation, (ii) large species (>100 cm) should be monitored with increased interest and conservative fishing limits implemented, (iii) adult stocks should be maintained, as has been recommended for other equilibrium strategists (Winemiller and Rose 1992).”
Life history and stock structure (Alaska-specific) Information on fecundity in North Pacific skate species is extremely limited. There are one to seven embryos per egg case in locally occurring Raja species (Eschmeyer et al. 1983), but little is known about frequency of breeding or egg deposition for any of the local species. Similarly, information related to breeding or spawning habitat, egg survival, hatching success, or other early life history characteristics is extremely sparse for Gulf of Alaska skates (although current research is addressing these issues for Alaska skates in the Eastern Bering sea; J. Hoff ,AFSC, pers. comm.; see also the 2007 BSAI skate SAFE, Ormseth and Matta 2007). Slightly more is known about juvenile and adult life stages for Gulf of Alaska skates. In terms of maximum adult size, the Raja species are larger than the Bathyraja species found in the area. The big skate, Raja binoculata, is the largest skate in the Gulf of Alaska, with maximum sizes observed over 200 cm in the directed fishery in 2003 (see the “Fishery” and “Survey” sections below, for details). Observed sizes for the longnose skate, Raja rhina, are somewhat smaller at about 165-170 cm. Therefore, the Gulf of Alaska Raja species are in the same size range as the large Atlantic species, i.e., the common skate Dipturus batis and the barndoor skate Dipturus laevis, which historically had estimated maximum sizes of 237 cm and 180 cm, respectively (Walker and Hislop 1998, Frisk et al 2002). The maximum observed lengths for Bathyraja species from bottom trawl surveys of the GOA range from 86-154 cm (Table 17-4). Known life history parameters of Alaskan skate species are presented in Table 17-1. Zeiner and Wolf (1993) determined age at maturity and maximum age for big skates (Raja binoculata) and longnose skates (R. rhina) from Monterey Bay, CA. The maximum age of CA big skates was 11-12 years, with maturity occurring at 8-11 years; estimates of maximum age for CA longnose skates were 12-13 years, with maturity occurring at 6-9 years. McFarlane and King (2006) recently completed a study of age, growth, and maturation of big and longnose skates in the waters off British Columbia (BC), finding maximum ages of 26 years for both species, much older than the estimates of Zeiner and Wolf. Age at 50% maturity occurs at 6-8 years in BC big skates, and at 7-10 years in BC longnose skates. However, these parameter values may not apply to Alaskan stocks. The AFSC Age and Growth Program has recently reported a maximum observed age of 25 years for the longnose skate in the GOA, significantly higher than that found by Zeiner and Wolf but close to that observed by McFarlane and King (Gburski et al. 2007). In the same study, the maximum observed age for GOA big skates was 15 years, closer to Zeiner and Wolf’s results for California big skates.
Fishery
Directed fishery, bycatch, and discards 2003-present Until 2003, skates were primarily caught as bycatch in both longline and trawl fisheries directed at Pacific halibut and other groundfish. (In this assessment, “bycatch” means incidental or unintentional catch regardless of the disposition of catch—it can be either retained or discarded.) There had been interest expressed in developing markets for skates in the Gulf of Alaska (J. Bang and S. Bolton, Alaska Fishworks Inc., 11 March 2002 personal communication), and the resource became economically valuable in 2003 when the ex-vessel price became equivalent to that of Pacific cod. In 2003, vessels began retaining and delivering skates as a target species in federal waters partly because the market for skates had improved, and partly because catch of Pacific cod could be retained as bycatch in a skate (Other species) target fishery, even though directed fishing for cod was seasonally closed. The result was a dramatic increase in skate landings (Figure 17-3). The directed skate fishery developed in the GOA in 2003 in a manner which presented significant assessment problems, many of which continue through the present. A large proportion of the directed fishing is prosecuted on vessels less than 60 ft in length, so there is no at sea observer coverage of the
fleet, and no logbook requirements. These vessels deliver skates to plants that process monthly volumes of catch that are also too low to require observer coverage. Therefore, this multispecies fishery developed (and largely continues) without the appropriate monitoring established for federal groundfish management in Alaska. In the rest of this section, we use available information to estimate both total skate catch and catch by species in the GOA for 2003 through 2007, and comment on catch estimation. Catch estimates for skates in the GOA in 2003 are somewhat uncertain given the difficulties with the reporting system, which was not designed to report skates separately from the Other species complex at that time. In addition, the reporting system changed from the “Blend” system used from 1991 to 2002 to a new Catch Accounting System (CAS) in 2003. While this change represents a significant improvement in catch reporting overall, the transfer rendered the methods of nontarget species catch estimation used to estimate skate catch between 1997 and 2002 (see below) obsolete. Three sources were used to estimate skate catch in 2003: the ADF&G fish ticket database, NMFS groundfish observer data, and IPHC survey and fishery data. In a previous assessment (Gaichas et al 2003), we used the difference between the average catch reported on ADF&G fish tickets by area 1997-2002 and the catch reported for 2003, to approximate the catch in the new target skate fishery. This method suggested that a total of 2,629 t of skates were taken in the directed fishery, with 2,498 t (95%) coming from the Central GOA. We also attempted to distinguish 2003 directed skate catch from skate catch landed as bycatch by using information on Maximum Retainable Allowances (MRAs) contained in fish tickets. We assumed that those fish tickets where skates were over the MRA of 20% could be considered the directed skate fishery, whereas those listed in the Pacific cod target with retention of skates at 20% or less of cod catch could be considered landed bycatch of skates. Gulfwide target fishery skate catch estimated by this method was 2,743 t, very similar to that estimated by the alternative method above. These estimates of catch from the ADF&G fish ticket database likely underestimate total catch as this method probably underestimates at-sea discards. The distinction between skate species was not recorded on fish tickets, especially because there were not species codes for one of the major species landed in the fishery (big skates) until 2005. However, there was some evidence for preferential retention of Raja species and at sea discard of Bathyraja species if they could be distinguished (Rob Swanson, July 2003 skipper and crew interviews dockside in Kodiak). Species composition of landed skate catch comes from dockside sampling by ADF&G and NMFS staff in Kodiak. The early fishery in February and March was sampled by ADF&G port samplers. Based on this sampling, the directed skate fishery was landing approximately 79% big skates (of which 78% were female), and 21% longnose skates (which were 52% female). Sampling later in the year by NMFS staff in Kodiak resulted in similar, if not more extreme species and sex compositions. Sampling indicated that 95% of hook and line landings and 92% of trawl landings were big skates (of which 80% and 90% were female, respectively). Longnose skates composed 4 and 6% of hook and line and trawl landings, respectively, and landings for this species were 53% and 35% female by gear type. It seems clear from these samples that the directed skate fishery seeks large individuals, which are predominantly female big skates. Size sampling of the delivered hook and line catches in conjunction with two at sea observer samples of trawl skate catch appears to corroborate this conclusion (see Figure 17-14). Applying the species compositions estimated from dockside sampling to an approximate estimate of 2,700 t total skate catch in the 2003 directed fishery (see above), directed catch of big skates in 2003 would be between 2,160 t (80%) and 2,430 t (90% of catch), catch of longnose skates would be between 135 and 340 t, and Bathyraja species catch would be the remainder, up to 135 tons. The Catch Accounting System estimated that an additional 1,325 t of skates were caught incidentally in 2003 groundfish fisheries, for a total skate catch estimate of 4,025 t (Table 17-3). Skate catch in the target fishery dropped off considerably in 2004 and 2005 (Figures 17-4 and 17-5, Table 17-3), reportedly due to changed market conditions (lower ex-vessel prices); however at least one participant in the 2003 fishery also reported a substantial drop in CPUE when attempting to target skates

in 2004 (T. Pearson, NMFS AKRO, pers comm.). It is still difficult to estimate what proportion of skate catch was taken in target fisheries versus as bycatch, but some distinction by species is now possible because species codes for big and longnose skates were created. In 2004, catch of 1,527 t of combined big and longnose skates for the Central GOA were reported in the catch accounting system. The remaining skate species from the CGOA plus all skate species in the rest of the GOA amounted to 1,399 t, for a total skate catch of 2,926 t. Port sampling was extremely limited in 2004 due to lack of funding, so only 134 skates were identified and measured during that year. Based on this small sample, we estimate that 87% by weight of the Central GOA big and longnose catch was big skates, and the remaining 13% was longnose skates. Therefore, the catch in the Central GOA was estimated to be 1,323 t big skate and 204 t longnose skate. Because port sampling was only conducted in the CGOA (Kodiak), we cannot determine the species composition of the remaining 1,399 t of skates caught in the GOA in 2004 unless we assume it reflects historical patterns of bycatch (see below). In 2005, separate species codes and reporting for big and longnose skates were implemented Gulfwide to support the area specific TACs for the Western, Central, and Eastern GOA (Table 17-3). The 2005 catches reported in the CAS total to 845 t big skates, 1,093 t longnose skates, and 657 t other skates Gulfwide (area breakdowns are reported in Table 17-3). However, the 2005 species composition from port sampled skate catch in the Kodiak area indicated a predominance of big skates in the catch not reflected in the official catch estimates for the CGOA. Port sampling was conducted for three months in 2005, triple the effort funded in 2004, so that a total of 832 skates were identified to species and measured for length. Port sampled skate landings were 65% big skates by weight, 31% longnose, and 5% all other skates combined. The reason for the discrepancy between the species composition from port sampling and that from the CAS which suggests 33% big skates, 42% longnose skates, and 25% other skates Gulfwide appears to be the erroneous use of species codes for reporting catch on fish tickets. For the 19 sampled landings where both port sampled species compositions and fish ticket information were available, 15 of 19 fish tickets reported all retained skates as longnose skates (despite the fact that the majority of these catches were of big skates), and all discarded skates as unidentified skates. The remaining 4 fish tickets that did report retained catch of big and longnose skates accurately always reported discarded catch as unidentified skates, regardless of the composition of discarded skates. Given that the species code for big skates, 702, is a new species code for 2005 and the code for longnose skates, 701, was the only code to identify skates in the past (aside from 700 for unidentified skates), this mistaken reporting is not surprising. However, it is important that catch and discard be reported accurately by species for proper inseason management and assessment of skates. There is no way to validate the skate species reported on fish tickets without continued port sampling. For the 2007 GOA skate assessment we report skate catch directly from the CAS database at the NMFS Alaska Regional Office, and do not include data from port sampling in 2006 or 2007. This is mainly due to a change in the authorship of the SAFE document and the transfer of responsibility to a new stock assessment scientist. We plan to revisit the problems discussed above in 2008.
Bycatch and discards of skates in groundfish fisheries, 1997-2002 Until 2003, skates were primarily caught as bycatch in both longline and trawl fisheries directed at Pacific halibut and other groundfish. Separate catch records for skates were not kept; the only official catch records prior to 2004 are for the Other species complex in the GOA. In this section, we outline several methods for estimating historical skate catch prior to the development of the skate fishery in 2003. Incidental catch of skates (all species in aggregate) in federal groundfish fisheries between 1997-2002 (Table 17-5) was estimated as follows (this is the same method which has been used to estimate catch of all nontarget species in both the GOA and the BSAI). Because annual nontarget species catches are either reported in aggregate in the official Blend catch database or are not reported at all, catches by species group or individual species must be estimated using data reported by fishery observers. Catches for all
non-target species were estimated at the lowest practical taxonomic level for the recent domestic fishery, 1997 – 2002, by simulating the Regional Office's blend catch estimation system as follows. Target fisheries were assigned to each vessel / gear / management area / week combination based upon retained catch of allocated species, according to the same algorithm used by the Regional Office. Observed catches of other species (as well as forage and non-specified species) were then summed for each year by target fishery, gear type, and management area. The ratio of observed other species group catch to observed target species catch was multiplied by the blend-estimated target species catch within that area, gear, and target fishery. Estimation of individual species catches within the other species complex depends on the level of identification of those species in the catch. Skates were almost always recorded as "skate unidentified", with very few exceptions between 1990 and 2002. At that time, Observers were instructed to devote resources to higher-priority target species and prohibited species data collection. However, the Observer Program initiated a skate species identification special project in 2003 (Stevenson 2004). Based on the success of this project, all observers have been instructed to identify skates to species since 2004. This represents a major improvement to data available for stock assessment. The accuracy of catch estimates for groups or species within the other species complex also depends on the level of observer coverage in a given fishery (no observers, no catch estimates). Observer coverage requirements are based upon vessel size, such that vessels greater than 125 ft in length carry an observer on all fishing days, vessels 60-125 ft in length carry an observer for 30% of fishing days, and vessels under 60 ft in length are not required to carry observers. In general, larger vessels fish in the Bering Sea, so observer coverage levels in some Bering Sea fisheries approach 100%. Our calculations for 1997-2001 suggest that the BSAI region has approximately 70-80% observer coverage overall. Due to the size distribution of vessels fishing in the Gulf of Alaska, approximately 20-25% of groundfish fishery operations (not including Pacific halibut) are observed. Some GOA target fisheries (i.e. rockfish) are prosecuted on larger vessels with 100% observer coverage. Therefore, in making these catch estimates, we are assuming that other species catch in general and skate catch aboard observed vessels is representative of other species catch aboard unobserved vessels throughout Alaska. Because observer assignment to vessels in the 30% coverage class is nonrandom, there is a possibility that this assumption is incorrect.
Spatial estimation of species specific skate bycatch and discards in groundfish fisheries, 1997-2002 The observed catch and landings of skates have shown consistent spatial patterns between 1997 and 2002, suggesting that skates are associated with certain areas and or habitats in the GOA and may be found there predictably, especially since there was little to no targeting of skates in those years. The overall implication of skate bycatch maps shown in the 2003 assessment (Gaichas et al. 2003) is that skate catch has occurred consistently in “hotspots.” This suggests that the species distributions may be constant over time and space and that survey distributions might be useful to predict fishery catch by species. This also implies that catch is concentrated in space, so the potential for localized depletion is high. While the degree of mixing among these areas is unknown, it seems prudent to have management measures that sustain these concentrations until more is known about stock structure. Although there are no direct estimates of skate bycatch by species in any fisheries 1997-2002, aggregated skate catch can be proportioned to species by fishery using spatial information combined with survey estimates, as follows (a full discussion of survey information is found below, under “Resource surveys”). Observed hauls with skate catch were assigned to GOA trawl survey strata according to the latitude and longitude of trawl haul or fixed gear set retrieval. Then, all catch that was identified as “skate unidentified” was proportioned to species using the average (1999-2003 surveys) skate species proportions for that survey strata. These survey years were selected because we are most confident in skate species identification for surveys conducted since 1999, and because survey distributions up to 2003
presumably did not reflect any targeting of skates by the fishery. Skate species composition estimates for survey strata in the Western and Central GOA down to 500 m depth were based on three surveys (1999, 2001, and 2003), while the Eastern GOA and strata deeper than 500 m were based only on the 1999 and 2003 surveys. The total skate catch estimates reported by gear and area in Table 17-5 were apportioned to species by the skate species composition estimated for the observed skate catch by survey strata. This method assumes that skate species composition by survey strata has remained constant over the late 1990s, that summer survey distributions are representative of skate species distributions throughout the year, and that observed skate catch is representative of unobserved skate catch by gear type and area. The resulting catch estimates by skate species should be considered rough approximations subject to numerous assumptions, but nevertheless are the best available information on skate catch by species (Table 17-6). This estimation method suggests that approximately 44% of historical GOA skate bycatch on average has been longnose skates, about 26% has been big skates, and the remaining 30% has been Bathyraja species.
Bycatch and discards of skates in halibut fisheries, 1997-2007 In 2003, the NPFMC requested that this assessment account for skate bycatch in directed Pacific halibut fisheries. There is no observation of these fisheries at sea, so the IPHC provided estimates of skate bycatch in the fisheries based on skate bycatch observed during IPHC longline surveys for halibut (Table 17-7). Figure 17-6 shows how IPHC areas correspond to NPFMC management areas. In general, it appears that directed fisheries for Pacific halibut have the potential to take a substantial amount of skates annually as bycatch, on the order of 5,000 metric tons or more per year in the GOA. However, it is likely that the bycatch of skates is lower in the commercial fishery than in the survey. Steps should be taken to quantify this potential bycatch to species, as it is more than double the magnitude of groundfish skate bycatch (shown in Table 17-5). The species composition of skate bycatch in halibut fisheries is also unknown, but if it is similar to survey species compositions it can be estimated similarly to total skate bycatch. In 2004, IPHC surveys used the same skate identification key used in NMFS groundfish surveys, so species composition was estimated from the 2004 survey and extrapolated to the 2004 skate bycatch estimates (Table 17-8).
Fishery summary Skates are caught incidentally by groundfish and halibut fisheries in the GOA, and since 2003 increased market prices for skates have both triggered a directed fishery for skates and have increased retention and deliveries of incidentally caught skates. Although directed fishing for skates remains closed, there is continued interest in developing a GOA skate fishery. While all of the catch estimates were derived from different sources and have some uncertainties associated with them, they represent the best available information on skate removals by fisheries in the Gulf of Alaska. Combining information sources (Table 17-9) suggests that skate catch in the Gulf of Alaska from all sources ranges from 6,000 to 10,000 or more tons annually, and perhaps has increased in recent years. Limited species composition sampling information suggests that historical incidental catch in both groundfish and halibut fisheries has been dominated by longnose skates, and port sampling indicates that the proportion of big skates in the catch has increased since the target fishery began in 2003.
Survey Data
Survey biomass in aggregate and by species There are several potential indices of skate abundance in the Gulf of Alaska, including longline and trawl surveys. Unfortunately, the sablefish longline survey conducted by the NMFS Auke Bay lab does not identify skates to species at present and is therefore of limited use for stock assessment. Although many skates are identified to species on IPHC longline surveys, sampling of non-halibut species during these surveys is restricted in scope and is nonrandom, so this survey is also of limited use for skate stock
assessment. For this assessment, we use the NMFS summer bottom trawl surveys 1984-2007 as our primary source of information on the biomass and distribution of the major skate species. Bottom trawl surveys are generally considered reliable estimators of skate biomass for trawlable areas and a recent study in the EBS suggests that catchability is relatively high (Kotwicki and Weinberg 2005). Survey trends by species between 1984 and 2007 are displayed in Figure 17-7 for the entire GOA. A breakdown of biomass estimates for the Eastern (management areas 640-650), Central (620-630) and Western (610) GOA for 1984-2005 are given in Table 17-10. Note that not all surveys covered the same areas and depths; the 1990, 1993, and 1996 surveys covered depths to 500 m, the 1984, 1987, 1999 and 2005 surveys covered depths to 1000 m, and the 2003 survey covered to 700 m. Due to limited resources, the 2001 survey did not extend to the Eastern GOA and went only to 500 m in the Central and Western GOA. Therefore the observed trends in skate species biomass may reflect a combination of actual population dynamics and survey coverage. It is possible that what appears to be an increase in skate biomass overall between the early and late 1990s is simply the result of sampling more (deeper) skate habitat in the late 90s combined with differences in survey strategy between the cooperative surveys conducted during the 1980s and the NMFS surveys of the 1990s. Similarly, species identification of skates was problematic in early survey years (reflected in the relatively higher proportion of biomass in the “skate unidentified” category) and became most reliable for surveys starting in 1999. Despite inconsistencies in survey coverage and species identification, it is clear that big skates Raja binoculata and longnose skates R. rhina dominate the skate biomass in the GOA. Bathyraja species compose about a third of total GOA skate biomass, with the majority of these being the Aleutian skate B. aleutica, followed by the Bering skate B. interrupta, and then by the Alaska skate B. parmifera (Figure 17-8). This contrasts greatly with the situation in the Eastern Bering Sea, where B. parmifera dominates skate biomass by more than an order of magnitude over any other skate species, see the BSAI Other species SAFE. Skate species composition also differs by area, as has been found in the North Sea (Walker and Hislop 1998). Figure 17-8 compares the Gulfwide skate biomass by species with species compositions specific to the Western, Central, and Eastern GOA from the 2007 GOA bottom trawl survey. We note that the center of abundance for big and longnose skates is in the Central GOA, with lower biomass estimated for the Eastern and Western GOA (Table 17-10). Bathyraja species abundance is also highest in the central GOA. The Central GOA is not only the center of skate abundance, but also diversity according to the 2005 survey. However, we note that the species compostion shifted in all areas between 2003 and 2005, with more dominance of longnose skates in each area, and proportionally lower big skates throughout the GOA (Figure 17-9 compared with 17-10). Figure 17-11 illustrates survey size compositions for big skates Raja binoculata from GOA bottom trawl surveys 1999-2005. It is apparent that female big skates attain much larger sizes (190-200 cm) than males of the same species (150-160 cm). Figure 17-12 compares the big skate length frequency from the 2003 summer trawl survey with some limited data collected during the same time period from skate fisheries. It is apparent that both longline catches and trawl catches of big skate were disproportionately of large animals, and were dominated by large females as data presented above for the target fishery suggested. This pattern remained in fishery length samples from 2004 and 2005 (Figure 17-13), although trawl fishery catch in 2005 appears to have captured smaller skates. This could reflect either retention and delivery of incidentally caught skates, or less availability of larger skates to the fishery, or both.
Analytic Approach, Model Evaluation, and Results At present, the available data do not support population modeling for skates in the GOA, so none of these stock assessment sections are relevant, except for one:
Parameters Estimated Independently: M Because the only life history information currently available for Gulf of Alaska skate relates to maximum size, we use two methods to infer the parameters important to management which are age/size at maturity and natural mortality. In particular, M is used as an approximation of the fishing mortality rate believed to produce the maximum sustainable yield in equilibrium populations experiencing logistic population growth under NPFMC’s Tier 5 stock assessment approach. First, we use Frisk et al’s (2001) empirical method to estimate length at maturity from maximum length for all skate species where data are available (Table 17-4). Second, we assumed that the largest skate species in the GOA would share the general characteristics found for other large elasmobranchs worldwide and some of the specific characteristics of the large Atlantic species, Dipturus batis and D. laevis. Frisk et al (2002) derived an estimate of natural mortality of 0.09 using Hoenig’s (1983) method for barndoor skates which was based on the longevity of common skates of approximately 50 years. In addition, Frisk et al (2001) estimated that on average, medium sized (100-199 cm) elasmobranchs have a potential rate of population increase around 0.21. The intrinsic rate of increase parameter (r) from the logistic growth model is related to the exploitation rate F at MSY and therefore the overfishing limit (OFL) as defined by the North Pacific Fishery Management Council could be specified as follows:
FMSY = FOFL = r/2
This relationship is derived from the logistic growth equation (see e.g. Murray 1989, chapter 1). If the potential rate of population increase estimated by Frisk et al (2001) for medium sized elasmobranchs is viewed as analogous to the logistic model parameter r, this would define FMSY = FOFL =(0.21/2)=0.105. Therefore, for the purposes of calculating a Tier 5 FOFL based on natural mortality (M), we used an M between 0.09 (based on longevity of barndoor skates) and 0.105 (based on r/2) of 0.10 for the big skate Raja binoculata and the longnose skate R. rhina. Because little is known about Bathyraja species anywhere, a precautionary approach was applied in estimating M for these species in the Gulf of Alaska; it is estimated to be 0.10 until further information can be collected, although it is possible that these species are slightly more productive than the larger Raja species. Lending further support to using M=0.10 is an analysis which was undertaken to explore alternative methods to estimate natural mortality (M) for skates. Several methods were employed based on correlations of M with life history parameters including growth parameters (Alverson and Carney 1975, Pauly 1980, Charnov 1993), longevity (Hoenig 1983), and reproductive potential (Rikhter and Efanov 1976, Roff 1986). Because Alaska specific information is not yet available, M was estimated using the methods as applied to data for California big and longnose skates. Considering the uncertainty inherent in applying this method, we elected to use the lowest estimates of M derived from any of these methods which corresponds well with the M=0.10 estimated above (Table 17-11).
Assemblage analysis and recommendations At present, the target species big and longnose skates are managed as individual species in the GOA. Single species management is appropriate for these target species, which are also the biomass dominant skate species in the GOA. Bathyraja species of skates in the GOA are currently managed within the GOA “other skates” management complex. As long as commercial interest in GOA Bathyraja skate species
remains low, managing Bathyraja species within the “other skates” assemblage provides the appropriate balance of protection for these skate species with management simplicity. However, we recommend continued monitoring of the skate species composition landed at GOA ports by samplers trained in skate species identification to ensure that any increased commercial interest in GOA other skates is detected in time for appropriate management measures to be implemented.
Projections and Harvest Alternatives
Acceptable Biological Catch and Overfishing Limit While it appears that historical incidental catch of skates in groundfish and halibut fisheries did not represent heavy fishing pressure (stable to increasing survey trends between 1984-2003 support this assertion), the incidental catch combined with a directed skate fishery targeting the largest individuals of the largest species might result in excessive fishing mortality and negative population effects if improperly managed. We note that longnose skate biomass decreased since the last survey in 2005. However, it is difficult to determine if the observed decline in longnose skate survey biomass is directly attributable to increased fishery catch of large adult females since 2003. The spatial concentration of the directed fishery in particular suggests that management should guard against localized depletion of skates, especially when little is known of migratory habits or population structure for any Alaskan skate species. We recommend the following management measures be applied to GOA skates in 2008 and 2009:
• Continued individual species ABC and OFL for the two current target species of the skate fishery, the big skate (Raja binoculata) and the longnose skate (Raja rhina).
• Area specific ABC and OFL for Raja binoculata and Raja rhina. These species display sensitive life history traits (large size, late maturity, and low fecundity), and retention of skates is extremely localized, so management measures should follow suit to the extent possible.
• Continued genus level ABC and OFL (Gulfwide) for the Bathyraja species complex pending the collection of further information. These species are not yet the targets of directed fishing.
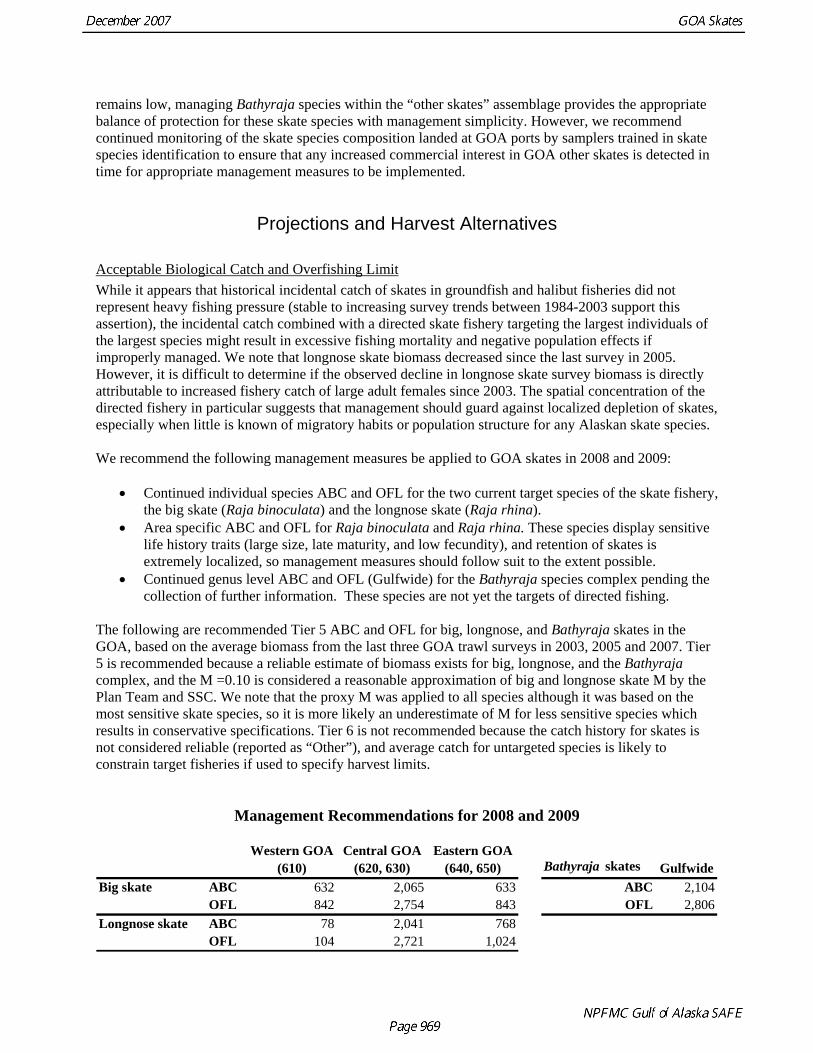
The following are recommended Tier 5 ABC and OFL for big, longnose, and Bathyraja skates in the GOA, based on the average biomass from the last three GOA trawl surveys in 2003, 2005 and 2007. Tier 5 is recommended because a reliable estimate of biomass exists for big, longnose, and the Bathyraja complex, and the M =0.10 is considered a reasonable approximation of big and longnose skate M by the Plan Team and SSC. We note that the proxy M was applied to all species although it was based on the most sensitive skate species, so it is more likely an underestimate of M for less sensitive species which results in conservative specifications. Tier 6 is not recommended because the catch history for skates is not considered reliable (reported as “Other”), and average catch for untargeted species is likely to constrain target fisheries if used to specify harvest limits.
Management Recommendations for 2008 and 2009
Western GOA Central GOA Eastern GOA(610) (620, 630) (640, 650) Bathyraja skates Gulfwide
Big skate ABC 632 2,065 633 ABC 2,104OFL 842 2,754 843 OFL 2,806
Longnose skate ABC 78 2,041 768OFL 104 2,721 1,024
Given the updated information suggesting that bycatch of skates in Pacific halibut fisheries may be more than double that estimated in groundfish fisheries prior to 2003, we recommend that direct observation of these fisheries be initiated to monitor this substantial bycatch. Using the upper estimate of skate bycatch in the halibut fishery, the combined total fishery catch of skates in the GOA could exceed the entire ABC of big, longnose, and other skates, and possibly the Gulfwide OFL for longnose skates. Therefore, we do not recommend any directed fishing for GOA skates. In addition, information on Bathyraja species should be closely monitored to ensure that target fisheries do not expand to these poorly understood species before basic life history information can be collected to ensure effective management.
Ecosystem Considerations
This section focuses on the big skate and the longnose skate in the GOA, with all other species found in the area summarized within in the group “Other skates.” Skates are predators in the GOA FMP area, but some species are piscivorous while others specialize in benthic invertebrates (Table 17-1). Each skate species occupies a slightly different position in the GOA food web based upon its feeding habits. We show the food webs for big skates, longnose skates, and other skates in the GOA (Figures 17-14, 17-15, and 17-16). Longnose skates have the highest trophic level of any skate, followed by big skates at a relatively high trophic level, and other skates in the GOA have a much lower trophic level. All of the skates have relatively few predators aside from fisheries, and diverse prey ranging from benthic invertebrates to pelagic fish. Viewing the food web of each species group along with basic depth distribution further characterizes the ecological relationships for each group. Big skates primarily occupy the shallowest habitats of the GOA continental shelf from 1 to 100 m depth (Figure 17-2), where they feed on both pelagic and demersal fish and bivalves, benthic amphipods and other benthic crustaceans, and even some benthic detritus (Figure 17-14). Longnose skates are distributed throughout all depths, but are dominant in deeper continental shelf habitats from 100-200 m depth (Figure 17-2), and feed almost exclusively on fish above trophic level 3 as well as non-pandalid (NP) shrimp (Figure 17-15). Other skates are also found in all depth ranges, but are dominant in depths greater than 200 m (Figure 17-2) and tend to feed on the same fish and benthic invertebrates as big skates, but a wider variety including worms, brittle stars and Pandalid shrimp (Figure 17-16). In aggregate, GOA skates are connected directly as predator or prey with almost all other groups in the food webs, with the exception of pelagic zooplankton and phytoplankton. These food webs were derived from mass balance ecosystem models assembling information on the food habits, biomass, productivity and consumption for all major living components in each system (Aydin et al in review). One simple way to evaluate ecosystem (predation) effects relative to fishing effects is to measure the proportions of overall mortality attributable to each source. Figure 17-17 shows the proportions of total mortality attributable to predation and to fishing mortality for big, longnose, and other skates in the GOA, and further distinguish these measured sources of mortality from sources that are not explained within the ecosystem models. We note that recent fishing mortality increases for big skates are not accounted for in this plot, which is based on early 1990s fishing and food habits information collected prior to the beginning of directed fishing. However, the ecosystem model was parameterized to account for incidental catch mortality from halibut fisheries (see the top panels of Figures 17-18, 17-19, and 17-20), so a full range of incidental fishing effects was included. While there are many uncertainties in estimating these mortality rates, the results suggest that (early 1990s) incidental fishing mortality exceeded predation mortality for all of these GOA skate groups. One source of uncertainty in these results is that all skate species in all areas were assumed to have the same total mortality rate, which is an oversimplification, but one which is consistent with the assumptions regarding natural mortality rate (the same for all skate species) in this stock assessment. We expect to improve on these default assumptions as information on productivity and catch for individual skate species in each area continues to improve.
Skates have few natural predators, and information on consumption by these predators is difficult to obtain. In the GOA, skate predators include marine mammals such as Steller sea lions and sperm whales (which may consume adult or juvenile skates), and spiny dogfish (which likely consume juvenile skates). We have not accounted for any predation on skate eggs by other predators, but Jerry Hoff’s research in the Bering Sea suggests that Pacific cod and Pacific halibut may feed on newly hatched juvenile skates and that gastropods consume substantial numbers of skate embryos by drilling through deposited egg cases (J. Hoff AFSC pers comm., and see also the BSAI skate SAFE, Ormseth and Matta 2007). Therefore, the information presented on skate mortality sources in Figures 17-18, 17-19 and 17-20 will be updated as catch and predation information improve. In terms of annual tons removed, it is instructive to compare fishery catches with predator consumption of skates. We estimate that groundfish fisheries were annually removing about 1,000 to 3,000 tons of skates from the GOA on average during the early 1990s (Table 17-3), and limited information suggests that halibut fisheries removed up to another 5,000 + tons per year. While estimates of predator consumption of skates are perhaps more uncertain than catch estimates, the ecosystem models incorporate uncertainty in partitioning estimated consumption of skates between their major predators in each system. The predators with the highest overall consumption of big skates in the GOA are pinnipeds (adult and juvenile Steller sea lions), which account for more than 8% of total skate mortality and consumed between 200 and 900 tons of skates annually in the early 1990s (Figure 17-18). Consumption of big skates by sharks is more uncertain; dogfish accounted for nearly 10% of skate mortality, and consumption estimates ranged from 100 to 1,500 tons of big skates annually (Figure 17-18). Sperm whales account for less than 4% of big skate mortality in the GOA, consuming an estimated 50 to 400 tons annually. Longnose skates have always had much higher mortality from fisheries than from predator consumption, according to early 1990s information integrated in ecosystem models (Figure 17-19), but predator consumption estimates are very similar to those estimated for big skates. Pinnipeds, sharks, and toothed whales combined were estimated to consume anywhere from 200 to 1,200 tons of longnose skates annually (Figure 17-19). The predators with the highest consumption of Other skates in the GOA are also pinnipeds, sharks, and sperm whales, but there is also some consumption of this group by skates (Figure 17-20). The annual tonnage consumed of this group by all predators, between 100 and 1,000 tons of other skates annually in the early 1990s, is somewhat lower than that for big and longnose skates, reflecting their deeper distribution and overall lower biomass relative to the Raja species. Diets of skates are derived from food habits collections taken throughout the north Pacific range of these species, because systematic sampling of skate food habits on NMFS GOA trawl surveys has only recently begun. In general, diets estimated from other areas were modified by the limited field observations available from Alaska. Raja diets evaluated from collections in Oregon (Wakefield 1984) were modified based on qualitative observations from the 2003 GOA trawl survey, and Bathyraja diets evaluated from collections in the Kuril Islands and Kamchatka (Orlov 1996) were modified based on limited sampling for these species in the BSAI and GOA regions. We expect to incorporate recent quantitative skate food habits collections from the GOA in future assessments. Using available information, we estimate that non-pandalid (Crangon) shrimps compose over 44% of GOA big skate diet, and another 12% of the diet was sandlance (Figure 17-21). Arrowtooth flounder, eelpouts, pollock, capelin, and halibut made up another 30% of big skates’ diet, and combined detritus, groundfish, and invertebrate prey made up the remainder of their diet. This diet composition combined with estimated consumption rates and the moderately high biomass of big skates in the GOA results in an annual consumption estimate of 5,000 to 60,000 tons of shrimp annually, with approximately another 20,000 tons each of forage fish and groundfish consumption (Figure 17-21). Longnose skates consume primarily flatfish, pollock, capelin and sandlance, which account for more than 60% of their diet, so the consumption of fish by longnose skates amounts to about 5,000 to 20,000 tons of combined flatfish annually, 2,000 to 11,000 tons of forage fish, and 2,000 to 7,000 tons of pollock annually (Figure 17-22).
Other skates tend to consume more invertebrates than big and longnose skates in the GOA, so estimates of benthic crustacean consumption due to other skates range up to 35,000 tons annually, much higher than those for big and longnose skates despite the disparity in biomass between the groups (Figure 17-23). Because big skates, longnose skates and other skates are distributed differently in the GOA, with big skates dominating the shallow shelf areas, longnose skates in intermediate depths, and the more diverse species complex located on the outer shelf and slope, we might expect different ecosystem relationships for skates in these habitats based on different food habits for the species. Examining the trophic relationships of GOA skates provides a context for assessing fishery interactions beyond the direct effect of bycatch mortality. In the GOA, while big and longnose skates do feed on commercially important fish species, they also rely on non-commercial species such as shrimp and forage fish. Therefore, management practices that promote the health of commercial flatfish and pollock as well as forage species will be beneficial to skates. Because skates are at a relatively high trophic level in both systems, predation mortality is less significant than fishing mortality. Steller sea lions are one of the most important predators of skates in the GOA, so it seems possible that this source of predation mortality is lower now for skates than it may have been in the past when Steller populations were higher. Perhaps any release of skates from Steller sea lion predation mortality is now being compensated by increased fishing mortality with as commercial interest in skates has increased recently. However, it is difficult to assess the relative magnitude of these effects over time as historical predator food habits data and catch data for skates are both so sparse. Given that fishing mortality is the largest known source of mortality for skates, the assessment of skate population dynamics and response to fishing should be continued and improved in the GOA as it represents the primary skate assessment ecosystem consideration as well.
Data gaps and research priorities Accurate species identification of the catch is essential to understanding the effects of removals on the population dynamics of individual skate species. We highly recommend continued port sampling to verify information from the fish ticket database. Because fishing mortality appears to be a larger proportion of skate mortality in the GOA than predation mortality, highest priority research should continue to focus on direct fishing effects on skate populations. The most important component of this research is to fully evaluate the catch and discards in all fisheries capturing skates. It is also vital to continue research on the productive capacity of skate populations, including information on age and growth, maturity, fecundity, and habitat associations. All of this research has been initiated for major skate species in the GOA; it should be fully funded to completion. Although predation appears less important than fishing mortality on adult skates, juvenile skates and skate egg cases are likely much more vulnerable to predation. This effect has not been evaluated in population or ecosystem models. We expect to learn more about the effects of predation on skates, especially as juveniles, with the completion of Jerry Hoff’s research on skate nursery areas in the Bering Sea. Skate habitat is only beginning to be described in detail. Adults appear capable of significant mobility in response to general habitat changes, but any effects on the small scale nursery habitats crucial to reproduction could have disproportionate population effects. Eggs are limited to isolated nursery grounds and juveniles use different habitats than adults. Changes in these habitats have not been monitored historically, so assessments of habitat quality and its trends are not currently available. We recommend continued study on skate nursery areas to evaluate importance to population production. We do not see any conflict at present between commercial fishing and skate foraging on flatfish, and pollock appear to be a minor component of skate diets in the GOA, but we do recommend continued
monitoring of skate populations and food habits at appropriate spatial scales to ensure that these trophic relationships remain intact as fishing for these commercial forage species continues and evolves.
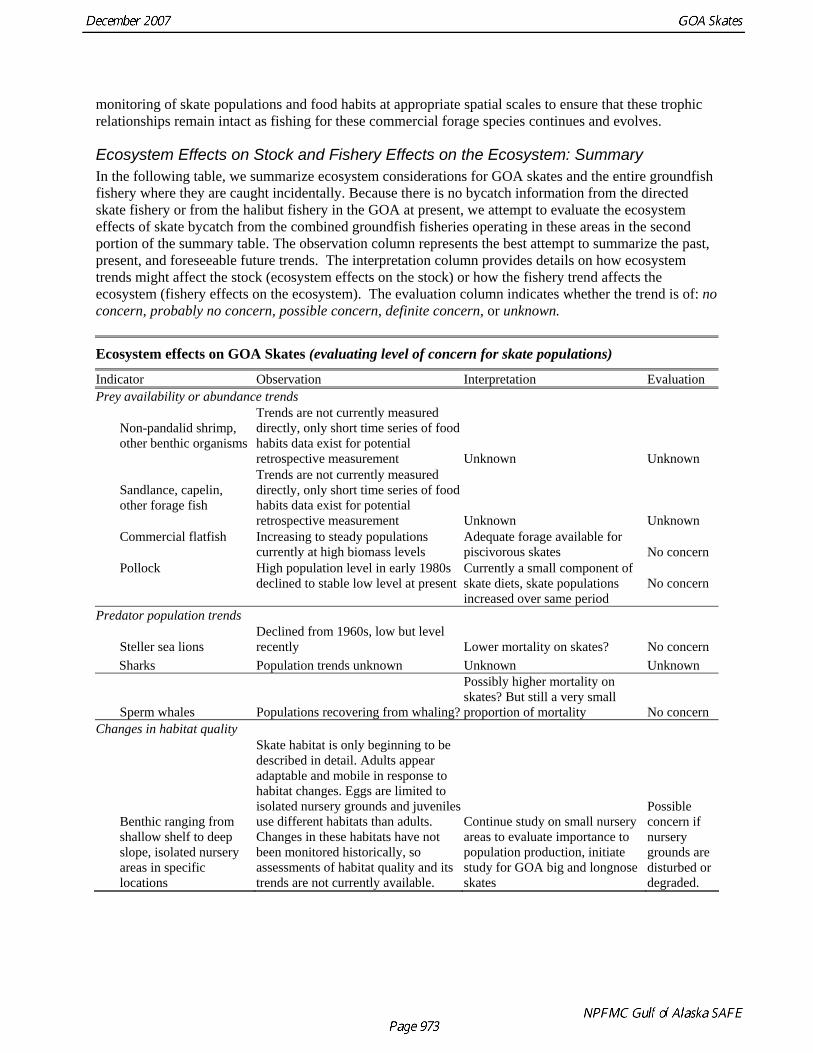
Ecosystem Effects on Stock and Fishery Effects on the Ecosystem: Summary In the following table, we summarize ecosystem considerations for GOA skates and the entire groundfish fishery where they are caught incidentally. Because there is no bycatch information from the directed skate fishery or from the halibut fishery in the GOA at present, we attempt to evaluate the ecosystem effects of skate bycatch from the combined groundfish fisheries operating in these areas in the second portion of the summary table. The observation column represents the best attempt to summarize the past, present, and foreseeable future trends. The interpretation column provides details on how ecosystem trends might affect the stock (ecosystem effects on the stock) or how the fishery trend affects the ecosystem (fishery effects on the ecosystem). The evaluation column indicates whether the trend is of: no concern, probably no concern, possible concern, definite concern, or unknown.
Ecosystem effects on GOA Skates (evaluating level of concern for skate populations)
Indicator Observation Interpretation Evaluation Prey availability or abundance trends
Non-pandalid shrimp, other benthic organisms
Trends are not currently measured directly, only short time series of food habits data exist for potential retrospective measurement Unknown Unknown
Sandlance, capelin, other forage fish
Trends are not currently measured directly, only short time series of food habits data exist for potential retrospective measurement Unknown Unknown
Commercial flatfish
Increasing to steady populations currently at high biomass levels
Adequate forage available for piscivorous skates No concern
Pollock
High population level in early 1980s declined to stable low level at present
Currently a small component of skate diets, skate populations increased over same period
No concern
Predator population trends Declined from 1960s, low but level recently Lower mortality on skates? No concern Steller sea lions
Sharks Population trends unknown Unknown Unknown
Populations recovering from whaling?
Possibly higher mortality on skates? But still a very small proportion of mortality No concern Sperm whales
Changes in habitat quality Skate habitat is only beginning to be described in detail. Adults appear adaptable and mobile in response to habitat changes. Eggs are limited to isolated nursery grounds and juveniles use different habitats than adults. Changes in these habitats have not been monitored historically, so assessments of habitat quality and its trends are not currently available.
Continue study on small nursery areas to evaluate importance to population production, initiate study for GOA big and longnose skates
Possible concern if nursery grounds are disturbed or degraded.
Benthic ranging from shallow shelf to deep slope, isolated nursery areas in specific locations
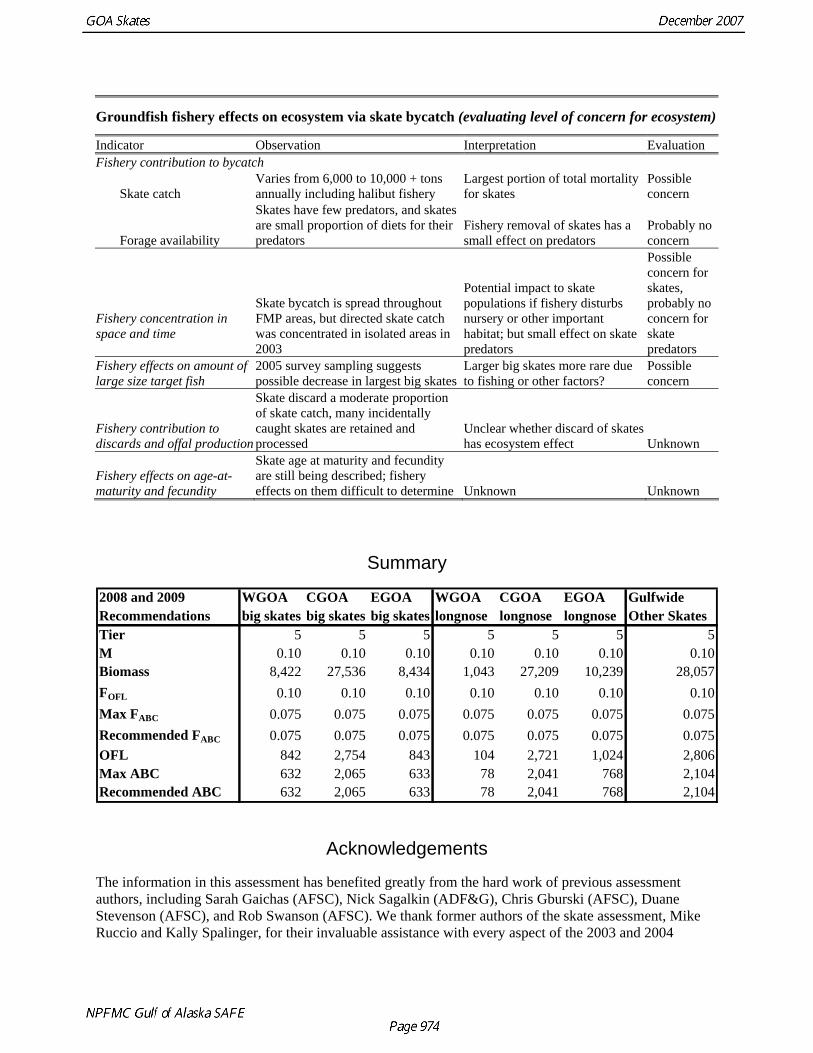
Groundfish fishery effects on ecosystem via skate bycatch (evaluating level of concern for ecosystem)
Indicator Observation Interpretation Evaluation Fishery contribution to bycatch
Varies from 6,000 to 10,000 + tons annually including halibut fishery
Largest portion of total mortality for skates
Possible concern Skate catch
Skates have few predators, and skates are small proportion of diets for their predators
Fishery removal of skates has a small effect on predators
Probably no concern Forage availability
Fishery concentration in space and time
Skate bycatch is spread throughout FMP areas, but directed skate catch was concentrated in isolated areas in 2003
Potential impact to skate populations if fishery disturbs nursery or other important habitat; but small effect on skate predators
Possible concern for skates, probably no concern for skate predators
Fishery effects on amount of large size target fish
2005 survey sampling suggests possible decrease in largest big skates
Larger big skates more rare due to fishing or other factors?
Possible concern
Fishery contribution to discards and offal production
Skate discard a moderate proportion of skate catch, many incidentally caught skates are retained and processed
Unclear whether discard of skates has ecosystem effect Unknown
Skate age at maturity and fecundity are still being described; fishery effects on them difficult to determine Unknown Unknown
Fishery effects on age-at-maturity and fecundity
Summary
2008 and 2009 WGOA CGOA EGOA WGOA CGOA EGOA GulfwideRecommendations big skates big skates big skates longnose longnose longnose Other SkatesTier 5 5 5 5 5 5M 0.10 0.10 0.10 0.10 0.10 0.10 0.10Biomass 8,422 27,536 8,434 1,043 27,209 10,239 28,057FOFL 0.10 0.10 0.10 0.10 0.10 0.10 0.10Max FABC 0.075 0.075 0.075 0.075 0.075 0.075 0.075Recommended FABC 0.075 0.075 0.075 0.075 0.075 0.075 0.075OFL 842 2,754 843 104 2,721 1,024 2,806Max ABC 632 2,065 633 78 2,041 768 2,104Recommended ABC 632 2,065 633 78 2,041 768 2,104
5
Acknowledgements
The information in this assessment has benefited greatly from the hard work of previous assessment authors, including Sarah Gaichas (AFSC), Nick Sagalkin (ADF&G), Chris Gburski (AFSC), Duane Stevenson (AFSC), and Rob Swanson (AFSC). We thank former authors of the skate assessment, Mike Ruccio and Kally Spalinger, for their invaluable assistance with every aspect of the 2003 and 2004
assessments. Many ADF&G port samplers and ADF&G and NMFS survey staff participated in collecting skate fishery and life history information in 2003, 2004 and 2005, despite already full workloads. We thank the other participants in the “skate working group” who are not already authors on this assessment, Jerry Hoff and Liz Chilton, and unofficial member Sandra Lowe for providing the life history-based estimates of M used in both this assessment and the BSAI skate assessment. We thank Sarah Gaichas for reviewing this assessment. We are grateful to the many different offices and agencies have responded efficiently to requests for help and information related to the skate assessment: groundfish observers and the Fishery Monitoring and Analysis program at the AFSC; the North Pacific Fisheries Management Council ; the NMFS AK Regional Office staff; the AFSC Age and Growth group; and Dave Ebert and his group at Moss Landing Marine Laboratories.
Literature Cited
Agnew, D.J., C.P. Nolan, J.R. Beddington, and R. Baranowski, 2000. Approaches to the assessment and
management of multispecies skate and ray fisheries using the Falkland Islands fishery as an example. Can. J. Fish. Aquat. Sci. 57: 429-440.
Allen, M.J., and G.B. Smith, 1988. Atlas and zoogeography of common fishes in the Bering Sea and
northeastern Pacific. NOAA Technical Report NMFS 66, 151 pp. Alverson, D.L., and W.T. Pereyra, 1969. Demersal fish explorations in the northeastern Pacific Ocean:
An evaluation of exploratory fishing methods and analytical approaches to stock size and yield forecasts. J. Fish. Res. Bd. Canada 26: 1985-2001.
Alverson, D.L., and M.J. Carney. 1975. A graphic review of the growth and decay of population cohorts.
J. Cons. Int. Explor. Mer 36:133-143. Aydin, K., S. Gaichas, I. Ortiz, D. Kinzey, and N. Friday. In review. A comparison of the Bering Sea,
Gulf of Alaska, and Aleutian Islands large marine ecosystems through food web modeling. NOAA Tech Memo. Detailed figures available at
Brander, K., 1981. Disappearance of common skate Raja batis from Irish Sea. Nature 290: 48-49. Casey, J.M. and R.A. Myers, 1998. Near extinction of a large, widely distributed fish. Science
281(5377):690-692. Charnov, E.L. 1993. Life history invariants some explorations of symmetry in evolutionary ecology.
Oxford University Press Inc., New York. 167p. Dulvy, N.K., J.D. Metcalfe, J. Glanville, M.G. Pawson, and J.D. Reynolds, 2000. Fishery stability, local
extinctions, and shifts in community structure in skates. Conservation Biology 14(1): 283-293. Eschmeyer, W.N., E.S. Herald, and H. Hammann, 1983. A field guide to Pacific coast fishes of North
America. Houghton Mifflin Co., Boston: 336 pp. Frisk, M.G., T. J. Miller, and M. J. Fogarty, 2001. Estimation and analysis of biological parameters in
elasmobranch fishes: a comparative life history study. Can. J. Fish. Aquat. Sci. 58: 969-981. Frisk, M. G. , T. J. Miller, and M. J. Fogarty, 2002. The population dynamics of little skate Leucoraja
erinacea, winter skate Leucoraja ocellata, and barndoor skate Dipturus leavis: predicting exploitation limits using matrix analysis. ICES J. Mar. Sci. 59: 576-586.
Gaichas, S., J. Ianelli, and L. Fritz, 1999. Other species considerations for the Gulf of Alaska. Gburski, C.M., S.K. Gaichas, and D.K. Kimura. 2007. Age and growth of big skate (Raja binoculata)
and longnose skate (R. rhina) and implications to the skate fisheries in the Gulf of Alaska. Env. Bio. Fishes 80: 337-349.
Hoenig, J.M., 1983. Empirical use of longevity data to estimate mortality rates. Fish. Bull. 82(1): 898-
902.
Ishihara, H. and R. Ishiyama, 1985. Two new North Pacific skates (Rajidae) and a revised key to
Bathyraja in the area. Jpn. J. Ichthyol. 32(2): 143-179. King, J. R., and G. A. McFarlane, 2002. Preliminary results of Big Skate (Raja binoculata) Age
Determination Project. Unpub. Man. DFO. King, J.R., and G.A. McFarlane, 2003. Marine fish life history strategies: applications to fishery
management. Fish. Man. And Ecology, 10: 249-264. Kotwicki, S., and Weinberg, K.L. 2005. Estimating capture probability of a survey bottom trawl for
Bering Sea skates (Bathyraja spp.) and other fish. Alaska Fishery Research Bulletin 11(2): 135-145.
Love, M.S., C.W. Mecklenberg, T.A. Mecklenberg, and L.K. Thorsteinson. 2005. Resource inventory of
marine and estuarine fishes of the West Coast and Alaska: a checklist of north Pacific and Arctic Ocean species from Baja California to the Alaska-Yukon Border. U.S. Department of the Interior, U.S. Geological Survey, Biological Resources Division, Seattle, Washington, 98104, OCS Study MMS 2005-030 and USGS/NBII 2005-001.
Martin, L. and G.D. Zorzi, 1993. Status and review of the California skate fishery. In Conservation biology of elasmobranchs (S. Branstetter, ed.), p. 39-52. NOAA Technical Report NMFS 115.
McEachran, J.D., and K.A. Dunn, 1998. Phylogenetic analysis of skates, a morphologically conservative
clade of elasmobranchs (Chondrichthyes: Rajidae). Copeia, 1998(2), 271-290. McEachran, J.D. and T. Miyake, 1990a. Phylogenetic relationships of skates: a working hypothesis
(Chondrichthyes: Rajoidei). In Elasmobranchs as living resources: advances in the biology, ecology, systematics, and the status of the fisheries (H.L. Pratt, Jr., S.R. Gruber, and T. Taniuchi, eds.), p. 285-304. NOAA Technical Report NMFS 90.
McEachran, J.D. and T. Miyake, 1990a. Phylogenetic relationships of skates: a working hypothesis
(Chondrichthyes: Rajoidei). In Elasmobranchs as living resources: advances in the biology, ecology, systematics, and the status of the fisheries (H.L. Pratt, Jr., S.R. Gruber, and T. Taniuchi, eds.), p. 285-304. NOAA Technical Report NMFS 90.
McFarlane, G.A. and J.R. King. 2006. Age and growth of big skate (Raja binoculata) and longnose skate
(Raja rhina) in British Columbia waters. Fish Res. 78: 169-178. Moyle, P.B., and J.J. Cech, Jr., 1996. Fishes, an introduction to ichthyology (Third edition). Prentice
Hall: New Jersey, 590 pp. Murray, J.D., 1989. Mathematical Biology. Springer-Verlag: New York. 767 pp. Musick, J.A., S.A. Berkeley, G.M. Cailliet, M. Camhi, G. Huntsman, M. Nammack, and M.L. Warren,
Jr., 2000. Protection of marine fish stocks at risk of extinction. Fisheries 25(3):6-8. Nelson, J. S., 1994. Fishes of the world, Third edition. John Wiley and Sons, Inc., New York: 600 pp. NMFS 2000. Skate complex. In Draft 30th Northeast Regional Stock Assessment Workshop (30th SAW),
Stock assessment review committe (SARC) consensus summary of assessments, p. 7-173.
NMFS PSEIS 2001. Draft Programmatic Environmental Impact Statement. Orlov, A.M., 1998. The diets and feeding habits of some deep-water benthic skates (Rajidae) in the
Pacific waters off the northern Kuril Islands and southeastern Kamchatka. Alaska Fishery Research Bulletin 5(1): 1-17.
Orlov, A.M., 1999. Trophic relationships of commercial fishes in the Pacific waters off southeastern
Kamchatka and the northern Kuril Islands. Pages 231-263 in Ecosystem Approaches for Fishery Management, Alaska Sea Grant College Program AK-SG-99-01, University of Alaska Fairbanks, 756 pp.
Pauly, D. On the interrelationships between natural mortality, growth parameters, and mean
environmental temperature in 175 fish stocks. J. Cons. Int. Explor. Mer 39(2):175-192. Rikhter, V.A., and V.N. Efanov. 1976. On one of the approaches to estimation of natural mortality of
fish populations. ICNAF Res. Doc. 76/VI/8. Serial N. 3777. 13p. Roff, D.A. 1986. The evolution of life history parameters in teleosts. Can. J. Fish. Aquat. Sci. 41:989-
1000. Sosebee, K., 1998. Skates. In Status of Fishery Resources off the Northeastern United States for 1998
(Stephen H. Clark, ed.), p. 114-115. NOAA Technical Memorandum NMFS-NE-115. Stevenson, D. 2004. Identification of skates, sculpins, and smelts by observers in north Pacific groundfish
fisheries (2002-2003), U.S. Department of Commerce Technical Memorandum NMFS-AFSC-142. 67 p.
Stevenson, D.E., J.W. Orr, G.R. Hoff, and J.D. McEachran. 2004. Bathyraja mariposa: a new species of
skate (Rajidae: Arhynchobatinae) from the Aleutian Islands. Copeia 2004(2):305-314. Stevenson, D. E., Orr, J. W., Hoff, G. R., and McEachran, J. D. 2007. Field guide to sharks, skates, and
ratfish of Alaska. Alaska Sea Grant. Thompson, G.G., 1993. A proposal for a threshold stock size and maximum fishing mortality rate. Pages
303-320 in Risk evaluation and biological reference points for fisheries management (S.J. Smith, J.J. Hunt, and D. Rivard, eds.). Can. Spec. Publ. Fish. Aquat. Sci. 120, 440 pp.
Wakefield, W.W. 1984. Feeding relationships within assemblages of nearshore and mid-continental shelf
benthic fishes off Oregon. M.S. Thesis, OSU. Walker, P.A., and R. G. Hislop, 1998. Sensitive skates or resilient rays? Spatial and temporal shifts in ray
species composition in the central and north-western North Sea between 1930 and the present day. ICES J. Mar Sci., 55: 392-402.
Winemiller, K.O., and K.A. Rose, 1992. Patterns of life history diversification in Nortn American fishes:
implications for population regulation. Can. J. Fish. Aquat. Sci. 49: 2196-2218. Zeiner, S.J. and P. Wolf, 1993. Growth characteristics and estimates of age at maturity of two species of
skates (Raja binoculata and Raja rhina) from Monterey Bay, California. In Conservation biology of elasmobranchs (S. Branstetter, ed.), p. 39-52. NOAA Technical Report NMFS 115.
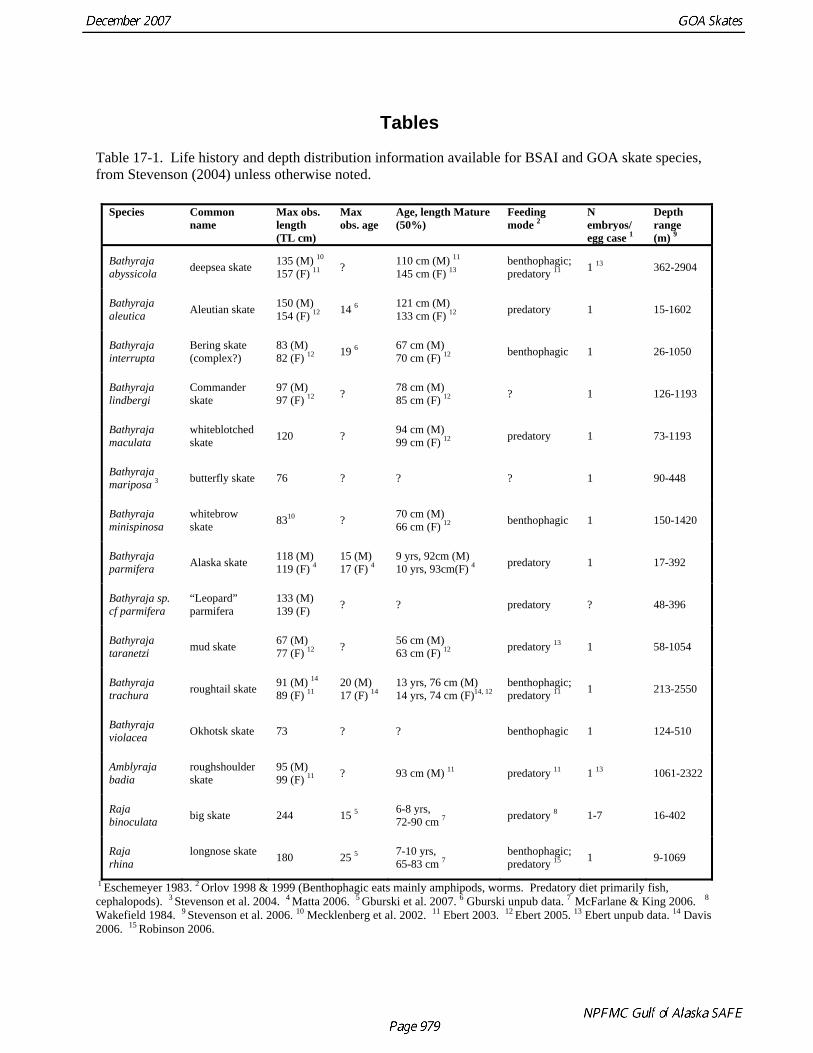
Tables
Table 17-1. Life history and depth distribution information available for BSAI and GOA skate species, from Stevenson (2004) unless otherwise noted.
Species Common name
Max obs. length (TL cm)
Max obs. age
Age, length Mature (50%)
Feeding mode 2
N embryos/ egg case 1
Depth range (m) 9
deepsea skate 135 (M) 10
157 (F) 11 ? 110 cm (M) 11 145 cm (F) 13
benthophagic; predatory 11 1 13 362-2904 Bathyraja
abyssicola
Bathyraja aleutica Aleutian skate 150 (M)
154 (F) 12 14 6 121 cm (M) 133 cm (F) 12 predatory 1 15-1602
Bathyraja interrupta
Bering skate (complex?)
83 (M) 82 (F) 12 19 6 67 cm (M)
70 cm (F) 12 benthophagic 1 26-1050
Bathyraja lindbergi
Commander skate
97 (M) 97 (F) 12 ? 78 cm (M)
85 cm (F) 12 ? 1 126-1193
Bathyraja maculata
whiteblotched skate 120 ? 94 cm (M)
99 cm (F) 12 predatory 1 73-1193
Bathyraja mariposa 3 butterfly skate 76 ? ? ? 1 90-448
Bathyraja minispinosa
whitebrow skate 8310 ? 70 cm (M)
66 cm (F) 12 benthophagic 1 150-1420
Bathyraja parmifera Alaska skate 118 (M)
119 (F) 4 15 (M) 17 (F) 4
9 yrs, 92cm (M) 10 yrs, 93cm(F) 4 predatory 1 17-392
Bathyraja sp. cf parmifera
“Leopard” parmifera
133 (M) 139 (F) ? ? predatory ? 48-396
Bathyraja taranetzi mud skate 67 (M)
77 (F) 12 ? 56 cm (M) 63 cm (F) 12 predatory 13 1 58-1054
roughtail skate 91 (M) 14
89 (F) 11 20 (M) 17 (F) 14
13 yrs, 76 cm (M) 14 yrs, 74 cm (F)14, 12
benthophagic; predatory 11 1 213-2550 Bathyraja
trachura
Bathyraja violacea Okhotsk skate 73 ? ? benthophagic 1 124-510
Amblyraja badia
roughshoulder skate
95 (M) 99 (F) 11 ? 93 cm (M) 11 predatory 11 1 13 1061-2322
Raja binoculata big skate 244 15 5 6-8 yrs,
72-90 cm 7 predatory 8 1-7 16-402
Raja rhina
longnose skate 180 25 5 7-10 yrs,
65-83 cm 7 benthophagic; predatory 15 1 9-1069
1 Eschemeyer 1983. 2 Orlov 1998 & 1999 (Benthophagic eats mainly amphipods, worms. Predatory diet primarily fish, cephalopods). 3 Stevenson et al. 2004. 4 Matta 2006. 5 Gburski et al. 2007. 6 Gburski unpub data. 7 McFarlane & King 2006. 8
Wakefield 1984. 9 Stevenson et al. 2006. 10 Mecklenberg et al. 2002. 11 Ebert 2003. 12 Ebert 2005. 13 Ebert unpub data. 14 Davis 2006. 15 Robinson 2006.
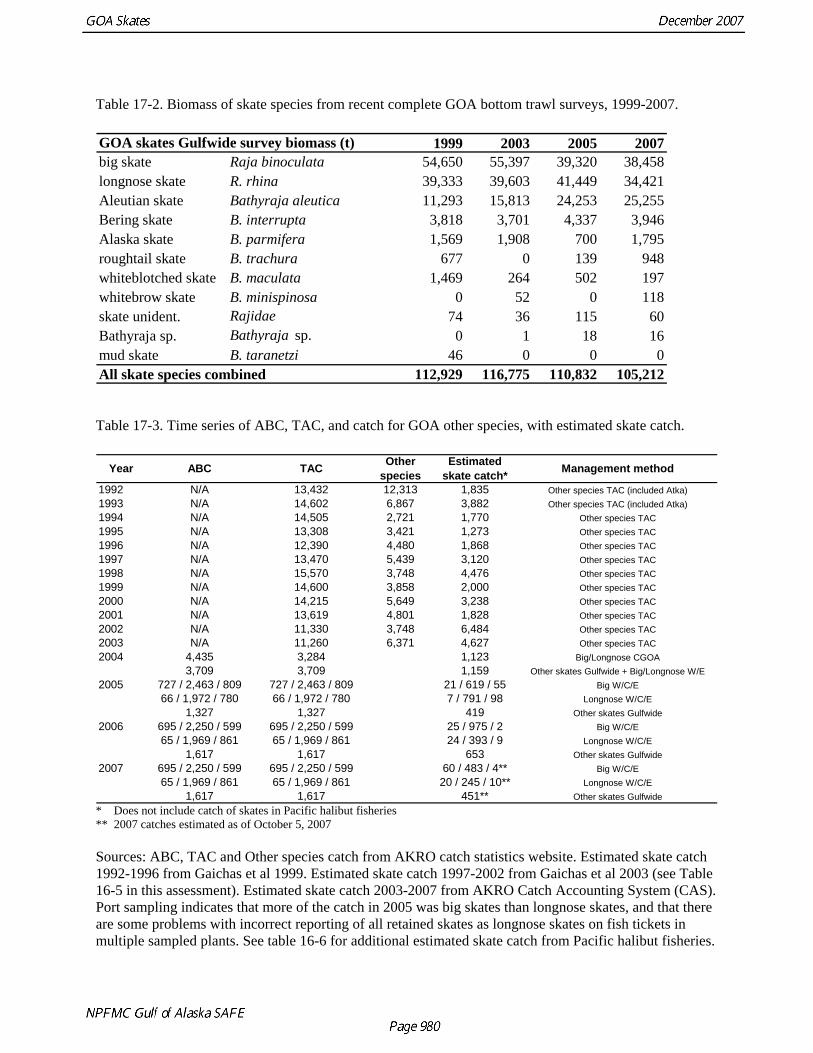
Table 17-2. Biomass of skate species from recent complete GOA bottom trawl surveys, 1999-2007.
1999 2003 2005 2007big skate Raja binoculata 54,650 55,397 39,320 38,458longnose skate R. rhina 39,333 39,603 41,449 34,421Aleutian skate Bathyraja aleutica 11,293 15,813 24,253 25,255Bering skate B. interrupta 3,818 3,701 4,337 3,946Alaska skate B. parmifera 1,569 1,908 700 1,795roughtail skate B. trachura 677 0 139 948whiteblotched skate B. maculata 1,469 264 502 197whitebrow skate B. minispinosa 0 52 0 118skate unident. Rajidae 74 36 115 60Bathyraja sp. Bathyraja sp. 0 1 18 16mud skate B. taranetzi 46 0 0 0All skate species combined 112,929 116,775 110,832 105,212
GOA skates Gulfwide survey biomass (t)
Table 17-3. Time series of ABC, TAC, and catch for GOA other species, with estimated skate catch.
1992 N/A 13,432 12,313 1,835 Other species TAC (included Atka)1993 N/A 14,602 6,867 3,882 Other species TAC (included Atka)1994 N/A 14,505 2,721 1,770 Other species TAC1995 N/A 13,308 3,421 1,273 Other species TAC1996 N/A 12,390 4,480 1,868 Other species TAC1997 N/A 13,470 5,439 3,120 Other species TAC1998 N/A 15,570 3,748 4,476 Other species TAC1999 N/A 14,600 3,858 2,000 Other species TAC2000 N/A 14,215 5,649 3,238 Other species TAC2001 N/A 13,619 4,801 1,828 Other species TAC2002 N/A 11,330 3,748 6,484 Other species TAC2003 N/A 11,260 6,371 4,627 Other species TAC2004 4,435 3,284 1,123 Big/Longnose CGOA
3,709 3,709 1,159 Other skates Gulfwide + Big/Longnose W/E2005 727 / 2,463 / 809 727 / 2,463 / 809 21 / 619 / 55 Big W/C/E
66 / 1,972 / 780 66 / 1,972 / 780 7 / 791 / 98 Longnose W/C/E1,327 1,327 419 Other skates Gulfwide
2006 695 / 2,250 / 599 695 / 2,250 / 599 25 / 975 / 2 Big W/C/E65 / 1,969 / 861 65 / 1,969 / 861 24 / 393 / 9 Longnose W/C/E
1,617 1,617 653 Other skates Gulfwide2007 695 / 2,250 / 599 695 / 2,250 / 599 60 / 483 / 4** Big W/C/E
65 / 1,969 / 861 65 / 1,969 / 861 20 / 245 / 10** Longnose W/C/E1,617 1,617 451** Other skates Gulfwide
Other species
Estimated skate catch* Management methodYear TACABC
* Does not include catch of skates in Pacific halibut fisheries ** 2007 catches estimated as of October 5, 2007 Sources: ABC, TAC and Other species catch from AKRO catch statistics website. Estimated skate catch 1992-1996 from Gaichas et al 1999. Estimated skate catch 1997-2002 from Gaichas et al 2003 (see Table 16-5 in this assessment). Estimated skate catch 2003-2007 from AKRO Catch Accounting System (CAS). Port sampling indicates that more of the catch in 2005 was big skates than longnose skates, and that there are some problems with incorrect reporting of all retained skates as longnose skates on fish tickets in multiple sampled plants. See table 16-6 for additional estimated skate catch from Pacific halibut fisheries.
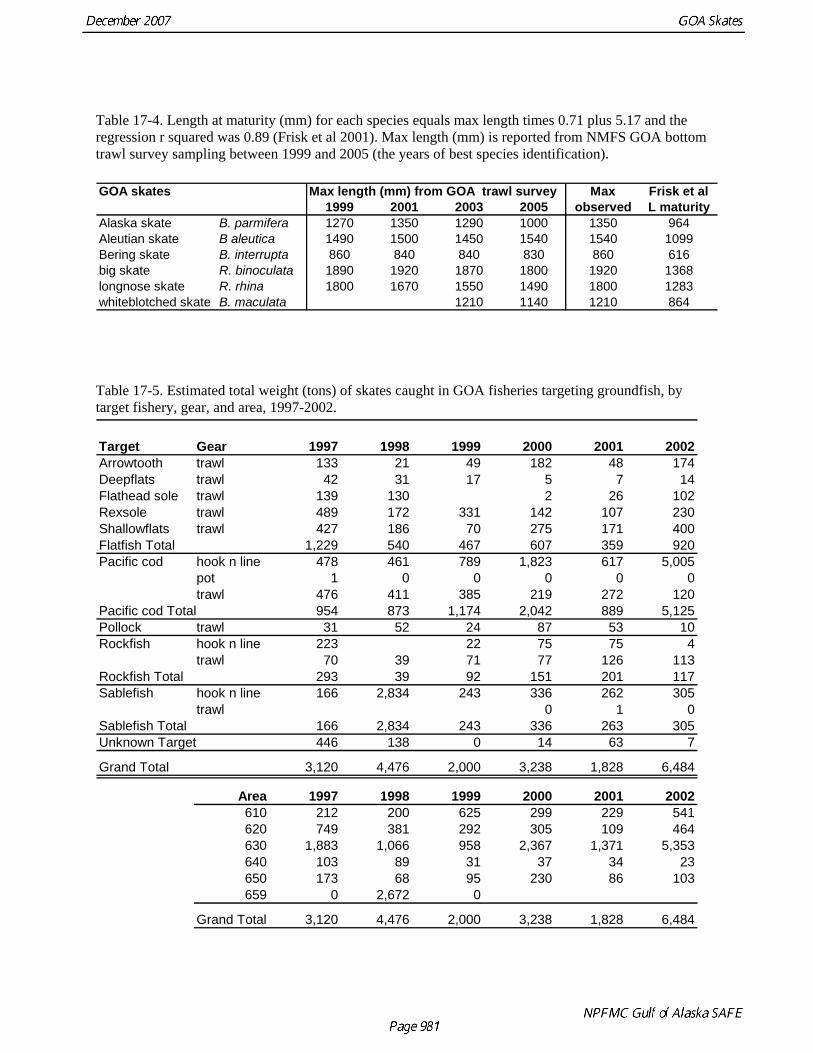
Table 17-4. Length at maturity (mm) for each species equals max length times 0.71 plus 5.17 and the regression r squared was 0.89 (Frisk et al 2001). Max length (mm) is reported from NMFS GOA bottom trawl survey sampling between 1999 and 2005 (the years of best species identification). GOA skates Max length (mm) from GOA trawl survey Max Frisk et al
1999 2001 2003 2005 observed L maturityAlaska skate B. parmifera 1270 1350 1290 1000 1350 964Aleutian skate B aleutica 1490 1500 1450 1540 1540 1099Bering skate B. interrupta 860 840 840 830 860 616big skate R. binoculata 1890 1920 1870 1800 1920 1368longnose skate R. rhina 1800 1670 1550 1490 1800 1283whiteblotched skate B. maculata 1210 1140 1210 864
Table 17-5. Estimated total weight (tons) of skates caught in GOA fisheries targeting groundfish, by target fishery, gear, and area, 1997-2002.
Target Gear 1997 1998 1999 2000 2001 2002Arrowtooth trawl 133 21 49 182 48 174Deepflats trawl 42 31 17 5 7 14Flathead sole trawl 139 130 2 26 102Rexsole trawl 489 172 331 142 107 230Shallowflats trawl 427 186 70 275 171 400Flatfish Total 1,229 540 467 607 359 920Pacific cod hook n line 478 461 789 1,823 617 5,005
pot 1 0 0 0 0 0trawl 476 411 385 219 272 120
Pacific cod Total 954 873 1,174 2,042 889 5,125Pollock trawl 31 52 24 87 53 1Rockfish hook n line 223 22 75 75 4
trawl 70 39 71 77 126 113Rockfish Total 293 39 92 151 201 117Sablefish hook n line 166 2,834 243 336 262 305
trawl 0 1 0Sablefish Total 166 2,834 243 336 263 305Unknown Target 446 138 0 14 63 7
Grand Total 3,120 4,476 2,000 3,238 1,828 6,484
Area 1997 1998 1999 2000 2001 2002610 212 200 625 299 229 541620 749 381 292 305 109 464630 1,883 1,066 958 2,367 1,371 5,353640 103 89 31 37 34 23650 173 68 95 230 86 103659 0 2,672 0
Grand Total 3,120 4,476 2,000 3,238 1,828 6,484
0
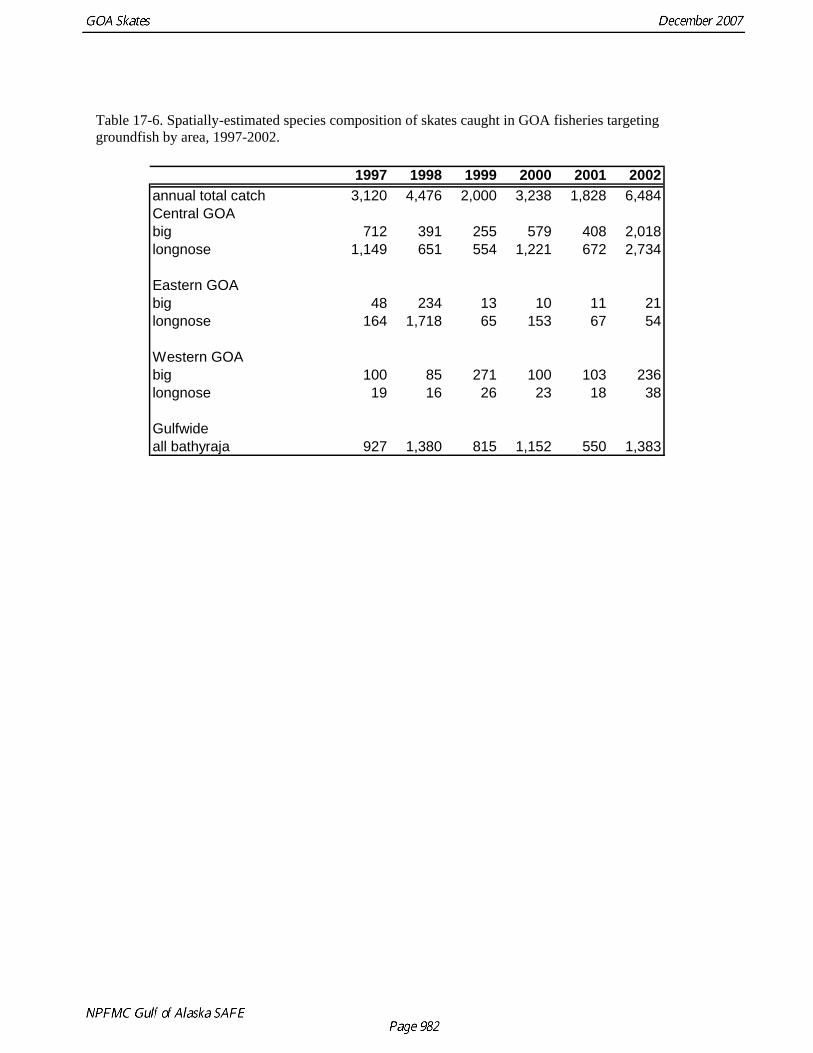
Table 17-6. Spatially-estimated species composition of skates caught in GOA fisheries targeting groundfish by area, 1997-2002.
1997 1998 1999 2000 2001 2002annual total catch 3,120 4,476 2,000 3,238 1,828 6,484Central GOAbig 712 391 255 579 408 2,018longnose 1,149 651 554 1,221 672 2,734
Eastern GOAbig 48 234 13 10 11 21longnose 164 1,718 65 153 67 54
Western GOAbig 100 85 271 100 103 236longnose 19 16 26 23 18 38
Gulfwideall bathyraja 927 1,380 815 1,152 550 1,383
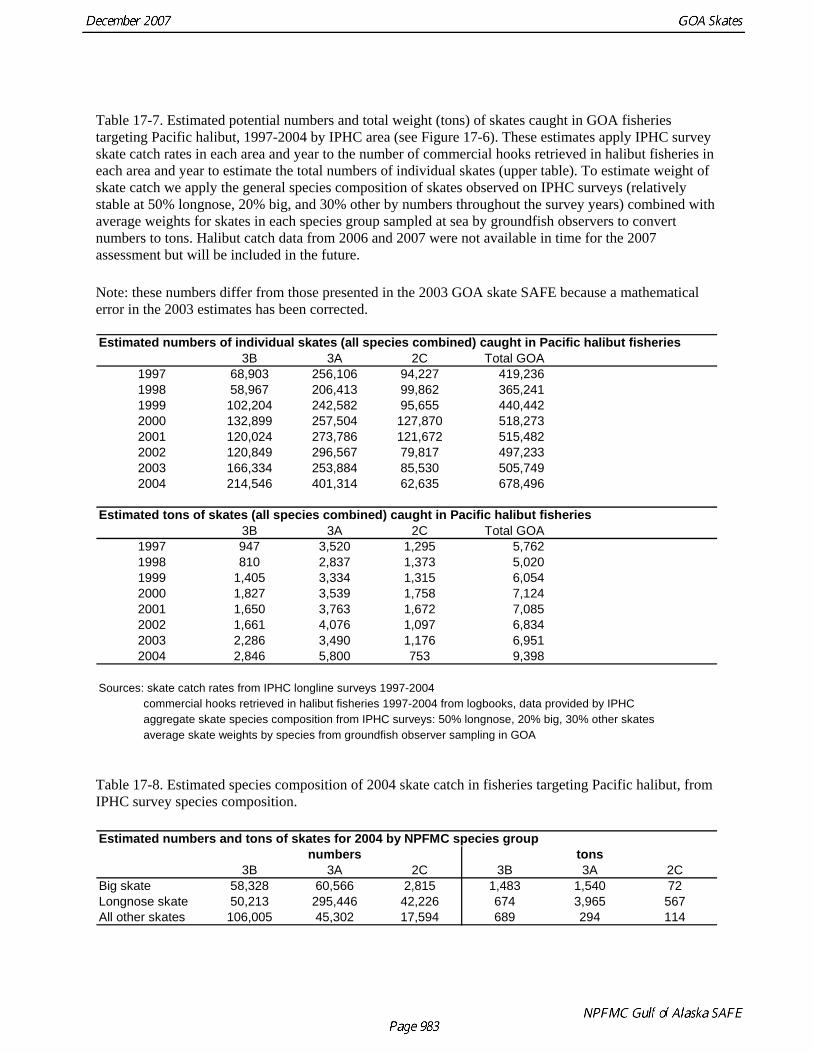
Table 17-7. Estimated potential numbers and total weight (tons) of skates caught in GOA fisheries targeting Pacific halibut, 1997-2004 by IPHC area (see Figure 17-6). These estimates apply IPHC survey skate catch rates in each area and year to the number of commercial hooks retrieved in halibut fisheries in each area and year to estimate the total numbers of individual skates (upper table). To estimate weight of skate catch we apply the general species composition of skates observed on IPHC surveys (relatively stable at 50% longnose, 20% big, and 30% other by numbers throughout the survey years) combined with average weights for skates in each species group sampled at sea by groundfish observers to convert numbers to tons. Halibut catch data from 2006 and 2007 were not available in time for the 2007 assessment but will be included in the future. Note: these numbers differ from those presented in the 2003 GOA skate SAFE because a mathematical error in the 2003 estimates has been corrected. Estimated numbers of individual skates (all species combined) caught in Pacific halibut fisheries
3B 3A 2C Total GOA1997 68,903 256,106 94,227 419,2361998 58,967 206,413 99,862 365,2411999 102,204 242,582 95,655 440,4422000 132,899 257,504 127,870 518,2732001 120,024 273,786 121,672 515,4822002 120,849 296,567 79,817 497,2332003 166,334 253,884 85,530 505,7492004 214,546 401,314 62,635 678,496
Estimated tons of skates (all species combined) caught in Pacific halibut fisheries3B 3A 2C Total GOA
1997 947 3,520 1,295 5,7621998 810 2,837 1,373 5,0201999 1,405 3,334 1,315 6,0542000 1,827 3,539 1,758 7,1242001 1,650 3,763 1,672 7,0852002 1,661 4,076 1,097 6,8342003 2,286 3,490 1,176 6,9512004 2,846 5,800 753 9,398
Sources: skate catch rates from IPHC longline surveys 1997-2004 commercial hooks retrieved in halibut fisheries 1997-2004 from logbooks, data provided by IPHC aggregate skate species composition from IPHC surveys: 50% longnose, 20% big, 30% other skates average skate weights by species from groundfish observer sampling in GOA
Table 17-8. Estimated species composition of 2004 skate catch in fisheries targeting Pacific halibut, from IPHC survey species composition. Estimated numbers and tons of skates for 2004 by NPFMC species group
numbers tons3B 3A 2C 3B 3A 2C
Big skate 58,328 60,566 2,815 1,483 1,540 72Longnose skate 50,213 295,446 42,226 674 3,965 567All other skates 106,005 45,302 17,594 689 294 114
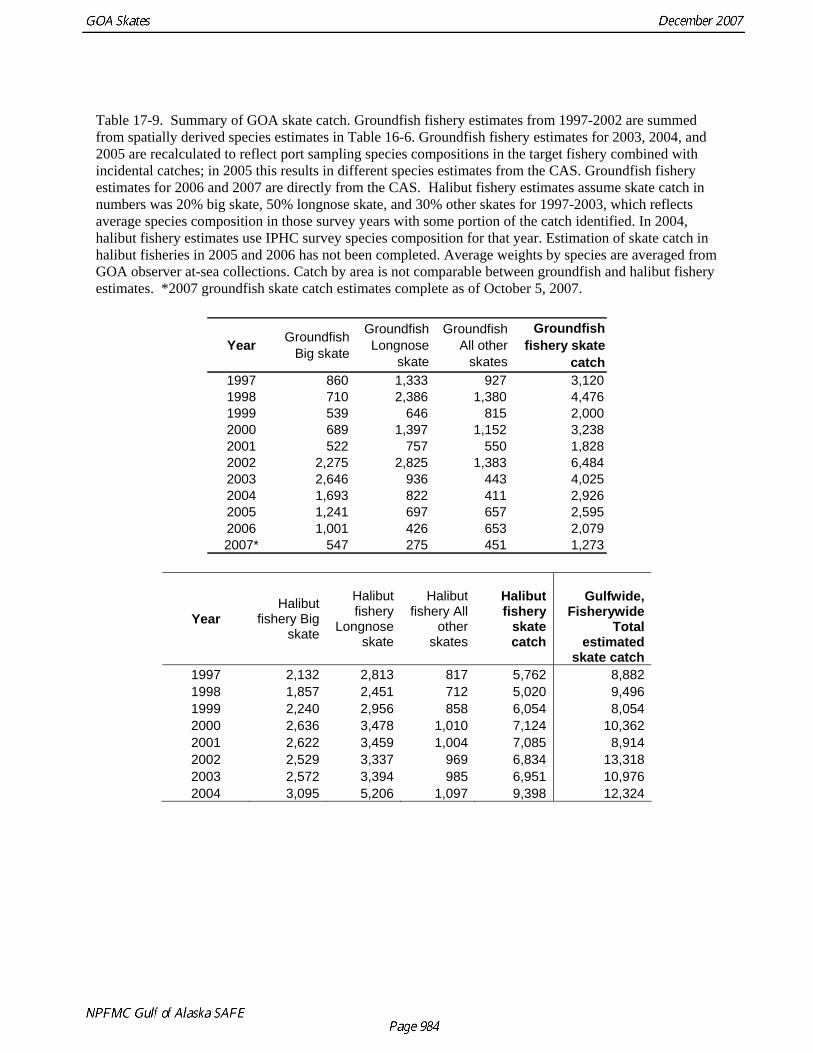
Table 17-9. Summary of GOA skate catch. Groundfish fishery estimates from 1997-2002 are summed from spatially derived species estimates in Table 16-6. Groundfish fishery estimates for 2003, 2004, and 2005 are recalculated to reflect port sampling species compositions in the target fishery combined with incidental catches; in 2005 this results in different species estimates from the CAS. Groundfish fishery estimates for 2006 and 2007 are directly from the CAS. Halibut fishery estimates assume skate catch in numbers was 20% big skate, 50% longnose skate, and 30% other skates for 1997-2003, which reflects average species composition in those survey years with some portion of the catch identified. In 2004, halibut fishery estimates use IPHC survey species composition for that year. Estimation of skate catch in halibut fisheries in 2005 and 2006 has not been completed. Average weights by species are averaged from GOA observer at-sea collections. Catch by area is not comparable between groundfish and halibut fishery estimates. *2007 groundfish skate catch estimates complete as of October 5, 2007.
Year Groundfish Big skate
Groundfish Longnose
skate
Groundfish All other
skates
Groundfish fishery skate
catch1997 860 1,333 927 3,1201998 710 2,386 1,380 4,4761999 539 646 815 2,0002000 689 1,397 1,152 3,2382001 522 757 550 1,8282002 2,275 2,825 1,383 6,4842003 2,646 936 443 4,0252004 1,693 822 411 2,9262005 1,241 697 657 2,5952006 1,001 426 653 2,0792007* 547 275 451 1,273
Halibut fishery Big
skate
Halibut fishery
Longnose skate
Halibut fishery All
other skates
Halibut fishery
skate catch
Gulfwide, Fisherywide
Total estimated
skate catch
Year
1997 2,132 2,813 817 5,762 8,882 1998 1,857 2,451 712 5,020 9,496 1999 2,240 2,956 858 6,054 8,054 2000 2,636 3,478 1,010 7,124 10,362 2001 2,622 3,459 1,004 7,085 8,914 2002 2,529 3,337 969 6,834 13,318 2003 2,572 3,394 985 6,951 10,976 2004 3,095 5,206 1,097 9,398 12,324
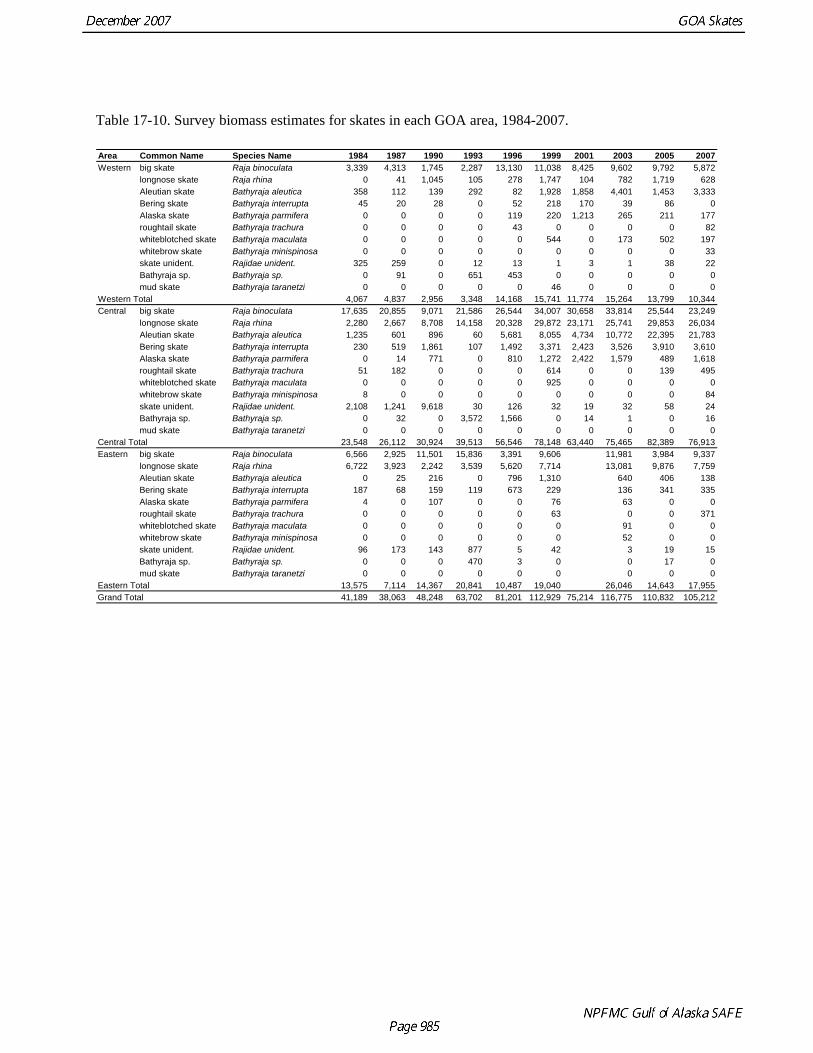
Table 17-10. Survey biomass estimates for skates in each GOA area, 1984-2007. Area Common Name Species Name 1984 1987 1990 1993 1996 1999 2001 2003 2005 2007Western big skate Raja binoculata 3,339 4,313 1,745 2,287 13,130 11,038 8,425 9,602 9,792 5,872
longnose skate Raja rhina 0 41 1,045 105 278 1,747 104 782 1,719 628Aleutian skate Bathyraja aleutica 358 112 139 292 82 1,928 1,858 4,401 1,453 3,333Bering skate Bathyraja interrupta 45 20 28 0 52 218 170 39 86 0Alaska skate Bathyraja parmifera 0 0 0 0 119 220 1,213 265 211 177roughtail skate Bathyraja trachura 0 0 0 0 43 0 0 0 0 82whiteblotched skate Bathyraja maculata 0 0 0 0 0 544 0 173 502 197whitebrow skate Bathyraja minispinosa 0 0 0 0 0 0 0 0 0skate unident. Rajidae unident. 325 259 0 12 13 1 3 1 38 22Bathyraja sp. Bathyraja sp. 0 91 0 651 453 0 0 0 0 0mud skate Bathyraja taranetzi 0 0 0 0 0 46 0 0 0
Western Total 4,067 4,837 2,956 3,348 14,168 15,741 11,774 15,264 13,799 10,344Central big skate Raja binoculata 17,635 20,855 9,071 21,586 26,544 34,007 30,658 33,814 25,544 23,249
longnose skate Raja rhina 2,280 2,667 8,708 14,158 20,328 29,872 23,171 25,741 29,853 26,034Aleutian skate Bathyraja aleutica 1,235 601 896 60 5,681 8,055 4,734 10,772 22,395 21,783Bering skate Bathyraja interrupta 230 519 1,861 107 1,492 3,371 2,423 3,526 3,910 3,610Alaska skate Bathyraja parmifera 0 14 771 0 810 1,272 2,422 1,579 489 1,618roughtail skate Bathyraja trachura 51 182 0 0 0 614 0 0 139 495whiteblotched skate Bathyraja maculata 0 0 0 0 0 925 0 0 0 0whitebrow skate Bathyraja minispinosa 8 0 0 0 0 0 0 0 0skate unident. Rajidae unident. 2,108 1,241 9,618 30 126 32 19 32 58 24Bathyraja sp. Bathyraja sp. 0 32 0 3,572 1,566 0 14 1 0 16mud skate Bathyraja taranetzi 0 0 0 0 0 0 0 0 0
Central Total 23,548 26,112 30,924 39,513 56,546 78,148 63,440 75,465 82,389 76,913Eastern big skate Raja binoculata 6,566 2,925 11,501 15,836 3,391 9,606 11,981 3,984 9,337
longnose skate Raja rhina 6,722 3,923 2,242 3,539 5,620 7,714 13,081 9,876 7,759Aleutian skate Bathyraja aleutica 0 25 216 0 796 1,310 640 406 138Bering skate Bathyraja interrupta 187 68 159 119 673 229 136 341 335Alaska skate Bathyraja parmifera 4 0 107 0 0 76 63 0 0roughtail skate Bathyraja trachura 0 0 0 0 0 63 0 0 371whiteblotched skate Bathyraja maculata 0 0 0 0 0 0 91 0whitebrow skate Bathyraja minispinosa 0 0 0 0 0 0 52 0skate unident. Rajidae unident. 96 173 143 877 5 42 3 19 15Bathyraja sp. Bathyraja sp. 0 0 0 470 3 0 0 17mud skate Bathyraja taranetzi 0 0 0 0 0 0 0 0
Eastern Total 13,575 7,114 14,367 20,841 10,487 19,040 26,046 14,643 17,955Grand Total 41,189 38,063 48,248 63,702 81,201 112,929 75,214 116,775 110,832 105,212
33
0
84
0
00
00
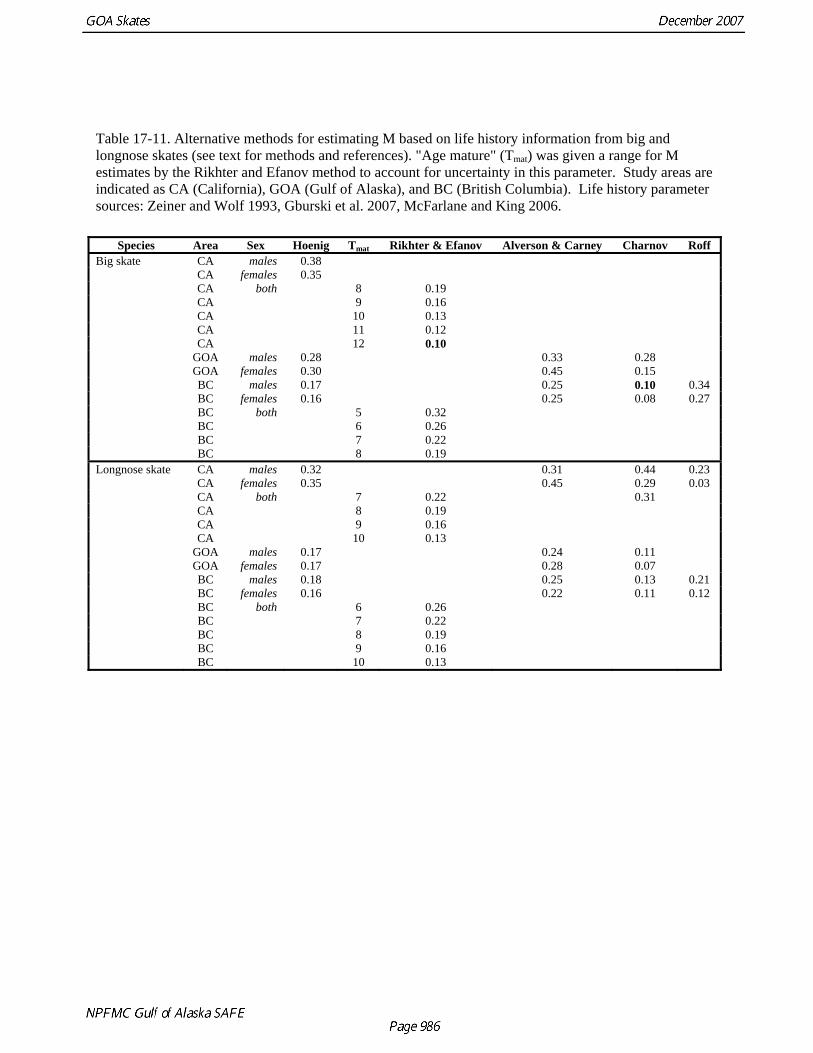
Table 17-11. Alternative methods for estimating M based on life history information from big and longnose skates (see text for methods and references). "Age mature" (Tmat) was given a range for M estimates by the Rikhter and Efanov method to account for uncertainty in this parameter. Study areas are indicated as CA (California), GOA (Gulf of Alaska), and BC (British Columbia). Life history parameter sources: Zeiner and Wolf 1993, Gburski et al. 2007, McFarlane and King 2006.
Species Area Sex Hoenig Tmat Rikhter & Efanov Alverson & Carney Charnov Roff CA males 0.38 Big skate
CA females 0.35 CA both 8 0.19 CA 9 0.16 CA 10 0.13 CA 11 0.12 CA 12 0.10 GOA males 0.28 0.33 0.28 GOA females 0.30 0.45 0.15 BC males 0.17 0.25 0.10 0.34 BC females 0.16 0.25 0.08 0.27 BC both 5 0.32 BC 6 0.26 BC 7 0.22 BC 8 0.19
CA males 0.32 0.31 0.44 0.23 Longnose skate CA females 0.35 0.45 0.29 0.03 CA both 7 0.22 0.31 CA 8 0.19 CA 9 0.16 CA 10 0.13 GOA males 0.17 0.24 0.11 GOA females 0.17 0.28 0.07 BC males 0.18 0.25 0.13 0.21 BC females 0.16 0.22 0.11 0.12 BC both 6 0.26 BC 7 0.22 BC 8 0.19 BC 9 0.16 BC 10 0.13
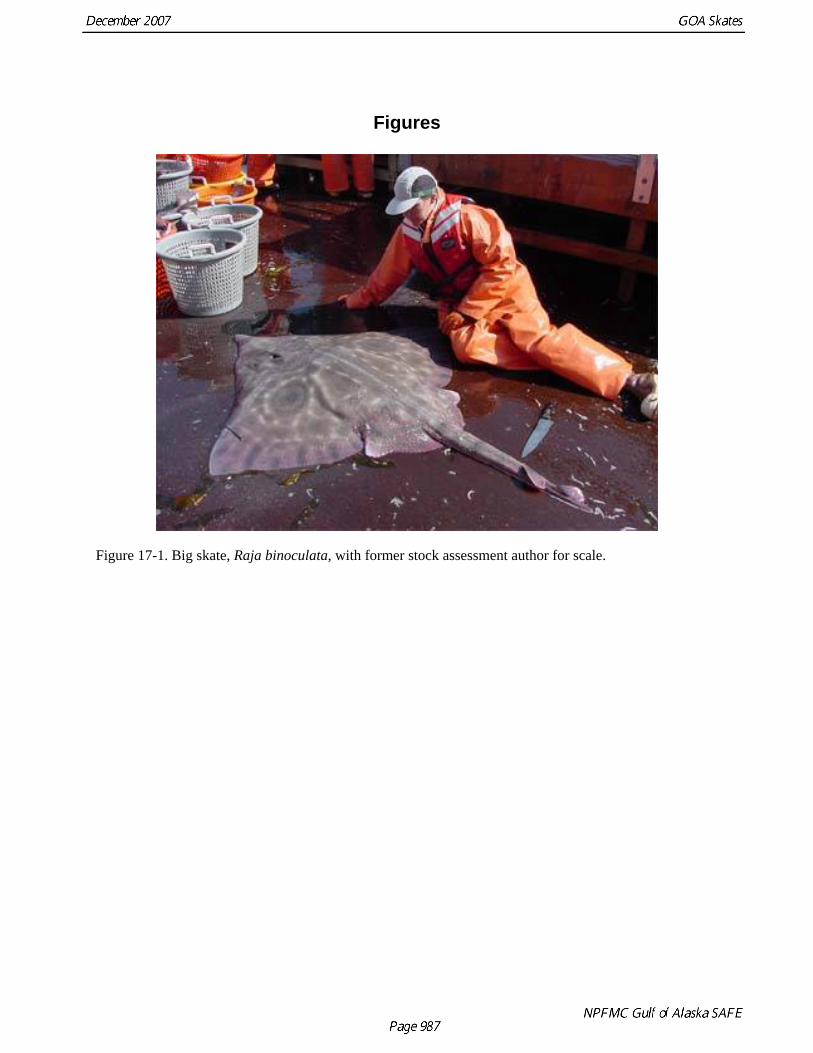
Figures
Figure 17-1. Big skate, Raja binoculata, with former stock assessment author for scale.
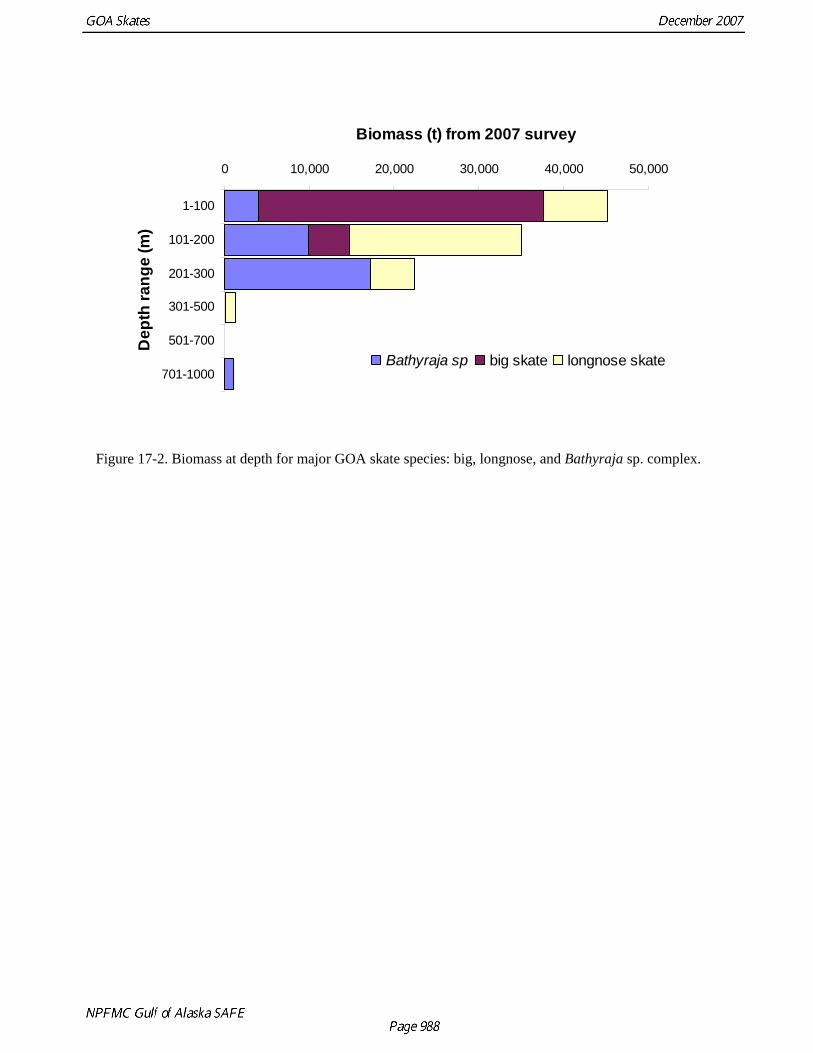
0 10,000 20,000 30,000 40,000 50,000
1-100
101-200
201-300
301-500
501-700
701-1000
Dep
th ra
nge
(m)
Biomass (t) from 2007 survey
Bathyraja sp big skate longnose skate
Figure 17-2. Biomass at depth for major GOA skate species: big, longnose, and Bathyraja sp. complex.
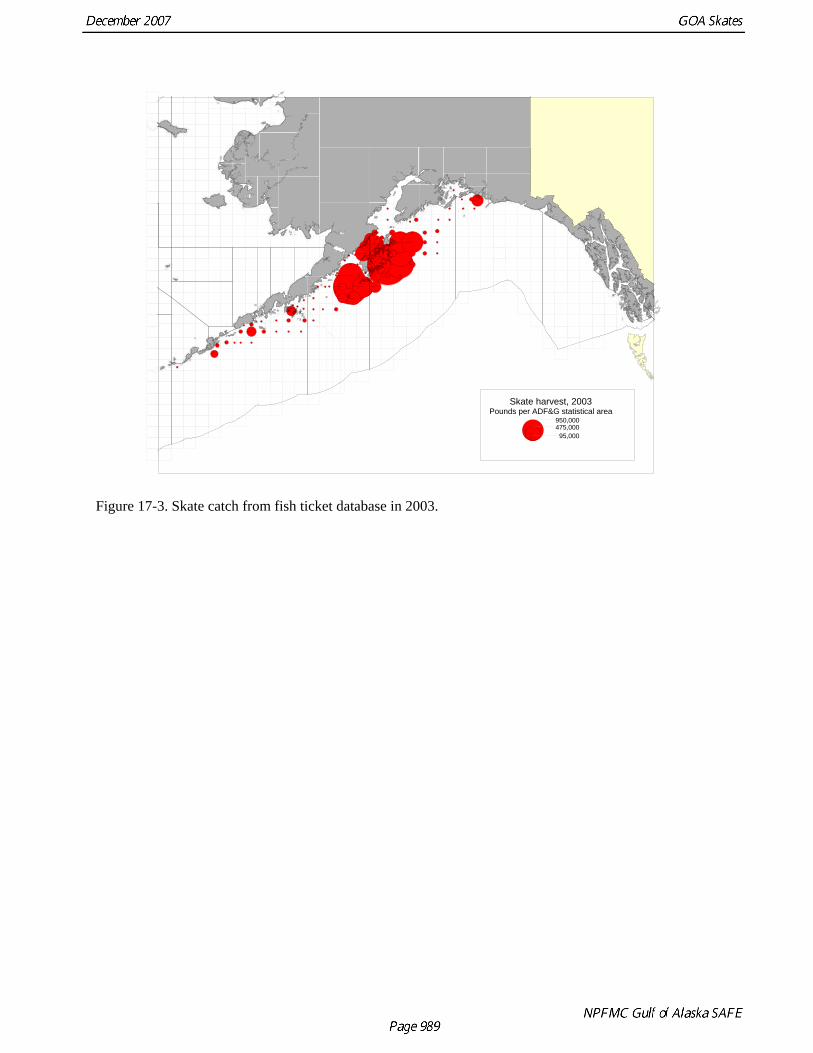
Skate harvest, 2003Pounds per ADF&G statistical area
950,000475,00095,000
Figure 17-3. Skate catch from fish ticket database in 2003.
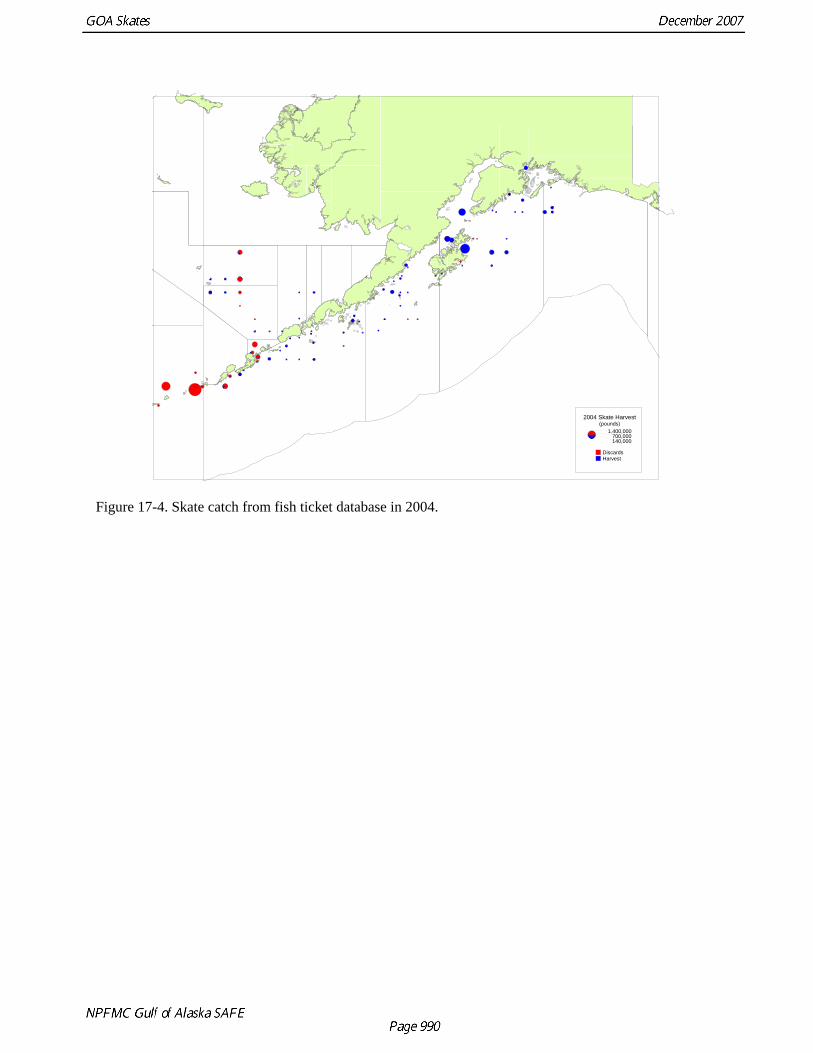
2004 Skate Harvest(pounds)
1,400,000700,000140,000
DiscardsHarvest
Figure 17-4. Skate catch from fish ticket database in 2004.
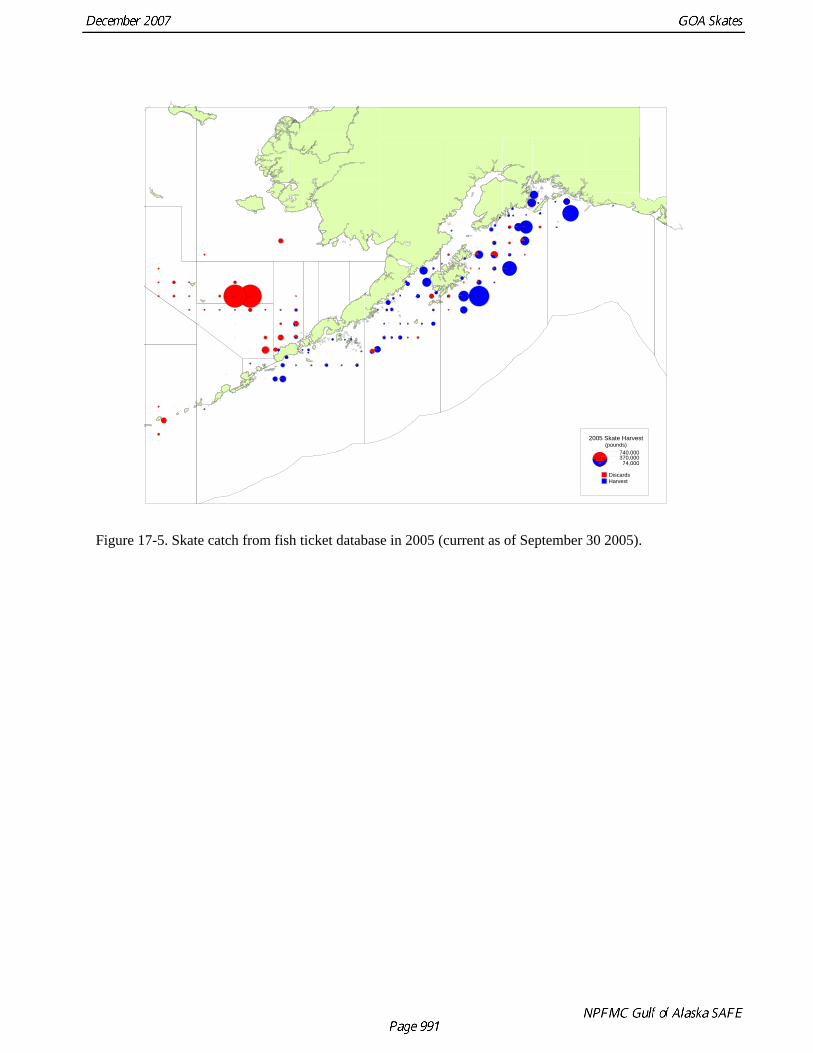
2005 Skate Harvest(pounds)
740,000370,00074,000
DiscardsHarvest
Figure 17-5. Skate catch from fish ticket database in 2005 (current as of September 30 2005).

Figure 17-6. IPHC management areas overlaid on NPFMC management areas in Alaska.
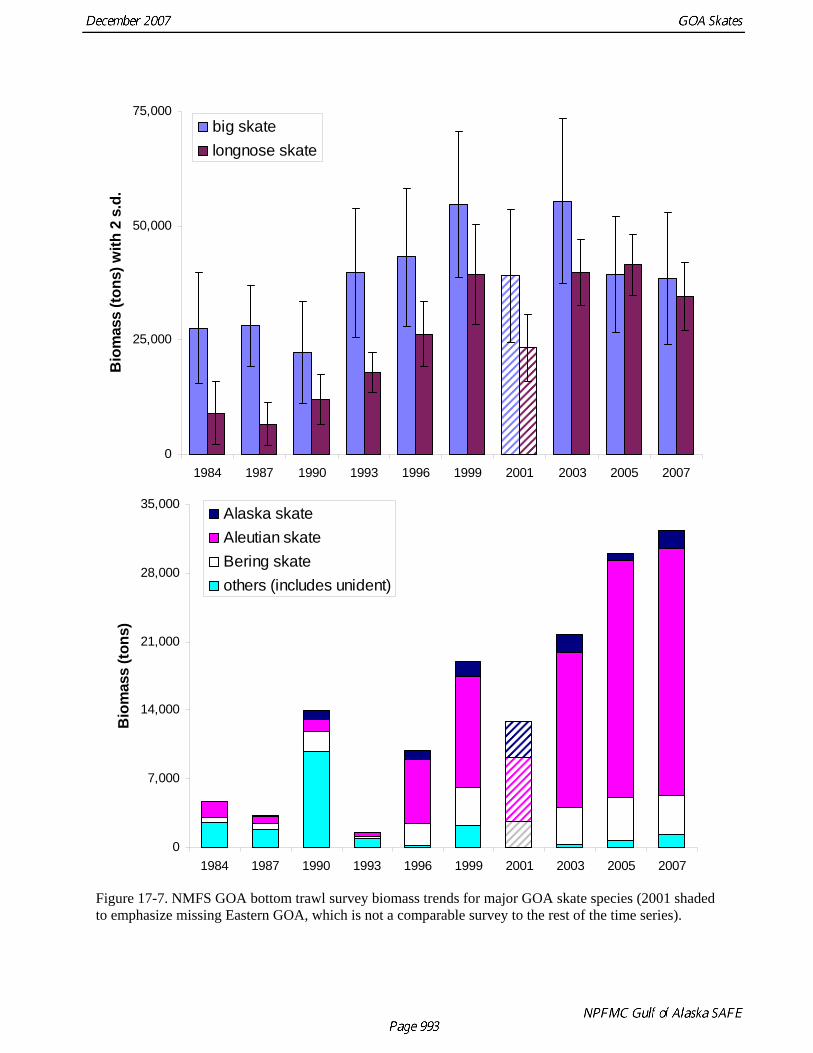
0
25,000
50,000
75,000
1984 1987 1990 1993 1996 1999 2001 2003 2005 2007
Bio
mas
s (to
ns) w
ith 2
s.d
.big skatelongnose skate
0
7,000
14,000
21,000
28,000
35,000
1984 1987 1990 1993 1996 1999 2001 2003 2005 2007
Bio
mas
s (to
ns)
Alaska skateAleutian skateBering skate others (includes unident)
Figure 17-7. NMFS GOA bottom trawl survey biomass trends for major GOA skate species (2001 shaded to emphasize missing Eastern GOA, which is not a comparable survey to the rest of the time series).

Gulfwide 2007
longnose skate33%
big skate36%
Aleutian skate24%
Bering skate 4%
roughtail skate1%
whiteblotched skate
0%
Alaska skate2%
Eastern 2007
big skate52%
longnose skate43%
Alaska skate0%
whiteblotched skate
0% roughtail skate2%
Bering skate 2%Aleutian
skate1%
Western 2007
big skate57%
longnose skate6%
Aleutian skate32%
Bering skate 0%
roughtail skate1%
whiteblotched skate
2%
Alaska skate2%
Central 2007
longnose skate34%
big skate30%
Aleutian skate28%
Alaska skate2%
whiteblotched skate
0%roughtail
skate1%Bering skate
5%
Figure 17-8 Distribution of skate biomass by species in 2007 gulfwide (top) and between areas (bottom).
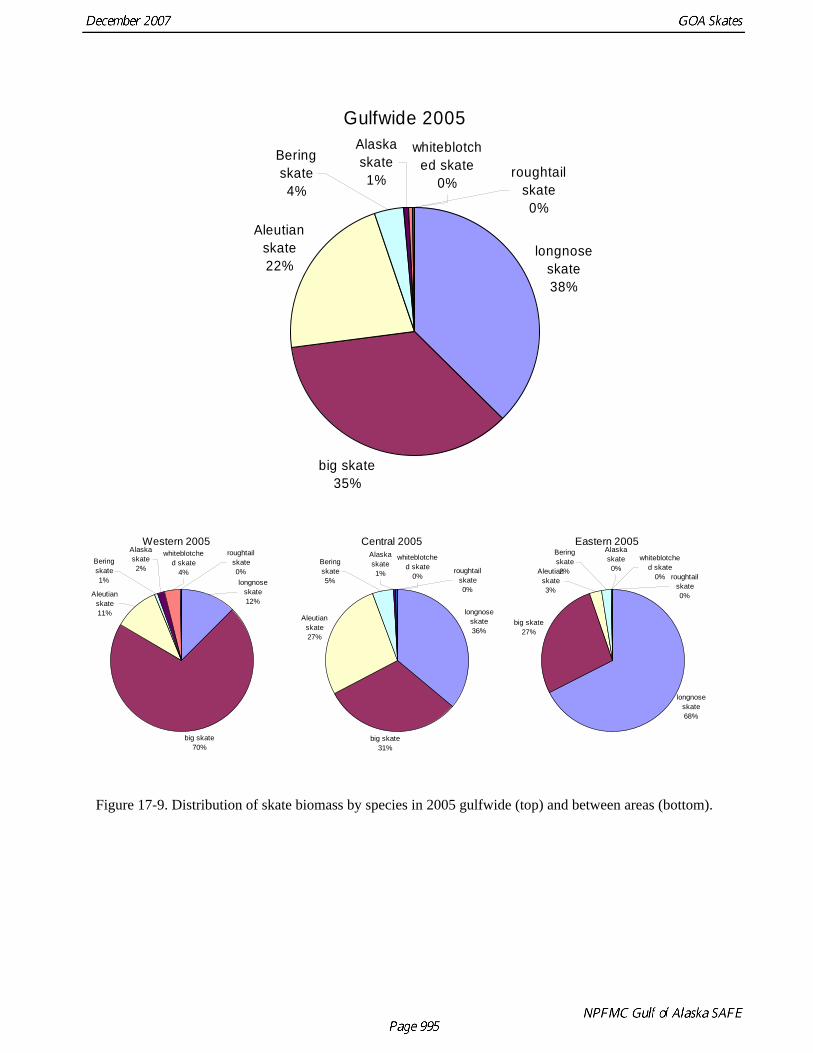
Gulfwide 2005
longnose skate38%
big skate35%
Aleutian skate22%
Alaska skate1%
whiteblotched skate
0%roughtail
skate0%
Bering skate 4%
Western 2005
big skate70%
longnose skate12%
Aleutian skate11%
Bering skate 1%
roughtail skate0%
whiteblotched skate
4%
Alaska skate2%
Central 2005
longnose skate36%
big skate31%
Aleutian skate27%
Bering skate 5%
roughtail skate0%
whiteblotched skate
0%
Alaska skate1%
Eastern 2005
longnose skate68%
big skate27%
Aleutian skate3%
Bering skate 2%
roughtail skate0%
whiteblotched skate
0%
Alaska skate0%
Figure 17-9. Distribution of skate biomass by species in 2005 gulfwide (top) and between areas (bottom).
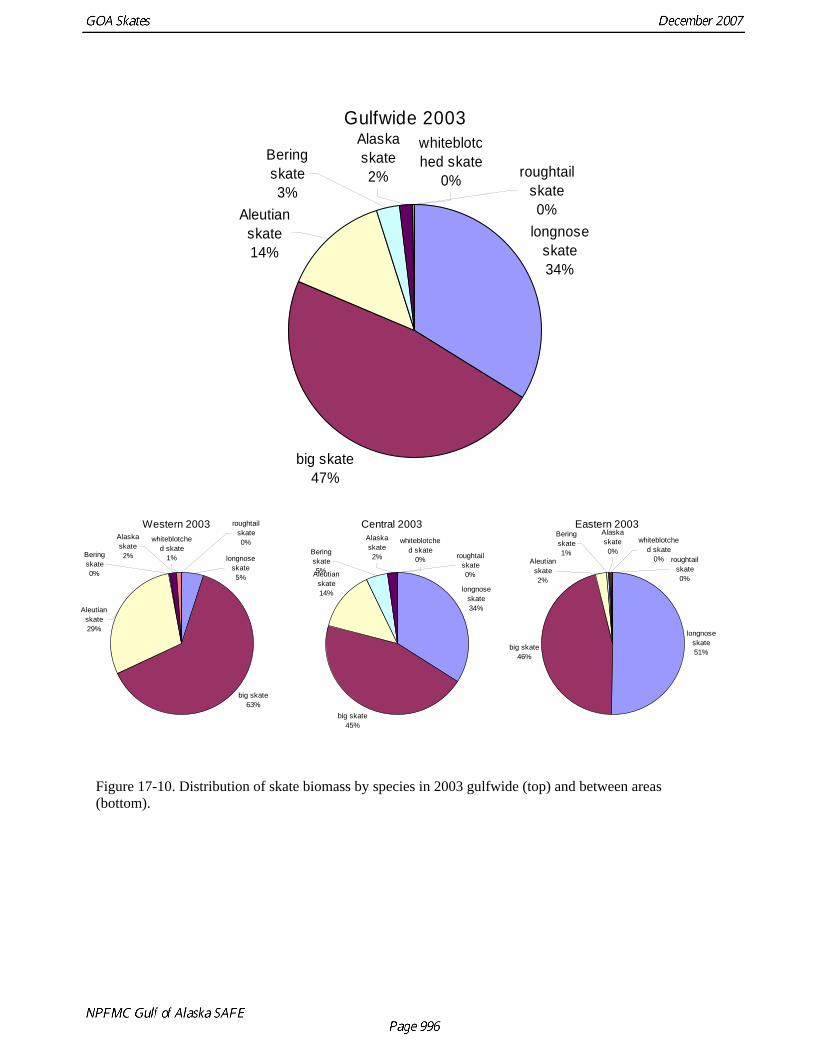
Gulfwide 2003
longnose skate34%
big skate47%
Aleutian skate14%
Alaska skate2%
whiteblotched skate
0% roughtail skate0%
Bering skate 3%
Western 2003
big skate63%
longnose skate5%
Aleutian skate29%
Bering skate 0%
roughtail skate0%whiteblotche
d skate1%
Alaska skate2%
Central 2003
longnose skate34%
big skate45%
Aleutian skate14%
Bering skate 5%
roughtail skate0%
whiteblotched skate
0%
Alaska skate2%
Eastern 2003
longnose skate51%
big skate46%
Aleutian skate2%
Bering skate 1%
roughtail skate0%
whiteblotched skate
0%
Alaska skate0%
Figure 17-10. Distribution of skate biomass by species in 2003 gulfwide (top) and between areas (bottom).
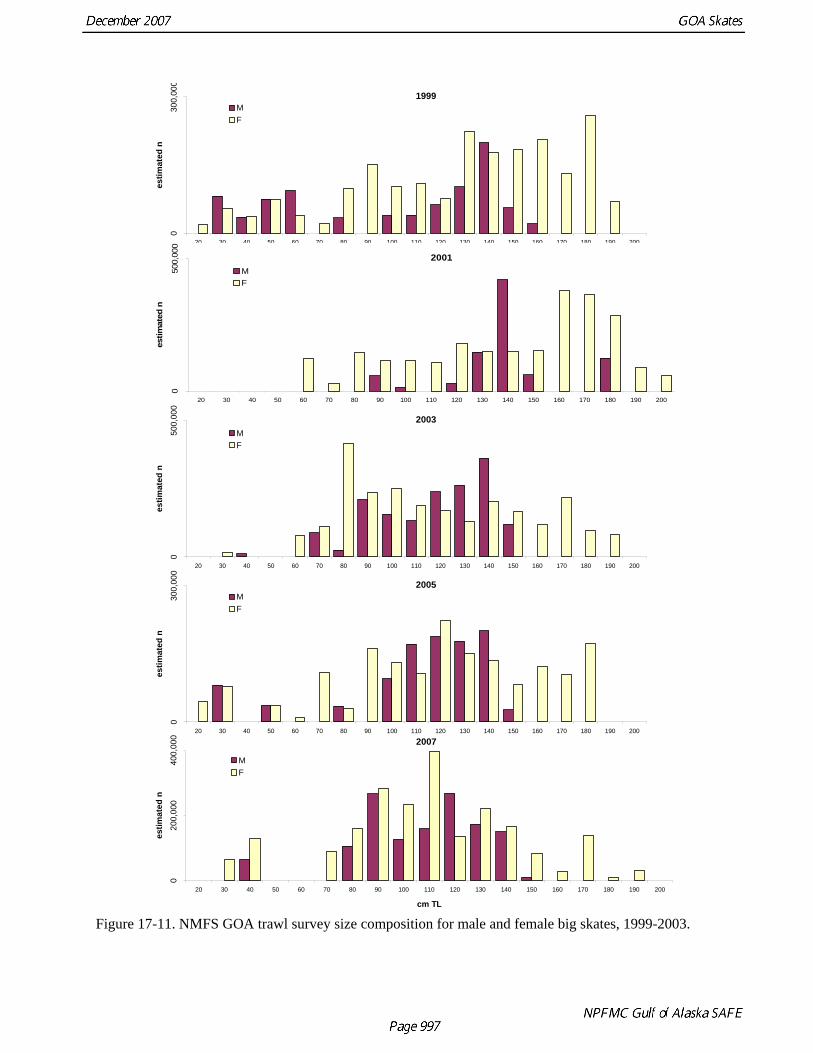
1999
030
0,00
0
20 30 40 50 60 70 80 90 100 110 120 130 140 150 160 170 180 190 200
estim
ated
n
MF
2001
050
0,00
0
20 30 40 50 60 70 80 90 100 110 120 130 140 150 160 170 180 190 200
estim
ated
n
MF
2003
050
0,00
0
20 30 40 50 60 70 80 90 100 110 120 130 140 150 160 170 180 190 200
estim
ated
n
MF
2005
030
0,00
0
20 30 40 50 60 70 80 90 100 110 120 130 140 150 160 170 180 190 200
cm TL
estim
ated
n
MF
2007
020
0,00
040
0,00
0
20 30 40 50 60 70 80 90 100 110 120 130 140 150 160 170 180 190 200
cm TL
estim
ated
n
MF
Figure 17-11. NMFS GOA trawl survey size composition for male and female big skates, 1999-2003.
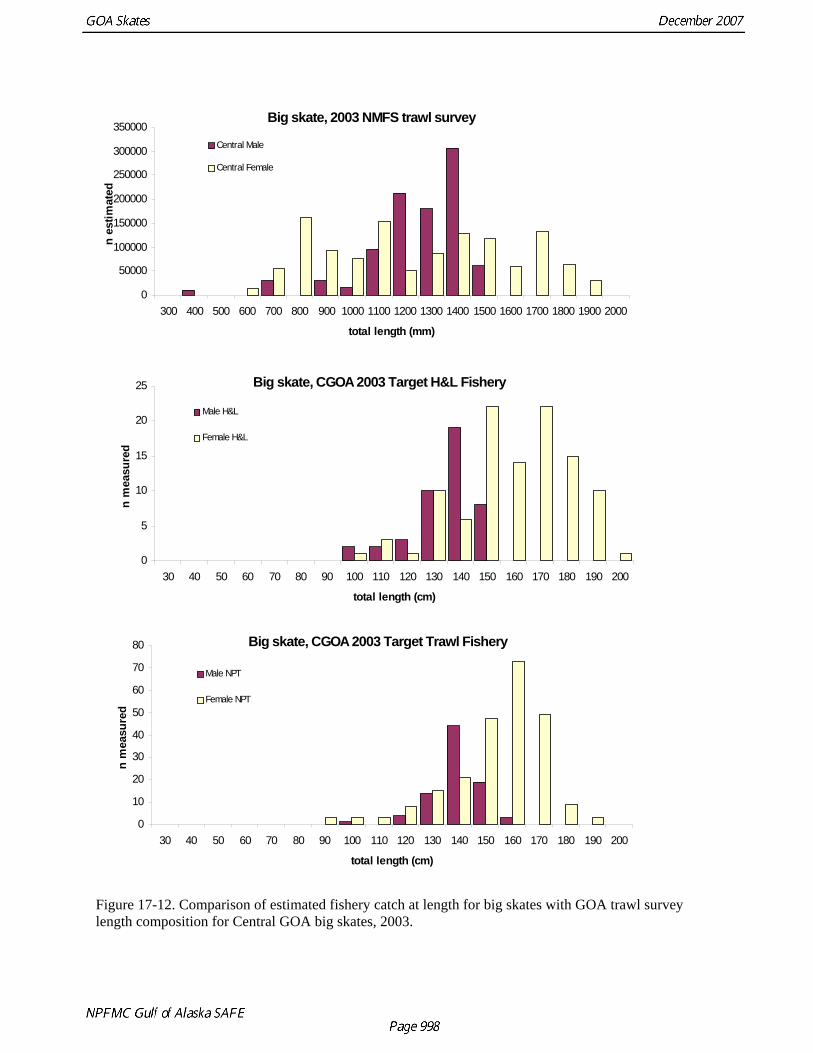
Big skate, 2003 NMFS trawl survey
0
50000
100000
150000
200000
250000
300000
350000
300 400 500 600 700 800 900 1000 1100 1200 1300 1400 1500 1600 1700 1800 1900 2000
total length (mm)
n es
timat
ed
Central Male
Central Female
Big skate, CGOA 2003 Target H&L Fishery
0
5
10
15
20
25
30 40 50 60 70 80 90 100 110 120 130 140 150 160 170 180 190 200
total length (cm)
n m
easu
red
Male H&L
Female H&L
Big skate, CGOA 2003 Target Trawl Fishery
0
10
20
30
40
50
60
70
80
30 40 50 60 70 80 90 100 110 120 130 140 150 160 170 180 190 200
total length (cm)
n m
easu
red
Male NPT
Female NPT
Figure 17-12. Comparison of estimated fishery catch at length for big skates with GOA trawl survey length composition for Central GOA big skates, 2003.
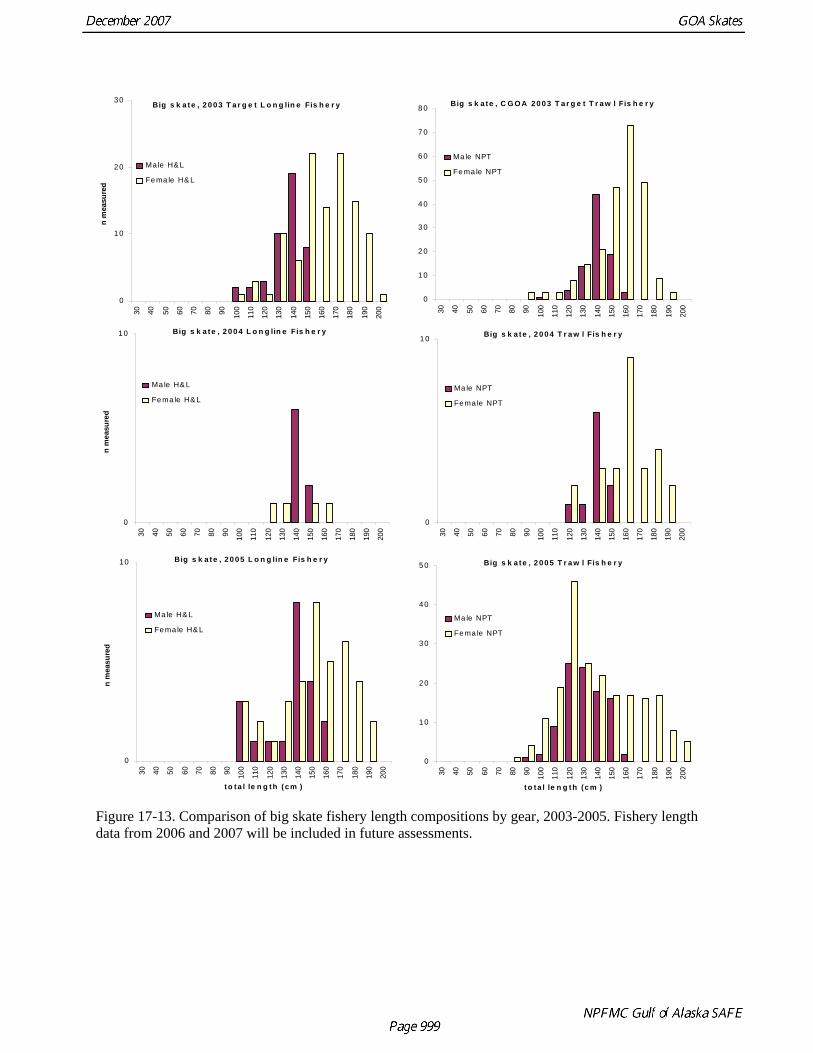
Big s k a te , 2 0 0 4 L o n g lin e Fis h e r y
0
10
30 40 50 60 70 80 90 100
110
120
130
140
150
160
170
180
190
200
n m
easu
red
Ma le H& L
Fe ma le H& L
Big s k a te , 2 0 0 5 L o n g lin e Fis h e r y
0
10
30 40 50 60 70 80 90 100
110
120
130
140
150
160
170
180
190
200
to ta l le n g th (c m )
n m
easu
red
Ma le H& L
Fe ma le H& L
Big s k a te , 2 0 0 4 T r a w l Fis h e r y
0
1 0
30 40 50 60 70 80 90 100
110
120
130
140
150
160
170
180
190
200
Ma le NPT
Fe ma le NPT
Big s k a te , 2 0 0 5 T r a w l Fis h e r y
0
1 0
2 0
3 0
4 0
5 0
30 40 50 60 70 80 90 100
110
120
130
140
150
160
170
180
190
200
to ta l le n g th (c m )
Ma le NPT
Fe ma le NPT
Big s k a te , 2 0 0 3 T a r g e t L o n g lin e Fis h e r y
0
10
20
30
30 40 50 60 70 80 90 100
110
120
130
140
150
160
170
180
190
200
n m
easu
red
Ma le H& L
Fe ma le H& L
Big s k a te , C G O A 20 0 3 T a r g e t T r a w l Fis h e r y
0
1 0
2 0
3 0
4 0
5 0
6 0
7 0
8 0
30 40 50 60 70 80 90 100
110
120
130
140
150
160
170
180
190
200
Ma le NPT
Fe ma le NPT
Figure 17-13. Comparison of big skate fishery length compositions by gear, 2003-2005. Fishery length data from 2006 and 2007 will be included in future assessments.
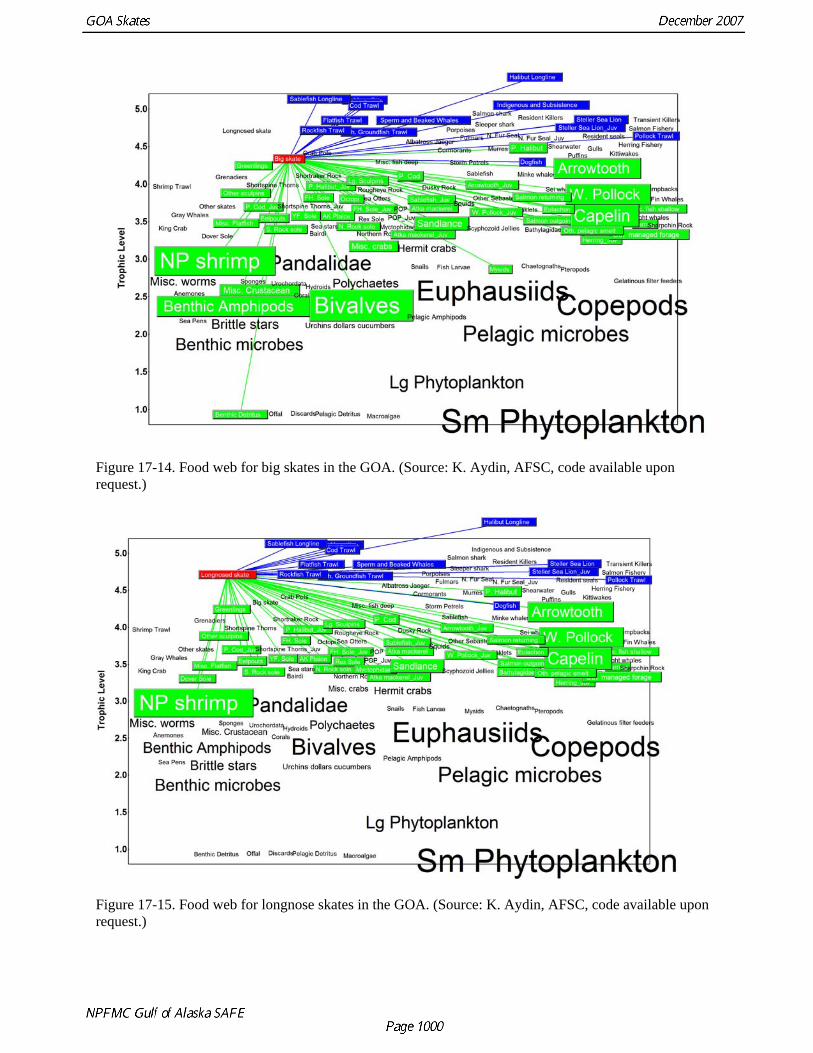
Figure 17-14. Food web for big skates in the GOA. (Source: K. Aydin, AFSC, code available upon request.)
Figure 17-15. Food web for longnose skates in the GOA. (Source: K. Aydin, AFSC, code available upon request.)
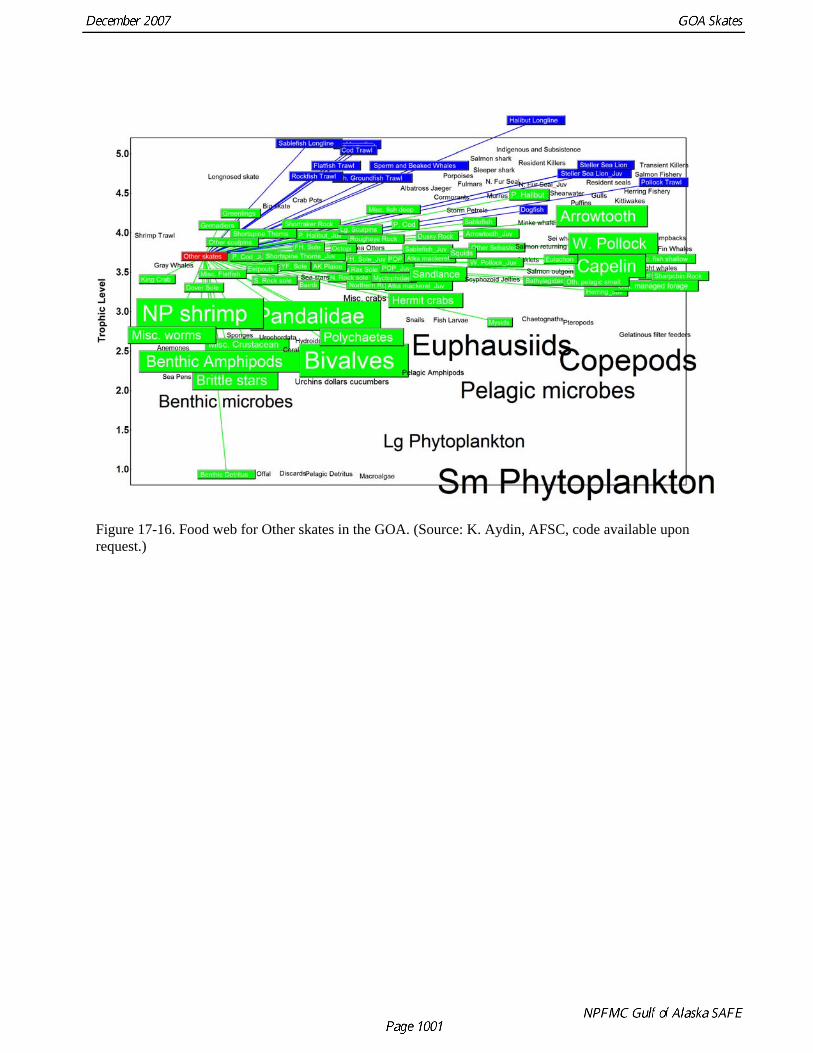
Figure 17-16. Food web for Other skates in the GOA. (Source: K. Aydin, AFSC, code available upon request.)
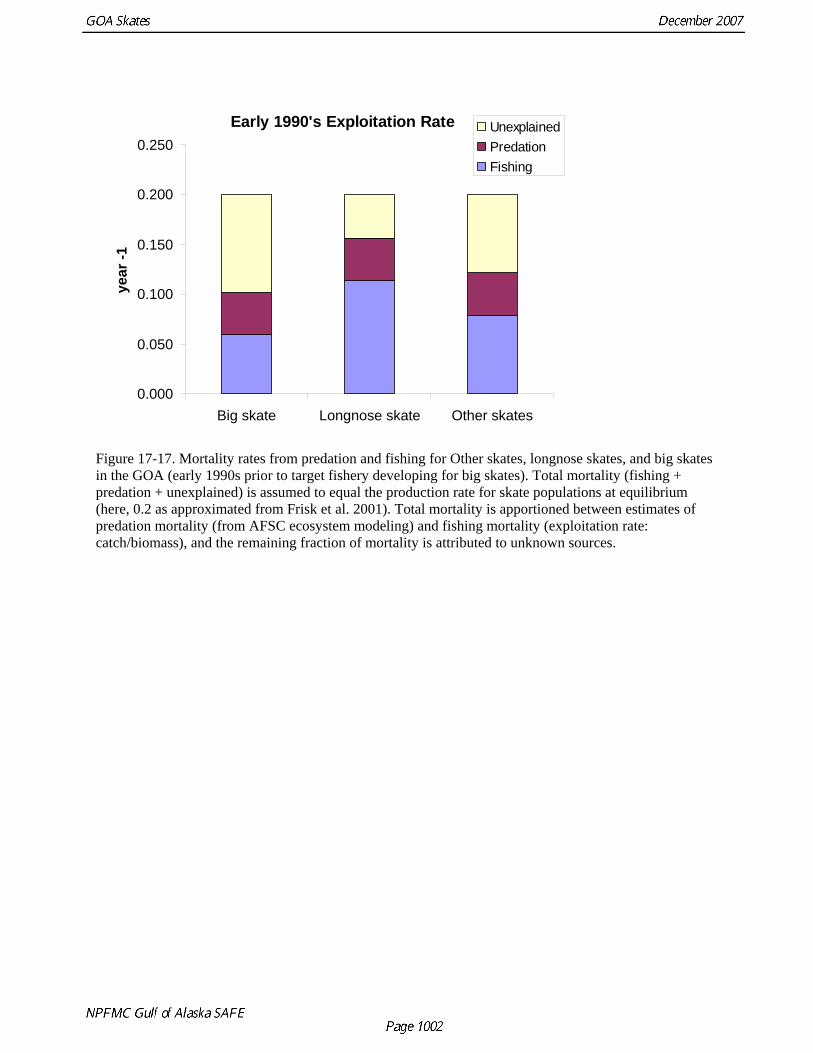
Early 1990's Exploitation Rate
0.000
0.050
0.100
0.150
0.200
0.250
Big skate Longnose skate Other skates
year
-1UnexplainedPredationFishing
Figure 17-17. Mortality rates from predation and fishing for Other skates, longnose skates, and big skates in the GOA (early 1990s prior to target fishery developing for big skates). Total mortality (fishing + predation + unexplained) is assumed to equal the production rate for skate populations at equilibrium (here, 0.2 as approximated from Frisk et al. 2001). Total mortality is apportioned between estimates of predation mortality (from AFSC ecosystem modeling) and fishing mortality (exploitation rate: catch/biomass), and the remaining fraction of mortality is attributed to unknown sources.
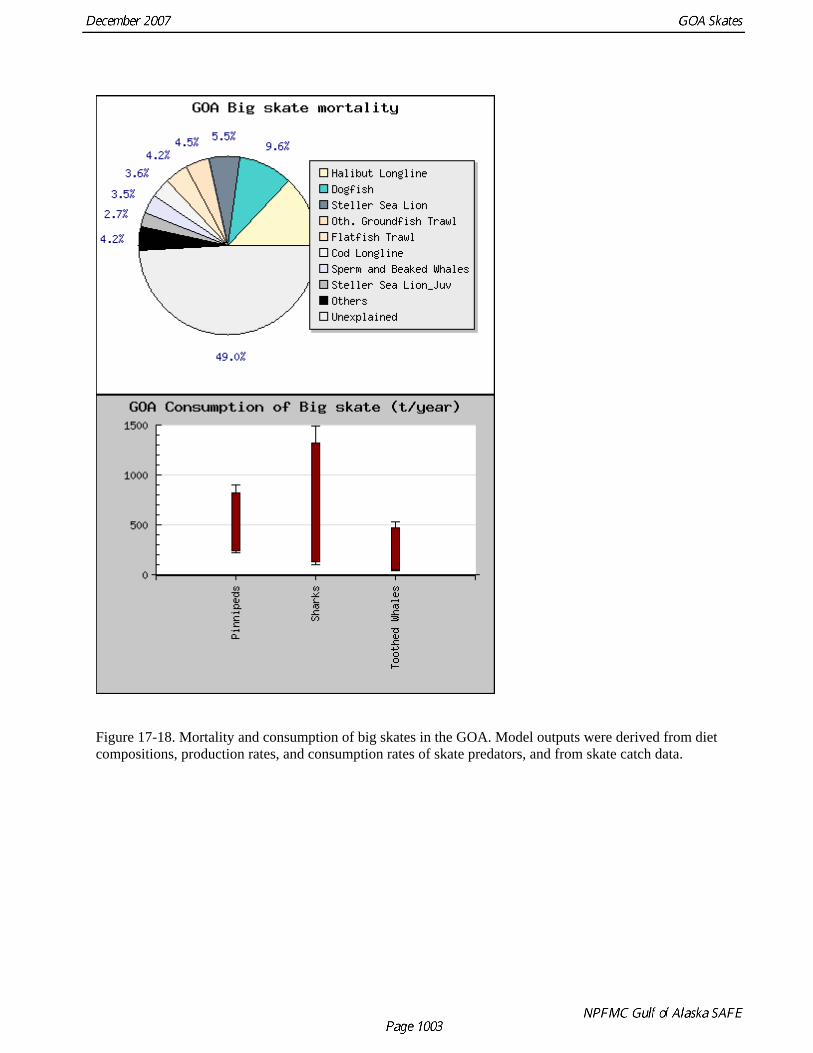
Figure 17-18. Mortality and consumption of big skates in the GOA. Model outputs were derived from diet compositions, production rates, and consumption rates of skate predators, and from skate catch data.
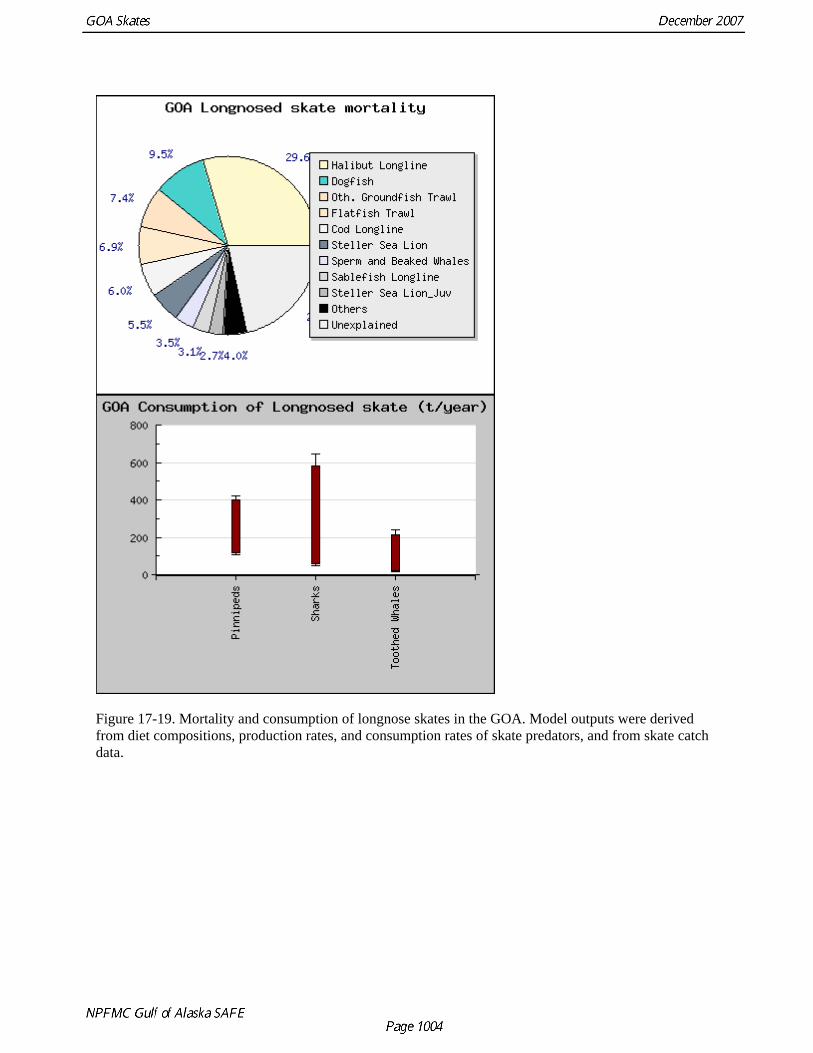
Figure 17-19. Mortality and consumption of longnose skates in the GOA. Model outputs were derived from diet compositions, production rates, and consumption rates of skate predators, and from skate catch data.
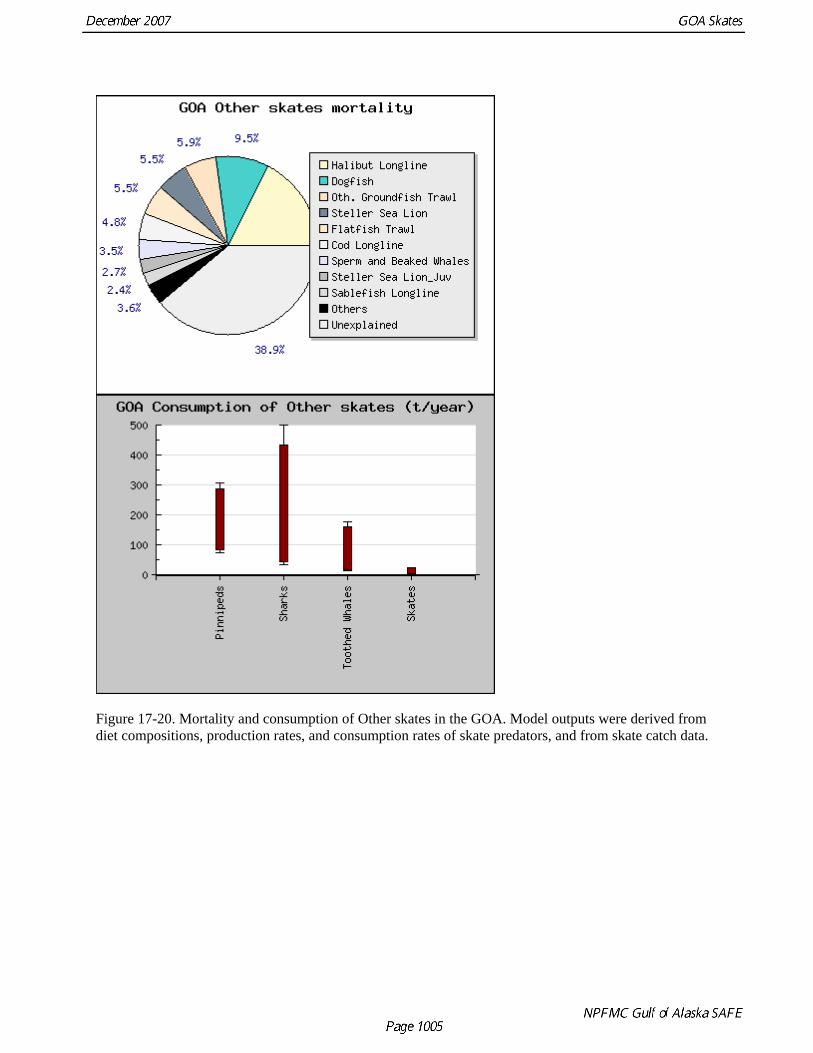
Figure 17-20. Mortality and consumption of Other skates in the GOA. Model outputs were derived from diet compositions, production rates, and consumption rates of skate predators, and from skate catch data.
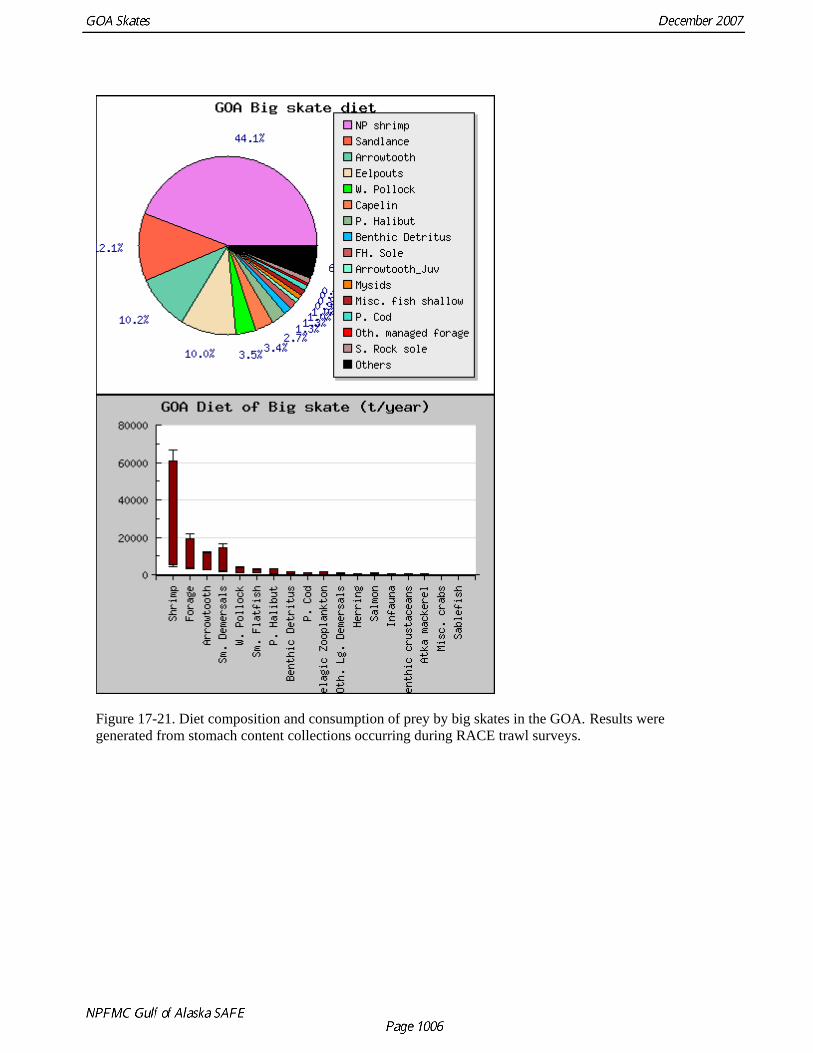
Figure 17-21. Diet composition and consumption of prey by big skates in the GOA. Results were generated from stomach content collections occurring during RACE trawl surveys.
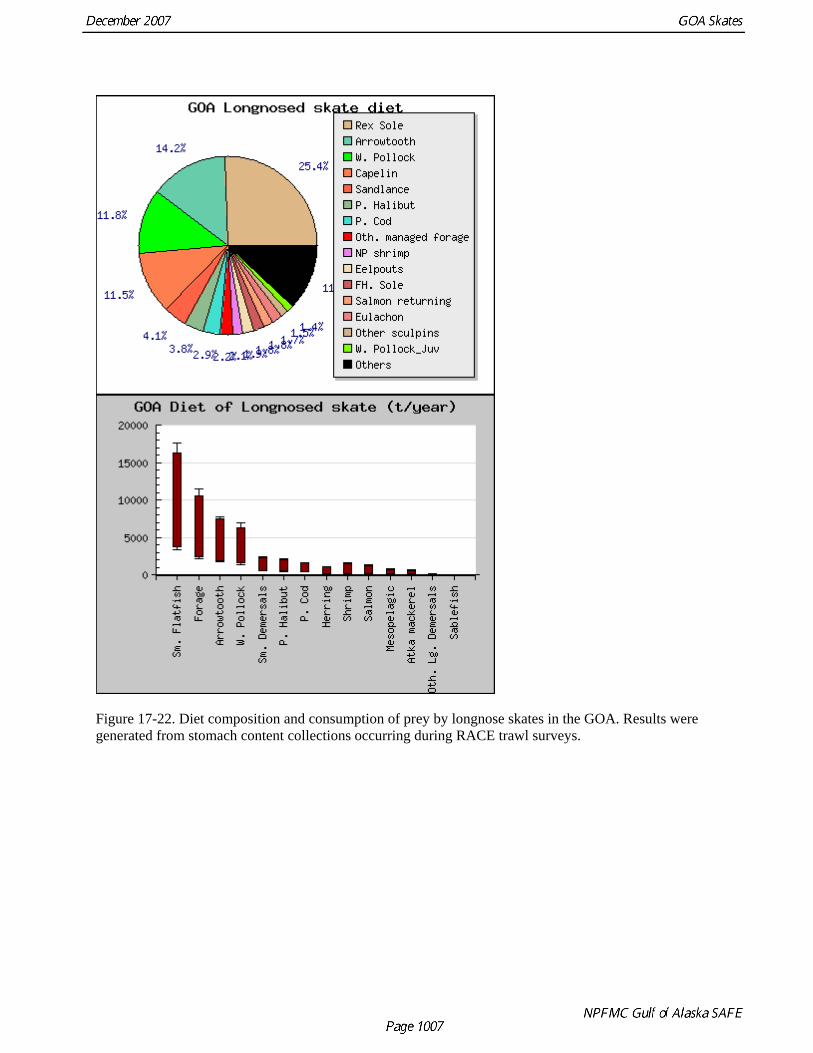
Figure 17-22. Diet composition and consumption of prey by longnose skates in the GOA. Results were generated from stomach content collections occurring during RACE trawl surveys.
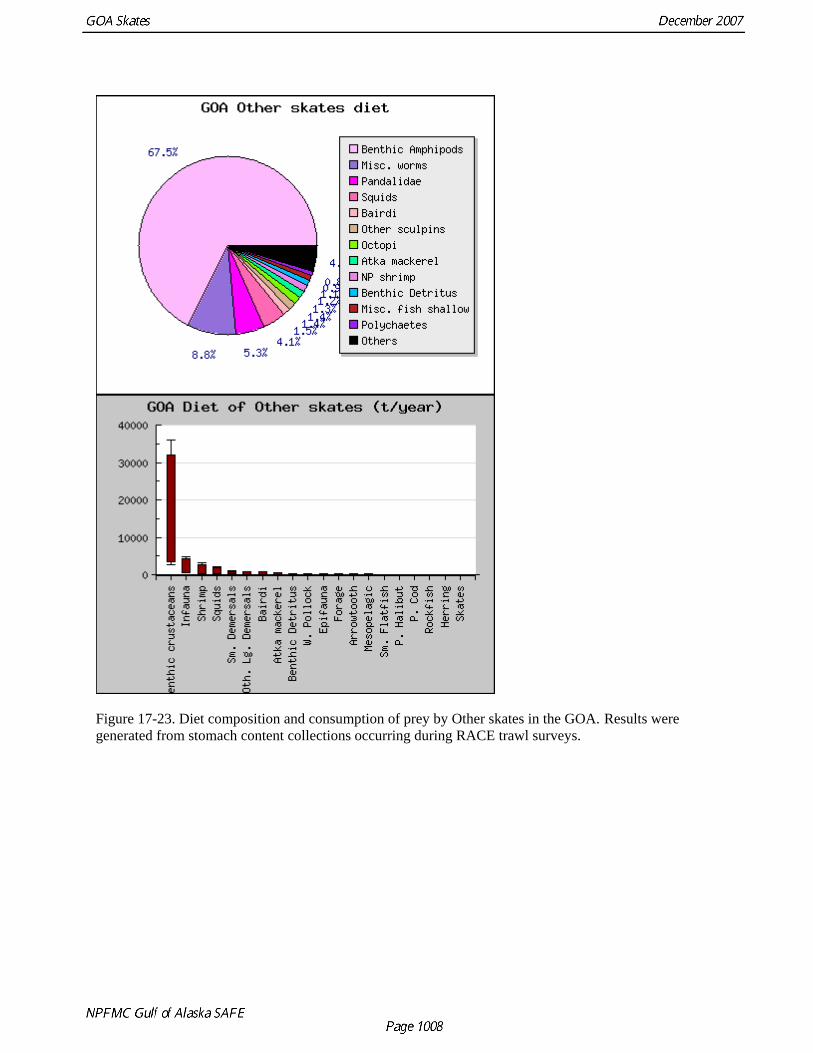
Figure 17-23. Diet composition and consumption of prey by Other skates in the GOA. Results were generated from stomach content collections occurring during RACE trawl surveys.


![RollerSkating_Competition.doc [.pdf] · Web viewSkates Artistic roller skaters most commonly skate on traditional quad skates. Skates designed for artistic skating typically have](https://static.fdocuments.us/doc/165x107/5fc260ba44928179575644e6/rollerskating-pdf-web-view-skates-artistic-roller-skaters-most-commonly-skate.jpg)