1605-1927944 Hartford Healthcare Corporation and ...
57
Ernst & Young LLP C ONSOLIDATED F INANCIAL S TATEMENTS AND S UPPLEMENTARY I NFORMATION Hartford HealthCare Corporation and Subsidiaries Years Ended September 30, 2016 and 2015 With Report of Independent Auditors
Transcript of 1605-1927944 Hartford Healthcare Corporation and ...

Ernst & Young LLP
C O N S O L I D A T E D F I N A N C I A L S T A T E M E N T S A N D S U P P L E M E N T A R Y I N F O R M A T I O N
Hartford HealthCare Corporation and Subsidiaries Years Ended September 30, 2016 and 2015 With Report of Independent Auditors

Hartford HealthCare Corporation and Subsidiaries
Consolidated Financial Statements and Supplementary Information
Years Ended September 30, 2016 and 2015
Contents
Report of Independent Auditors.......................................................................................................1
Consolidated Financial Statements
Consolidated Balance Sheets ...........................................................................................................3 Consolidated Statements of Operations and Changes in Net Assets ...............................................4 Consolidated Statements of Cash Flows ..........................................................................................6 Notes to Consolidated Financial Statements ....................................................................................7
Supplementary Information
Consolidating Balance Sheet .........................................................................................................52 Consolidating Statement of Operations .........................................................................................53

A member firm of Ernst & Young Global Limited
Ernst & Young LLP 20 Church Street Hartford, CT 06103
Tel: +1 860 247 3100 Fax: +1 860 725 6040 ey.com
1
Report of Independent Auditors
The Board of Directors Hartford HealthCare Corporation
We have audited the accompanying consolidated financial statements of Hartford HealthCare Corporation and Subsidiaries (the Corporation), which comprise the consolidated balance sheets as of September 30, 2016 and 2015, and the related consolidated statements of operations and changes in net assets and cash flows for the years then ended, and the related notes to the consolidated financial statements.
Management’s Responsibility for the Financial Statements
Management is responsible for the preparation and fair presentation of these financial statements in conformity with U.S. generally accepted accounting principles; this includes the design, implementation, and maintenance of internal control relevant to the preparation and fair presentation of financial statements that are free of material misstatement, whether due to fraud or error.
Auditor’s Responsibility
Our responsibility is to express an opinion on these financial statements based on our audits. We conducted our audits in accordance with auditing standards generally accepted in the United States. Those standards require that we plan and perform the audit to obtain reasonable assurance about whether the financial statements are free of material misstatement.
An audit involves performing procedures to obtain audit evidence about the amounts and disclosures in the financial statements. The procedures selected depend on the auditor’s judgment, including the assessment of the risks of material misstatement of the financial statements, whether due to fraud or error. In making those risk assessments, the auditor considers internal control relevant to the entity’s preparation and fair presentation of the financial statements in order to design audit procedures that are appropriate in the circumstances, but not for the purpose of expressing an opinion on the effectiveness of the entity’s internal control. Accordingly, we express no such opinion. An audit also includes evaluating the appropriateness of accounting policies used and the reasonableness of significant accounting estimates made by management, as well as evaluating the overall presentation of the financial statements.
We believe that the audit evidence we have obtained is sufficient and appropriate to provide a basis for our audit opinion.

A member firm of Ernst & Young Global Limited
2
Opinion
In our opinion, the financial statements referred to above present fairly, in all material respects, the consolidated financial position of Hartford HealthCare Corporation and Subsidiaries at September 30, 2016 and 2015, and the consolidated results of their operations and changes in net assets and their cash flows for the years then ended in conformity with U.S. generally accepted accounting principles.
Supplementary Information
Our audits were conducted for the purpose of forming an opinion on the consolidated financial statements as a whole. The accompanying consolidating balance sheet and consolidating statement of operations are presented for purposes of additional analysis and are not a required part of the consolidated financial statements. Such information is the responsibility of management and was derived from and relates directly to the underlying accounting and other records used to prepare the consolidated financial statements. The information has been subjected to the auditing procedures applied in the audits of the consolidated financial statements and certain additional procedures, including comparing and reconciling such information directly to the underlying accounting and other records used to prepare the consolidated financial statements or to the consolidated financial statements themselves, and other additional procedures in accordance with auditing standards generally accepted in the United States. In our opinion, the information is fairly stated, in all material respects, in relation to the consolidated financial statements as a whole.
December 23, 2016

2016 2015
AssetsCurrent assets:
Cash and cash equivalents 293,434$ 376,098$ Accounts receivable, less allowances for doubtful accounts of approximately
$48,392 in 2016 and $59,648 in 2015 315,862 296,632 Other receivables 24,889 33,815 Inventories of supplies 32,633 30,961 Prepaid expenses and other current assets 30,666 25,231 Current portion of assets whose use is limited 13,047 5,448
Total current assets 710,531 768,185
Assets whose use is limited:Investments and other assets 856,411 586,037 Investments for restricted purposes 290,038 296,717 Escrow funds for long-term debt 73,457 120,177 Funds designated for debt service 20,896 20,825 Investments held by HHCISL 205,072 223,799
1,445,874 1,247,555
Funds held in trust by others 177,904 169,546 Investments 84,840 68,809 Other assets 93,226 98,877 Property, plant, and equipment, net 1,249,387 1,146,890 Total assets 3,761,762$ 3,499,862$
Liabilities and net assetsCurrent liabilities:
Accounts payable 92,215$ 87,107$ Salaries, wages, payroll taxes, and amounts withheld
from employees 103,571 84,180 Accrued expenses 120,779 97,103 Estimated third-party payor settlements 50,436 66,491 Current portion of long-term debt and capital leases 52,582 44,207 Current portion of accrued pension liabilities 6,197 11,453 Current portion of self insurance liabilities and other liabilities 53,938 34,470
Total current liabilities 479,718 425,011
Long-term debt and capital leases, less current portion 841,601 836,308 Accrued pension liabilities, less current portion 690,103 499,491 Other liabilities, less current portion 51,653 57,044 Self insurance liabilities, less current portion 132,389 140,854 Total liabilities 2,195,464 1,958,708
Net assets:Unrestricted 1,087,549 1,094,448 Unrestricted attributable to noncontrolling interest 3,018 – Temporarily restricted 193,564 174,109 Permanently restricted 282,167 272,597
Total net assets 1,566,298 1,541,154 Total liabilities and net assets 3,761,762$ 3,499,862$
See accompanying notes.
Hartford HealthCare Corporation and Subsidiaries
Consolidated Balance Sheets
September 30
(In Thousands)
3

2016 2015
Unrestricted revenues, gains and other support:Net patient service revenue 2,388,492$ 2,306,509$ Provision for bad debts 37,690 50,054 Net patient service revenue less provision for bad debts 2,350,802 2,256,455 Other operating revenue 300,042 194,274 Net assets released from restrictions for operations 13,087 14,350
2,663,931 2,465,079
Operating expenses: Salaries and wages 1,177,584 1,130,555 Employee benefits 277,448 286,294 Supplies and other 480,680 479,777 Purchased services 426,172 379,726 Depreciation and amortization 138,197 126,328 Provision for non-patient bad debts 616 5,997 Interest 27,681 25,328
2,528,378 2,434,005
Income from operations 135,553 31,074
Nonoperating income (loss):Income (loss) from investments, net 90,367 (10,636) Other (8,774) (3,799)
81,593 (14,435)
Excess of revenues over expenses, before net income attributableto noncontrolling interest in joint ventures 217,146 16,639
Less: net income attributable to noncontrolling interest in jointventures (9,907) –
Excess of revenues over expenses 207,239$ 16,639$
Continued on next page.
Hartford HealthCare Corporation and Subsidiaries
Consolidated Statements of Operations and Changes in Net Assets
Year Ended September 30
(In Thousands)
4
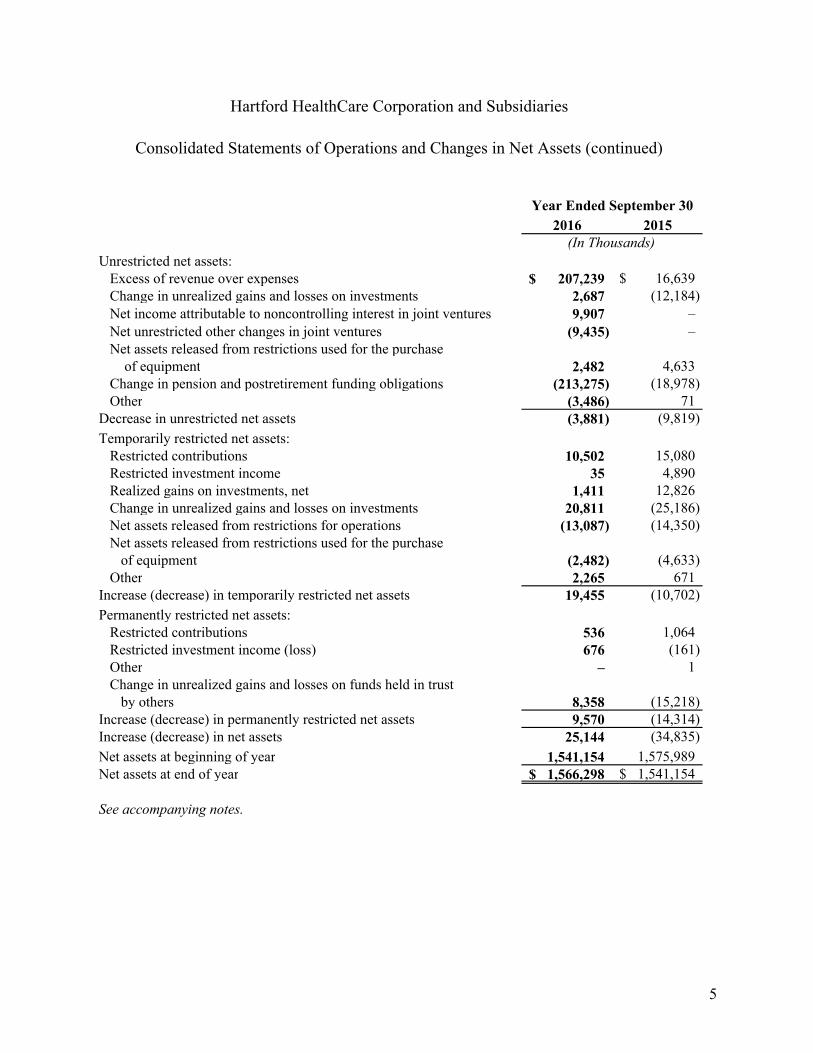
2016 2015
Unrestricted net assets:Excess of revenue over expenses 207,239$ 16,639$ Change in unrealized gains and losses on investments 2,687 (12,184) Net income attributable to noncontrolling interest in joint ventures 9,907 – Net unrestricted other changes in joint ventures (9,435) – Net assets released from restrictions used for the purchase
of equipment 2,482 4,633 Change in pension and postretirement funding obligations (213,275) (18,978) Other (3,486) 71
Decrease in unrestricted net assets (3,881) (9,819)
Temporarily restricted net assets:Restricted contributions 10,502 15,080 Restricted investment income 35 4,890 Realized gains on investments, net 1,411 12,826 Change in unrealized gains and losses on investments 20,811 (25,186) Net assets released from restrictions for operations (13,087) (14,350) Net assets released from restrictions used for the purchase
of equipment (2,482) (4,633) Other 2,265 671
Increase (decrease) in temporarily restricted net assets 19,455 (10,702)
Permanently restricted net assets:Restricted contributions 536 1,064 Restricted investment income (loss) 676 (161) Other – 1 Change in unrealized gains and losses on funds held in trust
by others 8,358 (15,218) Increase (decrease) in permanently restricted net assets 9,570 (14,314) Increase (decrease) in net assets 25,144 (34,835)
Net assets at beginning of year 1,541,154 1,575,989 Net assets at end of year 1,566,298$ 1,541,154$
See accompanying notes.
Hartford HealthCare Corporation and Subsidiaries
Consolidated Statements of Operations and Changes in Net Assets (continued)
Year Ended September 30
(In Thousands)
5

2016 2015
Operating activitiesIncrease (decrease) in net assets 25,144$ (34,835)$ Adjustments to reconcile change in net assets to net cash
provided by operating activities:Noncash items:
Depreciation and amortization 138,197 125,330 Change in unrealized gains and losses on investments
and assets whose use is limited (97,611) 103,732 Change in unrealized gains and losses on funds
held in trust by others (8,358) 15,218 Provision for bad debts 37,690 50,042 Provision for non-patient bad debts 616 5,997 Change in net assets related to pension and
postretirement funding obligations 213,275 18,978 Change in fair value of interest rate swap agreements 1,006 933 Other changes in net assets:
Restricted contributions and investment income (13,160) (33,699) Changes in assets and liabilities, net (Note 13) (39,247) (39,518)
Net cash provided by operating activities 257,552 212,178
Investing activitiesPurchases of property, plant, and equipment (240,694) (208,892) Purchases and sales of investments, net (171,058) (140,891) Decrease (increase) in escrow funds for capital projects 46,720 (111,866) Net cash used in investing activities (365,032) (461,649)
Financing activitiesProceeds from issuance of long-term debt 153,530 252,894 Payments on long-term debt and capital leases (141,874) (84,903) Restricted contributions and investment income 13,160 33,699 Net cash provided by financing activities 24,816 201,690
Net decrease in cash and cash equivalents (82,664) (47,781) Cash and cash equivalents at beginning of year 376,098 423,879 Cash and cash equivalents at end of year 293,434$ 376,098$
See accompanying notes.
Hartford HealthCare Corporation and Subsidiaries
Consolidated Statements of Cash Flows
Year Ended September 30
(In Thousands)
6

7
Hartford HealthCare Corporation and Subsidiaries
Notes to Consolidated Financial Statements (In Thousands)
September 30, 2016
1. Organization and Significant Accounting Policies
The accounting policies that affect significant elements of the Hartford HealthCare Corporation and Subsidiaries’ (the Corporation or HHC) consolidated financial statements are summarized below and in Note 2.
Organization
The Corporation was incorporated on August 21, 1985, as a not-for-profit organization under the Non-Stock Corporation Act of the State of Connecticut. The Corporation is organized exclusively for public welfare, charitable, scientific, literary and educational purposes, including the furtherance of the welfare, programs and activities of its subsidiaries.
The Corporation is the sole member of Hartford Hospital (Hartford), Backus Corporation (Backus Corp), MidState Medical Center (MidState), Windham Community Memorial Hospital Inc. (Windham), Central Connecticut Health Alliance (CCHA), The Hospital of Central Connecticut (HOCC), H.H.M.O.B., Hartford HealthCare at Home, Inc. (formerly VNA Health Care, Inc.) (VNA), Natchaug Hospital (Natchaug), HHC PhysiciansCare Inc., referred to as Hartford HealthCare Medical Group (HHCMG), Hartford HealthCare Senior Services (HHCSS) (formerly Central Connecticut Senior Health Services, Inc.), Rushford Center, Inc., Clinical Laboratory Partners, LLC (CLP), PracticeCentral, LLC, Integrated Care Partners, LLC (ICP), Hartford HealthCare Endowment LLC (Endowment LLC), and Hartford HealthCare Indemnity Services Ltd. (HHCISL).
Effective October 1, 2013, Grand Indemnity Company, Ltd. (GIC), a wholly-owned subsidiary of HOCC merged with HHCISL to consolidate captives for the Corporation. HHCISL was incorporated under the laws of Bermuda as a class 2 insurer, on August 30, 1990. HHCISL provides professional liability and employee benefits liability, in addition to general liability insurance and reinsurance to several Corporation subsidiaries. Refer to Note 9.
Endowment LLC manages the endowment investments for the Corporation. Endowment LLC was formed for the purpose of maintaining and managing, on a pooled basis, the endowment investments of the Corporation. Endowment LLC holds the endowment investments for Hartford, Backus, MidState, VNA, Windham, HOCC, and HHCSS. Endowment LLC acts as manager and is named fiduciary for the Corporation within established investment guidelines.

Hartford HealthCare Corporation and Subsidiaries
Notes to Consolidated Financial Statements (continued) (In Thousands)
8
1. Organization and Significant Accounting Policies (continued)
Hartford is a voluntary tax-exempt association incorporated under the General Statutes of the State of Connecticut. The subsidiaries of Hartford include Jefferson House, Cedar Mountain Commons and the Institute of Living. Jefferson House is a nursing home facility that is operated as a department of Hartford as mandated by legislation enacted in 1873. Cedar Mountain Commons is a senior living community that opened in February 2001 and is owned by Hartford and Jefferson House. The Institute of Living is a mental health center in Hartford, Connecticut and is wholly-owned by Hartford.
HOCC is a voluntary, tax-exempt association incorporated under the General Statutes of the State of Connecticut. The subsidiaries of HOCC include CenConn Services, Inc. (CSI).
Backus Corp is a voluntary, tax-exempt system of heath care affiliates that provides services throughout the eastern region of Connecticut including The William W. Backus Hospital (Backus), Backus Health Care, Inc., WWB Corporation, Omni Home Health Services of Eastern Connecticut LLC d/b/a Backus Home Health Services, and Backus Physician Services, LLC.
MidState is a voluntary tax-exempt organization incorporated under the General Statutes of the State of Connecticut.
Windham is a voluntary tax-exempt association incorporated under the General Statutes of the State of Connecticut. The subsidiaries of Windham include The Hatch Hospital Corporation and Windham Hospital Foundation, Inc. The Hatch Hospital Corporation and Windham Hospital Foundation, Inc. are both nonprofit organizations incorporated under the General Statutes of the State of Connecticut.
HHCMG is a tax-exempt organization incorporated under the General Statutes of the State of Connecticut pursuant to Chapter 549b. HHCMG’s primary purpose is to practice medicine and provide healthcare services to the public as a medical foundation.
HHCSS is a tax-exempt organization incorporated under the General Statutes of the State of Connecticut. The subsidiaries of HHCSS include Mulberry Gardens of Southington LLC (Mulberry Gardens) and the Orchards of Southington (the Orchards). HHCSS provides skilled nursing care and restorative rehabilitation health care services to residents within its geographic location. Mulberry Gardens and the Orchards provide residential services including housing, meals and assistance with activities of daily living for seniors.

Hartford HealthCare Corporation and Subsidiaries
Notes to Consolidated Financial Statements (continued) (In Thousands)
9
1. Organization and Significant Accounting Policies (continued)
VNA is a tax-exempt organization, founded in 1901, which was incorporated on March 1, 1986, as the parent company and sole member of VNA Health Resources, Inc. VNA provides corporate management, financial and other services to its subsidiary. Effective August 28, 2014, VNA executed an asset transfer agreement with Omni Home Health Services of Eastern Connecticut, LLC, d/b/a Backus Home Health Care, a joint venture of two wholly-owned subsidiaries of the Corporation.
H.H.M.O.B. was incorporated under the laws of the State of Connecticut for the purpose of operating a medical office building. The subsidiaries of H.H.M.O.B. include Hartford HealthCare Rehabilitation Network (formerly Eastern Rehabilitation Network).
Natchaug is a tax-exempt organization incorporated under the General Statutes of the State of Connecticut. Natchaug provides inpatient and outpatient psychiatric healthcare services.
Rushford Center, Inc. is a tax-exempt organization that includes Rushford Foundation, Inc. (the Foundation). The Foundation is a nonprofit agency in which Rushford Center, Inc. is a 100% owner.
CLP was created in 1998 through a merger of three Connecticut based laboratories. CLP’s outreach laboratory business was sold on February 29, 2016. Pursuant to the sale, the remaining business is being conducted under the name Hartford HealthCare Laboratories, Inc. Refer to the Sale of CLP Outreach Laboratory Services subsection below for additional detail.
PracticeCentral, LLC became operational in fiscal year 2012 and facilitates the adoption of electronic health systems by physician practices throughout the state of Connecticut for effective data sharing and clinical integration.
Effective February 1, 2013, ICP was formed to create the necessary infrastructure for the integrated healthcare delivery system operated by the Corporation. The Corporation is the sole member of ICP. ICP became operational on January 1, 2014.
The entities comprising the Corporation provide various inter-entity services to their affiliated entities and the Corporation parent company. The services consist of certain financial planning, information systems and telecommunications, general accounting, and other services. Charges for such services are based on the approximate cost to provide the services and are allocated between

Hartford HealthCare Corporation and Subsidiaries
Notes to Consolidated Financial Statements (continued) (In Thousands)
10
1. Organization and Significant Accounting Policies (continued)
the entities based on an agreed-upon method which reflects the approximate level of usage by each entity. Such inter-entity charges and all intercompany balances between the entities comprising the Corporation eliminate in consolidation.
Sale of CLP Outreach Laboratory Services
On February 29, 2016, pursuant to an asset purchase agreement dated November 9, 2015, the Corporation sold the outreach laboratory service business of CLP for a purchase price of $136,998, less certain escrow amounts and purchase price adjustments, payable in cash. During the year ended September 30, 2016, the Corporation received net proceeds relating to the sale of $131,998 and recorded a gain on sale of $119,538 in other operating revenue within the accompanying consolidated statements of operations and changes in net assets. As of September 30, 2016, pursuant to an escrow agreement, $5,000 of the purchase price remains in escrow until August 2017.
Regulatory Matters
The Corporation is required to file annual operating information with the State of Connecticut Office of Health Care Access.
Significant Accounting Policies
Use of Estimates
The preparation of financial statements in conformity with U.S. generally accepted accounting principles (GAAP) requires management to make estimates and assumptions that affect the reported amounts of assets and liabilities and disclosure of contingent assets and liabilities at the date of the consolidated financial statements. Estimates also affect the amounts of revenues and expenses reported during the period. There is at least a reasonable possibility that certain estimates will change by material amounts in the near term. Actual results could differ from those estimates. Significant estimates reflected in the consolidated financial statements include the contractual allowances and allowance for doubtful accounts for patient service revenue and the related patient accounts receivable, estimated revenue settlements due to or from third-parties, reserves for malpractice, workers’ compensation and other self-insured liabilities, and benefit plan assumptions.

Hartford HealthCare Corporation and Subsidiaries
Notes to Consolidated Financial Statements (continued) (In Thousands)
11
1. Organization and Significant Accounting Policies (continued)
Excess of Revenues Over Expenses
The consolidated statements of operations and changes in net assets include the excess of revenues over expenses as the performance indicator. Changes in unrestricted net assets which are excluded from the excess of revenues over expenses include the changes in pension and postretirement funding obligations, net assets released from restrictions for the purchase of equipment, change in unrealized gains and losses on other than trading investments, net income attributable to noncontrolling interest in joint ventures, net unrestricted other changes in joint ventures and transfers to temporarily restricted net assets.
Nonoperating Income (Loss)
Nonoperating income (loss) includes income on investments, which includes interest and dividend income, realized gains and change in unrealized gains and losses on trading investments, and changes in the fair value of swap agreements.
Fair Value of Financial Instruments
The carrying value of financial instruments classified as current assets and current liabilities approximates fair value. The fair values of the Corporation’s financial instruments are disclosed in Note 5.
Cash and Cash Equivalents
Cash and cash equivalents include cash, commercial paper, and corporate and government bonds that are available to be converted to liquid assets within three months. Cash and cash equivalents are maintained with domestic financial institutions with deposits that exceed federally insured limits. It is the Corporation’s policy to monitor the financial strength of those institutions.
Patient Accounts Receivable
Patient accounts receivable result from the health care services provided by the Corporation. Additions to the allowance for doubtful accounts result from the provision for bad debts. Accounts written off as uncollectible are deducted from the allowance for doubtful accounts.

Hartford HealthCare Corporation and Subsidiaries
Notes to Consolidated Financial Statements (continued) (In Thousands)
12
1. Organization and Significant Accounting Policies (continued)
The amount of the allowance for doubtful accounts is based upon management’s assessment of historical and expected net collections, business and economic conditions, trends in Medicare and Medicaid health care coverage, and other collection indicators. See Note 2 for additional information relative to third-party payor programs.
The Corporation’s primary concentration of credit risk is patient accounts receivable, which consist of amounts owed by various governmental agencies, insurance companies, and private patients. The Corporation manages the receivables by regularly reviewing its patient accounts and contracts, and by providing appropriate allowances for uncollectible amounts. Significant concentrations of patient accounts receivable include 32% and 36%, and 14% and 15%, for Medicare and Medicaid, respectively, for the fiscal years ended September 30, 2016 and 2015, respectively.
Investments
The majority of the Corporation’s investment portfolio is classified as trading with unrealized gains and losses included in the excess of revenues over expenses. HHCISL investments are classified as available for sale with the change in unrealized gains and losses excluded from the performance indicator.
Investments held by the Corporation in equity securities with readily determinable fair values and all investments in debt securities are measured at fair value using quoted market prices or model-driven valuations at the consolidated balance sheet dates. Alternative investments (nontraditional, not-readily-marketable assets), some of which are structured such that the Corporation holds limited partnership interests, are reported based upon net asset value as a practical expedient and derived from the application of the equity method of accounting. Individual investment holdings within the alternative investments may, in turn, include investments in both nonmarketable and market-traded securities. Valuations of these investments and, therefore, the Corporation’s holdings may be determined by the investment manager or general partner and for “fund of funds” investments are primarily based on financial data supplied by the underlying investee funds. Values may be based on historical cost, appraisals, or other estimates that require varying degrees of judgment. The Corporation accounts for these investments using the equity method of accounting and reports its share of the increase or decrease in the fund’s value as investment gain or loss within nonoperating income (loss) on the consolidated statement of operations and changes in net assets. The financial statements of the investees are audited annually by independent auditors, although the timing for reporting the results of such audits does not coincide with the Corporation’s annual consolidated financial statement reporting.

Hartford HealthCare Corporation and Subsidiaries
Notes to Consolidated Financial Statements (continued) (In Thousands)
13
1. Organization and Significant Accounting Policies (continued)
Alternative investments held by the defined benefit pension plans are stated at fair value as estimated in an unquoted market using net asset value as a practical expedient, as permitted under generally accepted accounting principles. Valuations of those investments, and therefore the Corporation’s holdings, may be determined by the investment manager and are primarily based on the underlying securities. Assets temporarily and permanently restricted (by donor) are recorded at fair value at the date of donation, which is then considered cost. Investment income, other than income on certain unrestricted investments (including realized gains and losses on investments, interest and dividends, and the change in unrealized gains and losses) is included in nonoperating income (loss) unless the income or loss is restricted by the donor or law. The cost of securities sold is based on the specific identification method.
The Corporation holds nonmarketable equity investments in private companies. At September 30, 2016 and 2015, the carrying value of the Corporation’s portfolio of strategic investments totaled $5,241 and $8,473, respectively, of which $77 are accounted for at cost and $5,164 and $8,396 are accounted for using the equity method of accounting at September 30, 2016 and 2015, respectively. These investments are included in other assets on the consolidated balance sheets. The Corporation’s share of the income or losses of all equity-method investees is included in nonoperating income (loss).
Inventories of Supplies
Inventories are stated at the lower of cost or market. The Corporation values its inventories using the first-in, first-out method.
Goodwill
Goodwill represents the excess of cost of an acquired entity over the net of the amounts assigned to the fair value of assets acquired and liabilities assumed. As of September 30, 2016 and 2015, goodwill of approximately $25,800 is recorded in the Corporation’s consolidated balance sheets within other assets. Goodwill is reviewed annually for impairment or more frequently if events or circumstances indicate that the carrying value of an asset may not be recoverable.
The impairment test for goodwill requires a comparison of fair value of each reporting unit that has goodwill associated with its operations with its carrying amount. The Corporation adopted the provisions of Accounting Standards Update (ASU) 2011-08, Testing Goodwill for Impairment,

Hartford HealthCare Corporation and Subsidiaries
Notes to Consolidated Financial Statements (continued) (In Thousands)
14
1. Organization and Significant Accounting Policies (continued)
which allows the Corporation to first assess qualitative factors to determine whether it is necessary to perform the two-step quantitative impairment test for goodwill. No impairment was recorded for goodwill for the fiscal years ended September 30, 2016 and 2015.
Property, Plant, and Equipment
Property, plant, and equipment are stated on the basis of cost. The Corporation provides for depreciation of property, plant and equipment and assets under capital leases using the straight-line method in amounts sufficient to depreciate the cost of the assets over their estimated useful lives, which range from 3 to 40 years.
Assets Whose Use is Limited
Assets whose use is limited includes assets that are set aside internally by management or by the Board of Directors for future capital improvements, research and education; donor-restricted assets; investments held by HHCISL; escrow funds; and debt service funds for existing obligations on outstanding long-term debt. Amounts that are restricted by the Board of Directors are not available for use without the approval of the Board of Directors. Restricted investment income in excess of a predetermined spending limit has also been set aside as long-term investments.
Investments for restricted purposes on the accompanying consolidated balance sheets are those restricted based on donors’ intents.
Temporarily and Permanently Restricted Net Assets
Temporarily restricted net assets are those assets whose use by the Corporation has been limited by donors to a specific time frame or purpose. Permanently restricted net assets have been restricted by donors and are maintained by the Corporation in perpetuity. The Corporation is a partial beneficiary to various perpetual trust agreements. Assets recorded under these agreements are recognized at fair value. The investment income generated from these funds is expendable to support healthcare services, and the assets are classified as permanently restricted.
Contributions, including unconditional promises to give, are recognized as revenue in the period received. Conditional promises to give are not recognized until the conditions on which they depend are substantially met. Unrestricted contributions are recorded, net of expenses, within other operating revenue.

Hartford HealthCare Corporation and Subsidiaries
Notes to Consolidated Financial Statements (continued) (In Thousands)
15
1. Organization and Significant Accounting Policies (continued)
Donor-Restricted Gifts
Unconditional promises to give cash and other assets are reported at fair value at the date the promise is received. The gifts are reported as either temporarily or permanently restricted support if they are received with donor stipulations that limit the use of the donated assets. When a donor restriction expires, that is, when a stipulated time restriction ends or purpose restriction is accomplished, temporarily restricted net assets are reclassified as unrestricted net assets and reported in the consolidated statements of operations and changes in net assets as net assets released from restrictions. Donor-restricted contributions whose restrictions are met within the same year as received are reported as unrestricted contributions in the accompanying consolidated financial statements, except those relating to donations of long-lived assets.
Bond Issuance Costs
Bond issuance costs associated with long-term debt for capital projects are amortized over the term of the debt using a method that approximates the effective interest method. Bond issuance costs of approximately $9,530 and $10,296 are recorded in other assets in the consolidated balance sheets as of September 30, 2016 and 2015, respectively.
Interest Rate Swap Agreements
The Corporation utilizes interest rate swap agreements to reduce risks associated with changes in interest rates. The Corporation does not hold or issue derivative financial instruments for trading purposes. The Corporation may be exposed to credit loss in the event of nonperformance by the counterparties to its interest rate swap agreements. Interest rate swap agreements are reported at fair value. Changes in fair value are recognized in the performance indicator in the consolidated statements of operations and changes in net assets.
Other Operating Revenue
Other operating revenue includes the gain on sale of CLP outreach laboratory business, services to other institutions, electronic health record (EHR) incentive program revenue, tuition revenue, rental income, grant revenue, investment income, cafeteria income, joint ventures income, retail pharmacy income, and unrestricted contributions. Also included in other operating revenue is investment income of $7,972 and $6,975 for fiscal years ended September 30, 2016 and 2015, respectively, on certain internally designated funds to support mission related operating activities. Refer to Note 11.

Hartford HealthCare Corporation and Subsidiaries
Notes to Consolidated Financial Statements (continued) (In Thousands)
16
1. Organization and Significant Accounting Policies (continued)
Unpaid Losses and Loss Adjustment Expenses
The reserve for losses and loss adjustment expenses and related reinsurance recoverable for HHCISL includes case basis estimates of reported losses, plus supplemental amounts calculated based upon loss projections utilizing actuarial studies, each entities’ own historical data and industry data. In establishing this reserve and the related reinsurance recoverable, HHCISL utilizes the findings of an independent consulting actuary.
Management believes that its aggregate reserve for losses and loss adjustment expenses and related reinsurance recoverable represents its best estimate, based on the available data, of the amount necessary to cover the ultimate cost of losses and the amount of such losses that will be recovered under reinsurance programs; however, because of the nature of the insured risks and limited historical experience, actual loss experience may not conform to the assumptions used in determining the estimated amounts for such asset and liability at the consolidated balance sheet dates. Accordingly, the ultimate asset and liability could be significantly in excess of or less than the amount indicated in these consolidated financial statements. As adjustments to these estimates become necessary, such adjustments are reflected in current operations.
Reinsurance
In the normal course of business, HHCISL seeks to reduce their loss exposure by reinsuring certain levels of risk with reinsurers. Premiums ceded are expensed over the term of their related policies.
Joint Ventures
The Corporation has entered into several joint ventures for the purpose of providing outpatient health care services, including NRRON, Greater Hartford Lithotripsy, Davita of Norwich, Davita of New London, MedConn Collection Agency, New Britain MRI and Connecticut Imaging Partners. These joint ventures, in which the Corporation has an equity interest of more than 20% but less than 50%, are accounted for under the equity method of accounting.
The Corporation has consolidated noncontrolling interests relating to its investments in Glastonbury Surgery Center, Southington Surgery Center, Meriden Imaging Center and Connecticut GI for which the Corporation owns greater than 50% but less than 100% of the

Hartford HealthCare Corporation and Subsidiaries
Notes to Consolidated Financial Statements (continued) (In Thousands)
17
1. Organization and Significant Accounting Policies (continued)
investees. These noncontrolling interests represent the portion of these joint ventures not controlled by the Corporation, but are required to be presented on the Corporation’s consolidated balance sheets under GAAP. The noncontrolling interests were approximately $3,018 as of September 30, 2016.
Income Taxes
The Corporation and substantially all of its subsidiaries are not-for-profit corporations as described in Section 501(c)(3) of the Internal Revenue Code (the Code) and are exempt from federal income taxes on related income pursuant to Section 501(a) of the Code, except for Hartford HealthCare Laboratories LLC., Conncare, Inc., CSI, and H.H.M.O.B. and its subsidiaries, which are taxable entities for which income taxes are immaterial. Additionally, Endowment LLC is a limited liability corporation and is treated as a partnership for income tax purposes. The Corporation has net operating loss carry forwards from unrelated business activities of approximately $40,176 and $37,988 at September 30, 2016 and 2015, respectively, which will begin expiring in 2018. These losses generate a potential deferred tax asset of approximately $15,222 and $14,382 at September 30, 2016 and 2015, respectively. No deferred tax asset has been recorded in the accompanying consolidated balance sheets as these amounts are offset by valuation allowances of the same amounts due to the uncertainty of utilizing the deferred tax asset in future periods.
HHCISL is an insurance company organized under the laws of Bermuda. HHCISL has received an undertaking from the Bermuda government exempting it from all local income, withholding and capital gains taxes until the year 2035.
New Accounting Pronouncements
In May 2014, the Financial Accounting Standards Board (FASB) issued ASU 2014-09, Revenue from Contracts with Customers. The core principle of ASU 2014-09 is that an entity should recognize revenue to depict the transfer of promised goods or services to customers in an amount that reflects the consideration to which the entity expects to be entitled in exchange for those goods or services. The guidance in ASU 2014-09 supersedes the FASB’s current revenue recognition requirements and most industry-specific guidance. The provisions of ASU 2014-09, as amended by ASU 2015-04, will be effective for fiscal years beginning after December 15, 2017, and interim periods within that fiscal year, with early adoption permitted but not prior to annual periods beginning after December 15, 2016. The Corporation is in the process of evaluating the impact of ASU 2014-09 on its consolidated financial statements.

Hartford HealthCare Corporation and Subsidiaries
Notes to Consolidated Financial Statements (continued) (In Thousands)
18
1. Organization and Significant Accounting Policies (continued)
In August 2014, the FASB issued ASU 2014-15, Presentations of Financial Statements – Going Concern, that will require management of public and nonpublic companies to evaluate and disclose where there is substantial doubt about an entity’s ability to continue as a going concern. The standard is effective for annual periods ending after December 15, 2016, and for annual periods thereafter. Early application is permitted. The Corporation is in the process of evaluating the requirements of ASU 2014-15.
In April 2015, the FASB issued ASU 2015-03, Interest – Imputation of Interest (Subtopic 835-30) – Simplifying the Presentation of Debt Issuance Costs. ASU 2015-03 simplifies the presentation of debt issuance costs by requiring debt issuance costs to be presented as a deduction from the corresponding debt liability. This will make the presentation of debt issuance costs consistent with the presentation of debt discounts or premiums. ASU 2015-03 is effective for fiscal years beginning after December 15, 2015 and will be applied retrospectively. The Corporation’s adoption of ASU 2015-03 will result in the reclassification of bond issuance costs to long-term debt in the accompanying consolidated financial statements.
In May 2015, the FASB issued ASU 2015-07, Fair Value Measurements (Topic 820): Disclosures for Investments in Certain Entities That Calculate Net Asset Value per Share (or Its Equivalent). ASU 2015-07 eliminates the requirement to categorize within the fair value hierarchy investments whose fair value is measured at net asset value (NAV) as a practical expedient. Instead, entities are required to disclose the fair value of investments measured using NAV so that users can reconcile the amounts within the fair value hierarchy to amounts reported on the balance sheet. ASU 2015-07 is effective for fiscal years beginning after December 15, 2016, and interim periods within that fiscal year, and will be applied retrospectively. The Corporation’s adoption of ASU 2015-07 will have no effect on the consolidated financial statements other than disclosures in the notes to the consolidated financial statements.
In May 2015, the FASB issued ASU 2015-05, Customer’s Accounting for Fees Paid in a Cloud Computing Arrangement, which provides guidance to customers about whether a cloud computing arrangement includes a software license. If such an arrangement contains a software license, the software license element of that arrangement should be accounted for consistent with the acquisition of other software licenses. If such an arrangement does not include a software license, the arrangement should be accounted for as a service contract. The provisions of ASU 2015-05 are effective for the Corporation for annual periods beginning after December 15, 2015 and can be adopted prospectively or retrospectively. Early adoption is permitted. The Corporation is in the process of evaluating the impact of ASU 2015-05 on its consolidated financial statements.

Hartford HealthCare Corporation and Subsidiaries
Notes to Consolidated Financial Statements (continued) (In Thousands)
19
1. Organization and Significant Accounting Policies (continued)
In January 2016, the FASB issued ASU 2016-01, Recognition and Measurement of Financial Assets and Financial Liabilities, which will require business-oriented health care not-for-profit entities to measure equity investments that do not result in consolidation and are not accounted for under the equity method at fair value and recognize any changes in fair value in the performance indicator unless the investments qualify for a new practicability exception. Unrealized holding gains and losses on equity securities currently classified as other-than-trading will no longer be reported separately from the performance indicator. The provisions of ASU 2016-01 are effective for the Corporation for annual periods beginning after December 15, 2018, and for interim periods within annual periods beginning a year later. Early adoption of the key provisions is permitted for annual periods beginning after December 15, 2017, and interim periods therein. Adoption of ASU 2016-01 would result in the reclassification of approximately $2.9 million of the change in unrealized gains and losses on investments from other changes in unrestricted net assets to within the performance indicator in the accompanying consolidated statement of operations and changes in net assets.
In February 2016, the FASB issued ASU 2016-02, Leases, which will require a lessee to report most leases on their balance sheet, but recognize expenses on their income statement in a manner similar to current accounting. The guidance also eliminates current real estate-specific provisions. For lessors, the guidance modifies the classification criteria and the accounting for sales-type and direct financing leases. The provisions of ASU 2016-02 are effective for the Corporation for annual periods beginning after December 15, 2018, and interim periods within those years. Early adoption is permitted. The Corporation is in the process of evaluating the impact of ASU 2016-02 on its consolidated financial statements.
In August 2016, the FASB issued ASU 2016-14, Not-for-Profit Financial Statement Presentation, which eliminates the requirement for not-for-profits (NFPs) to classify net assets as unrestricted, temporarily restricted and permanently restricted. Instead, NFPs will be required to classify net assets as net assets with donor restrictions or without donor restrictions. Entities that use the direct method of presenting operating cash flows will no longer be required to provide a reconciliation of the change in net assets to operating cash flows. The guidance also modifies required disclosures and reporting related to net assets, investment expenses and qualitative information regarding liquidity. NFPs will also be required to report all expenses by both functional and natural classification in one location. The provisions of ASU 2016-14 are effective for the Corporation for annual periods beginning after December 15, 2017, and interim periods thereafter. Early adoption is permitted. The Corporation is in the process of evaluating the impact of ASU 2016-14 on its consolidated financial statements.

Hartford HealthCare Corporation and Subsidiaries
Notes to Consolidated Financial Statements (continued) (In Thousands)
20
1. Organization and Significant Accounting Policies (continued)
Reclassifications
Certain reclassifications have been made to the fiscal year ended September 30, 2015 balances previously reported in the consolidated statement of operations and changes in net assets in order to conform with the fiscal year ended September 30, 2016 presentation. The reclassifications have no impact to the excess of revenues over expenses for the fiscal year ended September 30, 2015.
2. Net Patient Service Revenue and Charity Care
Revenues from the Medicare and Medicaid programs, respectively, accounted for approximately 34% and 13%, and 36% and 12% of the Corporation’s net patient service revenue for the fiscal years ended September 30, 2016 and 2015, respectively. Laws and regulations governing the Medicare and Medicaid programs are complex and subject to interpretation. As a result, there is at least a reasonable possibility that recorded estimates will change by material amounts in the near term.
The Corporation believes that it is in compliance with all applicable laws and regulations, and is not aware of any pending or threatened investigations involving allegations of potential wrongdoing. Compliance with such laws and regulations can be subject to future government review and interpretation as well as significant regulatory action, including fines, penalties, and exclusion from the Medicare and Medicaid programs. Changes in the Medicare and Medicaid programs and the reduction of funding levels could have an adverse impact on the Corporation.
The following table summarizes revenue from services to patients:
Year Ended September 30 2016 2015 Gross patient service revenue $ 6,009,180 $ 5,681,239 Deductions:
Contractual allowances and discounts 3,570,361 3,325,220 Charity care 50,327 49,510
Net patient service revenue 2,388,492 2,306,509 Provision for bad debts 37,690 50,054 Net patient service revenue less provision for bad debts $ 2,350,802 $ 2,256,455

Hartford HealthCare Corporation and Subsidiaries
Notes to Consolidated Financial Statements (continued) (In Thousands)
21
2. Net Patient Service Revenue and Charity Care (continued)
The Corporation has agreements with third-party payors that provide for payments to the Corporation at amounts different from its established rates. The difference is accounted for as contractual allowances. Payment arrangements include prospectively determined rates per discharge, reimbursed costs, fee-for-service, discounted charges, and per diem payments. Net patient service revenue is affected by the State of Connecticut Disproportionate Share program and is reported at the estimated net realizable amounts due from patients, third-party payors, and others for services rendered and include estimated retroactive revenue adjustments due to on-going and future audits, reviews, and investigations. Retroactive adjustments are considered in the recognition of revenue on an estimated basis in the period the related services are rendered, and such amounts are adjusted in future periods as adjustments become known or as years are no longer subject to such audits, reviews and investigations. During 2016 and 2015, the Corporation recorded net changes in estimates of approximately $20,909 and $(9,559), respectively, which primarily related to changes in previously estimated third-party payor settlements.
The Corporation has established estimates based on information presently available of amounts due to or from Medicare, Medicaid, and third-party payors for adjustments to current and prior year payment rates, based on industry-wide and Corporation-specific data. Such amounts are included in the accompanying consolidated balance sheets. Additionally, certain payors’ payment rates for various years have been appealed by the Corporation. If the appeals are successful, additional income applicable to those years might be realized.
The Corporation has agreements with various health maintenance organizations (HMOs) to provide medical services to subscribing participants. Under those agreements, the HMOs make fee-for-service payments to the Corporation for certain covered services based upon discounted fee schedules. In addition, the Corporation receives monthly capitation payments from certain HMOs based on the number of each HMO’s participants, regardless of services actually performed by the Corporation.
The Corporation accepts all patients regardless of their ability to pay. A patient is classified as a charity patient by reference to the established policies of the Corporation. Essentially, these policies define charity services as those services for which no payment is anticipated. In assessing a patient’s inability to pay, the Corporation utilizes the generally recognized poverty income levels for the State of Connecticut but also includes certain cases where incurred charges are significant when compared to incomes.

Hartford HealthCare Corporation and Subsidiaries
Notes to Consolidated Financial Statements (continued) (In Thousands)
22
2. Net Patient Service Revenue and Charity Care (continued)
The Corporation’s policy is to reserve a portion of all self-pay receivables, including amounts due from the uninsured and amounts related to co-payments and deductibles, as these charges are recorded. The Corporation’s allowance for doubtful accounts for self-pay patients increased to 56% of self-pay accounts receivable at September 30, 2016 from 50% of self-pay accounts receivable at September 30, 2015. On a monthly basis, the Corporation reviews its accounts receivable balances, the effectiveness of the Corporation’s reserve policies, and various analytics to support the basis for its estimates. These efforts primarily consist of reviewing the following:
• Revenue and volume trends by payor, particularly the self-pay components.
• Changes in the aging and payor mix of accounts receivable, including increased focus on accounts due from the uninsured and accounts that represent co-payments and deductibles due from patients.
• Various allowance coverage statistics.
The Corporation regularly performs hindsight procedures to evaluate historical write-off and collection experience throughout the year to help determine the reasonableness of its process for estimating the allowance for doubtful accounts.
The Corporation provides services without charge or at amounts less than its established rates to patients who meet the criteria of its charity care policy. Because the Corporation does not pursue collection of amounts determined to qualify as charity care, such services are not reported as revenue. For patients who were determined by the Corporation to have the ability to pay but did not, the uncollected amounts are recorded as part of the provision for bad debts. In distinguishing charity care from the provision for bad debts, a number of factors are considered, certain of which require a high degree of judgment.

Hartford HealthCare Corporation and Subsidiaries
Notes to Consolidated Financial Statements (continued) (In Thousands)
23
2. Net Patient Service Revenue and Charity Care (continued)
Patient service revenue, net of contractual allowances and discounts and before the provision for bad debts, recognized in the period from major payor sources for the fiscal years ended September 30, is as follows:
2016 2015 Medicare 34% 36% Medicaid 13 12 Self-pay 3 5 All other 50 47 100% 100%
There are various proposals at the Federal and State levels that could, among other things, significantly reduce payment rates or modify payment methods. The ultimate outcome of these proposals and other market changes, including the potential effects of health care reform that has been or may be enacted by the Federal and State governments, cannot presently be determined. Future changes in the Medicare and Medicaid programs and any reduction of funding could have an adverse impact on the Corporation.
The estimated cost of charity care provided was approximately $19,534 and $20,451 for the fiscal years ended September 30, 2016 and 2015, respectively. The estimated cost of charity care is based on the ratio of cost to charges, as determined by hospital-specific data.
3. Net Assets
Temporarily restricted net assets at September 30 are available for the following purposes:
2016 2015 Healthcare services:
Free beds $ 42,841 $ 39,517 Research 43,306 40,251 Education 16,250 15,591 Capital replacement 26,021 23,360 Other health care services 65,146 55,390
$ 193,564 $ 174,109

Hartford HealthCare Corporation and Subsidiaries
Notes to Consolidated Financial Statements (continued) (In Thousands)
24
3. Net Assets (continued)
Permanently restricted net assets at September 30 are restricted for:
2016 2015 Investments to be held in perpetuity, the income from
which is expendable to support health care services $ 80,831 $ 80,268 Endowment requiring income to be added to original gift
to support health care services 23,432 22,783 Restricted funds held in trust by others, the income from
which is expendable to support health care services 177,904 169,546
$ 282,167 $ 272,597 The Corporation’s endowment consists of hundreds of individual funds established for a variety of purposes. Those funds include both donor-restricted endowment funds and funds designated by the Board of Directors to function as endowments. Net assets associated with endowment funds, including funds designated by the Board of Directors to function as endowments, are classified and reported based on the existence or absence of donor-imposed restrictions.
The Board of Directors of the Corporation has interpreted the Uniform Prudent Management of Institutional Funds Act (UPMIFA) as requiring the preservation of the fair value of the original gift as of the gift date of the donor-restricted endowment funds absent explicit donor stipulations to the contrary. As a result of this interpretation, the Corporation classifies as permanently net restricted assets (a) the original value of gifts donated to the permanent endowment, (b) the original value of subsequent gifts to the permanent endowment, and (c) accumulations to the permanent endowment made in accordance with the direction of the applicable donor gift instrument at the time the accumulation is added to the fund. The remaining portion of the donor-restricted endowment fund that is not classified in permanently restricted net assets is classified as temporarily restricted net assets until those amounts are appropriated for expenditure by the

Hartford HealthCare Corporation and Subsidiaries
Notes to Consolidated Financial Statements (continued) (In Thousands)
25
3. Net Assets (continued)
organization in a manner consistent with the standard of prudence prescribed by UPMIFA. In accordance with UPMIFA, the Corporation considers the following factors in making a determination to appropriate or accumulate donor-restricted funds:
1) The duration and preservation of the fund 2) The purposes of the Corporation and the donor-restricted endowment fund 3) General economic conditions 4) The possible effect of inflation and deflation 5) The expected total return from income and the appreciation of investments 6) Other resources of the Corporation 7) The investment policies of the Corporation
The Corporation has adopted investment and spending policies for endowment assets that attempt to provide a predictable stream of funding to programs supported by its endowment while seeking to maintain purchasing power of the endowment assets. Endowment assets include those assets of donor-restricted funds that the Corporation must hold in perpetuity or for a donor-specific period(s). Under this policy, as approved by the Board of Directors, the endowment assets are invested in a manner that is intended to produce a real return, net of inflation and investment management costs, of at least 4% over the long term. Actual returns in any given year may vary from this amount.
To satisfy its long-term rate-of-return objectives, the Corporation relies on a total return strategy in which investment returns are achieved through both capital appreciation (realized and unrealized) and current yield (interest and dividends). The Corporation targets a diversified asset allocation that places a greater emphasis on equity-based alternative investments to achieve its long-term objective within prudent risk constraints.
The Corporation has a policy of appropriating for distribution each year 4% of the four quarter average market value of each fiscal year in which the distribution is planned. This is consistent with the Corporation’s objective to maintain the purchasing power of the endowment assets held in perpetuity or for a specified term as well as to provide additional real growth through new gifts and investment returns. Backus, HOCC, MidState, Windham, VNA and Rushford evaluated endowment spending based on need and current market conditions as well as long-term investment goals.

Hartford HealthCare Corporation and Subsidiaries
Notes to Consolidated Financial Statements (continued) (In Thousands)
26
3. Net Assets (continued)
Endowment fund composition (excluding funds held in trust by others) by type of fund as of September 30, 2016 consisted of the following:
Unrestricted Temporarily
Restricted Permanently
Restricted Total Donor-restricted endowment funds $ – $ 96,018 $ 104,263 $ 200,281 Board-designated endowment funds 184,047 – – 184,047
$ 184,047 $ 96,018 $ 104,263 $ 384,328
Changes in endowment funds for the fiscal year ended September 30, 2016, consisted of the following:
Unrestricted Temporarily
Restricted Permanently
Restricted Total Endowment funds, beginning
of the year $ 164,946 $ 84,918 $ 103,051 $ 352,915 Investment return:
Investment income (loss) 1,402 487 (380) 1,509 Net appreciation (realized and
unrealized) 13,487 14,311 1,056 28,854 Total investment return 14,889 14,798 676 30,363 Contributions – 1,071 536 1,607 Transfers into endowment funds 10,000 – – 10,000 Appropriation of endowment
assets for expenditure (5,788) (4,769) – (10,557)Endowment funds, end of year $ 184,047 $ 96,018 $ 104,263 $ 384,328
Endowment fund composition (excluding funds held in trust by others) by type of fund as of September 30, 2015 consisted of the following:
Unrestricted Temporarily
Restricted Permanently
Restricted Total Donor-restricted endowment funds $ – $ 84,918 $ 103,051 $ 187,969 Board-designated endowment funds 164,946 – – 164,946
$ 164,946 $ 84,918 $ 103,051 $ 352,915

Hartford HealthCare Corporation and Subsidiaries
Notes to Consolidated Financial Statements (continued) (In Thousands)
27
3. Net Assets (continued)
Changes in endowment funds for the fiscal year ended September 30, 2015, consisted of the following:
Unrestricted Temporarily
Restricted Permanently
Restricted Total Endowment funds, beginning
of the year $ 147,054 $ 93,448 $ 102,148 $ 342,650 Investment return:
Investment income 2,182 262 98 2,542 Net depreciation (realized and
unrealized) (5,660) (3,674) (259) (9,593)Total investment return (3,478) (3,412) (161) (7,051) Contributions – – 1,064 1,064 Transfers into endowment funds 22,370 332 – 22,702 Appropriation of endowment
assets for expenditure (1,000) (5,450) – (6,450)Endowment funds, end of year $ 164,946 $ 84,918 $ 103,051 $ 352,915
From time to time, the fair value of assets associated with individual donor-restricted endowment funds may fall below the level that the donor, as stipulated by UPMIFA, requires the Corporation to retain as a fund of perpetual duration. These deficiencies periodically result from unfavorable market fluctuations that occurred shortly after the investment of new permanently restricted contributions, in which case the Board of Directors may deem imprudent the continuation of appropriation for a limited period. There were no material deficiencies of this nature reported in unrestricted net assets as of September 30, 2016 and 2015.

Hartford HealthCare Corporation and Subsidiaries
Notes to Consolidated Financial Statements (continued) (In Thousands)
28
4. Investments and Assets Whose Use is Limited
Included in investments and assets whose use is limited are the following amounts:
September 30 2016 2015 Cash and cash equivalents $ 16,951 $ 15,150 Money market funds 107,503 153,066 Equity securities:
U.S. 250,177 241,739 International 231,568 149,914
Fixed income securities: U.S. 57,319 136,287 International 3,460 11,350
Mutual funds: U.S. 13,821 34,152 International 55,264 40,125
Common collective funds: U.S. 96,091 70,158
Alternative investments 705,942 463,732 Other notes and accounts receivable – 23 Pledges receivable, net 5,665 6,116
$ 1,543,761 $ 1,321,812 During the fiscal year ended September 30, 2016, Backus transferred approximately $217,546 of funds to Endowment LLC for an interest in the investments held by Endowment LLC.

Hartford HealthCare Corporation and Subsidiaries
Notes to Consolidated Financial Statements (continued) (In Thousands)
29
4. Investments and Assets Whose Use is Limited (continued)
The composition and presentation of income (loss) from investments, net, which are included in nonoperating income (loss) in the consolidated statements of operations and changes in net assets are as follows:
Year Ended September 30 2016 2015 Interest and dividend income $ 6,448 $ 11,654 Realized gains on investments, net 8,805 39,119 Change in unrealized gains and losses on investments 74,113 (66,362)Other 1,001 4,953 $ 90,367 $ (10,636)
Investments held by HHCISL have been classified as available for sale and are recorded at fair value and are adjusted for any other than temporary declines in fair value. The cost, gross unrealized gains and losses and fair value of the investments held by HHCISL as of September 30, 2016 and 2015 are as follows:
Cost/ Amortized
Cost
Gross Unrealized
Gain
Gross Unrealized
Loss Fair
Value September 30, 2016 US government securities $ 17,563 $ 465 $ (47) $ 17,981 US agency securities 6,476 24 (255) 6,245 Mortgage backed securities 1,427 6 (73) 1,360 Corporate debt securities 28,431 398 (293) 28,536 Bond funds 96,168 125 (310) 95,983 Equity funds 54,702 265 – 54,967 Total $ 204,767 $ 1,283 $ (978) $ 205,072

Hartford HealthCare Corporation and Subsidiaries
Notes to Consolidated Financial Statements (continued) (In Thousands)
30
4. Investments and Assets Whose Use is Limited (continued)
Cost/ Amortized
Cost
Gross Unrealized
Gain
Gross Unrealized
Loss Fair
Value September 30, 2015 US government securities $ 34,646 $ 353 $ (442) $ 34,557 US agency securities 7,257 18 (215) 7,060 Mortgage backed securities 2,234 3 (83) 2,154 Corporate debt securities 32,311 200 (206) 32,305 Bond funds 79,510 397 (37) 79,870 Equity funds 70,526 1,286 (3,959) 67,853 Total $ 226,484 $ 2,257 $ (4,942) $ 223,799
Management evaluates investments for other than temporary impairment at least annually and more frequently when economic or market concerns warrant such evaluation. Consideration is given to the length of time and the extent to which the fair value is less than cost, the financial condition of the issuer, and the intent and ability of the Corporation to retain the investment for a period of time sufficient to allow for any anticipated recovery in fair value. The Corporation has determined that the unrealized losses are deemed to be temporary impairments as of September 30, 2016 and 2015.
Contractual maturities of fixed income securities as of September 30, 2016 are as follows:
Amortized
Cost Fair
Value Due within one year $ 4,871 $ 4,878 Due after one year through five years 37,582 38,154 Due after five years through ten years 3,011 2,846 Due after more than ten years 8,433 8,244 $ 53,897 $ 54,122

Hartford HealthCare Corporation and Subsidiaries
Notes to Consolidated Financial Statements (continued) (In Thousands)
31
5. Fair Values of Financial Instruments
As defined in Accounting Standards Codification (ASC) 820, Fair Value Measurement, fair value is based on the price that would be received to sell an asset or paid to transfer a liability in an orderly transaction between market participants at the measurement date. In order to increase consistency and comparability in fair value measurements, ASC 820 establishes a fair value hierarchy that prioritizes observable and unobservable inputs used to measure fair value into three broad levels, which are described below:
Level 1: Quoted prices (unadjusted) in active markets that are accessible at the measurement date for identical assets or liabilities. The fair value hierarchy gives the highest priority to Level 1 inputs.
Level 2: Observable inputs are based on inputs not quoted in active markets, but corroborated by market data.
Level 3: Unobservable inputs are used when little or no market data is available. The fair value hierarchy gives the lowest priority to Level 3 inputs.
A financial instrument’s categorization within the valuation hierarchy is based upon the lowest level of input that is significant to the fair value measurement. In determining fair value, the Corporation uses valuation techniques that maximize the use of observable inputs and minimize the use of unobservable inputs to the extent possible and considers nonperformance risk in its assessment of fair value.

Hartford HealthCare Corporation and Subsidiaries
Notes to Consolidated Financial Statements (continued) (In Thousands)
32
5. Fair Values of Financial Instruments (continued)
Financial assets and liabilities carried at fair value in the accompanying consolidated balance sheets, excluding assets invested in the Corporation’s pension plans, are classified in the following tables below in one of the three categories described above:
September 30, 2016 Level 1 Level 2 Level 3 Total Assets Cash and cash equivalents $ 293,434 $ – $ – $ 293,434 Investments and assets whose use is limited:
Cash and cash equivalents 15,263 1,688 – 16,951 Money market funds 102,518 4,985 – 107,503 Equity securities:
U.S. 250,177 – – 250,177 International 231,568 – – 231,568
Fixed income securities: U.S. – 57,319 – 57,319 International – 3,460 – 3,460
Mutual funds: U.S. 1,520 12,301 – 13,821 International 55,248 16 – 55,264
Common collective funds: U.S. – 96,091 – 96,091
Alternative investments (HHCISL): U.S. – 192 120,461 120,653
Other assets: Mutual funds:
U.S. 14,694 531 – 15,225 International 1,270 – – 1,270
Funds held in trust by others – 177,904 – 177,904 Total $ 965,692 $ 354,487 $ 120,461 $ 1,440,640 Other liabilities Interest rate swaps $ – $ 4,813 $ – $ 4,813

Hartford HealthCare Corporation and Subsidiaries
Notes to Consolidated Financial Statements (continued) (In Thousands)
33
5. Fair Values of Financial Instruments (continued)
September 30, 2015 Level 1 Level 2 Level 3 Total Assets Cash and cash equivalents $ 376,098 $ – $ – $ 376,098 Investments and assets whose use is limited:
Cash and cash equivalents 13,651 1,499 – 15,150 Money market funds 148,094 4,972 – 153,066 Equity securities:
U.S. 241,739 – – 241,739 International 149,914 – – 149,914
Fixed income securities: U.S. – 136,287 – 136,287 International – 11,350 – 11,350
Mutual funds: U.S. 8,347 25,805 – 34,152 International 40,112 13 – 40,125
Common collective funds: U.S. – 70,158 – 70,158 International – – – –
Alternative investments (HHCISL): U.S. – 11 109,611 109,622 International – 196 – 196
Other assets: Mutual funds:
U.S. 13,465 543 – 14,008 International 1,249 – – 1,249
Funds held in trust by others – 169,546 – 169,546 Total $ 992,669 $ 420,380 $ 109,611 $ 1,522,660 Other liabilities Interest rate swaps $ – $ 8,155 $ – $ 8,155
The amounts reported in the preceding tables do not include alternative investments totaling approximately $585,289 and $353,915 as of September 30, 2016 and 2015, respectively, that are accounted for under the equity method of accounting. The Corporation has unfunded commitments to alternative investments of approximately $223,481 as of September 30, 2016.

Hartford HealthCare Corporation and Subsidiaries
Notes to Consolidated Financial Statements (continued) (In Thousands)
34
5. Fair Values of Financial Instruments (continued)
The Corporation established a Pension Plan Master Trust (the Trust) effective May 1, 2011. Each respective plan owns participant units in the Trust. The Trust’s assets consist of cash and cash equivalents, equity securities, fixed income bonds, mutual funds, common collective funds and alternative investments. The Trust also invests in derivative instruments, the purpose of which is to economically hedge the change in the funded status of the participating plans for a significant portion of the total pension liability that can occur due to changes in interest rates. The Trust follows a three-level hierarchy, which are measured at fair value on a recurring basis and were categorized as Level 1, Level 2, and Level 3 investments, respectively.
Financial assets for the defined benefit plans classified within the Trust as of September 30, 2016 are classified in the table below in one of the three categories described above:
September 30, 2016
Level 1 Level 2 Level 3 Total Cash and cash equivalents $ 72,736 $ – $ – $ 72,736 Equity securities:
U.S. 299,374 – – 299,374 International 232,909 – – 232,909
Fixed income bonds: U.S. 7,465 93,817 – 101,282 International – 12,309 – 12,309
Mutual funds: U.S. 17,844 – – 17,844 International 69,629 – – 69,629
Common collective funds: U.S. – 520,136 – 520,136 International – 26,021 – 26,021
Alternative investments and other: U.S. – – 89,649 89,649 International – – 17,014 17,014
Total $ 699,957 $ 652,283 $ 106,663 $ 1,458,903

Hartford HealthCare Corporation and Subsidiaries
Notes to Consolidated Financial Statements (continued) (In Thousands)
35
5. Fair Values of Financial Instruments (continued)
September 30, 2015
Level 1 Level 2 Level 3 Total Cash and cash equivalents $ 18,711 $ – $ – $ 18,711 Equity securities:
U.S. 345,101 – – 345,101 International 224,333 – – 224,333
Fixed income bonds: U.S. 7,453 119,589 – 127,042 International – 20,525 – 20,525
Mutual funds: U.S. 107,135 – – 107,135 International 1,179 – – 1,179
Common collective funds: U.S. – 506,126 – 506,126
Alternative investments and other – – 69,845 69,845 Total $ 703,912 $ 646,240 $ 69,845 $ 1,419,997 Fair value for Level 1 assets is based upon quoted market prices. Fair value for Level 2 assets is based upon model-based valuation techniques for which all significant assumptions are observable in the market or can be corroborated by observable market data for substantially the full term of the assets. Inputs are obtained from various sources, including market participants, dealers, and brokers. The funds held in trust by others that is categorized in Level 2 consist of shares or units in investment funds, as opposed to direct interests in the funds’ underlying holdings, which may be marketable. The interest rate swap agreements are valued based on a determination of market expectations relating to the future cash flows associated with the swap contract using sophisticated modeling based on observable market-based inputs, such as interest rate curves.
Assets that are valued using significant unobservable inputs, such as extrapolated data, proprietary models or indicative quotes that cannot be corroborated with market data are classified in Level 3 within the fair value hierarchy. Level 3 assets are valued based on the Corporation’s ownership interest in the NAV of the fund. The NAV reported by each fund is used as a practical expedient to estimate the fair value of the Corporation’s interest therein. The Corporation routinely monitors and assesses methodologies and assumptions used in valuing these interests. The Level 3 assets include certain liquidity restrictions that may require 90 days advance notice for redemptions.

Hartford HealthCare Corporation and Subsidiaries
Notes to Consolidated Financial Statements (continued) (In Thousands)
36
5. Fair Values of Financial Instruments (continued)
The changes in the fair value of assets measured using significant unobservable inputs (Level 3) were comprised of the following for the year ended September 30:
2016 2015 Beginning balance at October 1 $ 179,456 $ 240,097
Net appreciation (realized and unrealized) 3,150 11,271 Sales (42,920) (196,863)Purchases 87,438 124,951
Ending balance at September 30 $ 227,124 $ 179,456
The methods described above may produce a fair value that may not be indicative of net realizable value or reflect future fair values. Furthermore, while the Corporation believes its valuation methods are appropriate and consistent with other market participants, the use of different methodologies or assumptions to determine the fair value of certain financial instruments could result in a different estimate of fair value at the reporting date.
6. Property, Plant, and Equipment
Property, plant, and equipment consist of the following at September 30:
2016 2015 Land and land improvement $ 76,490 $ 77,862 Buildings and fixed equipment 1,472,863 1,479,469 Equipment 1,226,905 1,057,402
2,776,258 2,614,733 Less accumulated depreciation (1,776,336) (1,651,933)
999,922 962,800 Construction in process (estimated cost to
complete – $136,701) 249,465 184,090
$ 1,249,387 $ 1,146,890
Included in property, plant, and equipment, net is $172,798 and $116,942 of internally developed software costs for the fiscal years ended September 30, 2016 and 2015, respectively. The Corporation capitalized interest expense of $6,027 and $6,269 for the fiscal years ended September 30, 2016 and 2015, respectively.

Hartford HealthCare Corporation and Subsidiaries
Notes to Consolidated Financial Statements (continued) (In Thousands)
37
7. Pensions and Other Postretirement Benefits
The Corporation has cash balance retirement plans and defined benefit pension plans (both contributory and noncontributory), covering substantially all employees and noncontributory, supplemental defined-benefit retirement plans for certain executive employees (collectively, the Plans). As noted in Note 5, the Trust was established in 2011 for certain plans. Contributions to the Plans are based on actuarially determined amounts sufficient to meet the benefits to be paid to the Plan participants. The assets of the Plans are available to pay the benefits of eligible employees for participating entities based on their allocated share of assets. The service cost component of net periodic pension cost and all other components are actuarially determined as defined by each plan.
The benefits are based on years of service and the employees’ compensation as defined by each of the Plans. The Corporation makes contributions in amounts sufficient to fund the Plans’ current service cost, and the funding policy is to contribute amounts to these plans sufficient to meet the minimum funding requirements set forth by federal government regulations. The majority of the cash balance retirement plans and defined benefit pension plans are frozen to new members. The Corporation’s Board of Directors adopted a resolution in December 2014 to freeze the remaining defined benefit plans which had not been previously frozen, and move all employees to a single defined contribution plan effective January 1, 2016. On the effective date, substantially all employees will be eligible to participate in the defined contribution plan. As a result of the approved resolution, the plan liabilities were remeasured as of December 31, 2014. All outstanding prior service costs related to these plans were recognized as a curtailment gain or loss as of the date of remeasurement. The amount was included in employee benefits expense within the consolidated statement of operations and changes in net assets for the year ended September 30, 2015.
The Corporation also has defined contribution plans covering substantially all of its employees and executives. Expense for employer contributions was approximately $67,788 and $33,676 for 2016 and 2015, respectively.
The Corporation provides health care and life insurance benefits to its retired employees who meet certain eligibility requirements. The Corporation’s policy is to fund the cost of postretirement benefits, other than pensions, as incurred. During 2015, the Corporation announced changes to these benefits effective January 1, 2018. No new retirees will be eligible for these benefits and current retirees will be offered a fixed amount to use on private health exchanges. As a result, the postretirement benefit plan was remeasured as of December 31, 2014, upon adoption

Hartford HealthCare Corporation and Subsidiaries
Notes to Consolidated Financial Statements (continued) (In Thousands)
38
7. Pensions and Other Postretirement Benefits (continued)
of the changes to the plan by the Board of Directors, which decreased the accrued pension liabilities within the consolidated balance sheets by approximately $47,507 and decreased employee benefits expense within the consolidated statement of operations and changes in net assets by approximately $22,516 for the year ended September 30, 2015.
Effective September 30, 2016, the Corporation changed the method used to estimate the service and interest components of net periodic benefit cost for the Plans. This new estimation approach discounts the individual expected cash flows underlying the service cost and interest cost using the applicable spot rates derived from the yield curve used to discount the cash flows used to measure the benefit obligation. Historically, the Corporation estimated these service and interest cost components utilizing a single weighted-average discount rate derived from the yield curve used to measure the benefit obligation at the beginning of the period. The change will have no impact on the determination of the benefit obligation.
The Corporation has made this change to provide a more precise measurement of service and interest costs by improving the correlation between projected benefit cash flows to the corresponding spot yield curve rates. The Corporation has accounted for this change as a change in accounting estimate that is inseparable from a change in accounting principle and accordingly has accounted for it prospectively. The more granular application of the spot rates will reduce the service and interest cost for the Plans. Based on current economic conditions, the estimated service cost and interest cost for all the Plans will be reduced by approximately 22.5% or $17,000 in fiscal year 2017. This change will result in short-term cost savings for the Corporation as the amortization of the actuarial gain (loss) is expected to increase over time. The expected break-even point of the service and interest cost savings is estimated to be 2040.
Included in unrestricted net assets at September 30 are the following amounts that have not yet been recognized in net periodic benefit cost:
2016 2015 Unrecognized actuarial loss $ 743,586 $ 548,012 Unrecognized prior service credit (20,300) (38,001)
$ 723,286 $ 510,011

Hartford HealthCare Corporation and Subsidiaries
Notes to Consolidated Financial Statements (continued) (In Thousands)
39
7. Pensions and Other Postretirement Benefits (continued)
The actuarial loss and prior service credit included in unrestricted net assets at September 30, 2016, and expected to be recognized in net periodic benefit cost during the fiscal year ending September 30, 2017, are as follows:
Unrecognized actuarial loss $ 25,027 Unrecognized prior service credit (2,614)
$ 22,413 The following table sets forth the Plans’ funded status and amounts recognized in the consolidated balance sheets:
Pension Benefits Other Postretirement Benefits 2016 2015 2016 2015 Change in benefit obligation Benefit obligation at beginning of year $ (1,868,624) $ (1,912,276) $ (35,819) $ (87,604)
Service cost (15,390) (39,151) (99) (476)Interest cost (79,319) (77,962) (1,235) (1,984)Employee contributions – – (1,290) (3,490)Benefits paid 95,141 92,440 3,833 11,328 Actuarial (losses) gains (239,392) (21,297) 2,813 (4,301)Curtailments – 89,622 – – Plan amendments, other 10,006 – – 50,708
Benefit obligation at end of year $ (2,097,578) $ (1,868,624) $ (31,797) $ (35,819)
Change in plans’ assets Fair value of assets at beginning of year $ 1,419,997 $ 1,503,239 $ – $ –
Actual return on plans’ assets 130,317 (30,482) – – Benefits paid (95,141) (92,440) (3,833) (11,328)Employer contributions 3,730 39,680 2,543 7,838 Employee contributions – – 1,290 3,490
Fair value of plans’ assets at end of year 1,458,903 1,419,997 – – Underfunded status of the plans $ (638,675) $ (448,627) $ (31,797) $ (35,819)
Components of net periodic benefit cost Service cost $ 15,390 $ 39,151 $ 99 $ 476 Interest cost 79,319 77,962 1,235 1,984 Expected return on plans’ assets (111,045) (105,737) – – Curtailment – 882 – (2,659)Settlement loss 160 158 – – Net amortization and deferral 14,777 25,664 (24,019) (21,482)Cost (income) included in the consolidated statements of
operations and changes in net assets $ (1,399) $ 38,080 $ (22,685) $ (21,681)

Hartford HealthCare Corporation and Subsidiaries
Notes to Consolidated Financial Statements (continued) (In Thousands)
40
7. Pensions and Other Postretirement Benefits (continued)
The Corporation also has supplemental employee retirement plans and healthcare reimbursement accounts, for which the Corporation recorded the underfunded status of $25,828 and $26,498 included within accrued pension liabilities as of September 30, 2016 and 2015, respectively.
The actuarial (losses) gains in 2016 and 2015 primarily relates to changes in demographic experience, discount rate and the mortality table used to measure the benefit obligation.
The accumulated benefit obligation for the Corporation’s plans was approximately $2,107,889 and $1,866,100 as of September 30, 2016 and 2015, respectively.
The weighted-average assumptions used to develop net periodic benefit cost and the projected benefit obligation were as follows:
Pension Benefits Other Post-Retirement Benefits
2016 2015 2016 2015 Discount rate for determining
benefit obligation at year-end 3.17-3.80% 3.75 –4.65% 2.46-3.39% 3.00 –4.20% Discount rate for net periodic
benefit cost 3.75-4.65% 3.75 –4.55% 3.00-4.20% 3.00 –4.20% Expected rate of return on plan 4.35-7.50% 4.00 –7.50% – – Rate of compensation increase 3.50% 3.50% 3.50% 3.50% The expected rate of return on plan assets was determined by the expected return on each asset class based on a model that considers historical and expected future performance.
The Corporation has three postretirement benefit plans. The weighted-average annual assumed rates of increase in the per capita cost of covered benefits (i.e., health care cost trend rate) are assumed to be 6.5% to 7.0%. Rates are assumed to decline to 5% through 2023 for Hartford and 2018 for Windham. This health care cost trend rate assumption has a significant effect on the amounts reported. To illustrate, a one percentage point increase in the assumed health care cost trend rate would increase the service and interest costs and accumulated postretirement benefit obligations by approximately $49 and $147 at September 30, 2016 and 2015, respectively. A one percentage point decrease in the assumed health care cost trend rate would decrease the service and interest cost and accumulated postretirement benefit obligations by approximately $41 and $126 at September 30, 2016 and 2015, respectively.

Hartford HealthCare Corporation and Subsidiaries
Notes to Consolidated Financial Statements (continued) (In Thousands)
41
7. Pensions and Other Postretirement Benefits (continued)
Plan Assets
The Trust’s weighted-average asset allocations at September 30, by asset category, are as follows:
Target 2016 2015 Equity securities 51% 58% 60% Fixed income/debt securities 18 7 14 Commodities/inflation/real assets 10 10 8 Hedge funds 14 13 16 Other 7 12 2 Total 100% 100% 100%
The goals of the plans are to provide a secure retirement benefit for plan participants and to manage pension plan assets for the exclusive benefit of the participants. The Investment Committee of the Board of Directors of each organization is responsible for developing, reviewing, and monitoring the investment policy. The plans’ assets are invested in accordance with the policy.
Contributions
The Corporation expects to make contributions of approximately $13,640 and $3,469 in fiscal year 2017 related to its Plans and its other postretirement benefit plans, respectively.
Estimated Future Benefit Payments
Future benefit payments are expected to be paid as follows:
Fiscal Year Pension Benefits
Other Postretirement
Benefits 2017 $ 133,475 $ 3,469 2018 100,586 3,150 2019 103,984 2,899 2020 105,426 2,626 2021 107,708 2,442 2022–2026 560,074 9,730

Hartford HealthCare Corporation and Subsidiaries
Notes to Consolidated Financial Statements (continued) (In Thousands)
42
8. Long-Term Debt
Details of long-term debt are as follows:
September 30 2016 2015 HHC Revenue bonds financed with the State of Connecticut Health and Educational
Facilities Authority (CHEFA): Series A, consisting of tax-exempt serial bonds and term bonds; interest at rates ranging
from 4.00% to 5.00% $ 245,079 $ 248,829 Series B, tax-exempt variable rate term bonds; interest at rates ranging
from 0.02% to 0.85% 71,085 71,085 Series C, taxable variable rate term bonds; interest at rates ranging
from 0.17% to 0.85% 50,000 50,000 Series D, taxable term bonds, fixed rate at 5.75% 163,180 163,180 Series E, tax-exempt term bonds; interest rates ranging from 4.00% to 5.00% 83,790 83,790 Series F, tax-exempt term bonds; interest rates ranging from 3.00% to 5.85% 71,965 71,965 Series G, tax-exempt term bonds; variable interest based upon one-month LIBOR rate
through June 30, 2020 50,665 50,665 Revolving line of credit 36,078 28,184 Capital lease obligations (HHC, Backus, HOCC, Hartford) due in monthly
installments, at varying rates of imputed interest from 1.94% to 7.16% 23,572 26,812 Term loan (HHC), at a variable rate of 1.27% as of September, 30, 2016 82,606 70,713 Commercial notes (Natchaug), at varying rates of imputed interest to 9.44% 2,143 2,335 Mortgage (Backus) due in monthly installments with fixed rate of 6.125%
through May 1, 2025 1,323 1,395
Other loans and notes, at varying rates of imputed interest 2,259 712 Premium on bonds 10,438 10,850
894,183 880,515 Less current portion 52,582 44,207
$ 841,601 $ 836,308
On September 29, 2011, HHC issued approximately $375,815 of CHEFA Revenue Bonds Series A, B, and C (the HHC 2011 Bonds). In conjunction with the issuance of the HHC 2011 Bonds, an obligated group was formed. The members of the obligated group are HHC, Hartford Hospital, The Hospital of Central Connecticut, Windham Community Memorial Hospital, and MidState Medical Center (collectively referred to as the Obligated Group). Effective January 2014, The William W. Backus Hospital became part of the Obligated Group. On March 26, 2014, HHC issued approximately $163,180 of Taxable Bonds Series D (the HHC Series D Bonds) and approximately $83,790 of CHEFA Revenue Bonds Series E (the HHC Series E Bonds) concurrently (collectively referred to as the HHC 2014 Bonds). On May 12, 2015, HHC concurrently issued approximately $71,965 and $50,665 of CHEFA Revenue Bonds

Hartford HealthCare Corporation and Subsidiaries
Notes to Consolidated Financial Statements (continued) (In Thousands)
43
8. Long-Term Debt (continued)
Series F (the HHC Series F Bonds) and G (the HHC Series G Bonds), respectively (collectively referred to as the HHC 2015 Bonds). Obligated Group members are jointly and severally liable under a Master Trust Indenture (MTI) to make all payments required with respect to obligations under the MTI. HHC does have the right to name designated affiliates, although presently none exist.
The HHC 2011 and 2014 Bonds were issued to refund portions of existing debt under HHC. The HHC 2011, 2014, and 2015 Bonds were also issued to obtain funds for future capital needs. The HHC Series A Revenue Bonds consist of serial bonds that mature annually from July 1, 2014 through July 1, 2023, and term bonds that mature from July 1, 2024 through July 1, 2041. The HHC Series B Revenue Bonds consist of term bonds that mature from July 1, 2042 through July 1, 2049. The HHC Series B Revenue Bonds are secured by an irrevocable letter of credit issued by Bank of America which expires on September 29, 2018. The HHC Series C Revenue Bonds consist of term bonds that mature from July 1, 2042 through July 1, 2049. The HHC Series C Revenue Bonds are secured by an irrevocable letter of credit issued by JP Morgan Chase Bank that expires on October 1, 2017. The reimbursement terms of the letters of credit for the HHC Series B and C Revenue Bonds are such that in the event a letter of credit is drawn upon due to a failed remarketing, the components available shall equal the aggregate principal and interest amount of bonds outstanding. The HHC Series D Bonds consist of term bonds that mature on April 1, 2044. The HHC Series E Bonds consist of term bonds that mature from July 1, 2025 through July 1, 2042. The HHC Series F Bonds consist of term bonds that mature on July 1, 2045. The HHC Series G Bonds consist of term bonds that mature on July 1, 2049.
The MTI and Supplemental MTI provide for the potential establishment and maintenance of a debt service reserve fund, a pledge of gross receipts, as defined, and parity with the HHC Series A and E Revenue Bonds that remain outstanding. The MTI and loan agreements establish certain restrictive covenants, including a debt service coverage ratio and days cash on hand requirement. No violations of financial covenants existed as of and for the fiscal years ended September 30, 2016 and 2015.
The fair value of the HHC 2011, 2014 and 2015 Bonds was approximately $830,456 and $813,414 at September 30, 2016 and 2015, respectively. The fair value of the HHC 2011, 2014, and 2015 Bonds was determined by HHC’s investment advisor using a market approach that uses prices and other relevant information generated by market transactions involving identical or comparable liabilities and categorized as Level 2 in the fair value hierarchy described in Note 5.

Hartford HealthCare Corporation and Subsidiaries
Notes to Consolidated Financial Statements (continued) (In Thousands)
44
8. Long-Term Debt (continued)
As part of the HHC 2011 Bonds, the Obligated Group entered into a new line of credit for $20,000. This line expires in March 2017. As of September 30, 2016 and 2015, HHC had not drawn upon this line of credit. In 2012, HHC obtained a $60,000 line of credit. In August 2013, the Obligated Group entered into an amendment increasing this line of credit to $100,000. As of September 30, 2016 and 2015, the Corporation had drawn $36,078 and $28,184, respectively, on this line of credit, with a variable rate of 1.22% and 0.90%, respectively, and is also included in the current portion of long-term debt. This line of credit expires in April 2017.
In April 2014, the Obligated Group entered into a new loan agreement in the amount of $85,000. Under this agreement, a line of credit will be provided for borrowings up to a maximum aggregate amount outstanding of $85,000 until April 2016, with an interest rate equal to the LIBOR Rate plus the Applicable Margin, as defined in the loan agreement. On June 30, 2015 the line converted to a term loan, with an additional drawdown period through April 9, 2016, to be repaid in 36 equal quarterly installments of principal until April 2024. As of September 30, 2016 and 2015, the ending balance of this term loan is $82,606 and $70,713, respectively, with a variable rate of 1.27% and 0.95%, respectively.
MidState and Windham entered into interest rate swap agreements in connection with debt instruments that have subsequently been terminated. MidState entered into an interest rate swap agreement with a financial institution, with an original notional amount of $47,594. MidState receives a variable rate equal to 67% of one month LIBOR and pays a fixed rate of 3.78%. Effective July 6, 2016, MidState entered into an agreement to terminate the interest rate swap for the current fair market value of $4,348. Windham entered into two interest rate swap agreements with a financial institution, with an original notional amount of $19,745. Windham receives a variable rate equal to 67% of one month LIBOR and pays a fixed rate of 3.38%. These agreements terminate on July 1, 2037. The changes in the fair value of these agreements are reported in the accompanying consolidated statements of operations and changes in net assets as a component of income from investments along with the net cash receipts on the swap agreement. The fair value of the swap agreements were $4,813 and $8,155 at September 30, 2016 and 2015, respectively, and are recorded in other liabilities in the accompanying consolidated balance sheets. Although the swap agreements represent an economic hedge of the interest rate, they do not qualify for hedge accounting. The changes in fair value of these agreements is reported in the accompanying consolidated statements of operations and changes in net assets as a component of other nonoperating income (loss) along with the net cash receipts on the swap agreement.

Hartford HealthCare Corporation and Subsidiaries
Notes to Consolidated Financial Statements (continued) (In Thousands)
45
8. Long-Term Debt (continued)
On January 27, 2014, the Obligated Group entered into a bridge loan (the Bridge Loan) in the amount of $80,902, part of which was used to defease the Backus Series E, Series F and Series G bonds (Backus Bonds) prior to the closing of the HHC 2014 Bonds. A portion of the proceeds of the HHC 2014 Bonds were used to pay off the outstanding balance of the Bridge Loan prior to September 30, 2014. During 2014, Backus placed $57,512 in an escrow refunding trust relating to Series F and G Bonds. The Series F Bonds will be redeemed as of July 1, 2018. The Series G Bonds were redeemed on July 1, 2015. The Backus Series E Bonds were extinguished during 2014.
HHC has entered into several capital lease obligations. The leases are due in monthly installments with varying interest rates. HHC entered into three capital leases for equipment in 2013 with options to purchase, with imputed interest rates from 1.94% to 3.53%. The total monthly installments due for the three lease obligations are $192 with an outstanding balance of $3,732 and $6,030 as of September 30, 2016 and 2015, respectively. Hartford has capital leases for satellite locations entered into in 2010 and 2012. Both leases are twenty year leases with an option to purchase. One lease has monthly installments of $57 with an interest rate of 6.25% and the second lease has monthly installments of $34 with an interest rate of 7.16%. The outstanding Hartford capital lease obligations were $12,797 and $13,044 as of September 30, 2016 and 2015, respectively. Backus leases include a twenty-year capital lease of $5,108 with an interest rate of 6.06% for a building entered into in 2012. Under the terms of the lease, Backus has the option for two additional five year terms as well as an option to purchase the property. The outstanding balance on this capital lease at September 30, 2016 and 2015, was $4,721 and $4,898, respectively. The remaining capital leases recorded total approximately $2,322 and $2,840 with interest rates ranging from 2.25% to 5.90% as of September 30, 2016 and 2015, respectively.
Principal payments due on long-term debt are as follows:
Fiscal year ending September 30: 2017 $ 52,582 2018 14,220 2019 15,048 2020 13,659 2021 13,967 Thereafter 774,269
$ 883,745

Hartford HealthCare Corporation and Subsidiaries
Notes to Consolidated Financial Statements (continued) (In Thousands)
46
8. Long-Term Debt (continued)
Interest paid for the fiscal years ended September 30, 2016 and 2015 was approximately $27,368 and $25,221, respectively.
9. Professional Liability and Workers’ Compensation Insurance
The Corporation’s primary medical professional and general liability coverage is with HHCISL for its subsidiaries. As discussed in Note 1, HHCISL is a wholly-owned subsidiary of the Corporation. Hartford, MidState, HOCC, Windham, VNA and HHCSS were insured by HHCISL for the years ended September 30, 2016 and 2015. Effective October 1, 2013, HHCISL also began providing primary coverage for Backus. Prior to being covered by HHCISL, primary coverage for Backus was through a self-insured trust. In fiscal year 2015, Backus transferred the reserves related to its legacy malpractice claims to HHCISL. Effective August 1, 2016, HHCISL began providing coverage for Rushford. Prior to being covered by HHCISL, primary coverage for Rushford was through a commercial insurer.
Effective October 1, 2015, the policy limits provided by HHCISL are $5,000 per claim and $35,000 in the aggregate. The primary layer of the excess coverage of $20,000 is shared with two insurance carriers. The secondary layer is $20,000 with a single carrier. The third and fourth layers are $10,000 each with two other insurance carriers. The top layer is $20,000 for a total excess coverage of $80,000. Prior year policy limits may vary from the current coverage levels.
In addition, HHCISL provides primary layer coverage, on a claims-made basis, for employee benefits coverage with limits of $2,000 for each employee benefits wrongful act, with an aggregate limit of $6,000. HHCISL also provides primary layer coverage, on an occurrence basis, general liability with limits of $2,000 per occurrence, with an aggregate limit of $4,000. Effective January 1, 2013, HHCISL provided employee medical stop loss coverage to the Corporation with a limit of $650 in excess of $350 per employee. A select number of employees in 2015 were given higher limits due to their expected higher expenses. Effective January 1, 2016, the medical stop loss limit increased to $1,150 in excess of $350 per employee. In 2014, HHCISL issued a separate policy for employed lawyers’ legal liability with coverage for $3,000 per claim and in aggregate.
Effective October 1, 2012, HHCISL entered into a fully retrospectively rated agreement with a former shareholder and insured, Connecticut Children’s Medical Center (CCMC), whereby HHCISL issued a policy to the benefit of CCMC and CCMC pays a deposit premium which will be adjusted based on actual claims activity. CCMC is not related to the Corporation.

Hartford HealthCare Corporation and Subsidiaries
Notes to Consolidated Financial Statements (continued) (In Thousands)
47
9. Professional Liability and Workers’ Compensation Insurance (continued)
Coverage for professional liability insurance is provided on a claims-made basis at HHCISL. As such, the subsidiaries of the Corporation that are insured by HHCISL have also recorded a liability for estimated incurred but not reported claims. Professional liability claims are discounted at 1.30% and 1.47% for the incurred-but-not-reported liability, which was approximately $21,501 and $20,804 at September 30, 2016 and 2015, respectively.
Activity in the reserve for losses and loss adjustment expenses is summarized as follows for the fiscal year ended September 30:
2016 2015 Net reserve, beginning of year $ 126,582 $ 112,240 Transfer in of Backus reserves – 3,038
Incurred related to: Current year 32,283 32,032 Prior years (5,548) (4,714)
Total incurred 26,735 27,318 Paid related to:
Current year (1,768) (2,028)Prior years (23,961) (13,986)
Total paid (25,729) (16,014)Net reserve, end of year 127,588 126,582 Plus: reinsurance recoverable 4,301 4,301 Plus: CCMC reserves 28,996 35,208 Gross balance, end of the year $ 160,885 $ 166,091
As a result of changes in estimates of insured events in prior years, the reserve for losses and loss adjustment expenses decreased by $3,423 and $4,714 in 2016 and 2015, respectively.
The ultimate settlement of losses may vary significantly from the reserves recorded. In particular, ultimate settlements on professional liability claims depend, among other things, on the resolution of litigation, the outcome of which is difficult to predict. In addition, since the reserves have been discounted, there is the possibility that the timing of loss payments and income earned on invested assets will be significantly different than anticipated.

Hartford HealthCare Corporation and Subsidiaries
Notes to Consolidated Financial Statements (continued) (In Thousands)
48
9. Professional Liability and Workers’ Compensation Insurance (continued)
During the year, potential workers’ compensation losses from asserted and unasserted claims identified by the Corporation’s risk management system are accrued based upon estimates that incorporate the Corporation’s past experience, as well as the nature of each claim or incident and relevant trend factors.
The Corporation’s workers’ compensation reserve, as estimated by management in conjunction with its independent actuaries is $33,312 and $31,144 as of September 30, 2016 and 2015, respectively, is included in accrued expenses on the consolidated balance sheets and is discounted at 3.0% in 2016 and 2015.
The Corporation has established a policy of self-insuring the deductible portion of its workers’ compensation insurance. The deductible limits are $1,000 per claim for fiscal years ended September 30, 2016 and 2015. In connection with this self-insurance program, Travelers Indemnity Company, the primary insurer, issued a surety bond in the amount of $21,500 and $14,350 at September 30, 2016 and 2015, respectively.
10. Commitments and Contingencies
Various lawsuits and claims arising in the normal course of operations are pending or are in progress against the Corporation. Such lawsuits and claims are either specifically covered by insurance as explained in Note 1 or are deemed to be immaterial. While the outcomes of the lawsuits cannot be determined at this time, management believes that any loss that may arise from these actions will not have a material adverse effect on the financial position or changes in net assets of the Corporation.
The Corporation has several operating lease agreements for certain real estate, medical equipment, and computer equipment. Certain of these leases have renewal options for periods up to five years and escalation clauses. Rent is payable in equal monthly installments. Rent expense was approximately $38,568 and $36,047 for the fiscal years ended September 30, 2016 and 2015, respectively, and is included within supplies and other on the accompanying consolidated statements of operations and changes in net assets.

Hartford HealthCare Corporation and Subsidiaries
Notes to Consolidated Financial Statements (continued) (In Thousands)
49
10. Commitments and Contingencies (continued)
The future minimum lease payments are as follows:
2017 $ 22,483 2018 20,741 2019 17,844 2020 14,874 2021 12,484 Thereafter 36,881
$ 125,307 11. Other Operating Revenue
Other operating revenue for the fiscal years ended September 30 consisted of the following:
2016 2015 Gain on sale of CLP outreach laboratory business $ 119,538 $ – Services to others 56,672 71,421 Grant revenue 25,279 29,364 Retail pharmacy income 24,235 2,836 Investment income 11,292 16,827 Rental income 10,314 15,579 Tuition revenue 8,885 8,994 Cafeteria income 6,241 6,945 Unrestricted contributions 6,200 7,766 Joint ventures income 3,389 6,470 EHR revenue 1,326 1,500 Other 26,671 26,572 $ 300,042 $ 194,274

Hartford HealthCare Corporation and Subsidiaries
Notes to Consolidated Financial Statements (continued) (In Thousands)
50
12. Functional Expenses
The Corporation provides health care services to residents within its geographic location. Expenses related to providing these services are as follow:
Year Ended September 30 2016 2015 Health care services $ 1,928,425 $ 1,808,331 Support services 599,953 625,674
$ 2,528,378 $ 2,434,005 13. Supplemental Cash Flow Information
The changes in assets and liabilities are as follows:
September 30 2016 2015 Increase in accounts receivable $ (56,920) $ (54,139)Decrease in other receivables 8,310 237 Increase in inventories of supplies and prepaid expenses
and other current assets (7,107) (3,252)Decrease (increase) in other assets 6,657 (13,030)Increase in accounts payable and accrued expenses 28,784 32,512 (Decrease) increase in estimated third-party payor
settlements (16,055) 9,285 Increase (decrease) in salaries, wages, payroll taxes, and
amounts withheld from employees 19,391 (3,730)Decrease in accrued pension liabilities, self-insurance
liabilities and other liabilities (22,307) (7,401)
$ (39,247) $ (39,518)

Hartford HealthCare Corporation and Subsidiaries
Notes to Consolidated Financial Statements (continued) (In Thousands)
51
14. Subsequent Events
The Corporation evaluated subsequent events through December 23, 2016, which is the date the consolidated financial statements were issued, for potential recognition in the consolidated financial statements as of the balance sheet date for the fiscal year ended September 30, 2016.
No events occurred that require disclosure in or adjustment to the consolidated financial statements.

Supplementary Information

Hartford HealthCare and
SubsidiaryHartford Hospital and Subsidiaries
MidState Medical Center and Subsidiary
Windham Hospital
Hospital of Central Connecticut and
SubsidiariesBackus Hospital
H.H.M.O.B. and Subsidiaries
Hartford HealthCare at Home, Inc. and
SubsidiaryNatchaug Hospital
Rushford Center, Inc. and
Subsidiary
Hartford HealthCare
LaboratoriesPractice Central
Hartford HealthCare Senior
Services
Hartford HealthCare
Endowment LLC
Hartford HealthCare Medical
Group
Hartford HealthCare Indemnity
Services, Ltd.
Backus Corporation and
Other Subsidiaries
Integrated Care Partners Eliminations Total
AssetsCurrent assets:
Cash and cash equivalents 96,373$ 19,917$ 9,302$ 5,077$ 24,232$ 48,819$ 3,277$ 2,311$ 4,867$ 1,297$ 2,134$ 10$ 13,188$ –$ 2,460$ 46,575$ 855$ 12,740$ –$ $ 293,434 Accounts receivable, less allowances for doubtful accounts 2,694 147,250 28,799 7,066 43,814 37,773 10 20,225 10,695 4,361 534 – 1,868 – 9,751 – 1,022 – – 315,862 Other receivables 3,428 19,655 4,836 2,116 13,109 52 1,222 – 1,369 533 1,103 – 252 – 2,254 5,159 6 (499) (29,706) 24,889
Interest in investments held by Endowment, LLC – 8,404 – – – – – – – – – – – – – – – – (8,404) – Due from affiliates 40,773 – – – – – 2,961 – – – – – – – – – – – (43,734) – Inventories of supplies – 17,611 3,235 718 6,049 3,761 – – 175 – 798 – 34 – 252 – – – – 32,633 Prepaid expenses and other current assets 11,492 8,024 3,017 303 2,636 3,294 28 304 252 247 226 – 220 – 494 111 – 18 – 30,666 Current portion of assets whose is limited – – – – – 4,643 – – – – – – – 8,404 – – – – – 13,047
Total current assets 154,760 220,861 49,189 15,280 89,840 98,342 7,498 22,840 17,358 6,438 4,795 10 15,562 8,404 15,211 51,845 1,883 12,259 (81,844) 710,531
Assets whose use is limited:Interest in investments held by Endowment, LLC – 321,906 15,567 85 155,241 332,131 – 12,168 – – – – – – – – – – (837,098) – Donor restricted interest in investments held by
Endowment, LLC – 226,868 1,675 2,146 33,234 8,775 – 6,321 – 38 – – – – – – – – (279,057) – Investments and other assets – 387 – 456 – 18,470 – – – – – – – 837,098 – – – – – 856,411 Investments for restricted purposes – 6,610 471 613 1,235 2,052 – – – – – – – 279,057 – – – – – 290,038 Escrow funds for long-term debt 75 73,382 – – – – – – – – – – – – – – – – – 73,457 Funds designated for debt service 556 8,998 6,308 1,440 3,594 – – – – – – – – – – – – – – 20,896 Investments held by HHCISL – – – – – – – – – – – – – – 205,072 – – – 205,072
631 638,151 24,021 4,740 193,304 361,428 – 18,489 – 38 – – – 1,116,155 – 205,072 – (1,116,155) 1,445,874
Funds held in trust by others – 136,935 14,190 3,086 15,419 2,472 – 5,747 50 – – – 5 – – – – – – 177,904 Interest in investments held by Endowment, LLC – – 74,071 – – – – 6,851 – 1,044 – – 2,874 – – – – – (84,840) – Investment in subsidiaries 563,909 – – – – – – – – – – – – – – – – (563,909) – Investments – – – – – – – – – – – – – 84,840 – – – – – 84,840 Other assets 19,786 86,372 13,747 2,834 22,739 12,439 758 – 484 67 5,000 – 324 – 5,848 – 969 – (78,141) 93,226 Property, plant, and equipment, net 275,811 465,129 102,200 35,531 179,734 114,328 24,391 2,471 11,257 5,737 5,417 – 14,426 – 12,239 – 716 – – 1,249,387 Total assets $ 1,014,897 $ 1,547,448 $ 277,418 $ 61,471 $ 501,036 $ 589,009 $ 32,647 $ 56,398 $ 29,149 $ 13,324 $ 15,212 $ 10 $ 33,191 $ 1,209,399 $ 33,298 $ 256,917 $ 3,568 $ 12,259 $ (1,924,889) $ 3,761,762
Liabilities and net assetsCurrent liabilities:
Accounts payable 20,286$ 49,305$ 4,741$ 1,587$ 5,611$ 5,607$ 112$ 519$ 628$ 260$ 1,061$ –$ 318$ –$ 1,789$ 280$ 47$ 64$ –$ $ 92,215 Salaries, wages, payroll taxes, and amounts withheld
from employees 28,262 34,624 5,678 3,060 8,403 4,123 54 2,647 2,019 777 1,652 – 838 – 10,839 – 543 52 – 103,571 Accrued expenses 35,658 35,666 1,734 990 13,103 5,848 1,312 3,805 104 1,473 3,550 1 1,915 – 2,370 130 23 13,097 – 120,779 Due to affiliates – 3,152 2,807 7,836 695 5,397 – 3,995 6,472 746 2,445 2 1,689 – 5,381 – 88 3,029 (43,734) – Estimated third-party payor settlements – 30,964 3,982 1,894 4,627 6,880 – 716 (75) 505 943 – – – – – – – – 50,436 Current portion of long-term debt and capital leases 23,920 26,222 1,081 252 450 433 – – 188 36 – – – – – – – – – 52,582 Current portion of accrued pension liabilities 1,103 1,861 – 1,373 – 1,860 – – – – – – – – – – – – – 6,197 Current portion of self-insurance liabilties and other liabilities 1,093 12,661 4,453 552 5,703 1,846 – – 98 – – – – – 1,397 55,841 – – (29,706) 53,938
Total current liabilities 110,322 194,455 24,476 17,544 38,592 31,994 1,478 11,682 9,434 3,797 9,651 3 4,760 – 21,776 56,251 701 16,242 (73,440) 479,718
Long-term debt and capital leases, less current portion 142,113 423,253 84,169 30,837 61,949 67,866 8,972 – 1,955 62 – – 20,425 – – – – – – 841,601 Accrued pension liabilities, less current portion 3,728 326,751 64,556 61,961 163,855 60,980 765 643 6,130 – – – – – 734 – – – – 690,103 Other liabilities, less current portion 2,510 46,656 16,357 14,546 27,052 11,658 668 – 581 35 – – 770 – 8,961 – – – (78,141) 51,653 Self insurance liabilities, less current portion – – – – – – – – – – – – – – – 132,389 – – – 132,389 Total liabilities 258,673 991,115 189,558 124,888 291,448 172,498 11,883 12,325 18,100 3,894 9,651 3 25,955 – 31,471 188,640 701 16,242 (151,581) 2,195,464
Net assets:Unrestricted 705,868 177,952 70,310 (69,977) 160,133 403,776 20,764 31,779 10,576 9,263 5,561 7 6,921 930,342 1,827 68,277 2,867 (3,983) (1,444,714) 1,087,549 Unrestricted attributable to noncontrolling interest – 2,199 – – – – – – – – – – – – – – – 819 3,018 Temporarily restricted 20,916 152,539 2,580 2,271 27,229 4,544 – 3,501 423 167 – – 310 279,057 – – – (299,973) 193,564 Permanently restricted 29,440 223,643 14,970 4,289 22,226 8,191 – 8,793 50 – – – 5 – – – – (29,440) 282,167
Total net assets 756,224 556,333 87,860 (63,417) 209,588 416,511 20,764 44,073 11,049 9,430 5,561 7 7,236 1,209,399 1,827 68,277 2,867 (3,983) (1,773,308) 1,566,298 Total liabilities and net assets $ 1,014,897 $ 1,547,448 $ 277,418 $ 61,471 $ 501,036 $ 589,009 $ 32,647 $ 56,398 $ 29,149 $ 13,324 $ 15,212 $ 10 $ 33,191 $ 1,209,399 $ 33,298 $ 256,917 $ 3,568 $ 12,259 $ (1,924,889) $ 3,761,762
Hartford Health Care Corporation and Subsidiaries
Consolidating Balance Sheet
September 30, 2016(In Thousands)
52

Hartford HealthCare
and Subsidiary
Hartford Hospital and Subsidiaries
MidState Medical Center and Subsidiary
Windham Hospital
Hospital of Central
Connecticut and Subsidiaries
Backus Hospital
H.H.M.O.B. and Subsidiaries
Hartford HealthCare at Home, Inc. and
SubsidiaryNatchaug Hospital
Rushford Center, Inc.
and Subsidiary
Hartford HealthCare
LaboratoriesPractice Central
Hartford HealthCare Senior
Services
Hartford HealthCare
Endowment LLC
Hartford HealthCare
Medical Group
Hartford HealthCare Indemnity
Services, Ltd.
Backus Corporation and
Other SubsidiariesIntegrated Care
Partners Eliminations TotalUnrestricted revenues, gains and other support:
Net patient service revenue 16,960$ 1,067,778$ 217,196$ 71,250$ 365,123$ 308,292$ –$ 91,187$ 50,533$ 20,591$ 48,254$ –$ 18,342$ –$ 109,445$ –$ 12,340$ –$ (8,799)$ 2,388,492$ Provision for bad debts 188 4,482 2,744 4,324 6,729 8,148 – 1,537 1,027 829 4,047 – 171 – 3,299 – 165 – – 37,690 Net patient service revenue less provision for
bad debts 16,772 1,063,296 214,452 66,926 358,394 300,144 – 89,650 49,506 19,762 44,207 – 18,171 – 106,146 – 12,175 – (8,799) 2,350,802 Other operating revenue 294,533 95,573 15,297 2,822 14,045 5,169 36,804 1,909 2,094 11,233 141,584 – 12,148 – 18,228 36,748 890 6,366 (395,401) 300,042 Net assets released from restrictions for operations – 10,049 235 1 978 508 – 60 67 50 – – 1,139 – – – – – – 13,087
311,305 1,168,918 229,984 69,749 373,417 305,821 36,804 91,619 51,667 31,045 185,791 – 31,458 – 124,374 36,748 13,065 6,366 (404,200) 2,663,931
Operating expenses: Salaries and wages 128,356 426,548 63,513 31,799 137,134 107,460 19,297 41,463 29,243 17,686 30,166 13 17,011 – 111,739 – 9,592 6,564 – 1,177,584 Employee benefits 38,382 76,217 16,629 11,355 39,773 30,312 4,655 8,818 8,782 4,857 10,346 3 4,721 – 19,080 – 1,916 1,602 – 277,448 Supplies and other 35,533 238,447 42,732 9,218 51,674 48,514 3,008 11,659 2,114 1,361 12,252 12 2,478 – 21,280 34,257 1,912 133 (35,904) 480,680 Purchased services 88,807 313,305 71,346 23,502 113,614 65,756 5,275 28,609 9,498 6,129 19,359 300 5,001 – 32,815 395 3,376 3,044 (363,959) 426,172 Depreciation and amortization 25,767 46,720 11,635 3,880 20,730 13,878 1,736 604 981 606 1,242 1,228 996 – 7,941 – 253 – – 138,197 Provision for non-patient bad debts 306 196 48 75 – – (9) – – – – – – – – – – – – 616 Interest 2,372 12,683 3,914 1,785 3,139 3,370 75 – 120 28 – – 274 – – – – – (79) 27,681
319,523 1,114,116 209,817 81,614 366,064 269,290 34,037 91,153 50,738 30,667 73,365 1,556 30,481 – 192,855 34,652 17,049 11,343 (399,942) 2,528,378
Income from operations (8,218) 54,802 20,167 (11,865) 7,353 36,531 2,767 466 929 378 112,426 (1,556) 977 – (68,481) 2,096 (3,984) (4,977) (4,258) 135,553
Nonoperating income (loss):Income from investments, net 987 32,987 9,228 405 11,884 31,808 12 2,462 23 90 5 – 248 115,031 209 – 19 – (115,031) 90,367 Other – (5,975) (1,080) (1,546) – 15 – 89 – – (271) – – – – – (6) – – (8,774)
987 27,012 8,148 (1,141) 11,884 31,823 12 2,551 23 90 (266) – 248 115,031 209 – 13 – (115,031) 81,593
Excess of revenues over expenses, before net income attributable to noncontrolling interest in joint venture (7,231) 81,814 28,315 (13,006) 19,237 68,354 2,779 3,017 952 468 112,160 (1,556) 1,225 115,031 (68,272) 2,096 (3,971) (4,977) (119,289) 217,146
Less: net income attributable to nontrolling interestin joint ventures – (5,612) – – – – – – – – – – – – – – – – (4,295) (9,907)
Excess (deficiency) of revenues over expenses $ (7,231) $ 76,202 $ 28,315 $ (13,006) $ 19,237 $ 68,354 $ 2,779 $ 3,017 $ 952 $ 468 $ 112,160 $ (1,556) $ 1,225 $ 115,031 $ (68,272) $ 2,096 $ (3,971) $ (4,977) $ (123,584) $ 207,239
Hartford Health Care Corporation and Subsidiaries
Consolidating Statement of Operations
For the Year Ended September 30, 2016(In Thousands)
53

EY | Assurance | Tax | Transactions | Advisory
About EYEY is a global leader in assurance, tax, transaction and advisory services. The insights and quality services we deliver help build trust and confidence in the capital markets and in economies the world over. We develop outstanding leaders who team to deliver on our promises to all of our stakeholders. In so doing, we play a critical role in building a better working world for our people, for our clients and for our communities.
EY refers to the global organization, and may refer to one or more, of the member firms of Ernst & Young Global Limited, each of which is a separate legal entity. Ernst & Young Global Limited, a UK company limited by guarantee, does not provide services to clients. For more information about our organization, please visit ey.com.
© 2016 Ernst & Young LLP. All Rights Reserved.
ey.com