16 GSM BSS Network KPI (Inter-RAT Handover Success Rate) Optimization Manual_2
23
GSM BSS Network KPI (Inter-RAT Handover Success Rate) Optimization Manual 2013-1-13 Page 1 of 23 Product Name G3BSC Product Version GSM BSS Network KPI (Inter-RAT Handover Success Rate) Optimization Manual Prepared by Date Reviewed by Date Reviewed by Date Granted by Date
Transcript of 16 GSM BSS Network KPI (Inter-RAT Handover Success Rate) Optimization Manual_2
GSM BSS Network KPI (Inter-RAT Handover Success Rate) Optimization Manual
2013-1-13 Page 1 of 23
Product Name
G3BSC
Product Version
GSM BSS Network KPI (Inter-RAT Handover
Success Rate) Optimization Manual
Prepared by Date
Reviewed by Date
Reviewed by Date
Granted by Date
GSM BSS Network KPI (Inter-RAT Handover Success Rate) Optimization Manual
2013-1-13 Page 2 of 23
Contents
1 Definition of the Inter-RAT Handover Success Rate ............................................................ 5
1.1 Definition ......................................................................................................................................................... 5
1.2 Recommended Formulas .................................................................................................................................. 5
1.2.1 Success Rate of Incoming Inter-RAT Inter-Cell Radio Handover .......................................................... 5
1.2.2 Success Rate of Outgoing Inter-RAT Inter-Cell Radio Handover ........................................................... 6
1.3 Signaling Procedure and Measurement Points ................................................................................................. 6
2 Influencing Factors ....................................................................................................................... 8
2.1 Hardware Failure .............................................................................................................................................. 8
2.2 Transmission Problems .................................................................................................................................... 8
2.3 Version Upgrade ............................................................................................................................................... 8
2.4 MS Problems .................................................................................................................................................... 9
2.5 Improper Parameter Settings ............................................................................................................................ 9
2.6 Unbalanced Traffic Volume ............................................................................................................................ 11
2.7 Intra-Network and Inter-Network Interference .............................................................................................. 12
2.8 Coverage Problems ........................................................................................................................................ 12
3 Analysis Process and Optimization Method ......................................................................... 13
3.1 Analysis Process ............................................................................................................................................. 13
3.2 Problem Location and Optimization Methods................................................................................................ 14
3.2.1 Checking the Hardware Status of the Cells with High Inter-RAT Handover Success Rate .................. 14
3.2.2 Checking the Transmission in the Cells with High Inter-RAT Handover Success Rate ....................... 15
3.2.3 Checking the Problems Caused by BSC Version Upgrade and BTS Version Upgrade ......................... 16
3.2.4 Checking the Parameter Settings in the Cells with High Inter-RAT Handover Success Rate ............... 16
3.2.5 Checking the Interference in the Cells with High Inter-RAT Handover Success Rate ......................... 17
3.2.6 Checking the Conditions of Coverage, Antenna, and Balance Between Uplink and Downlink in the
Cells with High Inter-RAT Handover Success Rate....................................................................................... 18
3.2.7 Checking the Repeaters in the Cells with Low Inter-RAT Handover Success Rate .............................. 19
4 Test Methods ................................................................................................................................ 20
5 Optimization Cases..................................................................................................................... 21
5.1 Case 1: Data Configuration ............................................................................................................................ 21
5.2 Case 2: Inter-RAT Handover Success Rate Decreasing Caused by Data Configuration ................................ 22
6 Information Feedback ................................................................................................................ 23

GSM BSS Network KPI (Inter-RAT Handover Success Rate) Optimization Manual
2013-1-13 Page 3 of 23
Revision Record
Date Version Description Author
References
SN Document Author Date
GSM BSS Network KPI (Inter-RAT Handover Success Rate) Optimization Manual
2013-1-13 Page 4 of 23
Network KPI (Inter-RAT Handover Success Rate) Optimization
Manual
Keywords: Inter-RAT handover success rate
Abstract: This document introduces the definition, test methods, and optimization methods of
the inter-RAT handover success rate.
Acronyms and Abbreviations:
Abbreviation Full Spelling
GSM BSS Network KPI (Inter-RAT Handover Success Rate) Optimization Manual
2013-1-13 Page 5 of 23
1 Definition of the Inter-RAT Handover Success Rate
1.1 Definition
The success rate of incoming inter-RAT inter-cell radio handover refers to the ratio of the total
number of successful handovers from 3G cell to 2G cell triggered by all causes to the total
number of handover requests from 3G cell to 2G cell triggered by all causes.
The success rate of outgoing inter-RAT inter-cell radio handover refers to the ratio of the total
number of successful handovers from 2G cell to 3G cell triggered by all causes to the total
number of handover commands from 2G cell to 3G cell triggered by all causes.
Both the success rate of incoming inter-RAT inter-cell radio handover and the success rate of
outgoing inter-RAT inter-cell radio handover are important retainability KPIs. The KPIs
directly affect the experience of 2G/3G users and are most significant KPIs for the operators
to appraise the 2G/3G network interoperability.
1.2 Recommended Formulas
1.2.1 Success Rate of Incoming Inter-RAT Inter-Cell Radio Handover
The success rate of incoming inter-RAT inter-cell radio handover is obtained on the basis of
the traffic measurement. The recommended formula is as follows:
Number of successful incoming inter-RAT inter-cell handovers/Number of incoming
inter-RAT inter-cell handover responses.
In the BSC6000, the recommended formula is as follows:
Success rate of incoming inter-RAT inter-cell radio handover = Number of successful
incoming inter-RAT inter-cell handovers/Number of Incoming inter-RAT inter-cell handover
responses x 100% = CH363/CH361 x 100%
GSM BSS Network KPI (Inter-RAT Handover Success Rate) Optimization Manual
2013-1-13 Page 6 of 23
1.2.2 Success Rate of Outgoing Inter-RAT Inter-Cell Radio Handover
The success rate of outgoing inter-RAT inter-cell radio handover is obtained on the basis of
the traffic measurement. The recommended formula is as follows: Number of successful
outgoing inter-RAT inter-cell handovers/Number of outgoing inter-RAT inter-cell handovers.
In the BSC6000, the recommended formula is as follows:
Success rate of outgoing inter-RAT inter-cell radio handover = Number of successful
outgoing inter-RAT inter-cell handovers/Number of outgoing inter-RAT inter-cell handovers x
100% = CH353/CH351 x 100%
For details, refer to the GSM BSS Network KPI (2G/3G Interoperability) Baseline.
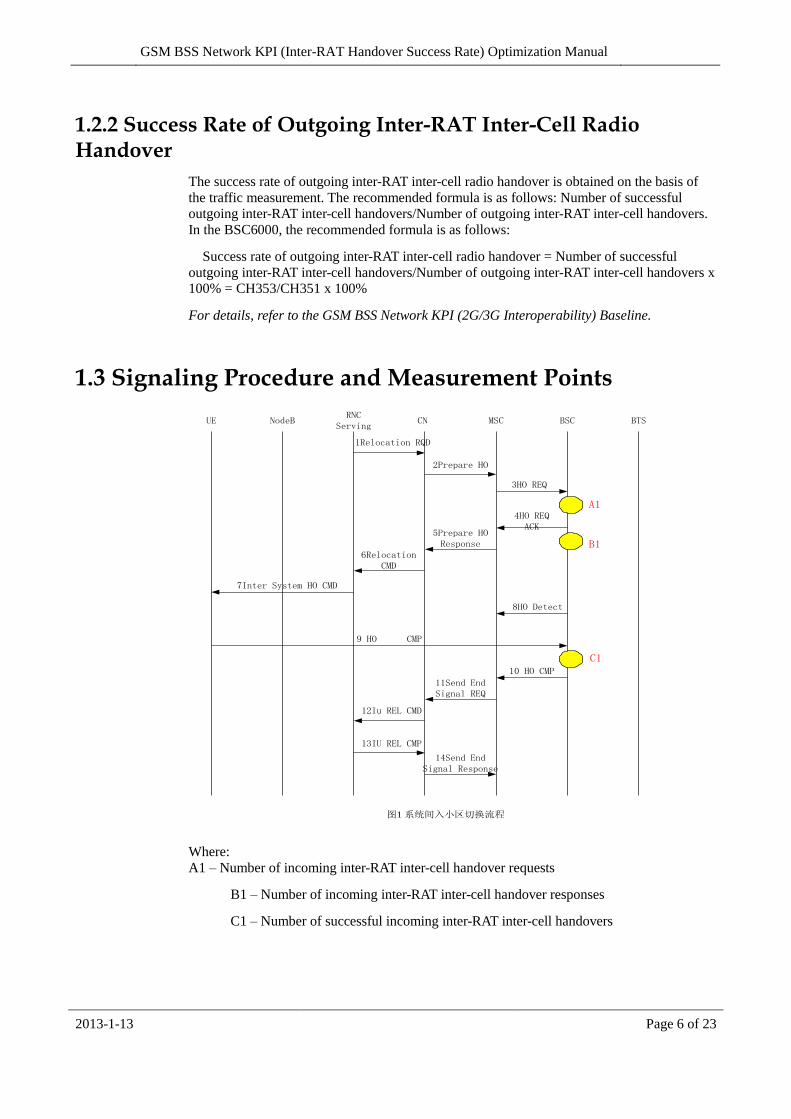
1.3 Signaling Procedure and Measurement Points
UE NodeBRNC
ServingCN MSC BSC BTS
1Relocation RQD
2Prepare HO
3HO REQ
4HO REQACK
5Prepare HOResponse
6RelocationCMD
7Inter System HO CMD
8HO Detect
9 HO CMP
10 HO CMP
11Send EndSignal REQ
12Iu REL CMD
13IU REL CMP
14Send EndSignal Response
A1
B1
C1
图1 系统间入小区切换流程
Where:
A1 – Number of incoming inter-RAT inter-cell handover requests
B1 – Number of incoming inter-RAT inter-cell handover responses
C1 – Number of successful incoming inter-RAT inter-cell handovers
GSM BSS Network KPI (Inter-RAT Handover Success Rate) Optimization Manual
2013-1-13 Page 7 of 23
UE NodeBRNC
ServingCN MSC BSC BTS
1HO RQD
5Prepare HOResponse
7 HO CMD
11Send EndSignal REQ
14Send EndSignal Response
2Prepare HO
3Relocation REQ
4Relocation REQACK
6HO CMD
8RelocationDetect
9 HO CMP
10RelocationCMP
12Clear CMD
13Clear CMP
A2
B2
C2
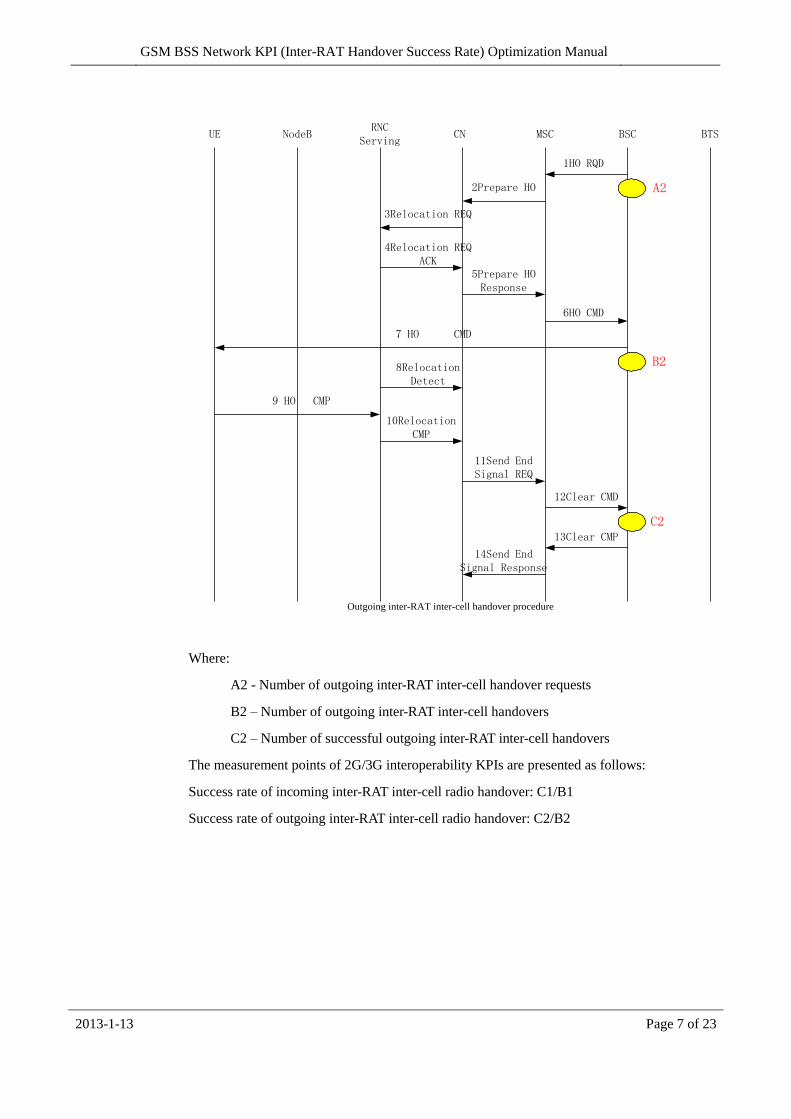
Outgoing inter-RAT inter-cell handover procedure
Where:
A2 - Number of outgoing inter-RAT inter-cell handover requests
B2 – Number of outgoing inter-RAT inter-cell handovers
C2 – Number of successful outgoing inter-RAT inter-cell handovers
The measurement points of 2G/3G interoperability KPIs are presented as follows:
Success rate of incoming inter-RAT inter-cell radio handover: C1/B1
Success rate of outgoing inter-RAT inter-cell radio handover: C2/B2

GSM BSS Network KPI (Inter-RAT Handover Success Rate) Optimization Manual
2013-1-13 Page 8 of 23
2 Influencing Factors
According to user complaints and network optimization experience, the major factors that
affect the inter-RAT handover success rate are as follows:
Hardware failure
Transmission problems
Version upgrade
MS problems
Improper parameter settings
Unbalanced traffic volume
Intra-network and inter-network interference
Coverage problems
2.1 Hardware Failure
During the test, when a large number of terrestrial resources are unavailable or devices are
faulty, seizing the TCH becomes difficult. As a result, the inter-RAT handover success rate
decreases.
2.2 Transmission Problems
The inter-RAT handover success rate decreases in any of the following conditions: (1) The
transmission quality is bad on the A or Abis interface due to various reasons. (2) Transmission
links are unstable.
2.3 Version Upgrade
All the current versions of the BSC6000 of Huawei support the handover between the GSM
and the 3G UTRAN FDD system. The initial field trial release and later versions, that is, the
BSC6000V9R3 and later versions, support the handover between the GSM and the 3G
UTRAN TDD system. However, if the following restrictions exist, that is, a version does not
support the inter-RAT handover in FFD or TDD mode, the inter-RAT handover may fail. As a
result, the inter-RAT handover success rate decreases.
GSM BSS Network KPI (Inter-RAT Handover Success Rate) Optimization Manual
2013-1-13 Page 9 of 23
2.4 MS Problems
Now, many operators take the sales strategy of presenting an MS for free after a subscriber
subscribes to 3G network services. Thus, most MSs are customized multi-mode MSs. To
implement special functions and features of operators, operators add and reduce some
functions from the MSs. In the network, when a type of MS always incurs handover failure,
the failure can be located through the MS-related support capability and parameter settings.
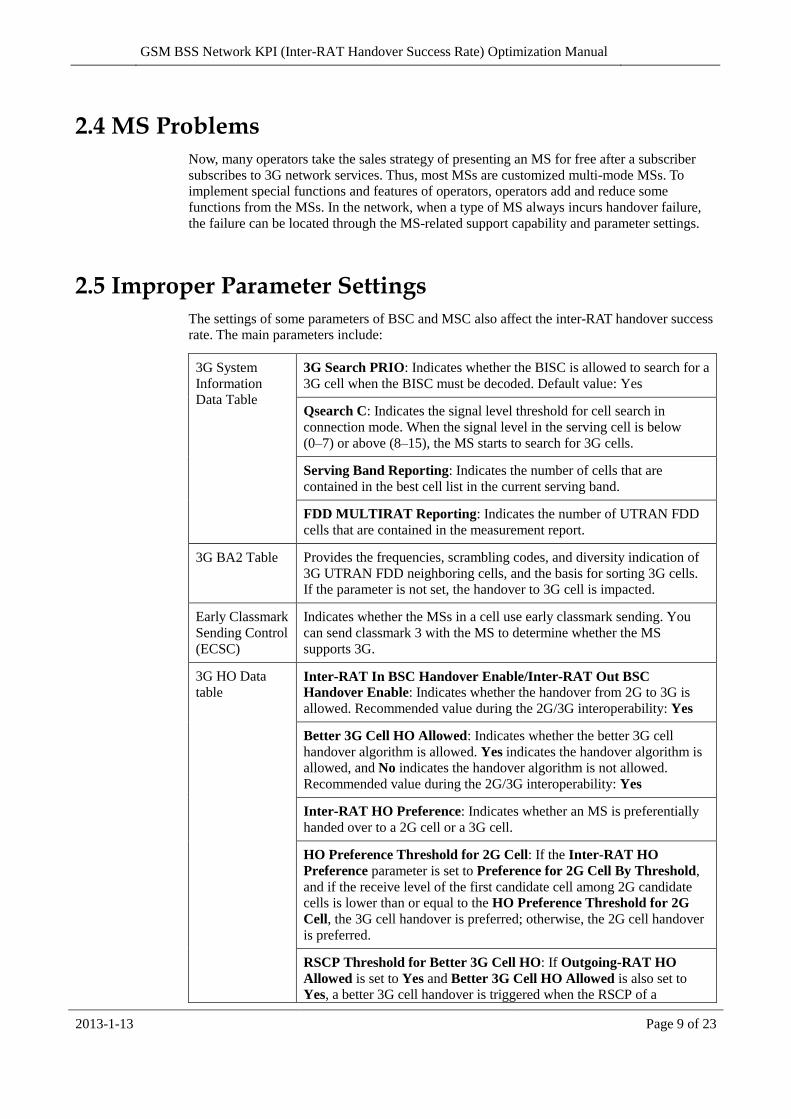
2.5 Improper Parameter Settings
The settings of some parameters of BSC and MSC also affect the inter-RAT handover success
rate. The main parameters include:
3G System
Information
Data Table
3G Search PRIO: Indicates whether the BISC is allowed to search for a
3G cell when the BISC must be decoded. Default value: Yes
Qsearch C: Indicates the signal level threshold for cell search in
connection mode. When the signal level in the serving cell is below
(0–7) or above (8–15), the MS starts to search for 3G cells.
Serving Band Reporting: Indicates the number of cells that are
contained in the best cell list in the current serving band.
FDD MULTIRAT Reporting: Indicates the number of UTRAN FDD
cells that are contained in the measurement report.
3G BA2 Table Provides the frequencies, scrambling codes, and diversity indication of
3G UTRAN FDD neighboring cells, and the basis for sorting 3G cells.
If the parameter is not set, the handover to 3G cell is impacted.
Early Classmark
Sending Control
(ECSC)
Indicates whether the MSs in a cell use early classmark sending. You
can send classmark 3 with the MS to determine whether the MS
supports 3G.
3G HO Data
table Inter-RAT In BSC Handover Enable/Inter-RAT Out BSC
Handover Enable: Indicates whether the handover from 2G to 3G is
allowed. Recommended value during the 2G/3G interoperability: Yes
Better 3G Cell HO Allowed: Indicates whether the better 3G cell
handover algorithm is allowed. Yes indicates the handover algorithm is
allowed, and No indicates the handover algorithm is not allowed.
Recommended value during the 2G/3G interoperability: Yes
Inter-RAT HO Preference: Indicates whether an MS is preferentially
handed over to a 2G cell or a 3G cell.
HO Preference Threshold for 2G Cell: If the Inter-RAT HO
Preference parameter is set to Preference for 2G Cell By Threshold,
and if the receive level of the first candidate cell among 2G candidate
cells is lower than or equal to the HO Preference Threshold for 2G
Cell, the 3G cell handover is preferred; otherwise, the 2G cell handover
is preferred.
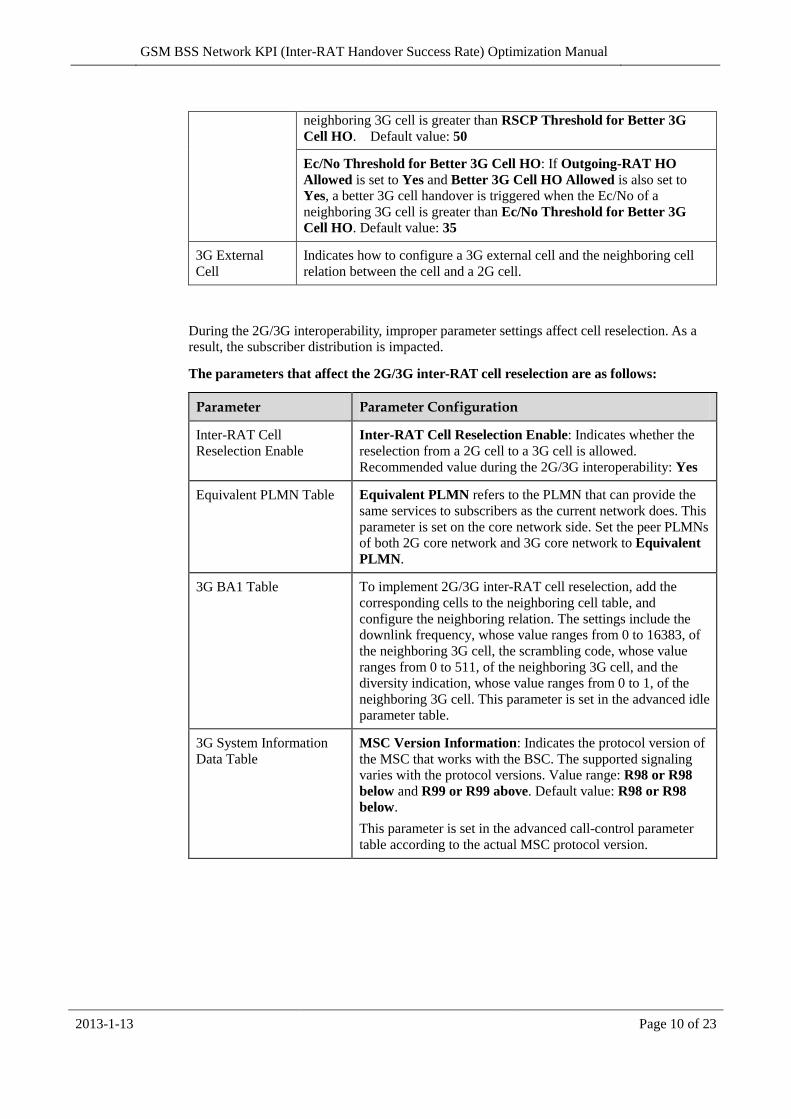
RSCP Threshold for Better 3G Cell HO: If Outgoing-RAT HO
Allowed is set to Yes and Better 3G Cell HO Allowed is also set to Yes, a better 3G cell handover is triggered when the RSCP of a
GSM BSS Network KPI (Inter-RAT Handover Success Rate) Optimization Manual
2013-1-13 Page 10 of 23
neighboring 3G cell is greater than RSCP Threshold for Better 3G
Cell HO. Default value: 50
Ec/No Threshold for Better 3G Cell HO: If Outgoing-RAT HO
Allowed is set to Yes and Better 3G Cell HO Allowed is also set to
Yes, a better 3G cell handover is triggered when the Ec/No of a
neighboring 3G cell is greater than Ec/No Threshold for Better 3G
Cell HO. Default value: 35
3G External
Cell
Indicates how to configure a 3G external cell and the neighboring cell
relation between the cell and a 2G cell.
During the 2G/3G interoperability, improper parameter settings affect cell reselection. As a
result, the subscriber distribution is impacted.
The parameters that affect the 2G/3G inter-RAT cell reselection are as follows:
Parameter Parameter Configuration
Inter-RAT Cell
Reselection Enable
Inter-RAT Cell Reselection Enable: Indicates whether the
reselection from a 2G cell to a 3G cell is allowed.
Recommended value during the 2G/3G interoperability: Yes
Equivalent PLMN Table Equivalent PLMN refers to the PLMN that can provide the
same services to subscribers as the current network does. This
parameter is set on the core network side. Set the peer PLMNs
of both 2G core network and 3G core network to Equivalent
PLMN.
3G BA1 Table To implement 2G/3G inter-RAT cell reselection, add the
corresponding cells to the neighboring cell table, and
configure the neighboring relation. The settings include the
downlink frequency, whose value ranges from 0 to 16383, of
the neighboring 3G cell, the scrambling code, whose value
ranges from 0 to 511, of the neighboring 3G cell, and the
diversity indication, whose value ranges from 0 to 1, of the
neighboring 3G cell. This parameter is set in the advanced idle
parameter table.
3G System Information
Data Table
MSC Version Information: Indicates the protocol version of
the MSC that works with the BSC. The supported signaling
varies with the protocol versions. Value range: R98 or R98
below and R99 or R99 above. Default value: R98 or R98
below.
This parameter is set in the advanced call-control parameter
table according to the actual MSC protocol version.
GSM BSS Network KPI (Inter-RAT Handover Success Rate) Optimization Manual
2013-1-13 Page 11 of 23
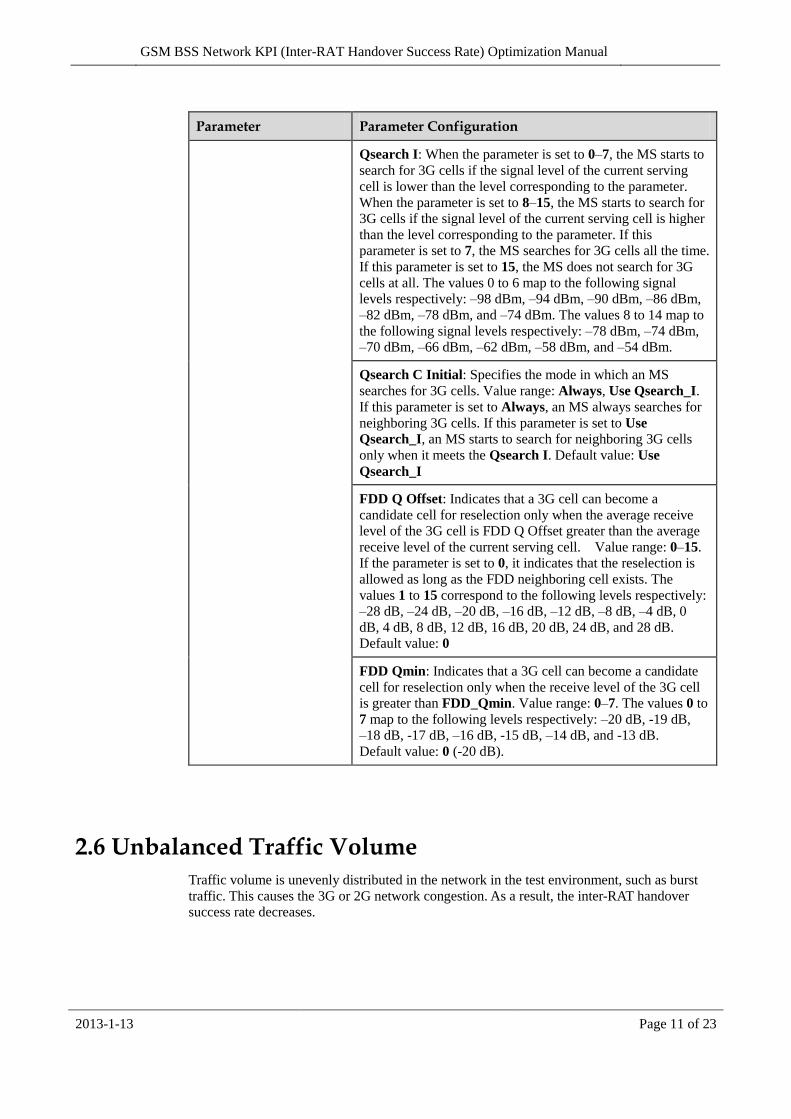
Parameter Parameter Configuration
Qsearch I: When the parameter is set to 0–7, the MS starts to
search for 3G cells if the signal level of the current serving
cell is lower than the level corresponding to the parameter.
When the parameter is set to 8–15, the MS starts to search for
3G cells if the signal level of the current serving cell is higher
than the level corresponding to the parameter. If this
parameter is set to 7, the MS searches for 3G cells all the time.
If this parameter is set to 15, the MS does not search for 3G
cells at all. The values 0 to 6 map to the following signal
levels respectively: –98 dBm, –94 dBm, –90 dBm, –86 dBm,
–82 dBm, –78 dBm, and –74 dBm. The values 8 to 14 map to
the following signal levels respectively: –78 dBm, –74 dBm,
–70 dBm, –66 dBm, –62 dBm, –58 dBm, and –54 dBm.
Qsearch C Initial: Specifies the mode in which an MS
searches for 3G cells. Value range: Always, Use Qsearch_I.
If this parameter is set to Always, an MS always searches for
neighboring 3G cells. If this parameter is set to Use
Qsearch_I, an MS starts to search for neighboring 3G cells
only when it meets the Qsearch I. Default value: Use
Qsearch_I
FDD Q Offset: Indicates that a 3G cell can become a
candidate cell for reselection only when the average receive
level of the 3G cell is FDD Q Offset greater than the average
receive level of the current serving cell. Value range: 0–15.
If the parameter is set to 0, it indicates that the reselection is
allowed as long as the FDD neighboring cell exists. The
values 1 to 15 correspond to the following levels respectively:
–28 dB, –24 dB, –20 dB, –16 dB, –12 dB, –8 dB, –4 dB, 0
dB, 4 dB, 8 dB, 12 dB, 16 dB, 20 dB, 24 dB, and 28 dB.
Default value: 0
FDD Qmin: Indicates that a 3G cell can become a candidate
cell for reselection only when the receive level of the 3G cell
is greater than FDD_Qmin. Value range: 0–7. The values 0 to
7 map to the following levels respectively: –20 dB, -19 dB,
–18 dB, -17 dB, –16 dB, -15 dB, –14 dB, and -13 dB.
Default value: 0 (-20 dB).
2.6 Unbalanced Traffic Volume
Traffic volume is unevenly distributed in the network in the test environment, such as burst
traffic. This causes the 3G or 2G network congestion. As a result, the inter-RAT handover
success rate decreases.
GSM BSS Network KPI (Inter-RAT Handover Success Rate) Optimization Manual
2013-1-13 Page 12 of 23
2.7 Intra-Network and Inter-Network Interference
If inter-network interference and repeater interference exist, or if severe intra-network
interference occurs because of tight frequency reuse, call drops may occur on SD or TCH
channels due to bad QoS. This affects the inter-RAT handover success rate.
The following types of interference may occur:
1. Inter-network interference from scramblers or privately installed antennas
2. Repeater interference
3. Intermodulation interference from BTSs
4. Intra-network co-channel and adjacent-channel interference
5. Three-phrase intermodulation interference from other inter-network systems
2.8 Coverage Problems
The following coverage problems may affect the inter-RAT handover success rate:
1. Discontinuous coverage (blind areas)
In complex terrains covered by 3G BTSs and complex radio transmission environment, and at
the early construction stage of the 3G network, the inter-RAT handover success rate decreases
because of the discontinuous coverage of 3G signals.
2. Poor indoor coverage
Densely distributed buildings and thick walls cause great attenuation. In addition, the 2G and
3G signal loss difference causes 2G and 3G signal coverage difference. As a result, the
inter-RAT handover success rate decreases during a call.
3. Insufficient coverage
At the late construction stage of the 3G network, if the site is selected incorrectly, the signals
from antennas are blocked or the BCCH TRX is faulty. As a result, the inter-RAT handover
success rate decreases because of discontinuous coverage.
GSM BSS Network KPI (Inter-RAT Handover Success Rate) Optimization Manual
2013-1-13 Page 13 of 23
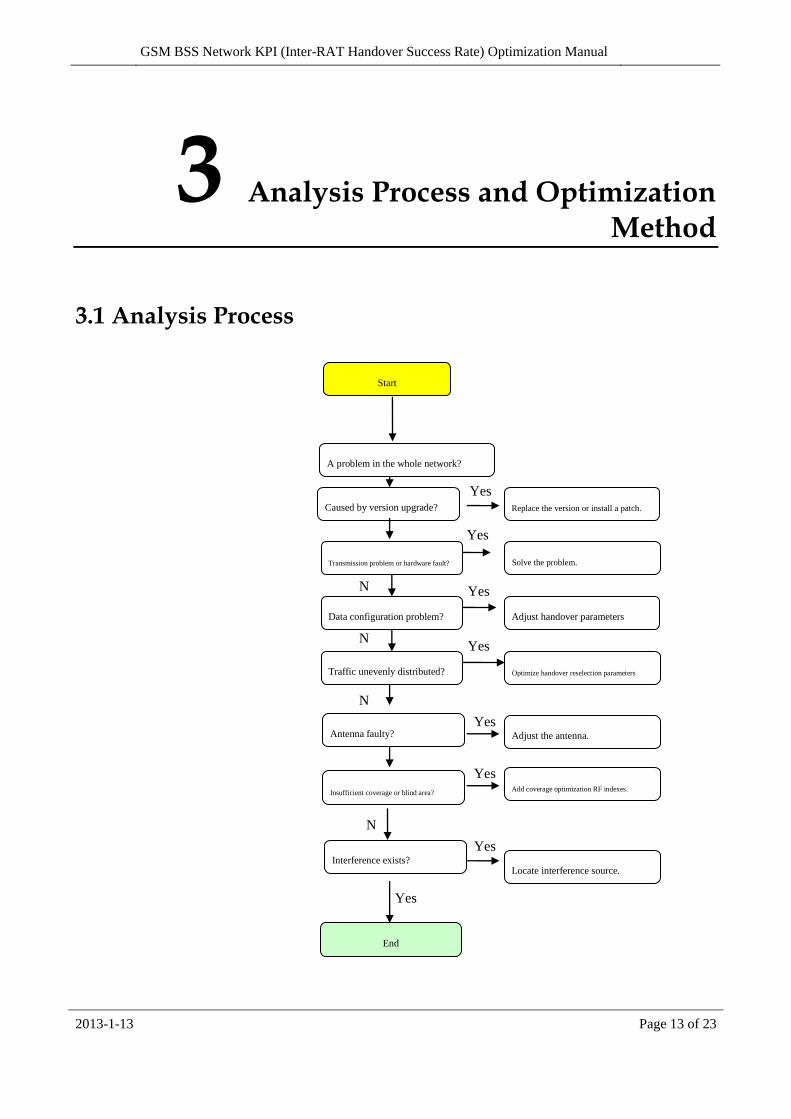
3 Analysis Process and Optimization Method
3.1 Analysis Process
A problem in the whole network?
Antenna faulty? Adjust the antenna.
Add coverage optimization RF indexes.
Locate interference source.
Replace the version or install a patch.
Start
Data configuration problem?
Interference exists?
N
o
Yes
否
Insufficient coverage or blind area?
Transmission problem or hardware fault?
Adjust handover parameters
Solve the problem.
Yes
Traffic unevenly distributed? Optimize handover reselection parameters
Yes
End
Yes
Caused by version upgrade?
N
o
N
o
N
o
N
o
Yes
Yes
Yes
Yes
GSM BSS Network KPI (Inter-RAT Handover Success Rate) Optimization Manual
2013-1-13 Page 14 of 23
3.2 Problem Location and Optimization Methods
General ideas
To analyze an inter-RAT handover success rate problem, determine whether the problem
exists in a cell or in the whole network first of all. If the problem of low handover success rate
exists in the whole network, the relevant parameter may be set incorrectly. You must check
the parameter settings.
First, determine whether the problem is an outgoing inter-RAT handover problem or an
incoming inter-RAT handover problem through the analysis of traffic measurement.
Preliminarily find the handover failure causes through the analysis of the traffic statistics.
Secondly, if the problem exists in some cells in a certain area, you need to find the detailed
causes. Check whether the software version supports the 3G inter-RAT handover. Or view the
product release description of inter-RAT handover. Rectify the problems caused by the
defective software, version upgrade or version itself.
After rectifying the preceding problems, check whether the hardware and transmission in
these cells incur error, whether relevant alarms are generated, and whether these cells are in
normal status.
Check whether the traffic volume bursts or is congested. In this way, rectify the antenna
problem, insufficient coverage problem, and interference problem. Thus, finally rectify the
inter-RAT handover success rate problem.
Specific analysis methods and ideas
First, determine the handover failure scope through the analysis of traffic measurement. If the
inter-RAT handover success rate is low in all the cells, you need to rectify the problem by
checking the inter-RAT handover characteristics parameters, circuits on the A interface, and
BSC clock.
Secondly, classify the cells into the cells with low inter-RAT handover success rate and TOPN
cells, and then perform the following steps to rectify the problem.
Thirdly, check the success rate of outgoing inter-RAT inter-cell handover and success rate of
incoming inter-RAT inter-cell handover in the inter-RAT handover measurement.
Subsequently, analyze the outgoing/incoming inter-RAT inter-cell handover measurement of
faulty cells to find the cells to which handover failure occurs. Analyze the failure causes, and
make statistics of the distribution of these causes.
Fourthly, check the TRX availability of faulty cells to determine whether the failure is caused
by faulty devices.
Fifthly, check the number of A interface failures during TCH seizure and the number of
terrestrial link disconnections to determine whether the failure is caused by faulty terrestrial
link devices.
3.2.1 Checking the Hardware Status of the Cells with High Inter-RAT Handover Success Rate
If a TRX or a combiner is faulty or if an RF cable is incorrectly connected, seizing the
SDCCH becomes difficult, and thus the inter-RAT handover success rate decreases.
You can check whether hardware is faulty by viewing BTS alarms or viewing the hardware
state on the Site Device Panel of the LMT. The following table lists the major BSC alarms
related to hardware failures:

GSM BSS Network KPI (Inter-RAT Handover Success Rate) Optimization Manual
2013-1-13 Page 15 of 23
Alarm ID Alarm Name
1000 LAPD_OML fault
2204 TRX communication alarm
4414 TRX VSWR alarm
3606 DRU hardware alarm
In addition, you can locate the fault by checking the traffic measurement related to hardware
failures, as shown in the following table.
Cause BSC Level Cell Level
Equipment
faults BSC Measurement -> Access
measurement per BSC ->
Congestion Ratio on SDCCH per
BSC
SDCCH Availability per BSC
Channel Measurement ->
Analyzed Measurement of Available
Channels (SDCCH)
Call Measurement -> Call Drop
Measurement
Call Drops due to Equipment Failure
(Signaling Channel)
3.2.2 Checking the Transmission in the Cells with High Inter-RAT Handover Success Rate
Poor transmission quality, unstable transmission links, or insufficient resources on the Abis
and A interfaces may lead to the decrease of the inter-RAT handover success rate. You can
check the transmission conditions by viewing the alarms related to transmission. If a large
number of transmission alarms are generated, you can infer that transmission failures occur.
Then, you should check the transmission connections.
The following table lists the BSC alarms related to transmission failures:
Alarm ID Alarm Name
1000 LAPD_OML fault
11270 LAPD alarm
11278 E1 local alarm
11280 E1 remote alarm
20081 Loss of E1/T1 signals (LOS)
20082 Loss of E1/T1 frames (LOF)
In addition, you can locate the fault by checking the traffic measurement related to
transmission failures, as shown in the following table.
GSM BSS Network KPI (Inter-RAT Handover Success Rate) Optimization Manual
2013-1-13 Page 16 of 23
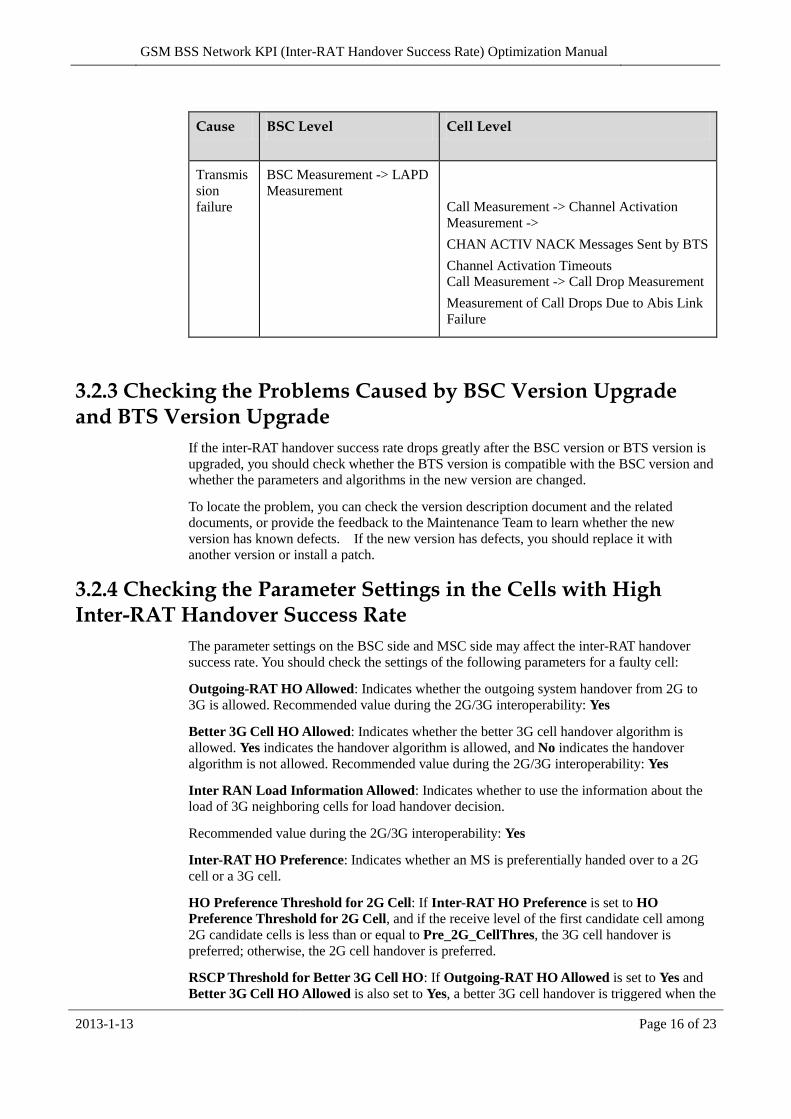
Cause BSC Level Cell Level
Transmis
sion
failure
BSC Measurement -> LAPD
Measurement
Call Measurement -> Channel Activation
Measurement ->
CHAN ACTIV NACK Messages Sent by BTS
Channel Activation Timeouts
Call Measurement -> Call Drop Measurement
Measurement of Call Drops Due to Abis Link
Failure
3.2.3 Checking the Problems Caused by BSC Version Upgrade and BTS Version Upgrade
If the inter-RAT handover success rate drops greatly after the BSC version or BTS version is
upgraded, you should check whether the BTS version is compatible with the BSC version and
whether the parameters and algorithms in the new version are changed.
To locate the problem, you can check the version description document and the related
documents, or provide the feedback to the Maintenance Team to learn whether the new
version has known defects. If the new version has defects, you should replace it with
another version or install a patch.
3.2.4 Checking the Parameter Settings in the Cells with High Inter-RAT Handover Success Rate
The parameter settings on the BSC side and MSC side may affect the inter-RAT handover
success rate. You should check the settings of the following parameters for a faulty cell:
Outgoing-RAT HO Allowed: Indicates whether the outgoing system handover from 2G to
3G is allowed. Recommended value during the 2G/3G interoperability: Yes
Better 3G Cell HO Allowed: Indicates whether the better 3G cell handover algorithm is
allowed. Yes indicates the handover algorithm is allowed, and No indicates the handover
algorithm is not allowed. Recommended value during the 2G/3G interoperability: Yes
Inter RAN Load Information Allowed: Indicates whether to use the information about the
load of 3G neighboring cells for load handover decision.
Recommended value during the 2G/3G interoperability: Yes
Inter-RAT HO Preference: Indicates whether an MS is preferentially handed over to a 2G
cell or a 3G cell.
HO Preference Threshold for 2G Cell: If Inter-RAT HO Preference is set to HO
Preference Threshold for 2G Cell, and if the receive level of the first candidate cell among
2G candidate cells is less than or equal to Pre_2G_CellThres, the 3G cell handover is
preferred; otherwise, the 2G cell handover is preferred.
RSCP Threshold for Better 3G Cell HO: If Outgoing-RAT HO Allowed is set to Yes and
Better 3G Cell HO Allowed is also set to Yes, a better 3G cell handover is triggered when the
GSM BSS Network KPI (Inter-RAT Handover Success Rate) Optimization Manual
2013-1-13 Page 17 of 23
RSCP of a neighboring 3G cell is greater than RSCP Threshold for Better 3G Cell HO.
Default value: 50
Ec/No Threshold for Better 3G Cell HO: If Outgoing-RAT HO Allowed is set to Yes and
Better 3G Cell HO Allowed is also set to Yes, a better 3G cell handover is triggered when the
Ec/No of a neighboring 3G cell is greater than Ec/No Threshold for Better 3G Cell HO.
Default value: 35
3G Search PRIO: Indicates whether the BISC is allowed to search for a 3G cell when the
BISC must be decoded. Default value: Yes
QSearch C: Indicates the signal level threshold for cell search in connection mode. When the
signal level in the serving cell is below (0–7) or above (8–15), the MS starts to search for 3G
cells.
Serving Band Reporting: Indicates the number of cells that are contained in the best cell list
in the current serving band.
FDD MULTIRAT Reporting: Indicates the number of UTRAN FDD cells that are contained
in the measurement report.
3.2.5 Checking the Interference in the Cells with High Inter-RAT Handover Success Rate
If inter-network interference and repeater interference exist, or if severe intra-network
interference occurs because of tight frequency reuse, call drops may occur on SD or TCH
channels due to bad QoS. This affects the inter-RAT handover success rate.
The uplink interference information can be obtained on the basis of the interference band
distribution in the traffic measurement results. A large proportion of interference levels belong
to interference bands 3–5, you can infer that the uplink has strong interference. In this case,
you can view the interference band distribution at the TRX level based on the SD or TCH
measurement report.
The interference elimination can be classified into intra-network interference elimination and
inter-network interference elimination. For details about interference elimination, see the
G-Guide to Eliminating Interference.

GSM BSS Network KPI (Inter-RAT Handover Success Rate) Optimization Manual
2013-1-13 Page 18 of 23
Cause TRX Level
Interference
MR Measurement ->
Interference Band Measurement ->
Mean Number of SDCCHs in Interference Band 1
Mean Number of SDCCHs in Interference Band 2
Mean Number of SDCCHs in Interference Band 3
Mean Number of SDCCHs in Interference Band 4
Mean Number of SDCCHs in Interference Band 5
MR Measurement ->
Interference Band Measurement ->
Mean Number of TCHFs in Interference Band 1
Mean Number of TCHFs in Interference Band 2
Mean Number of TCHFs in Interference Band 3
Mean Number of TCHFs in Interference Band 4
Mean Number of TCHFs in Interference Band 5
MR Measurement ->
Interference Band Measurement ->
Mean Number of TCHHs in Interference Band 1
Mean Number of TCHHs in Interference Band 2
Mean Number of TCHHs in Interference Band 3
Mean Number of TCHHs in Interference Band 4
Mean Number of TCHHs in Interference Band 5
3.2.6 Checking the Conditions of Coverage, Antenna, and Balance Between Uplink and Downlink in the Cells with High Inter-RAT Handover Success Rate
In the cells with high inter-RAT handover success rate, you can check the network coverage
through DT and CQT. Coverage problems or imbalance problems between UL and DL exist if
the following phenomena occurs: DL receive level is low; the difference between the UL level
and DL level is large in the measurement report viewed through the signaling, level quality
deteriorates gradually, the DL measurement report is lost, and call access is performed for a
long time.
In the cell where the preceding problems exist, the call establishment success rate and
handover success rate are impacted. The deteriorated receive quality is also reflected in the
quality traffic measurement. In addition, you can analyze the cell coverage based on the drive
test route and geographical condition, and troubleshoot the antenna system based on a fault
symptom. Some cell coverage problems and imbalance problems between UL and DL are
caused by the coverage direction and tilt angle of antennas, and damage, water penetration,
and loose connector of antenna feeders.
To rectify the preceding problems, see the following documents: GSM BSS Network KPI (Coverage) Optimization Manual and GSM BSS Network KPI (Uplink and Downlink Balance)
Optimization Manual.
GSM BSS Network KPI (Inter-RAT Handover Success Rate) Optimization Manual
2013-1-13 Page 19 of 23
3.2.7 Checking the Repeaters in the Cells with Low Inter-RAT Handover Success Rate
Check whether the parameter Directly Magnifier Site Flag is set to Yes in the data
configuration on the LMT and whether the signaling channel handover is enabled. If this
parameter is set to Yes, you can infer that the cell is configured with repeaters. If this
parameter is set to No, you should check whether other operators' repeaters are installed near
the cell.
If repeaters are installed, check whether the type, operating frequency band and operating
bandwidth (broadband or narrowband) of the repeaters impact the inter-RAT handover
success rate. If it is, check whether the UL/DL magnifying coefficient is excessively high. If it
is, reduce the coefficient. If the impact is serious, disable the repeater.
In addition, you should check whether a repeater is faulty and whether the uplink/downlink
gain is set to a too great/small value. If this problem exists, the actual coverage area of the
BTS may different from the planed coverage area. Thus, the call drop rate increases.
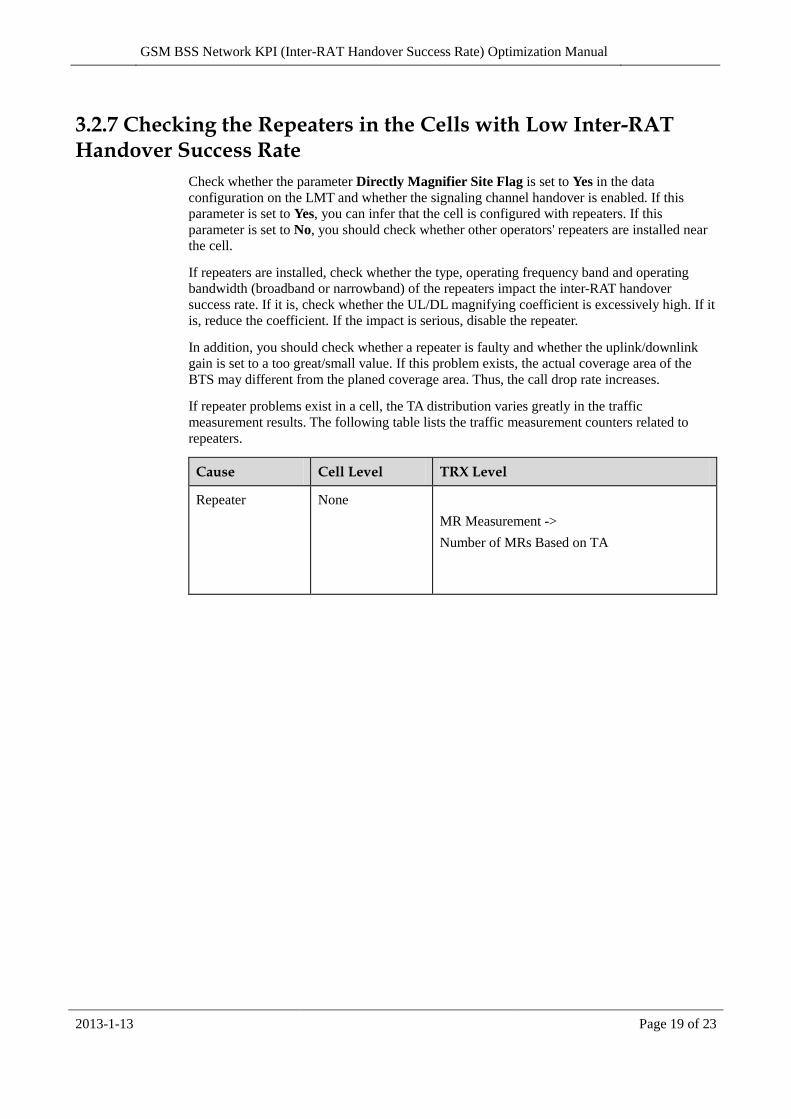
If repeater problems exist in a cell, the TA distribution varies greatly in the traffic
measurement results. The following table lists the traffic measurement counters related to
repeaters.
Cause Cell Level TRX Level
Repeater None
MR Measurement ->
Number of MRs Based on TA

GSM BSS Network KPI (Inter-RAT Handover Success Rate) Optimization Manual
2013-1-13 Page 20 of 23
4 Test Methods
The inter-RAT handover success rate can be obtained through the registration or reporting of
the related traffic measurement counters. Because the 3G system belongs to different
manufacturers, the inter-RAT handover may have cooperation problems. Thus, you need to
adjust the relevant parameters of the 3G system, and troubleshoot the 2G system based on the
preceding check.
GSM BSS Network KPI (Inter-RAT Handover Success Rate) Optimization Manual
2013-1-13 Page 21 of 23
5 Optimization Cases
5.1 Case 1: Data Configuration
Problem description: In a site, the GSM network and UMTS network coexist. A customer
requires enabling the reselection from a 2G cell to a 3G cell, and disabling the handover from
the 2G cell to the 3G cell.
Problem analysis and handling: Based on the preceding analysis, set the BSC-related
parameters as follows:
1. Make a 3G external neighboring cell datasheet, and then import the datasheet to the BSC
through the mass import function of the LMT.
2. Set Inter-System Handover Enable to Yes.
3. Set the relevant parameters in the parameter table that is displayed by choosing Call
Control -> UTRAN System Message, thus ensuring the reselection from a 2G cell to a
3G cell. The parameters related to cell reselection contain Qsearch I, FDD Q Offset,
and FDD Qmin. The specific value can be set as required and the operation is beyond
the scope of this document.
The preceding settings ensure the reselection from a 2G cell to a 3G cell. Then, we
disable the handover from a 2G cell to a 3G cell:
4. Set Qsearch C to 15, which indicates that no 3G cell is searched in connection mode.
5. Set Inter-RAT HO Preference in the UTRAN FDD handover datasheet to Preference
for 2G Cell. That is, a 2G neighboring cell is selected preferentially in accordance with
the handover strategy.
6. Set the parameters in the 3G external neighboring table as follows:
Min RSCP Threshold = 63
Min Ec/No Threshold = 49
RSCP Threshold for Layer Of 3G Cell = 63
Ec/No Threshold for Layer Of 3G Cell = 49
Setting the RSCP threshold to 63 (maximum value) indicates that a 3G neighboring cell
cannot become a candidate neighboring cell until its receive level is greater than 63, that
is, -25 dBm. Setting the Ec/No threshold to 49 (maximum value) indicates that a 3G
neighboring cell cannot become a candidate neighboring cell until its signal-to-noise
ratio is greater than 0 dB. In this way, the handover from a 2G cell to a 3G cell is
disabled, because no 3G neighboring cell can meet so rigid RSCP and Ec/No thresholds
in practice. Then, by viewing the outgoing handover traffic measurement from a GSM
cell to a UMTS cell for a week, you can find that no handover request from a 2G cell to a
cell 3G cell is initiated. It indicates that the preceding settings make us achieve expected
objectives.
GSM BSS Network KPI (Inter-RAT Handover Success Rate) Optimization Manual
2013-1-13 Page 22 of 23
5.2 Case 2: Inter-RAT Handover Success Rate Decreasing Caused by Data Configuration
Problem description: The operator M in S country had used Huawei 2G equipment for two
years in Al kharj area. The network run normally and the network KPIs were stable. On
March 16, 2008, we suddenly found that the incoming BSC handover success rate of the
BSC132 had decreased drastically from 97% to 40% during KPI statistics.
Problem analysis and handling: After communicating with M's optimization department,
we find that the competitor A has deployed and powered on its 3G equipment in the area
without informing Huawei in advance, resulting in high failure rate of Huawei inter-BSC
handover.
Huawei equipment version in the existing network:
BSC version:
G3BSC32V300R002C13SP54
BTS version:
BTS : GBT312G3BTS32V302R007C07B001
In the existing network, Huawei BSC132 is mounted on the MSC102 of competitor E, and the
RNC16 of competitor A is mounted on the MSC104 of competitor E. As a result, the
inter-RAT interoperability problem occurs between two systems of three manufacturers. Upon
coordination, three manufacturers performed the first combined DT on March 20, and drove
from a 2G/3G co-sited cell to a 2G coverage area. In addition, Huawei OMC was required to
trace signaling on the A interface and user plane at the same time. In the test process, we
found that the 3G UE sent a 2D event to the system and requested the handover when the
RSCP was weak, but the UE receives no response until the call was dropped. Through
analysis, it was found that Huawei BSC did not respond to the handover request. After
location, we found that the problem was concentrated on data configuration.
To check the data configuration of the BSC, first check the following aspects:
1. Encryption algorithm
2. MSC version supported by the BSC
3. Configuration of the external LAC
4. Enabling state of inter-RAT handover
After confirmation between Huawei and engineers of competitors A and E, we found that the
3G system adopted A5/1 algorithm, the current MSC version was R99, and the external LAC
had been added. Finally, the problem was concentrated on the setting of the inter system HO
allowed parameter in the Modify BSC Interface Phase ID table. After the parameter was set
to Yes, the inter-RAT handover was normal. Through CN signaling trace, the MSC104
received the handover complete message from the MSC102, and the success rate of Huawei
inter-BSC handover increases to the normal level.

GSM BSS Network KPI (Inter-RAT Handover Success Rate) Optimization Manual
2013-1-13 Page 23 of 23
6 Information Feedback
If the call drop rate is high and technical support is required, fill in the following form:
Information Remarks Purpose
Software version Software versions of the BSC and
BTS Check whether the software version is defective.
Data
configuration
table
*.dat files Check the network optimization parameters and
power configuration.
Alarm
information Alarm information related to
hardware, clock, and transmission
(self-check)
Check whether such alarms are generated in the
faulty cell. Such alarms should be cleared.
Traffic
measurement Causes of inter-RAT handover
failure
Incoming/outgoing inter-RAT handover
measurement
Signaling RSL signaling tracing data Check the causes of call drops.
DT data *.log (*.CELL) files or *.ant files Based on the drive test data, determine whether
interference or coverage problems exist.
Others Engineering parameter tables and
e-maps Facilitate the checking of the geographical
information by the NASTAR tool.