
1
28
www.rsc.org/ advances RSC Advances This is an Accepted Manuscript, which has been through the Royal Society of Chemistry peer review process and has been accepted for publication. Accepted Manuscripts are published online shortly after acceptance, before technical editing, formatting and proof reading. Using this free service, authors can make their results available to the community, in citable form, before we publish the edited article. This Accepted Manuscript will be replaced by the edited, formatted and paginated article as soon as this is available. You can find more information about Accepted Manuscripts in the Information for Authors. Please note that technical editing may introduce minor changes to the text and/or graphics, which may alter content. The journal’s standard Terms & Conditions and the Ethical guidelines still apply. In no event shall the Royal Society of Chemistry be held responsible for any errors or omissions in this Accepted Manuscript or any consequences arising from the use of any information it contains. View Article Online View Journal This article can be cited before page numbers have been issued, to do this please use: H. Li, Z. Sun, Y. Tian, G. Cui and S. Yan, RSC Adv., 2015, DOI: 10.1039/C5RA14748D.
-
Upload
karthiche05 -
Category
Documents
-
view
213 -
download
1
Transcript of 1

www.rsc.org/advances
RSC Advances
This is an Accepted Manuscript, which has been through the Royal Society of Chemistry peer review process and has been accepted for publication.
Accepted Manuscripts are published online shortly after acceptance, before technical editing, formatting and proof reading. Using this free service, authors can make their results available to the community, in citable form, before we publish the edited article. This Accepted Manuscript will be replaced by the edited, formatted and paginated article as soon as this is available.
You can find more information about Accepted Manuscripts in the Information for Authors.
Please note that technical editing may introduce minor changes to the text and/or graphics, which may alter content. The journal’s standard Terms & Conditions and the Ethical guidelines still apply. In no event shall the Royal Society of Chemistry be held responsible for any errors or omissions in this Accepted Manuscript or any consequences arising from the use of any information it contains.
View Article OnlineView Journal
This article can be cited before page numbers have been issued, to do this please use: H. Li, Z. Sun, Y.
Tian, G. Cui and S. Yan, RSC Adv., 2015, DOI: 10.1039/C5RA14748D.

Facile and cost-effective synthesis of CNT@MCo2O4 (M=Ni, Mn, Cu, Zn)
core-shell hybrid nanostructures for organic dye removal
Haizhen Li, Zebin Sun, Yaxi Tian, Guijia Cui, Shiqiang Yan
*
College of Chemistry and Chemical Engineering, Lanzhou University, Lanzhou
730000, P.R. China
* Corresponding author. Tel./fax: +86 931 8912582
E-mail address: [email protected] (S. Yan)
Page 1 of 27 RSC Advances
RS
CA
dvan
ces
Acc
epte
dM
anus
crip
t
Publ
ishe
d on
14
Sept
embe
r 20
15. D
ownl
oade
d by
Ind
ian
Inst
itute
of
Scie
nce
on 1
5/09
/201
5 05
:47:
14.
View Article OnlineDOI: 10.1039/C5RA14748D

Abstract
This study presents four hybrid materials of CNTs@MCo2O4 (M=Ni, Mn, Cu, Zn)
which were prepared via a simple chemical bath deposition method at room
temperature followed by a post-annealing treatment. The resulting materials were
characterized by different techniques including SEM, EDS, XRD, FTIR, and BET
surface area measurement and were first used as adsorbents for removal of methyl
orange (MO). Experimental dates suggested that CNTs@MCo2O4 samples especially
CNTs@NiCo2O4 showed excellent adsorption properties (1188.3mg/g). The kinetic
adsorption of different materials could be accurately described by the
pseudo-second-order model and overall rate process was apparently influenced by
external mass transfer and intraparticle diffusion. Furthermore, Langmuir and
Freundlich isotherms are employed and both of them fitted the experimental data with
good correlation coefficients. Moreover, the thermodynamic parameters indicated that
the adsorption process was spontaneous and physical adsorption mechanisms
including electrostatic interaction might play a dominant role in the adsorption
mechanism between MO and adsorbents. Results of this work are of great
significance for environmental applications of CNTs@MCo2O4 as promising
adsorbents for organic pollutant from wastewater.
Keywords: CNTs, Spinel cobaltate, removal, methyl orange
1. Introduction
With the development of technology and industry, aqueous dye pollution,
commonly caused by the wastewater discharged from textile, leather and paper
Page 2 of 27RSC Advances
RS
CA
dvan
ces
Acc
epte
dM
anus
crip
t
Publ
ishe
d on
14
Sept
embe
r 20
15. D
ownl
oade
d by
Ind
ian
Inst
itute
of
Scie
nce
on 1
5/09
/201
5 05
:47:
14.
View Article OnlineDOI: 10.1039/C5RA14748D

industries, has emerged as one of most serious pollution in water especially in
developing countries.1 Unfortunately, the color wastewater is rather difficult to treat
because of the non-degradable synthetic origins and aromatic structures of the
pollutants.2 Meanwhile, the hazardous pollutants pose ecological risks and are toxic to
aquatic life and mankind if discharged directly into receiving waters, because they
may be mutagenic and carcinogenic and can cause a severe health hazard to human
beings, such as dysfunction of kidney, reproductive system, liver, brain and central
nervous system.3, 4
Thus, it is imperative to treat the dyes in their wastes to an
acceptable level before discharging them into the environment.
There are many physical, chemical and biological treatment techniques for
removing dyes from industrial effluent, such as chemical oxidation, photochemical
degradation, biological degradation, ultrasonic degradation, reverse osmosis, flotation
and adsorption procedures.5-10
Among those methods, adsorption is recognized to be
the most popular method because of its low cost, easy operation and high removal
efficiency.11-17
Among various available adsorbents, transition metal oxides have potential
applications in water treatment owing to their excellent characteristics such as
environmentally friendly synthesis methods and low price.18
In the large family of
metal oxides, spinel cobaltites, MCo2O4 (M=Ni, Mn, Cu, Zn) are very promising
multifunctional materials and have been widely used in several applications such as
catalysis, environmental remediation and electrochemical supercapacitors as well as
adsorption.19-21
However, the low specific area of spinel cobaltites micrometer powder
Page 3 of 27 RSC Advances
RS
CA
dvan
ces
Acc
epte
dM
anus
crip
t
Publ
ishe
d on
14
Sept
embe
r 20
15. D
ownl
oade
d by
Ind
ian
Inst
itute
of
Scie
nce
on 1
5/09
/201
5 05
:47:
14.
View Article OnlineDOI: 10.1039/C5RA14748D

could greatly reduce the contact area of the materials and dye molecules, which could
significantly decrease the adsorption capacity of spinel cobaltites. In addition, the
pure spinel cobaltites are easy to agglomerate. In order to alleviate the
above-mentioned problems, multi-walled CNTs are introduced due to their high
specific surface area, very high strength, chemical stability and low density.22-24
The
multi-walled CNTs could not only buffer the agglomeration of the active metal oxide
nanostructures, but also enhance the specific area of spinel cobaltites. And the active
sites of spinel cobaltites can be also further increased, which greatly increased the
adsorption capacity for dyes. Thus far, many studies focussing on CNT-supported
MCo2O4 have been reported,25-28
however, to the best of our knowledge, few of them
are selected to be adsorbents for removing dyes.
In this work, we grew MCo2O4 (M=Ni, Mn, Cu, Zn) on individual CNTs via a
simple and cost-effective chemical bath deposition method at room temperature
followed by a post-annealing treatment. The chemical co-precipitation method has
several advantages such as simplicity, low processing temperature and pressure, low
cost, high product purity and the ability to control the morphology compared with
most conventional methods. This prepared CNTs@MCo2O4 hybrids possess high
specific surface area and display a remarkable adsorption performance for removal
organic dyes. And their adsorption capability for organic pollutants were investigated
using methyl orange (MO) as a model. The CNTs@MCo2O4 were characterized by
field-emission scanning electron microscopy (FESEM), X-ray energy dispersive
spectrometry (EDS), X-ray diffraction (XRD), Fourier-transform infrared
Page 4 of 27RSC Advances
RS
CA
dvan
ces
Acc
epte
dM
anus
crip
t
Publ
ishe
d on
14
Sept
embe
r 20
15. D
ownl
oade
d by
Ind
ian
Inst
itute
of
Scie
nce
on 1
5/09
/201
5 05
:47:
14.
View Article OnlineDOI: 10.1039/C5RA14748D

spectroscopy (FTIR) analysis, Brunauer, Emmett, and Teller surface area
measurement (BET) analyses. The adsorption capacities of different materials, effects
of pH, contact time at different initial concentrations were examined in bath
experiments. Moreover, the adsorption kinetics, rate-controlling mechanisms, and
thermodynamics of the adsorbents were also comprehensively investigated.
2. Experimental section
2.1. Materials
MWCNTs having diameter 20–30 nm and length of 5–20 µm, were purchased
from Alpha Nano Technology Co., Ltd. (China). Polyvinylpyrrolidone (PVP),
absolute ethanol and NH3·H2O (25-28 wt%) were purchased from the Sinopharm
Group Chemical Reagent Co., Ltd. CoCl2·6H2O, NiCl2·6H2O, MnCl2·4H2O,
CuCl2·2H2O and ZnCl2 were obtained from Kelong chemical company (Chengdu,
China). All chemicals are of analytical grade and used without further purification.
2.2. Preparation of CNT@MCo2O4
CNT@MCo2O4 nanomaterials were fabricated by a simple chemical bath
deposition method at room temperature followed by a post-annealing treatment. And
the detailed preparation procedure is illustrated in Scheme 1. Taking the preparation
of CNT@NiCo2O4 as an example, briefly, 35 mg MWCNT powder was uniformly
dispersed into 100ml 7 mg ml-1
PVP aqueous solution with ultrasonication for 1.5 h.
Then 0.9517g (4 mmol) of CoCl2·6H2O and 0.4754g (2 mmol) of NiCl2·6H2O were
dissolved into the MWCNT dispersion with vigorous stirring for 0.5 h to form a black
solution, followed by a drop-by-drop addition of 5% NH3·H2O solution until its pH
Page 5 of 27 RSC Advances
RS
CA
dvan
ces
Acc
epte
dM
anus
crip
t
Publ
ishe
d on
14
Sept
embe
r 20
15. D
ownl
oade
d by
Ind
ian
Inst
itute
of
Scie
nce
on 1
5/09
/201
5 05
:47:
14.
View Article OnlineDOI: 10.1039/C5RA14748D

reached 9. The mixture was kept still for 4 h at room temperature. The obtained
precipitate was filtered, washed with water and ethanol several times to remove the
surfactant and the residual ions, and dried at 60 ℃for 12 h under vacuum. In order to
obtain the CNT@NiCo2O4 nanostructure, the hybrid precursor was finally annealed in
air at 300 ℃ for 3 h with a slow heating rate of 1 ℃min-1
. With the same procedure
and amounts of CoCl2·6H2O and MWCNT, MnCl2·4H2O (0.396 g, 2mmol),
CuCl2·2H2O (0.341 g, 2mmol) and ZnCl2 (0.273 g, 2 mmol) were used instead of
NiCl2·6H2O for the syntheses of other CNT@MCo2O4 (M = Mn, Cu and Zn) hybrids,
respectively.
2.3 Material characterizations
The as-prepared CNT@MCo2O4 nanomaterials were characterized with
field-emission scanning electron microscopy (FESEM, JSM-6701F) and X-ray energy
dispersive spectrometry (EDS, Apollo40SDD). The crystallinity of the samples was
investigated by X-ray diffraction (XRD, XRD-6000, shimadzu, Japan). Fourier
transform infrared spectra (FTIR) were carried out using a NEXUS 670 FTIR
equipped with a pressed KBr pellets in wavenumber range of 400-4000 cm-1
. The
BET surface area, pore volume, and pore size were characterized using nitrogen
adsorption at liquid nitrogen temperatures (Sorptomatic 1990, Thermo, USA).
2.4. Adsorption experiments
Standard solutions of methyl orange (MO) in six different concentrations
(100-600 mg L-1
) were prepared by dissolving analytical grade methyl orange in
distilled water.
Page 6 of 27RSC Advances
RS
CA
dvan
ces
Acc
epte
dM
anus
crip
t
Publ
ishe
d on
14
Sept
embe
r 20
15. D
ownl
oade
d by
Ind
ian
Inst
itute
of
Scie
nce
on 1
5/09
/201
5 05
:47:
14.
View Article OnlineDOI: 10.1039/C5RA14748D

To determine the adsorption capacities of different materials, the CNT@MCo2O4
were prepared as adsorbents for MO removal. 5 mg sample of the different adsorbents
was added to each 25 mL of MO solution with initial concentration of 100 mg L-1
to
600 mg L-1
(100 mg L-1
intervals). The mixture was sonicated for 5 minutes at room
temperature and stirred for 120 minutes and then filtered using a 0.45 µm
microporous membrane filter. The filtered MO solutions were diluted and measured
by a spectrophotometric method at 465 nm.
The effect of pH on MO adsorption was studied by varying the solution pH from
3.0 to 11.0, with the initial MO concentration of 100 mg L-1
. The pH of each solution
was adjusted using 1 M HCl or NaOH solution.
Adsorption kinetic experiments were conducted by adding 300 mg of different
CNT@MCo2O4 nanomaterials to each of 1500 ml MO solution, and the MO
concentration was 600 mg L-1
at 298 K. Samples were withdrawn at predetermined
time intervals and filtered through a 0.45 µm filter.
The amount of MO adsorption at equilibrium qe (mg/g) was calculated using the
following equation:
�� =�(����)
� (1)
Where V is the volume of the MO solution (L); C0 and Ce are the initial and
equilibrium concentration (mg L-1
) of MO respectively; and m is the weight of the
adsorbents (g).
Page 7 of 27 RSC Advances
RS
CA
dvan
ces
Acc
epte
dM
anus
crip
t
Publ
ishe
d on
14
Sept
embe
r 20
15. D
ownl
oade
d by
Ind
ian
Inst
itute
of
Scie
nce
on 1
5/09
/201
5 05
:47:
14.
View Article OnlineDOI: 10.1039/C5RA14748D

Scheme 1 Schematic presentation of the preparation procedure of CNT@MCo2O4
3. Results and discussion
3.1 Characterization of the adsorbents
The morphology of the CNT@NiCo2O4, CNT@MnCo2O4, CNT@CuCo2O4,
CNT@ZnCo2O4 and CNT were characterized by field-emission scanning electron
microscopy (FESEM) observation and transmission electron microscope (TEM). Fig.
1(a-d) shows the representative FESEM images of the as-prepared CNT@MCo2O4
hybrids. It can be found that the surface of CNT@MCo2O4 is flake shaped and
finegrained. And the surface of CNT (Fig.1e) is relatively smooth compared with
CNT@MCo2O4. Fig.1 (f) is the TEM of CNT@NiCo2O4. It can be seen that NiCo2O4
is uniformly coated on the CNT. However, the morphology of the CNT is not easy to
distinguish. The possible reason is that CNT has only left a skeleton through
annealing process in air in the process of our material preparation. In all cases,
MCo2O4 nanomaterials were found well-grown around individual CNTs to form a
Page 8 of 27RSC Advances
RS
CA
dvan
ces
Acc
epte
dM
anus
crip
t
Publ
ishe
d on
14
Sept
embe
r 20
15. D
ownl
oade
d by
Ind
ian
Inst
itute
of
Scie
nce
on 1
5/09
/201
5 05
:47:
14.
View Article OnlineDOI: 10.1039/C5RA14748D

conformal coating on the surface, showing that the method of chemical bath
deposition at room temperature followed by a post-annealing treatment could be
generally used in the synthesis of various CNT@MCo2O4 hybrids.
Fig.1. SEM images of (a) CNT@NiCo2O4, (b) CNT@MnCo2O4, (c) CNT@CuCo2O4,
(d) CNT@ZnCo2O4 and (e) CNT. TEM image of (f) CNT@NiCo2O4
Fig.2. EDS patterns of (a) CNT@NiCo2O4, (b) CNT@MnCo2O4, (c) CNT@CuCo2O4
and (d) CNT@ZnCo2O4
To confirm the composition of the hybrids, the EDS attached to the FESEM was
Page 9 of 27 RSC Advances
RS
CA
dvan
ces
Acc
epte
dM
anus
crip
t
Publ
ishe
d on
14
Sept
embe
r 20
15. D
ownl
oade
d by
Ind
ian
Inst
itute
of
Scie
nce
on 1
5/09
/201
5 05
:47:
14.
View Article OnlineDOI: 10.1039/C5RA14748D

measured and the corresponding EDS spectra of the as-prepared CNT@MCo2O4
hybrids was displayed in Fig.2 (a-d). The EDS spectra of the CNT@MCo2O4 hybrids
revealed the presence of M (Ni, Mn, Cu, and Zn), Co, C and O with the atomic ratio
ratio of M/Co close to 1:2. The C mainly comes from the CNTs, while O from both
MCo2O4 and some oxygen-containing functional groups of CNTs. The results of EDS
confirmed that the MCo2O4 were successfully synthesized.
Fig.3. XRD patterns of (a) CNT@NiCo2O4, (b) CNT@MnCo2O4, (c)
CNT@CuCo2O4, (d) CNT@ZnCo2O4 and (e) CNT
The crystallographic phase of CNT@NiCo2O4, CNT@MnCo2O4,
CNT@CuCo2O4, CNT@ZnCo2O4 and CNT were identified by XRD, and the typical
wide-angle diffraction patterns are shown in Fig.3 (a-e). It can be noticed that
CNT@MCo2O4 consisted of seven well-defined diffraction peaks, which can be well
indexed to the (220), (311), (222), (400), (422), (511), and (440) crystal planes of
cubic spinel structural NiCo2O4 (JCPDS card no. 20-0781), MnCo2O4 (JCPDS card
Page 10 of 27RSC Advances
RS
CA
dvan
ces
Acc
epte
dM
anus
crip
t
Publ
ishe
d on
14
Sept
embe
r 20
15. D
ownl
oade
d by
Ind
ian
Inst
itute
of
Scie
nce
on 1
5/09
/201
5 05
:47:
14.
View Article OnlineDOI: 10.1039/C5RA14748D

no.23-1237), CuCo2O4 (JCPDS card no. 78-2177), and ZnCo2O4 (JCPDS card no.
23-1390), respectively.29-32
It is worth mentioning that no other peaks are observed,
which effectively confirms the purity of the obtained MCo2O4 phase, which was
supported on CNTs. For CNT, two characteristic peaks can be clearly observed,
corresponding to the (002) and (100) crystal planes. However, the typical peaks (002)
of CNT are not observed in CNT@MCo2O4. The possible reason is that the typical
peaks of CNT are covered by the peaks of MCo2O4.
Fig.4. FTIR spectra of (a) CNT@NiCo2O4, (b) CNT@MnCo2O4, (c) CNT@CuCo2O4,
(d) CNT@ZnCo2O4 and (e) CNT
The FTIR spectra of CNT@NiCo2O4, CNT@MnCo2O4, CNT@CuCo2O4,
CNT@ZnCo2O4 and CNT are presented in Fig.4 (a-e). It is obvious that all spectra
exhibit adsorption bands at about 3400, and 1625 cm-1
, which can be associated to the
-OH stretching and bending vibration for the free or physically absorbed water
molecules.33, 34
The corresponding metal oxide characteristic peaks positioned at 650
and 555 cm-1
for the samples (a-d) further reveals the formation of the spinel MCo2O4
Page 11 of 27 RSC Advances
RS
CA
dvan
ces
Acc
epte
dM
anus
crip
t
Publ
ishe
d on
14
Sept
embe
r 20
15. D
ownl
oade
d by
Ind
ian
Inst
itute
of
Scie
nce
on 1
5/09
/201
5 05
:47:
14.
View Article OnlineDOI: 10.1039/C5RA14748D

nanostructure. These bands mainly correspond to the stretching vibrational modes of
M-O (M=Ni, Mn, Cu, Zn) in the tetrahedral positions and Co-O bands in octahedral
positions, respectively.34
Fig.5. Typical N2 adsorption–desorption isotherms of CNT@NiCo2O4,
CNT@MnCo2O4, CNT@CuCo2O4, CNT@ZnCo2O4 and CNT
As illustrated in Fig.5, the adsorption and desorption isotherms of N2 for the
CNT@NiCo2O4, CNT@MnCo2O4, CNT@CuCo2O4, CNT@ZnCo2O4 and CNT are
clearly of type IV, according to the IUPAC classification of adsorption isotherms.35
Type IV isotherms characteristically show the simultaneous presence of micro- and
mesopores.36
And the physical properties of the CNT@NiCo2O4, CNT@MnCo2O4,
CNT@CuCo2O4, CNT@ZnCo2O4 and CNT, such as surface areas, total pore volumes,
pore size are summarized in Table 1. It can be seen that the BET surface area, total
pore volume and average pore size of CNT@NiCo2O4 are 144.0 m2 g
-1, 0.8506 cm
3g
-1
and 23.63 nm, respectively, which were higher than that of other CNT@MCo2O4.
Generally, the BET surface area, total pore volume and average pore size have great
Page 12 of 27RSC Advances
RS
CA
dvan
ces
Acc
epte
dM
anus
crip
t
Publ
ishe
d on
14
Sept
embe
r 20
15. D
ownl
oade
d by
Ind
ian
Inst
itute
of
Scie
nce
on 1
5/09
/201
5 05
:47:
14.
View Article OnlineDOI: 10.1039/C5RA14748D

influence on the material performance especially the adsorption capacity. Thus, the
CNT@MCo2O4 may have excellent adsorption performance, and this conclusion will
be confirmed in the part 3.2.1.
Table 1 Pore surface characteristics of different materials
Materials Surface area (m2
g-1
) Pore volume (cm3 g
-1) Pore size (nm)
CNT@NiCo2O4 144.0 0.8506 23.63
CNT@MnCo2O4 103.64 0.5877 22.68
CNT@CuCo2O4 73.45 0.2630 14.32
CNT@ZnCo2O4 120.58 1.0156 32.99
CNT 174.48 0.8532 19.56
3.2 Adsorption experiment studies
3.2.1. Adsorption capacities of different materials
The adsorption capacities of different materials including the CNT@NiCo2O4,
CNT@MnCo2O4, CNT@CuCo2O4, CNT@ZnCo2O4 and CNT were investigated, as
shown in Fig. 6. It is obvious that the adsorption capacities of CNT@MCo2O4 were
all increased with the initial concentration of MO increased in. And all of the samples
possess relatively high adsorption performance. Compared with CNT@MCo2O4, the
adsorption capacity of CNT is markedly lower. For CNT@MCo2O4, CNT is the
skeleton and MCo2O4 is coated on the CNT, and then MCo2O4 would be the mainly
adsorbent. Sulfonate groups of MO dyes would bind with the hydroxy-groups on the
surface of metal oxides through electrostatic interaction and hydrogen bond
interaction. However, the CNT surface possesses few functional groups so that the
Page 13 of 27 RSC Advances
RS
CA
dvan
ces
Acc
epte
dM
anus
crip
t
Publ
ishe
d on
14
Sept
embe
r 20
15. D
ownl
oade
d by
Ind
ian
Inst
itute
of
Scie
nce
on 1
5/09
/201
5 05
:47:
14.
View Article OnlineDOI: 10.1039/C5RA14748D

adsorption capacity of CNT for MO is much lower. In addition, CNT@NiCo2O4
shows the best adsorption capacity among the CNT@MCo2O4 nanomaterials,
indicating that CNT@NiCo2O4 has outstanding adsorption performance compared
with other adsorbents. It is well known that the adsorption properties for dyes depend
on the high specific surface area and the pore properties of the adsorbents.37
The
excellent adsorption capacity of CNT@NiCo2O4 may be ascribed to its large BET
surface area.
Fig.6. Adsorption capacities of different materials with regard to MO adsorption.
3.2.2. Effect of solution pH and Adsorption mechanism
The pH of the system exerts profound influence on the surface charge of the
adsorbent, the degree of ionization of different pollutants, the dissociation of
functional groups on the active sites of the adsorbent as well as the structure of the
dye.38
Thus, the adsorption experiments were performed at initial concentration of
100 mg L-1
and pH range between 3.0 and 11.0 to investigate the effect of the pH on
the adsorption capacities of the CNT@MCo2O4. As shown in Fig. 7, the adsorption
Page 14 of 27RSC Advances
RS
CA
dvan
ces
Acc
epte
dM
anus
crip
t
Publ
ishe
d on
14
Sept
embe
r 20
15. D
ownl
oade
d by
Ind
ian
Inst
itute
of
Scie
nce
on 1
5/09
/201
5 05
:47:
14.
View Article OnlineDOI: 10.1039/C5RA14748D

capacity of CNT@NiCo2O4, CNT@MnCo2O4, CNT@CuCo2O4 and CNT@ZnCo2O4
were all decreased with the increase in pH from 3.0 to 11.0. At acidic pH, the surfaces
of CNT@MCo2O4 materials were positively charged due to protonation, which could
be expressed as MOH2+ (M represents Ni, Mn, Cu, Zn, Co), therefore, resulting in a
higher adsorption performance for MO because of the strong electrostatic attraction
between positively charged surfaces and the anionic MO species. This is mainly the
adsorption mechanism for CNT@MCo2O4 removing MO. However, with the pH
increased, the adsorption performance of CNT@MCo2O4 decreased. The possible
reason is that a growing number of OH- caused repulsion between the negatively
charged surface and the dye molecules.
Fig.7. Effect of solution pH on MO adsorbed onto CNT@MCo2O4
3.2.3. Effect of contact time
The adsorption equilibrium time is one of the most important parameters which
influenced the design of wastewater treatment systems.39
To determine the effect of
Page 15 of 27 RSC Advances
RS
CA
dvan
ces
Acc
epte
dM
anus
crip
t
Publ
ishe
d on
14
Sept
embe
r 20
15. D
ownl
oade
d by
Ind
ian
Inst
itute
of
Scie
nce
on 1
5/09
/201
5 05
:47:
14.
View Article OnlineDOI: 10.1039/C5RA14748D

contact time on the adsorption process, adsorption experiments of various materials
with initial MO concentration of 600 mg L-1
were conducted for different contact
times. The results are presented in Fig. 8. It can be easily observed that the adsorption
capacity of MO onto the adsorbents drastically increase during the initial stage and
then at a slow speed, which may be ascribed to the availability of a large number of
vacant active sites on the adsorbent surface during the initial stage, and then, the
remaining vacant surface sites were difficult to occupy because of the repulsive forces
between the dye molecules on the CNT@MCo2O4 and the bulk phase. Eventually, a
plateau is reached after a certain amount of time in all curves.40
Fig.8. Effect of contact time on MO adsorbed onto different materials at 600mg/L
3.2.4. Adsorption dynamics
In order to better evaluate the adsorption kinetics, two kinetic models including
pseudo-first-order and pseudo-second-order model were applied to analyze the
experimental data. These two kinetic models can be represented by the following
Page 16 of 27RSC Advances
RS
CA
dvan
ces
Acc
epte
dM
anus
crip
t
Publ
ishe
d on
14
Sept
embe
r 20
15. D
ownl
oade
d by
Ind
ian
Inst
itute
of
Scie
nce
on 1
5/09
/201
5 05
:47:
14.
View Article OnlineDOI: 10.1039/C5RA14748D

equations: 9, 41
log(�� − ��) = log�� −��
�.���, (2)
�
��=
�
���� +
�
� (3)
Where qe and qt (mg g-1
) are the amounts of MO adsorbed at equilibrium and at time t
(min), respectively, while k1 (min-1
) and k2 (g mg-1
min-1
) represent the observed rate
constants for pseudo first order and pseudo second order models.
Table 2 Kinetic parameters for MO adsorption onto different adsorbents at 600 mg/L
Adsorbents
qe,exp
Pseudo-first-order model Pseudo-second-order model
k1 qe r2 k2×10
-4 qe r
2
CNT@NiCo2O4 1211 0.01621 374.7 0.9027 2.809 1206.9 0.9939
CNT@MnCo2O4 678.4 0.03871 291.6 0.9627 2.754 709.2 0.9996
CNT@CuCo2O4 804 0.01911 381.4 0.9796 2.20 819.7 0.9907
CNT@ZnCo2O4 906.9 0.02796 360.4 0.9152 2.018 925.9 0.9918
The values of qe and k1 for the pseudo-first-order kinetic model are determined
from the intercepts and the slopes of the plots of log (qe−qt) versus t, and plots of t/qt
versus t allows calculation of the rate constant k2 and qe for the pseudo-second-order
kinetic model. The straight line plots of them are presented in Fig.S1 and Fig.S2,
respectively. The calculated kinetic parameters and correlation coefficients for the
removal of MO with CNT@MCo2O4 are tabulated in Table 2. It is obvious that all the
experimental data showed better compliance with the pseudo-second-order kinetic
model in terms of higher correlation coefficient values (r2> 0.99). Furthermore, the qe
calculated from the pseudo-second-order kinetic model are rather approximate with
Page 17 of 27 RSC Advances
RS
CA
dvan
ces
Acc
epte
dM
anus
crip
t
Publ
ishe
d on
14
Sept
embe
r 20
15. D
ownl
oade
d by
Ind
ian
Inst
itute
of
Scie
nce
on 1
5/09
/201
5 05
:47:
14.
View Article OnlineDOI: 10.1039/C5RA14748D

those from the experimental results. These results suggest that the
pseudo-second-order kinetic model is more suitable to describe the adsorption
process.
3.2.5. Weber–Morris kinetic model
As the above two kinetic models were not able to highlight the diffusion
mechanisms and rate controlling steps that affect the adsorption process, we applied
the Weber–Morris kinetic model to study the steps of adsorption process. This
equation can be written as follow: 41
�� = ���� �⁄ + (4)
Where qt is the adsorption capacity at time t, kd is the intra-particle diffusion rate
constant, C is a constant that gives idea about the thickness of the boundary layer, the
larger the value of C, the greater the boundary layer effect is. The values of kd and C
can be obtained by plotting qt against t1/2
.
The multilinear plots of intra-particle diffusion process of MO adsorption onto
CNT@MCo2O4 are presented in Fig.9. It suggests that two steps have taken place
during the adsorption process. The first linear portion is related to external diffusion
which is the diffusion of MO molecules from solution to the external surface of
CNT@MCo2O4. And the second regions can be attributed to the internal diffusion of
MO from the external surface to the internal pores of the adsorbent. According to the
Weber–Morris kinetic model, if the regression of qt versus t1/2
is linear and passes
through the origin, then intra-particle diffusion is the sole rate-limiting step. The
regression is linear, but the plot does not pass through the origin, suggesting that
Page 18 of 27RSC Advances
RS
CA
dvan
ces
Acc
epte
dM
anus
crip
t
Publ
ishe
d on
14
Sept
embe
r 20
15. D
ownl
oade
d by
Ind
ian
Inst
itute
of
Scie
nce
on 1
5/09
/201
5 05
:47:
14.
View Article OnlineDOI: 10.1039/C5RA14748D
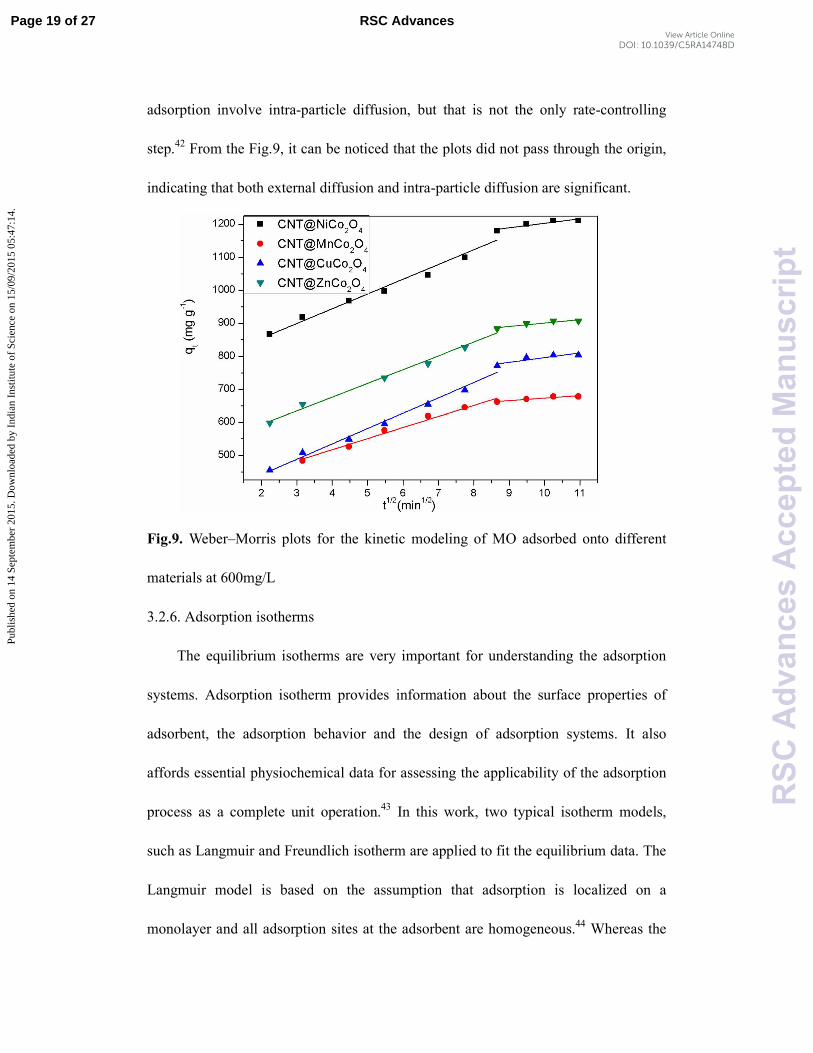
adsorption involve intra-particle diffusion, but that is not the only rate-controlling
step.42
From the Fig.9, it can be noticed that the plots did not pass through the origin,
indicating that both external diffusion and intra-particle diffusion are significant.
Fig.9. Weber–Morris plots for the kinetic modeling of MO adsorbed onto different
materials at 600mg/L
3.2.6. Adsorption isotherms
The equilibrium isotherms are very important for understanding the adsorption
systems. Adsorption isotherm provides information about the surface properties of
adsorbent, the adsorption behavior and the design of adsorption systems. It also
affords essential physiochemical data for assessing the applicability of the adsorption
process as a complete unit operation.43
In this work, two typical isotherm models,
such as Langmuir and Freundlich isotherm are applied to fit the equilibrium data. The
Langmuir model is based on the assumption that adsorption is localized on a
monolayer and all adsorption sites at the adsorbent are homogeneous.44
Whereas the
Page 19 of 27 RSC Advances
RS
CA
dvan
ces
Acc
epte
dM
anus
crip
t
Publ
ishe
d on
14
Sept
embe
r 20
15. D
ownl
oade
d by
Ind
ian
Inst
itute
of
Scie
nce
on 1
5/09
/201
5 05
:47:
14.
View Article OnlineDOI: 10.1039/C5RA14748D

Freundlich isotherm presumes that the multilayer of the adsorption process occurs on
a heterogeneous surface. These two models can be described by the following
equations: 10
�
�=
�
!�"+
�
�" (5)
ln�� = ln%& +�
'ln � (6)
Where qe (mg g-1
) is the amount of solution adsorbed per unit mass of the adsorbent,
Ce is the solute equilibrium concentration. And qm (mg g-1
) is the maximum adsorbate
amount, and b (L mg-1
) is the Langmuir constant related to adsorption affinity of the
binding sites. KF and n represent the Freundlich constants related to the adsorption
capacity and adsorption intensity, respectively.
The separation factor (RL) related to Langmuir isotherm is also used to evaluate
the feasibility of adsorption on adsorbent. It can be defined as follows:
() =�
�*!�� (7)
In this equation, C0 represents the initial MO concentration (mg L-1
) and b (L mg-1
)
refers to the Langmuir constant. And the values of RL suggest that the types of the
isotherm which can be irreversible (RL = 0), favorable (0 < RL < 1), linear (RL = 1) or
unfavorable (RL > 1)
The Langmuir and Freundlich isotherms are shown in Fig.S3 and Fig.S4,
respectively. The parameters such as b, qm, KF, n, RL and R2
values determined from
these two isotherms are displayed in Table 3. According to the determination
parameters, both Langmuir and Freundlich models closely fitted the experimental data
with good correlation coefficients (R2). And the RL values are lying in the 0-1 range,
Page 20 of 27RSC Advances
RS
CA
dvan
ces
Acc
epte
dM
anus
crip
t
Publ
ishe
d on
14
Sept
embe
r 20
15. D
ownl
oade
d by
Ind
ian
Inst
itute
of
Scie
nce
on 1
5/09
/201
5 05
:47:
14.
View Article OnlineDOI: 10.1039/C5RA14748D

demonstrating that the isotherms are favorable for adsorption of MO onto
CNT@MCo2O4. The computed maximum MO adsorption capacities are 1257, 840.3,
869.6 and 980.4 mg g-1
at 293K for CNT@NiCo2O4, CNT@MnCo2O4,
CNT@CuCo2O4 and CNT@ZnCo2O4, respectively. It is clear that the CNT@MCo2O4
have excellent adsorption performance.
Table 3 Parameters of the Langmuir and Freundlich isotherms for MO adsorption
onto different adsorbents
Langmuir isotherm Freundlich isotherm
Adsorbents qm b r2 RL×10 1/n KF r
2
CNT@NiCo2O4 1257 0.0300 0.9900 0.525-2.497 0.2587 261.20 0.9954
CNT@MnCo2O4 840.3 0.0265 0.9939 0.591-2.737 0.2287 200.25 0.9823
CNT@CuCo2O4 869.6 0.0308 0.9955 0.513-2.452 0.2142 229.05 0.9949
CNT@ZnCo2O4 980.4 0.0322 0.9889 0.491-2.367 0.1794 310.7 0.9507
Thermodynamic parameters can improve our understanding regarding the
inherent energetic changes involved during the sorption process. The free energy
change (∆G0) was calculated from the variation of the thermodynamic equilibrium
constant (K0) to estimate the type of adsorption for the CNT@MCo2O4 toward MO,
which was determined by the following equations: 9
%� =+,
+=
-,
-
�
� (8)
∆.� = −(/ln%� (9)
In the equations, K0 is the thermodynamic equilibrium constant; as is the activity of
the adsorbed MO, ae is the activity of the MO in the solution at equilibrium, γs is the
Page 21 of 27 RSC Advances
RS
CA
dvan
ces
Acc
epte
dM
anus
crip
t
Publ
ishe
d on
14
Sept
embe
r 20
15. D
ownl
oade
d by
Ind
ian
Inst
itute
of
Scie
nce
on 1
5/09
/201
5 05
:47:
14.
View Article OnlineDOI: 10.1039/C5RA14748D

activity coefficient of the adsorbed MO, γe is the activity coefficient of MO in solution
at equilibrium; R is the gas constant (8.314 Jmol-1
K-1
); T is the sorption temperature in
Kelvin. As the MO concentration in the solution decreases and approaches zero, the
activity coefficient approaches unity, and reducing equation (8) to the following form:
%� =+,
+=
�
� (10)
Therefore, the values of K0 can be acquired by plotting ln(qe/Ce) versus qe and by
extrapolating qe to zero, as shown in Fig.S5.
Table 4 Thermodynamic parameters for MO adsorption onto different adsorbents
Adsorbents lnK0 r2 ∆G
0(kJ/mol)
CNT@NiCo2O4 5.4891 0.9724 -13.378
CNT@MnCo2O4 5.2259 0.9844 -12.737
CNT@CuCo2O4 5.7166 0.9995 -13.933
CNT@ZnCo2O4 6.5943 0.8801 -16.072
The acquired thermodynamic parameters such as lnK0, ∆G0 and R
2 are shown in
Table 4. The negative ∆G0 values confirm the feasibility of the process and the
spontaneous nature of the adsorption. Generally ∆G0 for physisorption is less than
that for chemisorption. The former is between -20 and 0 kJ/mol and the latter is
between −80 and -400 kJ/mol.45
Thus, the ∆G0 results implied that physisorption
might dominate the adsorption of MO onto CNT@MCo2O4.
3.3 Comparison of adsorbent performance with literature data
Previously some researchers investigated several adsorbents for the removal of
MO from aqueous solutions. Table 5 shows a comparison of the adsorption capacities
Page 22 of 27RSC Advances
RS
CA
dvan
ces
Acc
epte
dM
anus
crip
t
Publ
ishe
d on
14
Sept
embe
r 20
15. D
ownl
oade
d by
Ind
ian
Inst
itute
of
Scie
nce
on 1
5/09
/201
5 05
:47:
14.
View Article OnlineDOI: 10.1039/C5RA14748D

of MO onto various adsorbents. It clearly can be seen that the MO removal capacities
of CNT@MCo2O4 (M = Ni, Mn, Cu, Zn) are higher than that of other adsorbents,38, 39,
46-51indicating that CNT@MCo2O4 nanomaterials have great potential as dye
adsorbents in wastewater treatment.
Table 5 Maximum adsorption capacities of MO onto various adsorbents
adsorbates adsorbents qmax(mg/g) Refs.
Methyl
orange
Carbon nanotubes 52.9 46
CNTs-A 149 38
NH2-MWCNTs 185.5 47
Activated carbon/Fe3O4 nanocomposites 303.0 48
Mesoporous MgO nanoplates 370 49
SiO2–Al2O3 mixed oxides 381 50
Powdered activated carbon modified by HNO3 384.6 48
H-δ-MnO2 nanoparticles 427 51
Phragmites australis activated carbon 437.9 39
CNT@NiCo2O4 1188.3 This work
CNT@MnCo2O4 790.5 This work
CNT@CuCo2O4 826.9 This work
CNT@ZnCo2O4 935.4 This work
4. Conclusions
In summary, CNT@MCo2O4 (M=Ni, Mn, Cu, Zn) nanomaterials were prepared
via a simple chemical bath deposition method at room temperature followed by a
Page 23 of 27 RSC Advances
RS
CA
dvan
ces
Acc
epte
dM
anus
crip
t
Publ
ishe
d on
14
Sept
embe
r 20
15. D
ownl
oade
d by
Ind
ian
Inst
itute
of
Scie
nce
on 1
5/09
/201
5 05
:47:
14.
View Article OnlineDOI: 10.1039/C5RA14748D

post-annealing treatment. Their adsorption properties for the removal of MO from
aqueous solution have been studied for the first time and the adsorption process were
systematically researched under different conditions including pH, contact time,
initial MO concentrations. The CNT@MCo2O4 samples especially CNTs@NiCo2O4
showed excellent adsorption properties. And the maximum adsorption capacity for
CNT@MCo2O4 (M=Ni, Mn, Cu, Zn) are 1188.3, 790.5, 826.9 and 935.4 mg/g,
respectively. The high adsorption capacity of CNT@MCo2O4 may be ascribed to their
high BET surface area. The kinetic data of the adsorption fitted well with the
pseudo-second-order kinetic model and the results of Weber–Morris kinetic model
indicated that overall process appeared to be jointly influenced by intraparticle
diffusion and external mass transfer. Moreover, Langmuir and Freundlich isotherms
are employed to describe the equilibrium adsorption and both of them fitted the
experimental data with good correlation coefficients. The adsorption mechanism was
also discussed, which could be attributed to physical adsorption including electrostatic
interactions and hydrogen bond interaction between MO and the adsorbents. The
results obtained in this work suggest that CNTs@MCo2O4 should be a promising
adsorbent for the removal of MO from wastewater.
References
1. P. Luo, Y. Zhao, B. Zhang, J. Liu, Y. Yang and J. Liu, Water Res., 2010, 44,
1489-1497.
2. G. Crini, Bioresour. Technol., 2006, 97, 1061-1085.
3. Z. Ajji and A. M. Ali, Nucl. Instrum. Methods Phys. Res., Sect. B 2007, 265,
362-365.
4. K. Kadirvelu, M. Kavipriya, C. Karthika, M. Radhika, N. Vennilamani and S.
Pattabhi, Bioresour. Technol., 2003, 87, 129–132.
Page 24 of 27RSC Advances
RS
CA
dvan
ces
Acc
epte
dM
anus
crip
t
Publ
ishe
d on
14
Sept
embe
r 20
15. D
ownl
oade
d by
Ind
ian
Inst
itute
of
Scie
nce
on 1
5/09
/201
5 05
:47:
14.
View Article OnlineDOI: 10.1039/C5RA14748D

5. Y. Haldorai and J.-J. Shim, Appl. Surf. Sci., 2014, 292, 447-453.
6. P. Xu, G. M. Zeng, D. L. Huang, C. L. Feng, S. Hu, M. H. Zhao, C. Lai, Z.
Wei, C. Huang, G. X. Xie and Z. F. Liu, Sci. Total Environ., 2012, 424, 1-10.
7. V. K. Gupta, S. Agarwal and T. A. Saleh, J. Hazard. Mater., 2011, 185, 17-23.
8. L. Zhang, H. Li, Y. Liu, Z. Tian, B. Yang, Z. Sun and S. Yan, RSC Adv., 2014
4, 48703–48711.
9. H. Li, L. Zhang, Z. Sun, Y. Liu, B. Yang and S. Yan, RSC Adv., 2015, 5,
31787-31797.
10. Z. Tian, B. Yang, G. Cui, L. Zhang, Y. Guo and S. Yan, RSC Adv., 2015, 5,
2266-2275.
11. B. Qiu, C. Xu, D. Sun, H. Yi, J. Guo, X. Zhang, H. Qu, M. Guerrero, X. Wang,
N. Noel, Z. Luo, Z. Guo and S. Wei, ACS Sustainable Chem. Eng., 2014, 2,
2070-2080.
12. B. Qiu, C. Xu, D. Sun, Q. Wang, H. Gu, X. Zhang, B. L. Weeks, J. Hopper, T.
C. Ho, Z. Guo and S. Wei, Appl. Surf. Sci., 2015, 334, 7-14.
13. B. Qiu, C. Xu, D. Sun, H. Wei, X. Zhang, J. Guo, Q. Wang, D. Rutman, Z.
Guo and S. Wei, RSC Adv., 2014, 4, 29855.
14. P. S. Guru and S. Dash, Adv Colloid Interface Sci, 2014, 209, 49-67.
15. P. S. Guru and S. Dash, J. Disper. Sci. Technol., 2012, 34, 1099-1112.
16. P. S. Guru and S. Dash, J. Disper. Sci. Technol., 2012, 34, 898-907.
17. P. S. Guru and S. Dash, J. Disper. Sci. Technol., 2011, 33, 1012-1020.
18. M. Zhi, C. Xiang, J. Li, M. Li and N. Wu, Nanoscale, 2013, 5, 72-88.
19. F. Cai, Y. Kang, H. Chen, M. Chen and Q. Li, J. Mater. Chem. A, 2014, 2,
11509.
20. J. Cheng, H. Yan, Y. Lu, K. Qiu, X. Hou, J. Xu and Y. Luo, J. Mater. Chem. A,
2015, 3, 9769-9776.
21. S. K. Bikkarolla and P. Papakonstantinou, J. Power Sources, 2015, 281,
243-251.
22. J. M. Schnorr and T. M. Swager, Chem. Mater., 2011, 23, 646-657.
23. I. Dumitrescu, P. R. Unwin and J. V. Macpherson, Chem. Commun., 2009,
DOI: 10.1039/b909734a, 6886-6901.
24. X. Chen, H. Zhu, Y.-C. Chen, Y. Shang, L. Hu and G. W. Rubloff, ACS Nano,
2012, 6, 7948–7955.
25. X. Wang, X. Han, M. Lim, N. Singh, C. L. Gan, M. Jan and P. S. Lee, J. Phys.
Chem. C, 2012, 116, 12448-12454.
26. F. Deng, L. Yu, G. Cheng, T. Lin, M. Sun, F. Ye and Y. Li, J. Power Sources,
2014, 251, 202-207.
27. G. Zhang and X. W. David Lou, Sci. Rep., 2013, 3, 1470.
28. W.-w. Liu, C. Lu, K. Liang and B. K. Tay, J. Mater. Chem. A, 2014, 2,
5100-5107.
29. H. S. Jadhav, R. S. Kalubarme, C.-N. Park, J. Kim and C.-J. Park, Nanoscale,
2014, 6, 10071–10076.
30. A. K. Mondal, D. Su, S. Chen, A. Ung, H. S. Kim and G. Wang, Chem. Eur. J,
2015, 21, 1526-1532.
Page 25 of 27 RSC Advances
RS
CA
dvan
ces
Acc
epte
dM
anus
crip
t
Publ
ishe
d on
14
Sept
embe
r 20
15. D
ownl
oade
d by
Ind
ian
Inst
itute
of
Scie
nce
on 1
5/09
/201
5 05
:47:
14.
View Article OnlineDOI: 10.1039/C5RA14748D

31. S. Sun, Z. Wen, J. Jin, Y. Cui and Y. Lu, Microporous Mesoporous Mater.,
2013, 169, 242-247.
32. L. Guo, Q. Ru, X. Song, S. Hu and Y. Mo, J. Mater. Chem. A, 2015, 3,
8683–8692.
33. V. Subramanian, Solid State Ionics, 2004, 175, 511-515.
34. Zhaoping Liu, Renzhi Ma, Minoru Osada, Kazunori Takada and T. Sasaki, J.
Am. Chem. Soc., 2005, 127, 13869–13874.
35. K.S.W. Sing, D.H. Everett, R.A.W. Haul, L. Moscou, R.A. Pierotti, J.
Rouquerol and T. Siemieniewska, Pure Appl. Chem., 1985, 57, 603–619.
36. G. Jiang, Z. Lin, C. Chen, L. Zhu, Q. Chang, N. Wang, W. Wei and H. Tang,
Carbon, 2011, 49, 2693-2701.
37. Y. Dong, H. Lin, Q. Jin, L. Li, D. Wang, D. Zhou and F. Qu, J. Mater. Chem.
A, 2013, 1, 7391.
38. J. Ma, F. Yu, L. Zhou, L. Jin, M. Yang, J. Luan, Y. Tang, H. Fan, Z. Yuan and
J. Chen, ACS Appl. Mater.interfaces, 2012, 4, 5749-5760.
39. S. Chen, J. Zhang, C. Zhang, Q. Yue, Y. Li and C. Li, Desalination, 2010, 252,
149-156.
40. I. D. Mall, V. C. Srivastava and N. K. Agarwal, Dyes Pigm., 2006, 69,
210-223.
41. C. Luo, Z. Tian, B. Yang, L. Zhang and S. Yan, Chem. Eng. J., 2013, 234,
256-265.
42. S. Vasiliu, I. Bunia, S. Racovita and V. Neagu, Carbohyd. Polym., 2011, 85,
376-387.
43. H. Aydın and G. Baysal, Desalination, 2006, 196, 248-259.
44. L. Chen and B. Bai, Ind. Eng. Chem. Res., 2013, 52, 15568-15577.
45. Y. Yu, Y.-Y. Zhuang, Z.-H. Wang and M.-Q. Qiu, Chemosphere, 2004, 54,
425-430.
46. Y. Yao, H. Bing, X. Feifei and C. Xiaofeng, Chem. Eng. J., 2011, 170, 82-89.
47. Y. Liu, G. Cui, C. Luo, L. Zhang, Y. Guo and S. Yan, RSC Adv., 2014, 4,
55162-55172.
48. M. H. Do, N. H. Phan, T. D. Nguyen, T. T. Pham, V. K. Nguyen, T. T. Vu and
T. K. Nguyen, Chemosphere, 2011, 85, 1269-1276.
49. X. Li, W. Xiao, G. He, W. Zheng, N. Yu and M. Tan, Colloids Surf. A, 2012,
408, 79-86.
50. M. Arshadi, F. Salimi Vahid, J. W. L. Salvacion and M. Soleymanzadeh, Appl.
Surf. Sci., 2013, 280, 726-736.
51. Y. Liu, C. Luo, J. Sun, H. Li, Z. Sun and S. Yan, J. Mater. Chem. A, 2015, 3,
5674-5682.
Page 26 of 27RSC Advances
RS
CA
dvan
ces
Acc
epte
dM
anus
crip
t
Publ
ishe
d on
14
Sept
embe
r 20
15. D
ownl
oade
d by
Ind
ian
Inst
itute
of
Scie
nce
on 1
5/09
/201
5 05
:47:
14.
View Article OnlineDOI: 10.1039/C5RA14748D

Page 27 of 27 RSC Advances
RS
CA
dvan
ces
Acc
epte
dM
anus
crip
t
Publ
ishe
d on
14
Sept
embe
r 20
15. D
ownl
oade
d by
Ind
ian
Inst
itute
of
Scie
nce
on 1
5/09
/201
5 05
:47:
14.
View Article OnlineDOI: 10.1039/C5RA14748D


![[XLS] · Web view1 1 1 2 3 1 1 2 2 1 1 1 1 1 1 2 1 1 1 1 1 1 2 1 1 1 1 2 2 3 5 1 1 1 1 34 1 1 1 1 1 1 1 1 1 1 240 2 1 1 1 1 1 2 1 3 1 1 2 1 2 5 1 1 1 1 8 1 1 2 1 1 1 1 2 2 1 1 1 1](https://static.fdocuments.us/doc/165x107/5ad1d2817f8b9a05208bfb6d/xls-view1-1-1-2-3-1-1-2-2-1-1-1-1-1-1-2-1-1-1-1-1-1-2-1-1-1-1-2-2-3-5-1-1-1-1.jpg)

![1 1 1 1 1 1 1 ¢ 1 1 1 - pdfs.semanticscholar.org€¦ · 1 1 1 [ v . ] v 1 1 ¢ 1 1 1 1 ý y þ ï 1 1 1 ð 1 1 1 1 1 x ...](https://static.fdocuments.us/doc/165x107/5f7bc722cb31ab243d422a20/1-1-1-1-1-1-1-1-1-1-pdfs-1-1-1-v-v-1-1-1-1-1-1-y-1-1-1-.jpg)


![$1RYHO2SWLRQ &KDSWHU $ORN6KDUPD +HPDQJL6DQH … · 1 1 1 1 1 1 1 ¢1 1 1 1 1 ¢ 1 1 1 1 1 1 1w1¼1wv]1 1 1 1 1 1 1 1 1 1 1 1 1 ï1 ð1 1 1 1 1 3](https://static.fdocuments.us/doc/165x107/5f3ff1245bf7aa711f5af641/1ryho2swlrq-kdswhu-orn6kdupd-hpdqjl6dqh-1-1-1-1-1-1-1-1-1-1-1-1-1-1.jpg)