155S9.1-2 3 Inferences About Two...
9
155S9.12_3 Inferences About Two Proportions 1 April 08, 2011 Copyright © 2010, 2007, 2004 Pearson Education, Inc. Chapter 9 Inferences from Two Samples 91 Review and Preview 92 Inferences About Two Proportions 93 Inferences About Two Means: Independent Samples 94 Inferences from Dependent Samples 95 Comparing Variation in Two Samples MAT 155 Statistical Analysis Dr. Claude Moore Cape Fear Community College Copyright © 2010, 2007, 2004 Pearson Education, Inc. In Chapters 7 and 8 we introduced methods of inferential statistics. In Chapter 7 we presented methods of constructing confidence interval estimates of population parameters. In Chapter 8 we presented methods of testing claims made about population parameters. Chapters 7 and 8 both involved methods for dealing with a sample from a single population. Review The objective of this chapter is to extend the methods for estimating values of population parameters and the methods for testing hypotheses to situations involving two sets of sample data instead of just one. The following are examples typical of those found in this chapter, which presents methods for using sample data from two populations so that inferences can be made about those populations. Preview • Test the claim that when college students are weighed at the beginning and end of their freshman year, the differences show a mean weight gain of 15 pounds (as in the “Freshman 15” belief). • Test the claim that the proportion of children who contract polio is less for children given the Salk vaccine than for children given a placebo. • Test the claim that subjects treated with Lipitor have a mean cholesterol level that is lower than the mean cholesterol level for subjects given a placebo. Preview Copyright © 2010, 2007, 2004 Pearson Education, Inc. Key Concept In this section we present methods for (1) testing a claim made about the two population proportions and (2) constructing a confidence interval estimate of the difference between the two population proportions. This section is based on proportions, but we can use the same methods for dealing with probabilities or the decimal equivalents of percentages.
Transcript of 155S9.1-2 3 Inferences About Two...

155S9.12_3 Inferences About Two Proportions
1
April 08, 2011
Copyright © 2010, 2007, 2004 Pearson Education, Inc.
Chapter 9 Inferences from Two Samples
91 Review and Preview92 Inferences About Two Proportions93 Inferences About Two Means: Independent Samples94 Inferences from Dependent Samples95 Comparing Variation in Two Samples
MAT 155 Statistical AnalysisDr. Claude Moore
Cape Fear Community College
Copyright © 2010, 2007, 2004 Pearson Education, Inc.
In Chapters 7 and 8 we introduced methods of inferential statistics. In Chapter 7 we presented methods of constructing confidence interval estimates of population parameters. In Chapter 8 we presented methods of testing claims made about population parameters. Chapters 7 and 8 both involved methods for dealing with a sample from a single population.
Review
The objective of this chapter is to extend the methods for estimating values of population parameters and the methods for testing hypotheses to situations involving two sets of sample data instead of just one.The following are examples typical of those found in this chapter, which presents methods for using sample data from two populations so that inferences can be made about those populations.
Preview
• Test the claim that when college students are weighed at the beginning and end of their freshman year, the differences show a mean weight gain of 15 pounds (as in the “Freshman 15” belief). • Test the claim that the proportion of children who contract polio is less for children given the Salk vaccine than for children given a placebo. • Test the claim that subjects treated with Lipitor have a mean cholesterol level that is lower than the mean cholesterol level for subjects given a placebo.
Preview
Copyright © 2010, 2007, 2004 Pearson Education, Inc.
Key Concept
In this section we present methods for (1) testing a claim made about the two population proportions and (2) constructing a confidence interval estimate of the difference between the two population proportions. This section is based on proportions, but we can use the same methods for dealing with probabilities or the decimal equivalents of percentages.

155S9.12_3 Inferences About Two Proportions
2
April 08, 2011
Copyright © 2010, 2007, 2004 Pearson Education, Inc.
Notation for Two Proportions
Copyright © 2010, 2007, 2004 Pearson Education, Inc.
• The pooled sample proportion is denoted by p and is given by:
Pooled Sample Proportion
• We denote the complement of p by q, so q = 1 – p
Copyright © 2010, 2007, 2004 Pearson Education, Inc.
Requirements
1. We have proportions from two independent simple random samples.
2. For each of the two samples, the number of successes is at least 5 and
the number of failures is at least 5.
Copyright © 2010, 2007, 2004 Pearson Education, Inc.
Test Statistic for Two Proportions

155S9.12_3 Inferences About Two Proportions
3
April 08, 2011
Test Statistic for Two Proportions cont
Copyright © 2010, 2007, 2004 Pearson Education, Inc.
Test Statistic for Two Proportions cont
Pvalue: Use Table A2. (Use the computed value of the test statistic z and find its Pvalue by following the procedure summarized by Figure 85 in the text.)
Critical values: Use Table A2. (Based on the significance level α, find critical values by using the procedures introduced in Section 82 in the text.)
Copyright © 2010, 2007, 2004 Pearson Education, Inc.
Confidence Interval Estimate of p1 – p2
Example:
The table below lists results from a simple random sample of frontseat occupants involved in car crashes. Use a 0.05 significance level to test the claim that the fatality rate of occupants is lower for those in cars equipped with airbags.

155S9.12_3 Inferences About Two Proportions
4
April 08, 2011
Copyright © 2010, 2007, 2004 Pearson Education, Inc.
Example:
Requirements are satisfied: two simple random samples, two samples are independent; Each has at least 5 successes and 5 failures (11,500, 41; 9801, 52).Use the Pvalue method.
Step 1: Express the claim as p1 < p2.
Step 2: If p1 < p2 is false, then p1 ≥ p2.
Step 3: p1 < p2 does not contain equality so it is the alternative hypothesis. The null hypothesis is the statement of equality.
Copyright © 2010, 2007, 2004 Pearson Education, Inc.
Example:
H0: p1 = p2 H1: p1 < p2 (original claim)
Step 4: Significance level is 0.05
Step 5: Use normal distribution as an approximation to the binomial distribution. Estimate the common values of p1 and p2 as follows:
With it follows
Copyright © 2010, 2007, 2004 Pearson Education, Inc.
Example:Step 6: Find the value of the test statistic.
Copyright © 2010, 2007, 2004 Pearson Education, Inc.
Example:
Lefttailed test. Area to left of z = –1.91 is 0.0281 (Table A2), so the Pvalue is 0.0281.

155S9.12_3 Inferences About Two Proportions
5
April 08, 2011
Copyright © 2010, 2007, 2004 Pearson Education, Inc.
Example:
Step 7: Because the Pvalue of 0.0281 is less than the significance level of α = 0.05, we reject the null hypothesis of p1 = p2.
Because we reject the null hypothesis, we conclude that there is sufficient evidence to support the claim that the proportion of accident fatalities for occupants in cars with airbags is less than the proportion of fatalities for occupants in cars without airbags. Based on these results, it appears that airbags are effective in saving lives.
Example: Using the Traditional Method
distribution, we refer to Table A2 and find that an area of α = 0.05 in the left tail corresponds to the critical value of z = –1.645. The test statistic of does fall in the critical region bounded by the critical value of z = –1.645. We again reject the null hypothesis.
With a significance level of α = 0.05 in a left tailed test based on the normal
Copyright © 2010, 2007, 2004 Pearson Education, Inc.
CautionWhen testing a claim about two population proportions, the Pvalue method and the traditional method are equivalent, but they are not equivalent to the confidence interval method. If you want to test a claim about two population proportions, use the Pvalue method or traditional method; if you want to estimate the difference between two population proportions, use a confidence interval.
Copyright © 2010, 2007, 2004 Pearson Education, Inc.
Example:
Use the sample data given in the preceding Example to construct a 90% confidence interval estimate of the difference between the two population proportions. (As shown in Table 82 on page 406, the confidence level of 90% is comparable to the significance level of α = 0.05 used in the preceding lefttailed hypothesis test.) What does the result suggest about the effectiveness of airbags in an accident?
155S9.12_3 Inferences About Two Proportions
6
April 08, 2011
Copyright © 2010, 2007, 2004 Pearson Education, Inc.
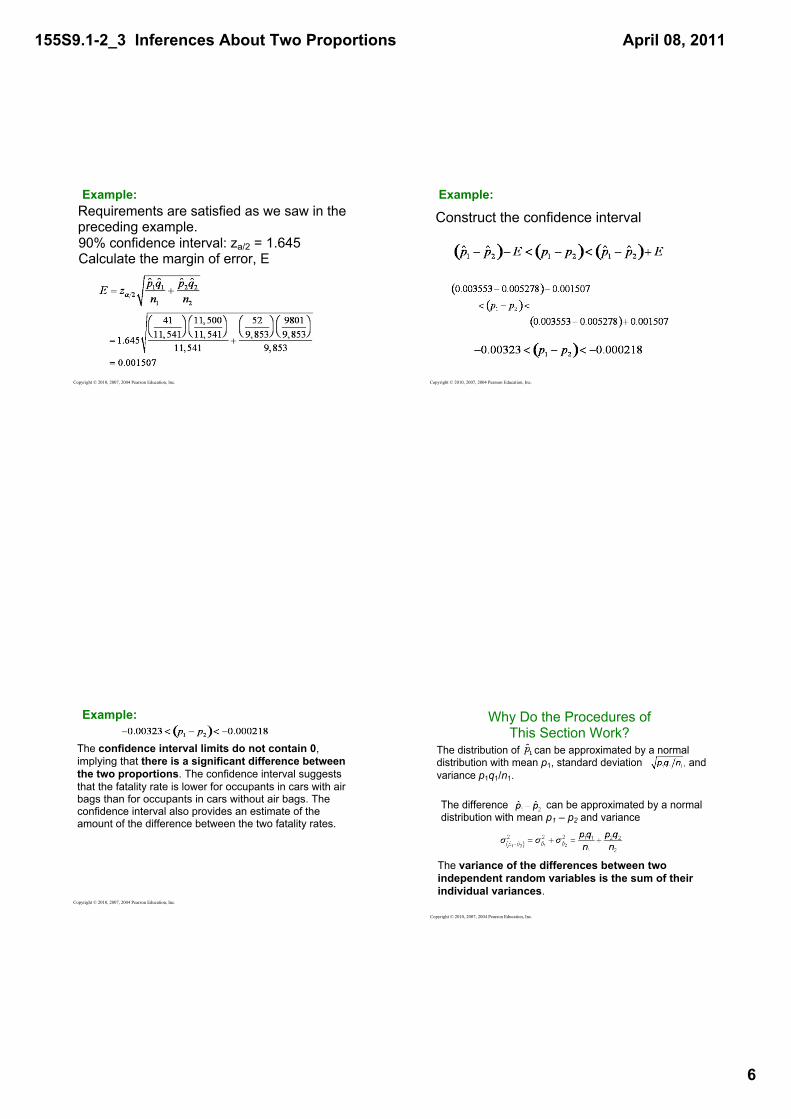
Example:Requirements are satisfied as we saw in the preceding example.90% confidence interval: za/2 = 1.645Calculate the margin of error, E
Copyright © 2010, 2007, 2004 Pearson Education, Inc.
Example:
Construct the confidence interval
Copyright © 2010, 2007, 2004 Pearson Education, Inc.
Example:
The confidence interval limits do not contain 0, implying that there is a significant difference between the two proportions. The confidence interval suggests that the fatality rate is lower for occupants in cars with air bags than for occupants in cars without air bags. The confidence interval also provides an estimate of the amount of the difference between the two fatality rates.
Copyright © 2010, 2007, 2004 Pearson Education, Inc.
The distribution of can be approximated by a normal distribution with mean p1, standard deviation and variance p1q1/n1.
The difference can be approximated by a normal distribution with mean p1 – p2 and variance
The variance of the differences between two independent random variables is the sum of their individual variances.
Why Do the Procedures of This Section Work?

155S9.12_3 Inferences About Two Proportions
7
April 08, 2011
Copyright © 2010, 2007, 2004 Pearson Education, Inc.
Why Do the Procedures of This Section Work?
The preceding variance
We now know that the distribution of p1 – p2 is approximately normal, with mean p1 – p2 and standard deviation as shown above, so the z test statistic has the form given earlier.
leads to the standard deviation
Copyright © 2010, 2007, 2004 Pearson Education, Inc.
When constructing the confidence interval estimate of the difference between two proportions, we don’t assume that the two proportions are equal, and we estimate the standard deviation as
Why Do the Procedures of This Section Work?
Copyright © 2010, 2007, 2004 Pearson Education, Inc.
In the test statistic
use the positive and negative values of z (for two tails) and solve for p1 – p2. The results are the limits of the confidence interval given earlier.
Why Do the Procedures of This Section Work?
Copyright © 2010, 2007, 2004 Pearson Education, Inc.
Recap
In this section we have discussed:• Requirements for inferences about two proportions.• Notation.• Pooled sample proportion.• Hypothesis tests.

155S9.12_3 Inferences About Two Proportions
8
April 08, 2011
Finding Number of Successes. In Exercises 5 and 6, find the number of successes x suggested by the given statement. 473/5. Heart Pacemakers From an article in Journal of the American Medical Association: Among 8834 malfunctioning pacemakers, in 15.8% the malfunctions were due to batteries.
Finding Number of Successes. In Exercises 5 and 6, find the number of successes x suggested by the given statement. 473/6. Drug Clinical Trial From Pfizer: Among 129 subjects who took Chantix as an aid to stop smoking, 12.4% experienced nausea.
Assume that you plan to use a significance level of α = 0.05 to test the claim that p1 = p2. Use the given sample sizes and numbers of successes to find (a) the pooled estimate p, (b) the z test statistic, (c) the critical z values, and (d) the Pvalue.473/8. Drug Clinical Trial Chantix is a drug used as an aid to stop smoking. The numbers of subjects experiencing insomnia for each of two treatment groups in a clinical trial of the drug Chantix are given below (based on data from Pfizer):
Chantix Treatment Placebo Number in group 129 805 Number with insomnia 19 13
Calculations for Confidence Intervals. In Exercises 9 and 10, assume that you plan to construct a 95% confidence interval using the data from the indicated exercise. Find (a) the margin of error E, and (b) the 95% confidence interval.473/10. Use data from Exercise 8 as given below:
Chantix Treatment Placebo Number in group 129 805 Number with insomnia 19 13

155S9.12_3 Inferences About Two Proportions
9
April 08, 2011
474/14. Drug Use in College Using the sample data from Exercise 13, construct the confidence interval corresponding to the hypothesis test conducted with a 0.05 significance level. What conclusion does the confidence interval suggest?From 13. In a 1993 survey of 560 college students, 171 said that they used illegal drugs during the previous year. In a recent survey of 720 college students, 263 said that they used illegal drugs during the previous year (based on data from the National Center for Addiction and Substance Abuse at Columbia University). Use a 0.05 significance level to test the claim that the proportion of college students using illegal drugs in 1993 was less than it is now.
474/16. Are Seat Belts Effective? Use the sample data in Exercise 15 with a 0.05 significance level to test the claim that the fatality rate is higher for those not wearing seat belts.From 15: A simple random sample of frontseat occupants involved in car crashes is obtained. Among 2823 occupants not wearing seat belts, 31 were killed. Among 7765 occupants wearing seat belts, 16 were killed (based on data from “ Who Wants Airbags?” by Meyer and Finney, Chance, Vol. 18, No. 2). Construct a 90% confidence interval estimate of the difference between the fatality rates for those not wearing seat belts and those wearing seat belts. What does the result suggest about the effectiveness of seat belts?
475/28. Are the Radiation Effects the Same for Men and Women? Using the sample data from Exercise 27, construct the confidence interval corresponding to the hypothesis test conducted with a 0.01 significance level. What conclusion does the confidence interval suggest?
475/32. Tax Returns and Campaign Funds Using the sample data from Exercise 31, construct the confidence interval corresponding to the hypothesis test conducted with a 0.01 significance level. What conclusion does the confidence interval suggest?From 31: Tax returns include an option of designating $ 3 for presidential election campaigns, and it does not cost the taxpayer anything to make that designation. In a simple random sample of 250 tax returns from 1976, 27.6% of the returns designated the $ 3 for the campaign. In a simple random sample of 300 recent tax returns, 7.3% of the returns designated the $ 3 for the campaign (based on data from USA Today). Use a 0.01 significance level to test the claim that the percentage of returns designating the $ 3 for the campaign was greater in 1976 than it is now.