1542 IEEE TRANSACTIONS ON ULTRASONICS, FERROELECTRICS…
16
1542 IEEE TRANSACTIONS ON ULTRASONICS, FERROELECTRICS, AND FREQUENCY CONTROL, VOL. 64, NO. 10, OCTOBER 2017 A Prototype Therapy System for Transcutaneous Application of Boiling Histotripsy Adam D. Maxwell, Member, IEEE, Petr V. Yuldashev, Wayne Kreider, Tatiana D. Khokhlova, George R. Schade, Timothy L. Hall, Oleg A. Sapozhnikov, Michael R. Bailey, and Vera A. Khokhlova Abstract—Boiling histotripsy (BH) is a method of focused ultrasound surgery that noninvasively applies millisecond-length pulses with high-amplitude shock fronts to generate liquefied lesions in tissue. Such a technique requires unique outputs compared to a focused ultrasound thermal therapy apparatus, particularly to achieve high in situ pressure levels through intervening tissue. This paper describes the design and character- ization of a system capable of producing the necessary pressure to transcutaneously administer BH therapy through clinically relevant overlying tissue paths using pulses with duration up to 10 ms. A high-voltage electronic pulser was constructed to drive a 1-MHz focused ultrasound transducer to produce shock waves with amplitude capable of generating boiling within the pulse duration in tissue. The system output was characterized by numerical modeling with the 3-D Westervelt equation using boundary conditions established by acoustic holography measure- ments of the source field. Such simulations were found to be in agreement with directly measured focal waveforms. An existing derating method for nonlinear therapeutic fields was used to estimate in situ pressure levels at different tissue depths. The system was tested in ex vivo bovine liver samples to create BH lesions at depths up to 7 cm. Lesions were also created through excised porcine body wall (skin, adipose, and muscle) with 3–5 cm thickness. These results indicate that the system is capable of producing the necessary output for transcutaneous ablation with BH. Index Terms—Biological effects and dosimetry, high-intensity focused ultrasound (HIFU), hyperthermia and surgery, medical transducers, system and device design. Manuscript received August 31, 2016; accepted July 8, 2017. Date of pub- lication August 14, 2017; date of current version October 6, 2017. This work was supported in part by NIH, the National Institute of Biomedical Imaging and Bioengineering under Grant EB007643 and Grant K01 EB015745, in part by NIH, the National Institute of Diabetes and Digestive and Kidney Diseases under Grant P01 DK43881, Grant K01 DK104854, and Grant T32 DK007779, in part by Russian Science Foundation under Grant 14-12-00974, and in part by the National Space Biomedical Research Institute through NASA under Grant NCC 9-58. (Corresponding author: Adam D. Maxwell.) A. D. Maxwell and G. R. Schade are with the Department of Urology, University of Washington School of Medicine, Seattle, WA 98195 USA (e-mail: amax38@u.washington.edu). P. V. Yuldashev is with the Physics Faculty, M. V. Lomonosov Moscow State University, 119992 Moscow, Russia. W. Kreider and M. R. Bailey are with the Center for Industrial and Medical Ultrasound, Applied Physics Laboratory, University of Washington, Seattle, WA 98105 USA. T. D. Khokhlova is with the Department of Gastroenterology, University of Washington School of Medicine, Seattle, WA 98195 USA. T. L. Hall is with the Department of Biomedical Engineering, University of Michigan, Ann Arbor, MI 48109 USA. O. A. Sapozhnikov and V. A. Khokhlova are with the Center for Indus- trial and Medical Ultrasound, Applied Physics Laboratory, University of Washington, Seattle, WA 98105 USA, and also with with the Physics Faculty, M. V. Lomonosov Moscow State University, 119992 Moscow, Russia. Digital Object Identifier 10.1109/TUFFC.2017.2739649 I. I NTRODUCTION H IGH-INTENSITY focused ultrasound (HIFU) is a promising therapeutic modality for treatment of tumors [2]–[5]. Noninvasive HIFU methods employ a trans- ducer that is acoustically coupled to the skin to generate and focus ultrasound to a targeted tissue structure in the body through aberrating and attenuating intervening tissue layers. Most HIFU applications presently rely on a thermal ablative effect. Given sufficient focusing, conversion of the acoustic wave to thermal energy through absorption and the result- ing temperature rise can be spatially localized to ablate the intended tissue through thermal denaturation of proteins. Benefits of such a method are its noninvasive mechanism of action, the ability to treat most tissue types, and requirement of relatively low acoustic pressure amplitudes that can be reliably generated by piezoelectric sources. However, thermal HIFU also has limitations in its precision, speed, and availability of real time imaging. Blood perfusion can result in undertreating a targeted volume, and areas adjacent to the intended treat- ment site can be ablated due to thermal diffusion [6]. Such problems require that the rate and pattern of heat deposition are carefully controlled. Additional treatment planning is also needed to ensure that no prefocal or postfocal structures, such as ribs or skull, are overheated [7], [8]. Large vessels near the target tissue potentially affect the outcome as well, by acting as a thermal sink that cools the immediate surround- ings [9], [10]. Real time monitoring of HIFU treatment is most reliable using magnetic resonance imaging (MRI), but the limited spatial and temporal resolution of MRI necessitate slow heating rates and therefore long treatment times on the order of hours for sizeable tumors. Another prominent effect of HIFU is the generation of bubbles through boiling or cavitation at the focus. Bubble expansion, motion, and interactions with the incident wave field can serve to concentrate stress on the tissue sufficient to cause mechanical disintegration, a process referred to as “histotripsy” [11]–[14]. The histologic characteristics of his- totripsy lesions are a homogenization of tissue structure on a subcellular level [15]–[17] and disorganization of tissue structures [18] without apparent thermal necrosis. Macroscopic effects include liquefaction of parenchymal tissue [19], [20] or erosion of tougher tissue structures [21], [22], often accom- panied by minor bleeding into the lesion volume in an in vivo scenario [23], [24]. The boundaries of the lesions are usually well-defined; the inside of the volume displays complete homogenization, while just a few cell lengths away, tissue 0885-3010 © 2017 IEEE. Personal use is permitted, but republication/redistribution requires IEEE permission. See http://www.ieee.org/publications_standards/publications/rights/index.html for more information.
Transcript of 1542 IEEE TRANSACTIONS ON ULTRASONICS, FERROELECTRICS…
1542 IEEE TRANSACTIONS ON ULTRASONICS, FERROELECTRICS, AND FREQUENCY CONTROL, VOL. 64, NO. 10, OCTOBER 2017
A Prototype Therapy System for TranscutaneousApplication of Boiling Histotripsy
Adam D. Maxwell, Member, IEEE, Petr V. Yuldashev, Wayne Kreider, Tatiana D. Khokhlova, George R. Schade,Timothy L. Hall, Oleg A. Sapozhnikov, Michael R. Bailey, and Vera A. Khokhlova
Abstract— Boiling histotripsy (BH) is a method of focusedultrasound surgery that noninvasively applies millisecond-lengthpulses with high-amplitude shock fronts to generate liquefiedlesions in tissue. Such a technique requires unique outputscompared to a focused ultrasound thermal therapy apparatus,particularly to achieve high in situ pressure levels throughintervening tissue. This paper describes the design and character-ization of a system capable of producing the necessary pressureto transcutaneously administer BH therapy through clinicallyrelevant overlying tissue paths using pulses with duration upto 10 ms. A high-voltage electronic pulser was constructed todrive a 1-MHz focused ultrasound transducer to produce shockwaves with amplitude capable of generating boiling within thepulse duration in tissue. The system output was characterizedby numerical modeling with the 3-D Westervelt equation usingboundary conditions established by acoustic holography measure-ments of the source field. Such simulations were found to be inagreement with directly measured focal waveforms. An existingderating method for nonlinear therapeutic fields was used toestimate in situ pressure levels at different tissue depths. Thesystem was tested in ex vivo bovine liver samples to create BHlesions at depths up to 7 cm. Lesions were also created throughexcised porcine body wall (skin, adipose, and muscle) with3–5 cm thickness. These results indicate that the system is capableof producing the necessary output for transcutaneous ablationwith BH.
Index Terms— Biological effects and dosimetry, high-intensityfocused ultrasound (HIFU), hyperthermia and surgery, medicaltransducers, system and device design.
Manuscript received August 31, 2016; accepted July 8, 2017. Date of pub-lication August 14, 2017; date of current version October 6, 2017. This workwas supported in part by NIH, the National Institute of Biomedical Imagingand Bioengineering under Grant EB007643 and Grant K01 EB015745, in partby NIH, the National Institute of Diabetes and Digestive and Kidney Diseasesunder Grant P01 DK43881, Grant K01 DK104854, and Grant T32 DK007779,in part by Russian Science Foundation under Grant 14-12-00974, and in partby the National Space Biomedical Research Institute through NASA underGrant NCC 9-58. (Corresponding author: Adam D. Maxwell.)
A. D. Maxwell and G. R. Schade are with the Department of Urology,University of Washington School of Medicine, Seattle, WA 98195 USA(e-mail: [email protected]).
P. V. Yuldashev is with the Physics Faculty, M. V. Lomonosov MoscowState University, 119992 Moscow, Russia.
W. Kreider and M. R. Bailey are with the Center for Industrial and MedicalUltrasound, Applied Physics Laboratory, University of Washington, Seattle,WA 98105 USA.
T. D. Khokhlova is with the Department of Gastroenterology, University ofWashington School of Medicine, Seattle, WA 98195 USA.
T. L. Hall is with the Department of Biomedical Engineering, University ofMichigan, Ann Arbor, MI 48109 USA.
O. A. Sapozhnikov and V. A. Khokhlova are with the Center for Indus-trial and Medical Ultrasound, Applied Physics Laboratory, University ofWashington, Seattle, WA 98105 USA, and also with with the Physics Faculty,M. V. Lomonosov Moscow State University, 119992 Moscow, Russia.
Digital Object Identifier 10.1109/TUFFC.2017.2739649
I. INTRODUCTION
H IGH-INTENSITY focused ultrasound (HIFU) is apromising therapeutic modality for treatment of
tumors [2]–[5]. Noninvasive HIFU methods employ a trans-ducer that is acoustically coupled to the skin to generate andfocus ultrasound to a targeted tissue structure in the bodythrough aberrating and attenuating intervening tissue layers.
Most HIFU applications presently rely on a thermal ablativeeffect. Given sufficient focusing, conversion of the acousticwave to thermal energy through absorption and the result-ing temperature rise can be spatially localized to ablatethe intended tissue through thermal denaturation of proteins.Benefits of such a method are its noninvasive mechanism ofaction, the ability to treat most tissue types, and requirement ofrelatively low acoustic pressure amplitudes that can be reliablygenerated by piezoelectric sources. However, thermal HIFUalso has limitations in its precision, speed, and availability ofreal time imaging. Blood perfusion can result in undertreatinga targeted volume, and areas adjacent to the intended treat-ment site can be ablated due to thermal diffusion [6]. Suchproblems require that the rate and pattern of heat depositionare carefully controlled. Additional treatment planning is alsoneeded to ensure that no prefocal or postfocal structures,such as ribs or skull, are overheated [7], [8]. Large vesselsnear the target tissue potentially affect the outcome as well,by acting as a thermal sink that cools the immediate surround-ings [9], [10]. Real time monitoring of HIFU treatment ismost reliable using magnetic resonance imaging (MRI), butthe limited spatial and temporal resolution of MRI necessitateslow heating rates and therefore long treatment times on theorder of hours for sizeable tumors.
Another prominent effect of HIFU is the generation ofbubbles through boiling or cavitation at the focus. Bubbleexpansion, motion, and interactions with the incident wavefield can serve to concentrate stress on the tissue sufficientto cause mechanical disintegration, a process referred to as“histotripsy” [11]–[14]. The histologic characteristics of his-totripsy lesions are a homogenization of tissue structure ona subcellular level [15]–[17] and disorganization of tissuestructures [18] without apparent thermal necrosis. Macroscopiceffects include liquefaction of parenchymal tissue [19], [20]or erosion of tougher tissue structures [21], [22], often accom-panied by minor bleeding into the lesion volume in an in vivoscenario [23], [24]. The boundaries of the lesions are usuallywell-defined; the inside of the volume displays completehomogenization, while just a few cell lengths away, tissue
0885-3010 © 2017 IEEE. Personal use is permitted, but republication/redistribution requires IEEE permission.See ht.tp://w.ww.ieee.org/publications_standards/publications/rights/index.html for more information.

MAXWELL et al.: PROTOTYPE THERAPY SYSTEM FOR TRANSCUTANEOUS APPLICATION 1543
appears completely viable [15], [25]. Peripheral cavitationactivity outside of the focal volume can cause small, isolatedareas of hemorrhagic injury surrounding the main lesion [26].
The above description applies to two separate methodsof histotripsy: one based on millisecond-long pulses thatresult in rapid heating and boiling of the tissue within eachpulse boiling histotripsy (BH) [12], [20], and the otherbased on repeated microsecond-long pulses that result information and collapse of a cavitation cloud (cavitation-basedhistotripsy) [19], [27]. While each appears to producesimilar biological and mechanical effects on the tissue,the described mechanisms of bubble formation are quitedistinct [12], [28]–[30]. There may be significant clinicaladvantages to using each method [14]. For instance, gener-ating cavitation in histotripsy is more easily achieved at lowfrequencies that can provide better depth penetration, whilegenerating rapid heating through ultrasound absorption andboiling for BH are accomplished more readily with higherfrequencies that can be more precisely focused.
Although BH has been demonstrated feasible in bothex vivo tissue and in vivo, work to date has been accomplishedby exposing a target organ with no intervening tissue [24].One reason behind this approach is the need to accuratelyidentify the in situ exposure levels that cause tissue liquefac-tion. Another reason is the limited capabilities of most HIFUpower electronics and transducers. Performing transcutaneousBH requires the generation of ultrasound pulses with in situshock amplitudes as great as 100 MPa that are sustainedfor ∼10 ms so that localized boiling is initiated during eachpulse [12].
In this paper, we describe the development and testing ofa system capable of producing BH lesions through clinicallyrelevant tissue paths. A pulsed power amplifier design [31]previously developed for cavitation-based histotripsy wasmodified to provide necessary pulsed power output overthe durations needed for BH. In addition, a BH transducerwas designed to produce high-amplitude shock fronts at thefocus and withstand high output levels. The transducer wasfabricated using a methodology for robust design and con-struction of focused transducers [32]. Characterization of theoverall acoustic output of the system was performed using acombined measurement and modeling technique in its mostaccurate formulation [33]. In this approach, acoustic hologra-phy measurements were used to define boundary conditionsfor the modeling [34]. The nonlinear acoustic field was thensimulated using the Westervelt equation [35], [36]. Beyondsystem characterization, we demonstrate that lesions can bemade through different tissue thicknesses in liver and throughporcine abdominal wall. As such, this paper represents a steptoward performing BH treatments to targeted tissue sites indeep-seated abdominal organs such as liver or kidney.
II. METHODS
A. Driving ElectronicsAn electronic transducer driving system was designed and
constructed based on a half-bridge class-D amplifier previouslydeveloped for HIFU applications including cavitation-basedhistotripsy (Fig. 1) [31].
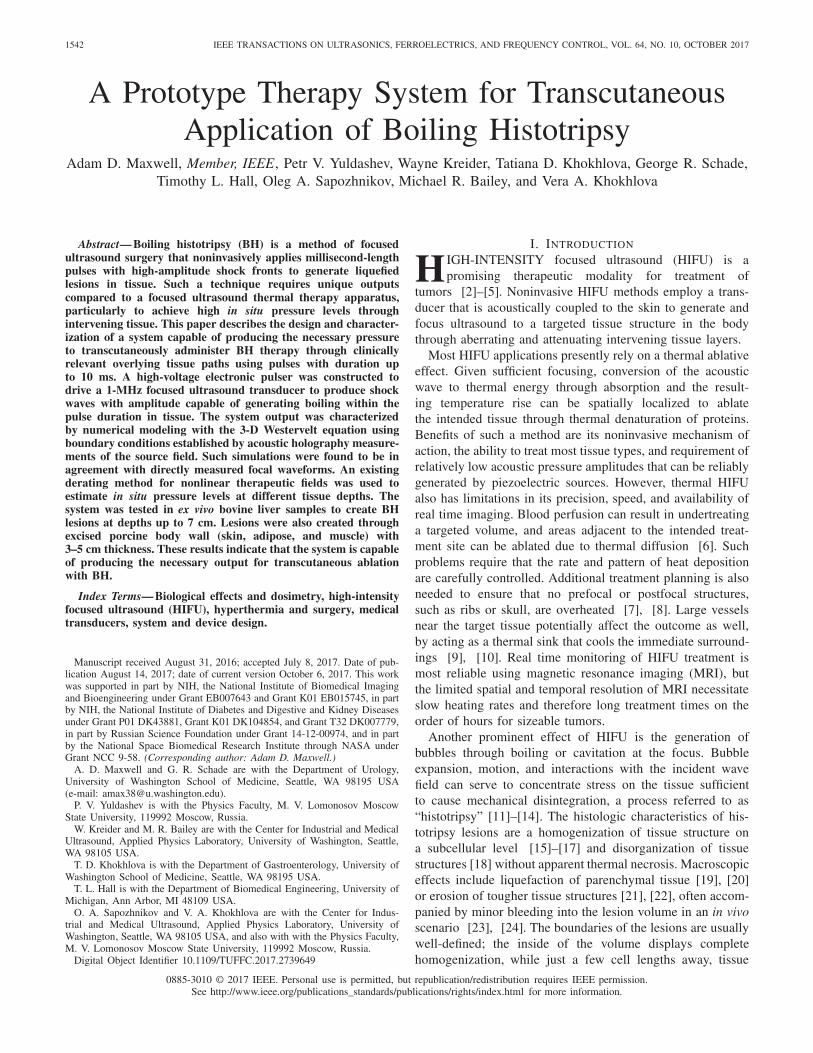
Fig. 1. (Top) Electrical schematic for the capacitor array, including parasiticvalues for the capacitors. The array is connected between high voltage (Vdc)and ground. The multiplier above each series RLC indicates the numberof parallel units used in the full array. (Bottom) Schematic of one unit ofthe amplifier system. The complete amplifier comprises eight channels andeach channel consists of four identical units in parallel between the inputsignals (Vn , Vp) and the output to the load.
The system is composed of as follows:1) a field-programmable gate array (FPGA) board that
produces digital unipolar, low-voltage waveforms(DE1, Altera, San Jose, CA, USA);
2) an amplifier board that converts the FPGA signal to highvoltage;
3) low- and high-voltage supplies that power the amplifierboard;
4) an electrical tuning network at the amplifier outputto transform the transducer impedance driven by theamplifier.
This design can be duplicated in parallel sets to create multipleoutput channels, each with a low impedance of ∼1 �. Anyload with substantially higher impedance can be driven withgood efficiency. The amplifier output stage is powered by acontrollable dc voltage supply with a range Vdc = 0–400 V.
In its original design, the amplifier is capable of producinglarge peak power output and voltage levels to drive transducersto produce high surface pressure. A limitation of this configu-ration is that it can only produce such power output for shortbursts (<100 cycles at 1 MHz). For longer burst durations,the energy stored by the onboard capacitors is diminished andthe voltage level declines. Because of the large instantaneouscurrents demanded to produce high power levels (which maybe >100 A), the high-voltage power supply cannot respond
1544 IEEE TRANSACTIONS ON ULTRASONICS, FERROELECTRICS, AND FREQUENCY CONTROL, VOL. 64, NO. 10, OCTOBER 2017
quickly enough or supply the current necessary to rechargethe capacitors as a burst is being produced.
To achieve longer bursts, a capacitor array was installed inparallel with the high-voltage supply to store the necessaryenergy to produce long bursts. A schematic of the systemis shown in Fig. 1. The capacitor array was designed tostore sufficient energy to emit a 10 000-cycle burst from atherapy transducer with a parallel impedance down to ∼2 �while not reducing the voltage across the capacitors morethan 10%. An energy storage capacitance of ∼9 mF waschosen, comprising three film capacitors.
The capacitors and their associated self-inductance create aresonance that is evident as fluctuation of the voltage on thepower supply during a burst. As a result, these fluctuationscan cause unintended behavior of the board by transientovervoltage of the transistors on the amplifier board. Thus,smaller bypass capacitors were installed in parallel to create atuned array with low impedance over the frequency range of100 Hz–10 MHz (Fig. 1). Damping resistors were added toeach of the three largest capacitor values to minimize reso-nances between them and minimize oscillations of the supply.For simplicity, damping was not included on the two smallestcapacitor values which had many parallel units, and this wasnot found to limit the operation up to the maximum drivingpower. For higher power operation, damping resistors on allcapacitors may be needed. Under the present configuration,the impedance of the power supply was <0.2 � over the range100 Hz–10 MHz.
B. TransducerA 1-MHz transducer for BH was designed and fabricated
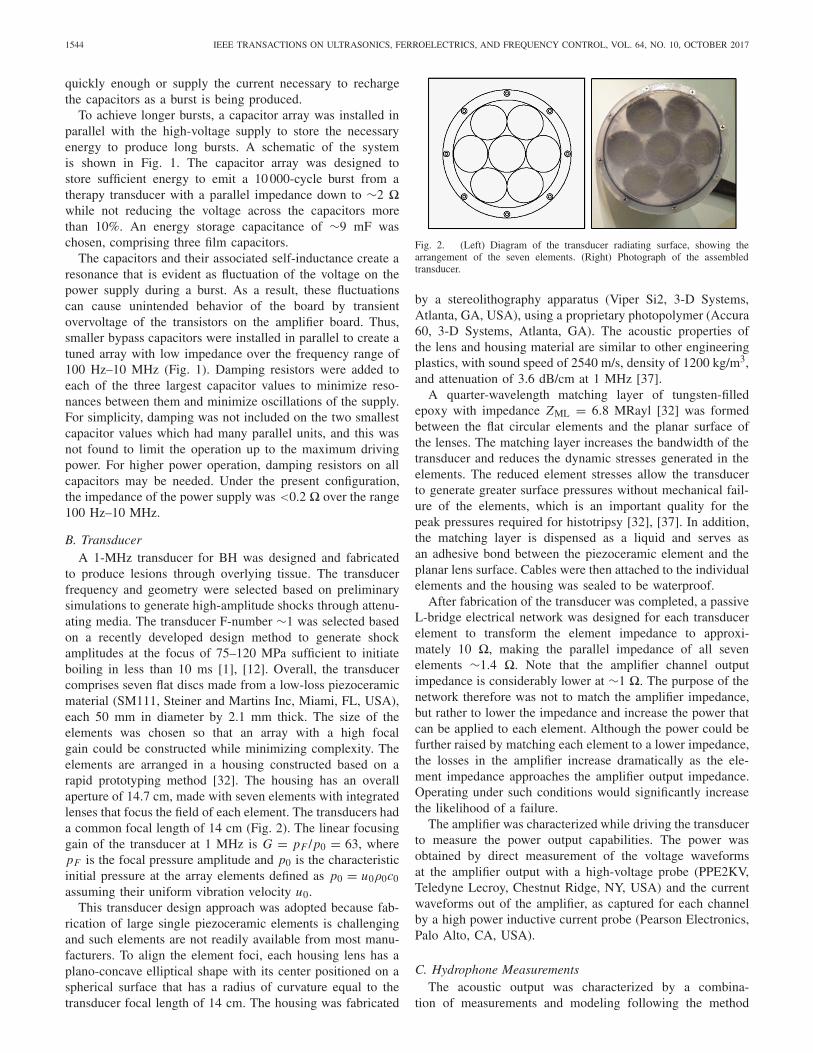
to produce lesions through overlying tissue. The transducerfrequency and geometry were selected based on preliminarysimulations to generate high-amplitude shocks through attenu-ating media. The transducer F-number ∼1 was selected basedon a recently developed design method to generate shockamplitudes at the focus of 75–120 MPa sufficient to initiateboiling in less than 10 ms [1], [12]. Overall, the transducercomprises seven flat discs made from a low-loss piezoceramicmaterial (SM111, Steiner and Martins Inc, Miami, FL, USA),each 50 mm in diameter by 2.1 mm thick. The size of theelements was chosen so that an array with a high focalgain could be constructed while minimizing complexity. Theelements are arranged in a housing constructed based on arapid prototyping method [32]. The housing has an overallaperture of 14.7 cm, made with seven elements with integratedlenses that focus the field of each element. The transducers hada common focal length of 14 cm (Fig. 2). The linear focusinggain of the transducer at 1 MHz is G = pF /p0 = 63, wherepF is the focal pressure amplitude and p0 is the characteristicinitial pressure at the array elements defined as p0 = u0ρ0c0assuming their uniform vibration velocity u0.
This transducer design approach was adopted because fab-rication of large single piezoceramic elements is challengingand such elements are not readily available from most manu-facturers. To align the element foci, each housing lens has aplano-concave elliptical shape with its center positioned on aspherical surface that has a radius of curvature equal to thetransducer focal length of 14 cm. The housing was fabricated
Fig. 2. (Left) Diagram of the transducer radiating surface, showing thearrangement of the seven elements. (Right) Photograph of the assembledtransducer.
by a stereolithography apparatus (Viper Si2, 3-D Systems,Atlanta, GA, USA), using a proprietary photopolymer (Accura60, 3-D Systems, Atlanta, GA). The acoustic properties ofthe lens and housing material are similar to other engineeringplastics, with sound speed of 2540 m/s, density of 1200 kg/m3,and attenuation of 3.6 dB/cm at 1 MHz [37].
A quarter-wavelength matching layer of tungsten-filledepoxy with impedance ZML = 6.8 MRayl [32] was formedbetween the flat circular elements and the planar surface ofthe lenses. The matching layer increases the bandwidth of thetransducer and reduces the dynamic stresses generated in theelements. The reduced element stresses allow the transducerto generate greater surface pressures without mechanical fail-ure of the elements, which is an important quality for thepeak pressures required for histotripsy [32], [37]. In addition,the matching layer is dispensed as a liquid and serves asan adhesive bond between the piezoceramic element and theplanar lens surface. Cables were then attached to the individualelements and the housing was sealed to be waterproof.
After fabrication of the transducer was completed, a passiveL-bridge electrical network was designed for each transducerelement to transform the element impedance to approxi-mately 10 �, making the parallel impedance of all sevenelements ∼1.4 �. Note that the amplifier channel outputimpedance is considerably lower at ∼1 �. The purpose of thenetwork therefore was not to match the amplifier impedance,but rather to lower the impedance and increase the power thatcan be applied to each element. Although the power could befurther raised by matching each element to a lower impedance,the losses in the amplifier increase dramatically as the ele-ment impedance approaches the amplifier output impedance.Operating under such conditions would significantly increasethe likelihood of a failure.
The amplifier was characterized while driving the transducerto measure the power output capabilities. The power wasobtained by direct measurement of the voltage waveformsat the amplifier output with a high-voltage probe (PPE2KV,Teledyne Lecroy, Chestnut Ridge, NY, USA) and the currentwaveforms out of the amplifier, as captured for each channelby a high power inductive current probe (Pearson Electronics,Palo Alto, CA, USA).
C. Hydrophone MeasurementsThe acoustic output was characterized by a combina-
tion of measurements and modeling following the method
MAXWELL et al.: PROTOTYPE THERAPY SYSTEM FOR TRANSCUTANEOUS APPLICATION 1545
described by Kreider et al. [33]. Holographic pressure mea-surements were conducted at low-power output using a capsulehydrophone with nominal sensitivity at 1 MHz of 4.23 ×10⁻⁷ V/Pa (HGL-0200 with AH-2020 preamplifier, OndaCorporation, Sunnyvale, CA, USA). These measurements wereused to reconstruct transducer vibrations. This vibrational pat-tern was scaled in amplitude and used as a boundary conditionfor nonlinear modeling at increasing power outputs. The mod-eling results were validated by comparing the nonlinear wave-forms in the focal region at varying output levels with directmeasurements using a fiber optic probe hydrophone (FOPH)[38] (FOPH 2000, RP’ Acoustics, Leutenbach, Germany).
For all hydrophone measurements, the transducer wasmounted in a tank of deionized water, which was degassedto a dissolved oxygen level <20% of saturation. Duringmeasurements, each hydrophone was mounted on a three-axismotorized positioning system (Velmex Inc., Bloomfield, NY,USA) with the sensing region facing the ultrasound beam.One axis of the positioner was aligned to be parallel tothe acoustic axis of the transducer. Pressure waveforms werecaptured by a digital storage oscilloscope (DSO-X 3034A,Keysight Technologies, Inc., Santa Rosa, CA, USA), whichwas triggered in synchrony with the generation of acousticpulses by the transducer.
Low-pressure measurements comprised 2-D holographyscans in a plane transverse to the acoustic axis, validationline scans made near the focus at low-output levels, andsingle-point measurements made close to the transducer over arange of different output levels. For holography measurements,the hydrophone was first aligned with the peak pressuremaximum of the linear field, then moved 55 mm from thefocus toward the transducer along the acoustic axis. Differentholograms were recorded with this point at the center of a2-D square region of the scan plane and used to characterizetransducer behavior while driving all elements, only the centralelement, or only one peripheral element. In all cases, theelements were driven with Vdc = 5 V. The scans covereda 120 × 120 mm2 area with steps of 0.75 mm between themeasurements. Holograms were defined as a distribution ofthe pressure magnitude and phase at the operating frequencyof 1 MHz measured at each point of the scanning grid.Although the ring-up time of the transducer was about threeacoustic cycles, measurements were based on ten cycles of thesteady-state waveform beginning after about 30 cycles, whichallowed the signals from all the transducer points to arriveto the hydrophone and thus to mimic correctly the steady-state continuous-wave regime. A 1-D beam profiles were alsomeasured for each of the three principal axes through thefocus in order to validate linear field modeling results withholographically reconstructed boundary conditions.
For single-point measurements near the transducer,the hydrophone was moved 80 mm toward the transducerfrom the position of the peak pressure maximum. At thislocation, a series of waveforms was recorded for drivingvoltages ranging between Vdc = 2.5–150 V. The amplitudeof each measured waveform at 1 MHz was calculated againusing ten cycles of the steady-state waveform. The linearityof the measured waveforms was quantified as the ratio of
the pressure amplitude at the second-harmonic to that at thefundamental frequency, being equal to 0.14 at the highestmeasured output level. As described in further detail below,model boundary conditions were defined based on the patternof source vibrations represented by the hologram measuredunder linear conditions; corresponding source pressures for agiven output level were then scaled based on these single-pointmeasurements.
For direct measurement of focal waveforms at high pres-sures, the FOPH was positioned at the location of the greatestvalue of the peak positive pressure at Vdc = 50 V, which cor-responded to the beginning of shock formation, and remainedat the same location as waveforms were acquired at dif-ferent power outputs. Collected waveforms were capturedas an average of 128 waveforms and then deconvolvedbased on a manufacturer-provided impulse response for theFOPH [38], [39]. A 1-D beam profiles for the peak positiveand peak negative pressures in acoustic waveform were alsorecorded at Vdc = 50 V for each of the three principal axesthrough the focus.
D. Nonlinear Acoustic Field ModelingNumerical modeling of the HIFU fields generated in water
was performed using the Westervelt equation. This equationhas been shown to provide an accurate model to simulatenonlinear acoustic fields of strongly focused HIFU arrays [33].The equation includes effects of nonlinearity, diffraction, andabsorption generalized for frequency dependence of absorptionin tissue [40]. Detailed description of the numerical algorithmhas been presented in an earlier paper [35]. Here, a briefsummary of the simulations is provided.
To model forward propagation of the ultrasound beam gen-erated by the transducer, the Westervelt equation was rewrittenin a retarded coordinate system
∂2 p
∂τ∂z= c0
2∇2 p + β
2ρ0c30
∂2 p2
∂τ 2 + δ
2c30
∂3 p
∂τ 3 + Lt (p) (1)
where p is the acoustic pressure, z is the spatial coordinatealong the beam axis, and τ = t − z/c0 is the retardedtime, where t is the time. In addition, ∇2 denotes the fullLaplacian ∂2/∂x2 +∂2/∂y2 +∂2/∂z2, where x and y are spatialcoordinates perpendicular to the axial coordinate z. Physicalparameters ρ0, c0, β, and δ are the density, ambient soundspeed, coefficient of nonlinearity, and diffusivity of sound inthe propagation medium, respectively.
Equation (1) is generalized for modeling in tissue byincluding an additional operator Lt (p) that governs the lineardependence of absorption with frequency and the correspond-ing dispersion relationship for sound speed
α ( f ) = α ( f0)f
f0,
c( f ) − c0
c0= c0α( f0)
π2 fln (
f
f0). (2)
Here α ( f0) is the absorption coefficient in tissue at theoperating frequency f0 = 1 MHz of the transducer.
The boundary condition to the model was determined fromholography measurements of the vibration pattern of thesurface of the array [33], [41], [42]. The hologram measuredin water in the plane z = 85 mm was linearly back projected

1546 IEEE TRANSACTIONS ON ULTRASONICS, FERROELECTRICS, AND FREQUENCY CONTROL, VOL. 64, NO. 10, OCTOBER 2017
to a source hologram in the plane z = 0 using the angularspectrum method. Note that the coordinate z = 0 correspondsto the apex of the surface on which transducer elements werepositioned within the housing. To account for different outputpower levels, this source hologram was scaled in accordancewith the single-point measurements made near the trans-ducer [33]. The conversion coefficient between the voltage andpressure was determined by matching the peak positive andpeak negative pressures of the simulated and measured focalwaveforms by the FOPH at the focus for low source output(quasi-linear conditions). Acoustic power calculated from thehologram measured at Vdc = 5 V using this conversioncoefficient was 2.6 W for all operating elements, 0.41 W forthe center element only, and 0.45 W for a peripheral elementonly. Using these boundary conditions, nonlinear forwardpropagation simulations were launched starting from z = 0for a range of different output levels.
In simulations, the Westervelt equation was solved follow-ing the method of fractional steps with an operator splittingprocedure of second-order accuracy [43]–[45]. Equation (1)was divided into several simpler equations to define oper-ators for diffraction, nonlinearity, and absorption. For eachpropagation step z, these equations were solved sequentiallyaccording to the second-order splitting scheme described byTavakkoli et al. [43]. To obtain numerical solutions to thesesplit operators, the acoustic field was represented in either thetime domain or the frequency domain in the form of a finiteFourier series expansion of harmonic components. Transitionsbetween the time and frequency domains were accomplishedusing fast Fourier transform (FFT) routines from the fastestFourier transform in the west Library.
The diffraction operator was calculated for each harmoniccomponent with the angular spectrum method. In this method,the complex pressure amplitude of the nth harmonic in thetransverse plane at axial position z was transformed by FFTinto a 2-D spectrum p̂n(z) with spatial frequencies (kx , ky).In this notation, the spectrum p̂n(z) represents complex ampli-tudes of plane waves that form the total field pn(z). Theangular spectrum components at the next propagation stepz+z were calculated by multiplying the spectrum at distancez by the corresponding plane wave propagator
p̂n(z + z) = p̂n(z) exp[iz
(√k2
n − k2x − k2
y − kn
)](3)
where kn = nω/c0 is the wavenumber of the nth harmonic.The nonlinear operator was calculated using one of two
algorithms. At small distances from the source, the integrationwas performed in the frequency domain using a fourth-order Runge–Kutta method for the set of nonlinear coupledequations for harmonic amplitudes
∂p
∂z= −inβω
2ρ0c30
(N−n∑m=1
p∗m pn+m + 1
2
n−1∑m=1
pm pn−m
)(4)
where p∗m is the complex conjugate of harmonic amplitude
pm [46]. The method is efficient when the number of har-monics N is relatively small because the computational costsare proportional to N2. To improve efficiency, additionalharmonics were introduced gradually so that the amplitude of
the highest harmonic in use is maintained at a threshold valueof 10−6 p0, where p0 is the pressure amplitude at the source.As the steepness of the waveform increased and more harmon-ics were required, the nonlinear algorithm was adapted to usea conservative time-domain Godunov-type scheme [47]. Theswitch to the Godunov-type scheme was made at a distance zwhere the amplitude of the tenth-harmonic exceeded 1% ofthe amplitude at the fundamental frequency. This value waschosen for computational efficiency, as it is the approximatelevel at which the Runge–Kutta method becomes slower thanthe Godunov-type scheme. The number of operations in thelatter algorithm is proportional to the number of time points,so the simulations are more efficient for strongly distortedwaveforms with many harmonics.
The main reason to switch to the Godunov-type schemeis its ability to automatically handle waveforms with shockswith high accuracy. When a shock forms, the Godunov-type scheme automatically provides 2–3 times grid points pershock [47]. To provide more control over the width of theshock (rise time), a mechanism of adaptive artificial absorptionwas implemented. As it is known from the general theory ofnonlinear acoustic waves, the Taylor shock thickness dependson the diffusivity of the propagation medium [36]. Thus,to maintain the shock rise time at a given fixed level τsh,the diffusivity coefficient in the Westervelt (1) was increasedat each spatial grid node by an additional artificial value δa
introduced according to the following equation:δa + δ = τshβωpsh
8.8ρ0c30
(5)
where psh is the pressure jump across the shock defined as adifference between 0.1 and 0.9 levels of the peak positive pres-sure. Equation (5) corresponds to the exact analytic solution tothe Burgers equation for the Taylor step-shock front [36]. Theartificial diffusivity is therefore a spatial function determinedby the presence and magnitude of the shock in the waveformat each spatial location. The shock thickness τsh was set tobe equal to seven steps of the time grid. The absorptionand dispersion operator was then calculated in the frequencydomain using an exact solution for each harmonic
pn(x, y, z + z)
= pn(x, y, z)exp
[−zω2
n(δ + δa)
2c30
− znα( f0)
+ iz2
πnα( f0)ln(n)
](6)
where ωn is the angular frequency of the nth harmonic.When shocks are present in weakly attenuating media,
heating is primarily due to shock wave dissipation rather thanlinear attenuation [12]. An estimate for focal heating can beobtained from the pressure waveform based on the shockamplitude by
qs = β f0p3sh
6ρ20 c4
0
. (7)
This expression is used to obtain an estimate for time-to-boilby tb = T cv/qs , where T is the necessary change in
MAXWELL et al.: PROTOTYPE THERAPY SYSTEM FOR TRANSCUTANEOUS APPLICATION 1547
temperature to achieve boiling (in this case 80 °C) and cv
is the heat capacity. For modeling in water, the values of thephysical parameters were chosen according to the experimentalconditions: ρ0 = 998 kg/m3, c0 = 1485 m/s, β = 3.5, andδ = 4.33 · 10−6 m2/s.
To derate pressure measurements acquired in water to in situpressures when focusing at the depth L in liver, the sourceoutput voltage V was increased to compensate absorptionlosses following the previously proposed derating method:Vtissue = Vwater · exp(α( f0)L), where the attenuation wasvaried between α( f0) = 0.08–0.1 cm−1 or 0.7–0.9 dB/cmfor the operating frequency f0 = 1 MHz [48].
E. Lesion Generation in TissueAs a representative target tissue for BH, fresh bovine liver
was acquired from a local abattoir and placed immediately ina bag on ice for transport. After 1 h, the liver was cut into sec-tions approximately 10 cm × 10 cm with thicknesses varyingfrom 3–8 cm. These samples were placed in an open containerof phosphate-buffered saline (PBS) and transferred to a belljar degassing system evacuated to a pressure of ∼17 kPa.Samples were left under vacuum for at least 1 h prior to usein experiments.
Following unrelated experiments for which all procedureswere preapproved by our institutional animal care and usecommittee, fresh abdominal body wall sections were procuredfrom porcine subjects. Body wall sections consisting of skin,fat, muscle, and fascia were excised en bloc. The body wallsections had a total thickness of 3–5 cm. Excised tissues wereimmediately submerged in a PBS solution and placed undervacuum in the bell jar for at least 1 h prior to experiments.
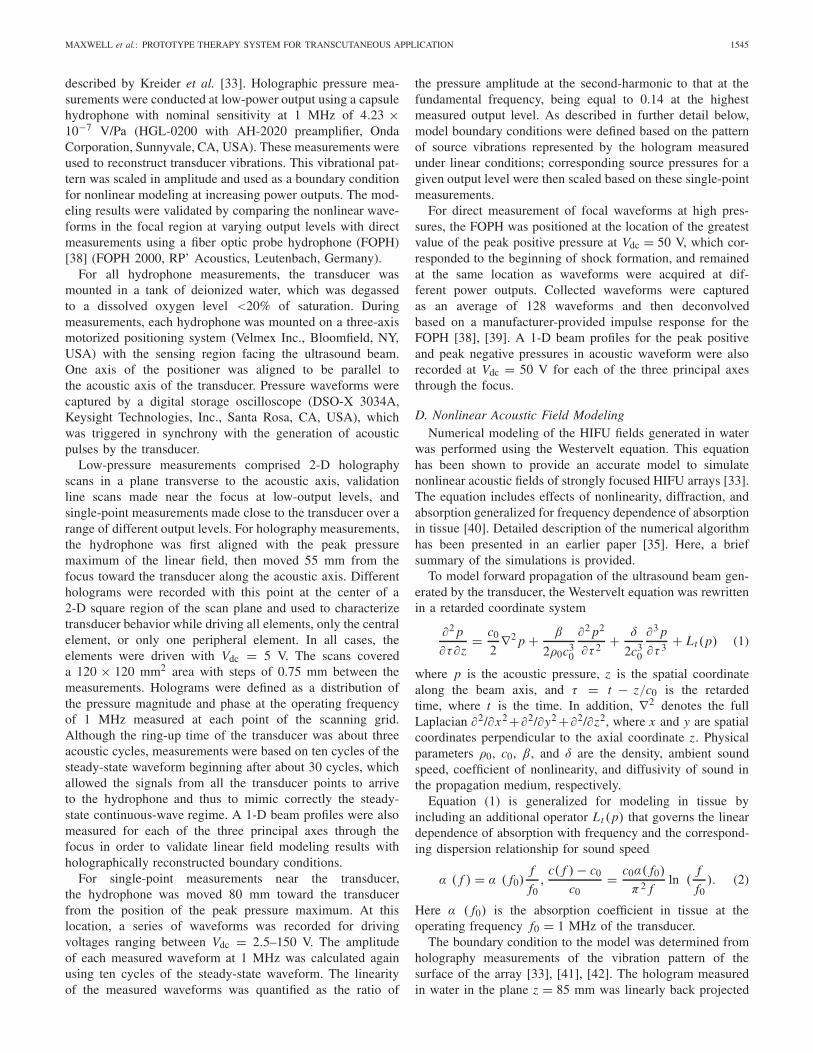
All experiments were conducted within 12 h of samplepreparation. To deliver BH exposures, the transducer waspositioned in a degassed water bath, and the liver sectionwas held in an acrylonitrile butadiene styrene cage withopenings that allowed direct contact of the liver sample withthe surrounding water bath (Fig. 3). The transducer focus wasaligned in the liver with the focus at a depth of either 18, 35,50, 60, or 70 mm from the surface proximal to the transducer.An ultrasound imaging system (V1, Verasonics, Kirkland, WA,USA) with a P4-2 imaging probe was aligned to visualize theaxial-lateral plane of the therapy transducer in the vicinityof the focus in the liver sample and identify echogenicity inthe focal region indicative of boiling [24], [49]. The focalarea cannot be visualized during the pulse because of acousticinterference between the therapy output and imager, instead,echogenicity due to vapor bubbles remaining in the focal areais observed between the pulses.
For experiments with the body wall, focal pressure wave-forms were recorded with and without the intervening wallusing the FOPH positioned in water at the focus, i.e., at thelocation of the greatest value of the peak positive pressureat Vdc = 50 V as described in Section II-C. The body wallwas placed between the array and the FOPH perpendicularto the array axis with the skin side facing the transducerand the fascial surface of the sample positioned at about10–15 mm distance from the hydrophone. Vdc was increasedto compensate for losses in the body wall; the position of
Fig. 3. Experimental apparatus for positioning the ex vivo liver tissue,therapy transducer, and imaging probe for identification of boiling. Transversedimensions of tissue samples were the same (10 × 10 cm) with differencethicknesses up to 8 cm.
the FOPH was slightly adjusted for finding the maximumof the peak positive pressure, and the pressure waveformswere acquired in this location for the increasing power level.Scaling coefficient for the voltage was determined by mea-suring pressure amplitude at the focus at Vdc = 10 V withand without the presence of the body wall. After waveformmeasurements were acquired, a liver sample was substitutedfor the FOPH, positioned adjacent to the body wall fascialsurface.
To determine the in situ pressure levels at which BH lesionscould be generated at each depth in liver, sonications were per-formed at different pressure outputs from the transducer. Foreach sonication, the transducer was set to output 60 acousticpulses with a pulse duration of 10 ms (10 000 cycles) and apulse repetition frequency of 1 Hz. After a given exposure,the focus was translated laterally by 10 mm and a newexposure was performed at a different pressure amplitude.After all sonications in a sample were complete, the tissue wassectioned to locate and photograph the tissue at each locationwhere an exposure occurred.
III. RESULTS
A. Transducer and Driving SystemThe electrical driving system voltage and current output
were measured to each element. The amplifier was operableup to a maximum level of Vdc = 400 V, which translatedto ∼1 kVpp across each of the seven elements after theimpedance-transforming network. The corresponding pulse-average electrical power at this level was 25.9 kW. The ampli-fier draws current from the capacitors to provide this powerduring a pulse. As the power supply is not able to directlydeliver ∼65 A needed throughout the pulse at the highestpower levels, Vdc declines over the pulse duration. For thistransducer, the voltage drop on the supply was approximately14% over 10 ms. Some drop is unavoidable with such aconfiguration, although a higher capacitance or higher-current

1548 IEEE TRANSACTIONS ON ULTRASONICS, FERROELECTRICS, AND FREQUENCY CONTROL, VOL. 64, NO. 10, OCTOBER 2017
Fig. 4. (a) Example electrical impedance plot for the center element withmatching network. Change in the (b) real and (c) imaginary unmatchedimpedance of each element at 1 MHz over 1000 days.
high-voltage power supply would be able to further minimizethis change. The voltage waveform at the output of theamplifier was a unipolar square wave consisting of 104 cycleswith 1 μs period, but the waveform at the transducer elementinput was nearly sinusoidal with the impedance-transformingnetwork in line which lowers the fundamental impedance andraises the electrical impedance of the harmonics (Fig. 4).However, some harmonic content was present that was notcompletely filtered by the network. The largest harmonic sig-nals in the voltage waveform were present at 3 MHz (−38 dBrelative to the amplitude of the fundamental frequency) and5 MHz (−25 dB). These harmonics were further filtered bythe electromechanical response of the piezoelectric transducerelements: The focal acoustic waveform measured at the focusat lowest output amplitude of Vdc = 2.5 V possessed afifth-harmonic component that was −60 dB relative to thefundamental frequency amplitude. Numerical simulation witha pure 1-MHz harmonic boundary condition at this output levelpredicted a −108-dB level for the fifth-harmonic at the focus.Most of the super-harmonic amplitude in the measurementscan therefore be attributed to driving electronics rather than tononlinear acoustic propagation.
Transducer electrical impedance measurements wererecorded directly after fabrication, and then again at 600 daysand 1000 days after fabrication. Over this time period,the transducer was used in BH experiments including severalwhere it was driven at the maximum amplifier output. Theelectrical impedance of each element remained fairly constantover this time period. The relative impedance change for theseven elements was 5% ± 2%.The maximum change in anyelement was 12% (Fig. 4). Some variability in the transducerimpedance is expected as piezoceramics are known to ageby a similar amount [50]. These results indicate that thetransducer is able to withstand driving the elements in thismanner (up to 263 W/cm2 pulse average electrical intensity),
Fig. 5. Source holograms reconstructed from low-pressure measurementscaptured while operating the (top) entire transducer, (middle) center elementonly, and a (bottom) single peripheral element. Plotted pressure magnitudeswere normalized by the maximum value, while phase is shown in radians.Note that these holograms were reconstructed on a spherical surface just infront of the housing to visualize transducer vibrations without needing toaccount distortions introduced by the integral lenses.
and maintain a general degree of stability over a period ofseveral years. It is difficult to determine the total operatingtime of the transducer over this period because it has beenused in several studies. We estimate an average of 1 h ofactive operation per week at a ≤3% duty factor.
B. Acoustic Field Characterization
A method combining measurements and modeling wasperformed to characterize the acoustic output of the systemunder nearly continuous-wave operation (millsecond-longpulses). Holography measurements were conducted at low-output levels (Vdc = 5 V) to determine boundary conditionsfor modeling and elucidate how individual transducer elementsvibrate.
Holograms were measured for three different operatingconditions:
1) driving all elements with the same phase;2) driving only the central element;3) driving only a single peripheral element.
From the measured hologram for each condition, a sourcehologram was reconstructed to visualize the pattern of trans-ducer vibrations (Fig. 5).
MAXWELL et al.: PROTOTYPE THERAPY SYSTEM FOR TRANSCUTANEOUS APPLICATION 1549
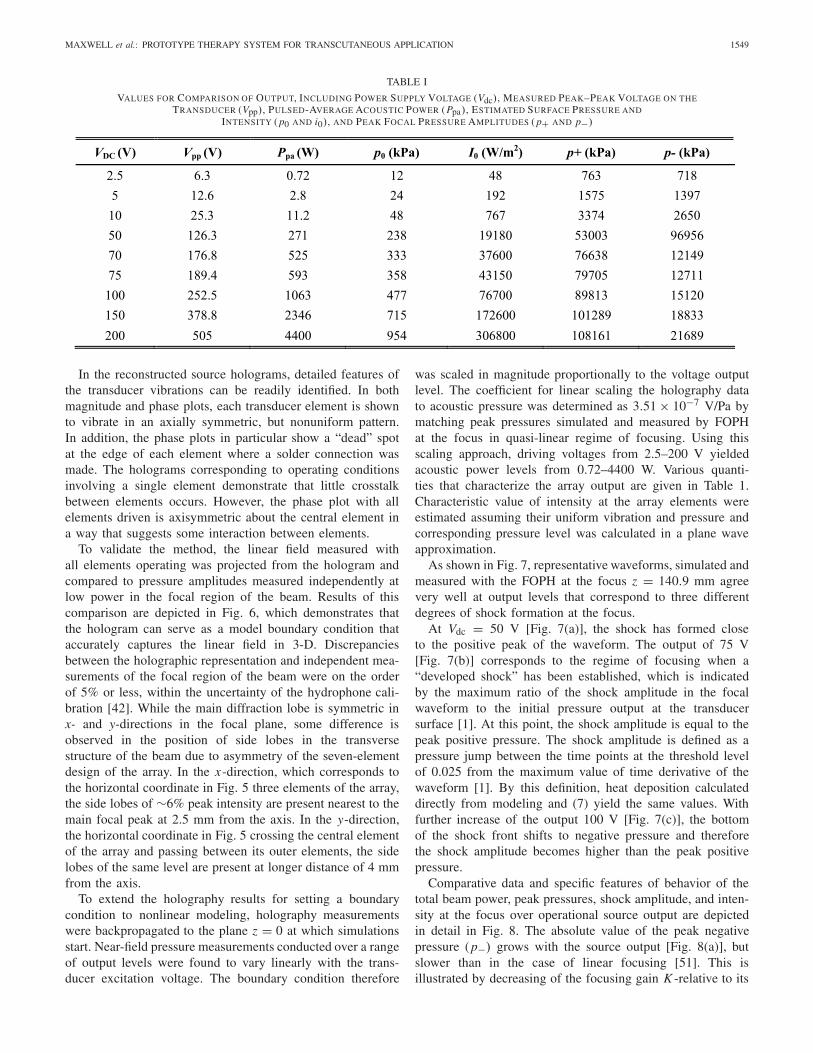
TABLE I
VALUES FOR COMPARISON OF OUTPUT, INCLUDING POWER SUPPLY VOLTAGE (Vdc), MEASURED PEAK–PEAK VOLTAGE ON THETRANSDUCER (Vpp), PULSED-AVERAGE ACOUSTIC POWER (Ppa), ESTIMATED SURFACE PRESSURE AND
INTENSITY ( p0 AND i0), AND PEAK FOCAL PRESSURE AMPLITUDES ( p+ AND p−)
In the reconstructed source holograms, detailed features ofthe transducer vibrations can be readily identified. In bothmagnitude and phase plots, each transducer element is shownto vibrate in an axially symmetric, but nonuniform pattern.In addition, the phase plots in particular show a “dead” spotat the edge of each element where a solder connection wasmade. The holograms corresponding to operating conditionsinvolving a single element demonstrate that little crosstalkbetween elements occurs. However, the phase plot with allelements driven is axisymmetric about the central element ina way that suggests some interaction between elements.
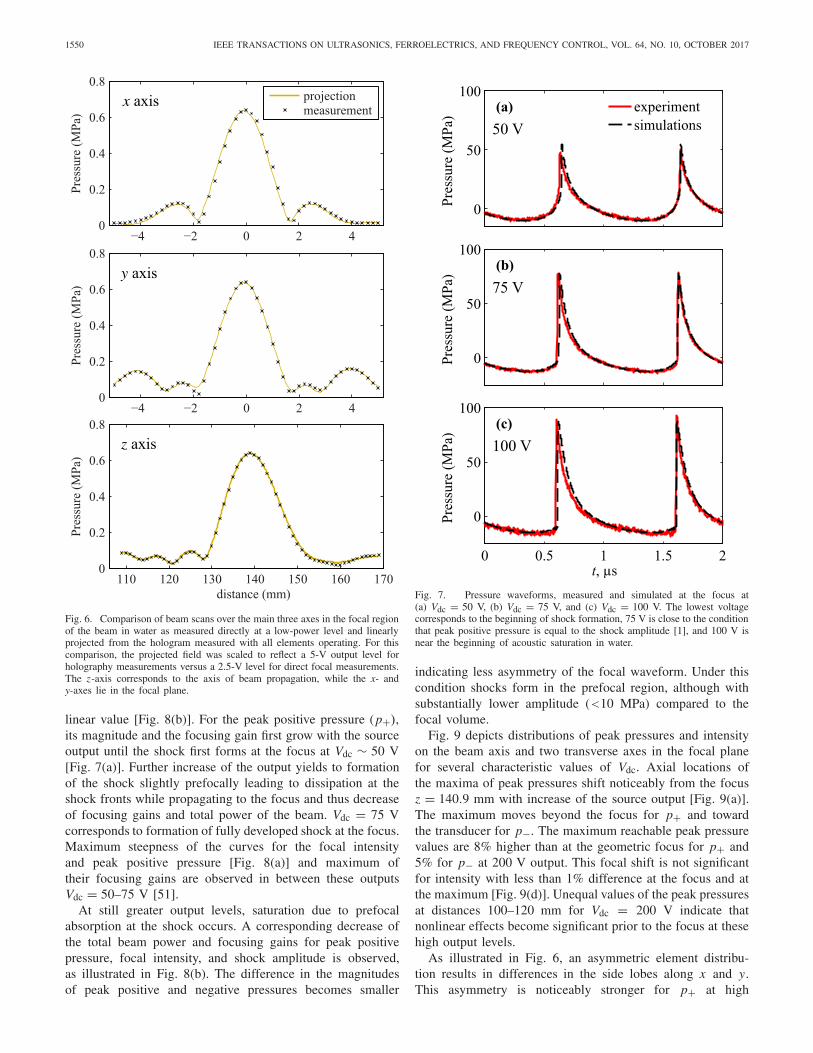
To validate the method, the linear field measured withall elements operating was projected from the hologram andcompared to pressure amplitudes measured independently atlow power in the focal region of the beam. Results of thiscomparison are depicted in Fig. 6, which demonstrates thatthe hologram can serve as a model boundary condition thataccurately captures the linear field in 3-D. Discrepanciesbetween the holographic representation and independent mea-surements of the focal region of the beam were on the orderof 5% or less, within the uncertainty of the hydrophone cali-bration [42]. While the main diffraction lobe is symmetric inx- and y-directions in the focal plane, some difference isobserved in the position of side lobes in the transversestructure of the beam due to asymmetry of the seven-elementdesign of the array. In the x-direction, which corresponds tothe horizontal coordinate in Fig. 5 three elements of the array,the side lobes of ∼6% peak intensity are present nearest to themain focal peak at 2.5 mm from the axis. In the y-direction,the horizontal coordinate in Fig. 5 crossing the central elementof the array and passing between its outer elements, the sidelobes of the same level are present at longer distance of 4 mmfrom the axis.
To extend the holography results for setting a boundarycondition to nonlinear modeling, holography measurementswere backpropagated to the plane z = 0 at which simulationsstart. Near-field pressure measurements conducted over a rangeof output levels were found to vary linearly with the trans-ducer excitation voltage. The boundary condition therefore
was scaled in magnitude proportionally to the voltage outputlevel. The coefficient for linear scaling the holography datato acoustic pressure was determined as 3.51 × 10⁻⁷ V/Pa bymatching peak pressures simulated and measured by FOPHat the focus in quasi-linear regime of focusing. Using thisscaling approach, driving voltages from 2.5–200 V yieldedacoustic power levels from 0.72–4400 W. Various quanti-ties that characterize the array output are given in Table 1.Characteristic value of intensity at the array elements wereestimated assuming their uniform vibration and pressure andcorresponding pressure level was calculated in a plane waveapproximation.
As shown in Fig. 7, representative waveforms, simulated andmeasured with the FOPH at the focus z = 140.9 mm agreevery well at output levels that correspond to three differentdegrees of shock formation at the focus.
At Vdc = 50 V [Fig. 7(a)], the shock has formed closeto the positive peak of the waveform. The output of 75 V[Fig. 7(b)] corresponds to the regime of focusing when a“developed shock” has been established, which is indicatedby the maximum ratio of the shock amplitude in the focalwaveform to the initial pressure output at the transducersurface [1]. At this point, the shock amplitude is equal to thepeak positive pressure. The shock amplitude is defined as apressure jump between the time points at the threshold levelof 0.025 from the maximum value of time derivative of thewaveform [1]. By this definition, heat deposition calculateddirectly from modeling and (7) yield the same values. Withfurther increase of the output 100 V [Fig. 7(c)], the bottomof the shock front shifts to negative pressure and thereforethe shock amplitude becomes higher than the peak positivepressure.
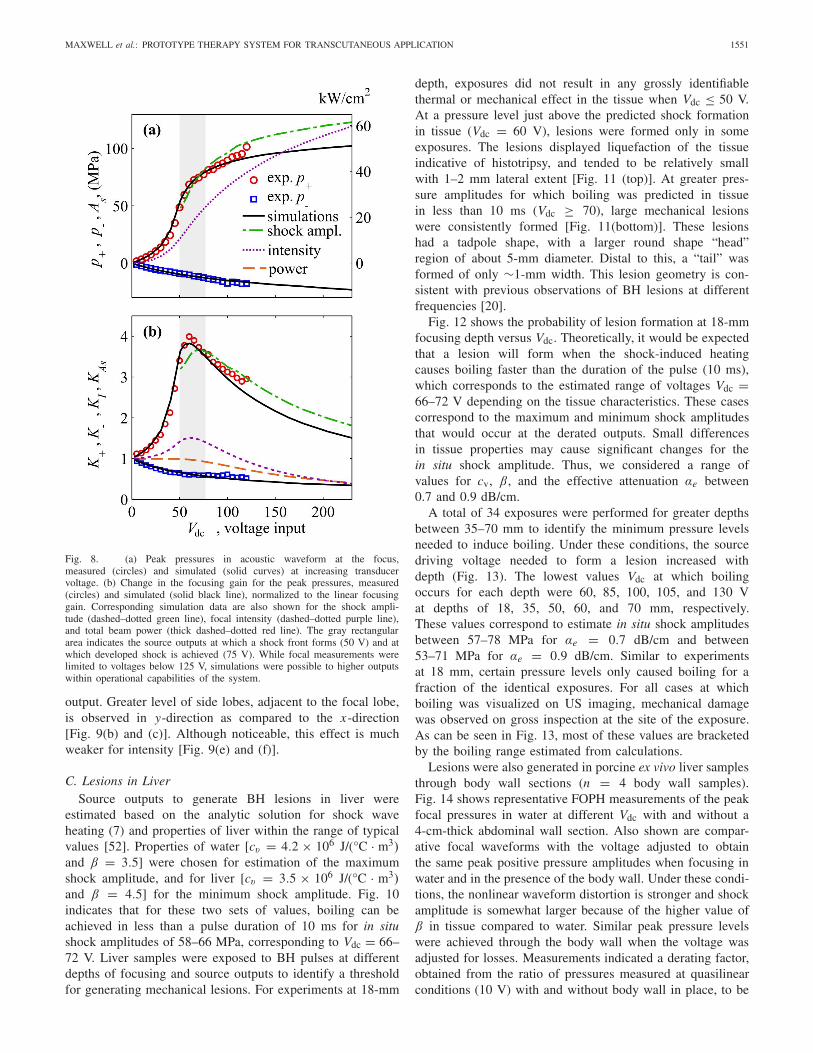
Comparative data and specific features of behavior of thetotal beam power, peak pressures, shock amplitude, and inten-sity at the focus over operational source output are depictedin detail in Fig. 8. The absolute value of the peak negativepressure (p−) grows with the source output [Fig. 8(a)], butslower than in the case of linear focusing [51]. This isillustrated by decreasing of the focusing gain K -relative to its
1550 IEEE TRANSACTIONS ON ULTRASONICS, FERROELECTRICS, AND FREQUENCY CONTROL, VOL. 64, NO. 10, OCTOBER 2017
Fig. 6. Comparison of beam scans over the main three axes in the focal regionof the beam in water as measured directly at a low-power level and linearlyprojected from the hologram measured with all elements operating. For thiscomparison, the projected field was scaled to reflect a 5-V output level forholography measurements versus a 2.5-V level for direct focal measurements.The z-axis corresponds to the axis of beam propagation, while the x- andy-axes lie in the focal plane.
linear value [Fig. 8(b)]. For the peak positive pressure (p+),its magnitude and the focusing gain first grow with the sourceoutput until the shock first forms at the focus at Vdc ∼ 50 V[Fig. 7(a)]. Further increase of the output yields to formationof the shock slightly prefocally leading to dissipation at theshock fronts while propagating to the focus and thus decreaseof focusing gains and total power of the beam. Vdc = 75 Vcorresponds to formation of fully developed shock at the focus.Maximum steepness of the curves for the focal intensityand peak positive pressure [Fig. 8(a)] and maximum oftheir focusing gains are observed in between these outputsVdc = 50–75 V [51].
At still greater output levels, saturation due to prefocalabsorption at the shock occurs. A corresponding decrease ofthe total beam power and focusing gains for peak positivepressure, focal intensity, and shock amplitude is observed,as illustrated in Fig. 8(b). The difference in the magnitudesof peak positive and negative pressures becomes smaller
Fig. 7. Pressure waveforms, measured and simulated at the focus at(a) Vdc = 50 V, (b) Vdc = 75 V, and (c) Vdc = 100 V. The lowest voltagecorresponds to the beginning of shock formation, 75 V is close to the conditionthat peak positive pressure is equal to the shock amplitude [1], and 100 V isnear the beginning of acoustic saturation in water.
indicating less asymmetry of the focal waveform. Under thiscondition shocks form in the prefocal region, although withsubstantially lower amplitude (<10 MPa) compared to thefocal volume.
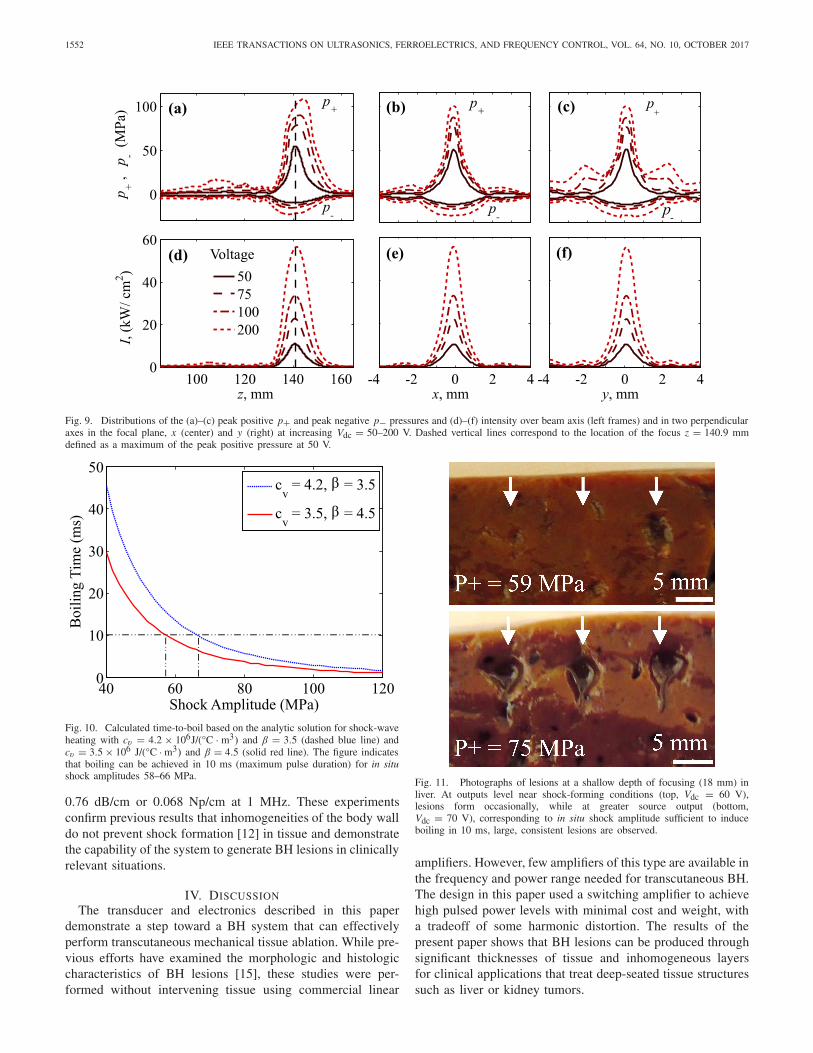
Fig. 9 depicts distributions of peak pressures and intensityon the beam axis and two transverse axes in the focal planefor several characteristic values of Vdc. Axial locations ofthe maxima of peak pressures shift noticeably from the focusz = 140.9 mm with increase of the source output [Fig. 9(a)].The maximum moves beyond the focus for p+ and towardthe transducer for p−. The maximum reachable peak pressurevalues are 8% higher than at the geometric focus for p+ and5% for p− at 200 V output. This focal shift is not significantfor intensity with less than 1% difference at the focus and atthe maximum [Fig. 9(d)]. Unequal values of the peak pressuresat distances 100–120 mm for Vdc = 200 V indicate thatnonlinear effects become significant prior to the focus at thesehigh output levels.
As illustrated in Fig. 6, an asymmetric element distribu-tion results in differences in the side lobes along x and y.This asymmetry is noticeably stronger for p+ at high
MAXWELL et al.: PROTOTYPE THERAPY SYSTEM FOR TRANSCUTANEOUS APPLICATION 1551
Fig. 8. (a) Peak pressures in acoustic waveform at the focus,measured (circles) and simulated (solid curves) at increasing transducervoltage. (b) Change in the focusing gain for the peak pressures, measured(circles) and simulated (solid black line), normalized to the linear focusinggain. Corresponding simulation data are also shown for the shock ampli-tude (dashed–dotted green line), focal intensity (dashed–dotted purple line),and total beam power (thick dashed–dotted red line). The gray rectangulararea indicates the source outputs at which a shock front forms (50 V) and atwhich developed shock is achieved (75 V). While focal measurements werelimited to voltages below 125 V, simulations were possible to higher outputswithin operational capabilities of the system.
output. Greater level of side lobes, adjacent to the focal lobe,is observed in y-direction as compared to the x-direction[Fig. 9(b) and (c)]. Although noticeable, this effect is muchweaker for intensity [Fig. 9(e) and (f)].
C. Lesions in LiverSource outputs to generate BH lesions in liver were
estimated based on the analytic solution for shock waveheating (7) and properties of liver within the range of typicalvalues [52]. Properties of water [cv = 4.2 × 10⁶ J/(°C · m3)and β = 3.5] were chosen for estimation of the maximumshock amplitude, and for liver [cv = 3.5 × 10⁶ J/(°C · m3)and β = 4.5] for the minimum shock amplitude. Fig. 10indicates that for these two sets of values, boiling can beachieved in less than a pulse duration of 10 ms for in situshock amplitudes of 58–66 MPa, corresponding to Vdc = 66–72 V. Liver samples were exposed to BH pulses at differentdepths of focusing and source outputs to identify a thresholdfor generating mechanical lesions. For experiments at 18-mm
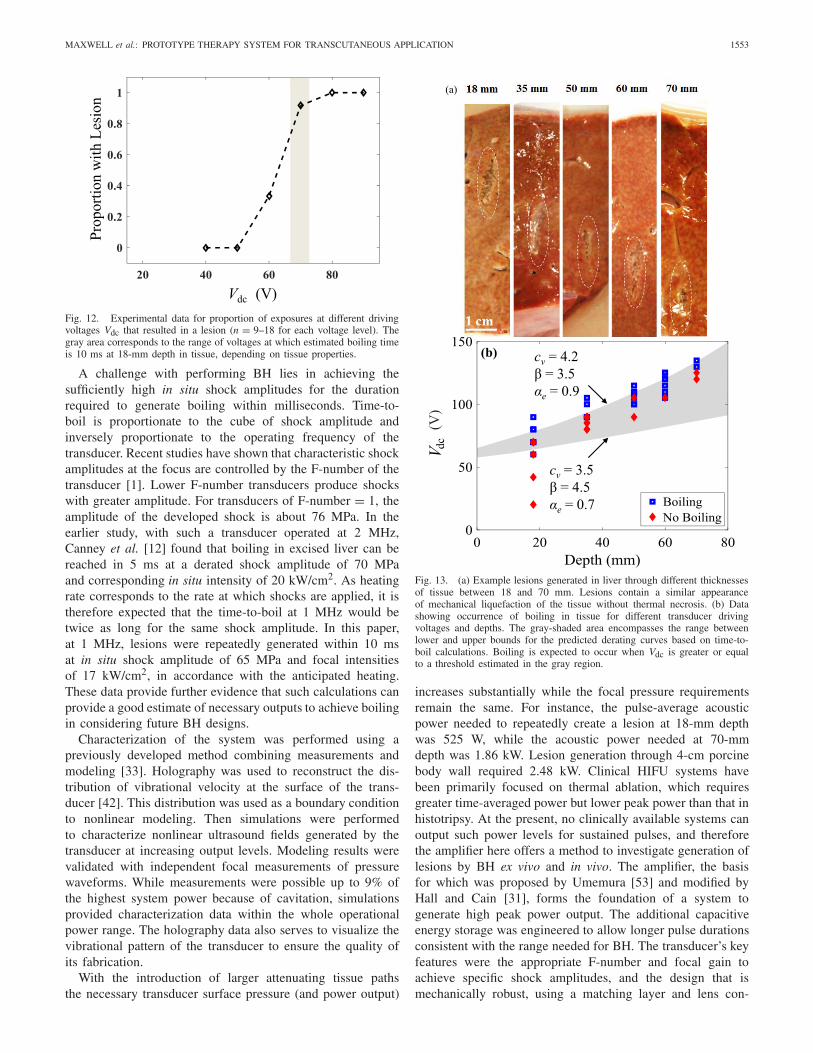
depth, exposures did not result in any grossly identifiablethermal or mechanical effect in the tissue when Vdc ≤ 50 V.At a pressure level just above the predicted shock formationin tissue (Vdc = 60 V), lesions were formed only in someexposures. The lesions displayed liquefaction of the tissueindicative of histotripsy, and tended to be relatively smallwith 1–2 mm lateral extent [Fig. 11 (top)]. At greater pres-sure amplitudes for which boiling was predicted in tissuein less than 10 ms (Vdc ≥ 70), large mechanical lesionswere consistently formed [Fig. 11(bottom)]. These lesionshad a tadpole shape, with a larger round shape “head”region of about 5-mm diameter. Distal to this, a “tail” wasformed of only ∼1-mm width. This lesion geometry is con-sistent with previous observations of BH lesions at differentfrequencies [20].
Fig. 12 shows the probability of lesion formation at 18-mmfocusing depth versus Vdc. Theoretically, it would be expectedthat a lesion will form when the shock-induced heatingcauses boiling faster than the duration of the pulse (10 ms),which corresponds to the estimated range of voltages Vdc =66–72 V depending on the tissue characteristics. These casescorrespond to the maximum and minimum shock amplitudesthat would occur at the derated outputs. Small differencesin tissue properties may cause significant changes for thein situ shock amplitude. Thus, we considered a range ofvalues for cv, β, and the effective attenuation αe between0.7 and 0.9 dB/cm.
A total of 34 exposures were performed for greater depthsbetween 35–70 mm to identify the minimum pressure levelsneeded to induce boiling. Under these conditions, the sourcedriving voltage needed to form a lesion increased withdepth (Fig. 13). The lowest values Vdc at which boilingoccurs for each depth were 60, 85, 100, 105, and 130 Vat depths of 18, 35, 50, 60, and 70 mm, respectively.These values correspond to estimate in situ shock amplitudesbetween 57–78 MPa for αe = 0.7 dB/cm and between53–71 MPa for αe = 0.9 dB/cm. Similar to experimentsat 18 mm, certain pressure levels only caused boiling for afraction of the identical exposures. For all cases at whichboiling was visualized on US imaging, mechanical damagewas observed on gross inspection at the site of the exposure.As can be seen in Fig. 13, most of these values are bracketedby the boiling range estimated from calculations.
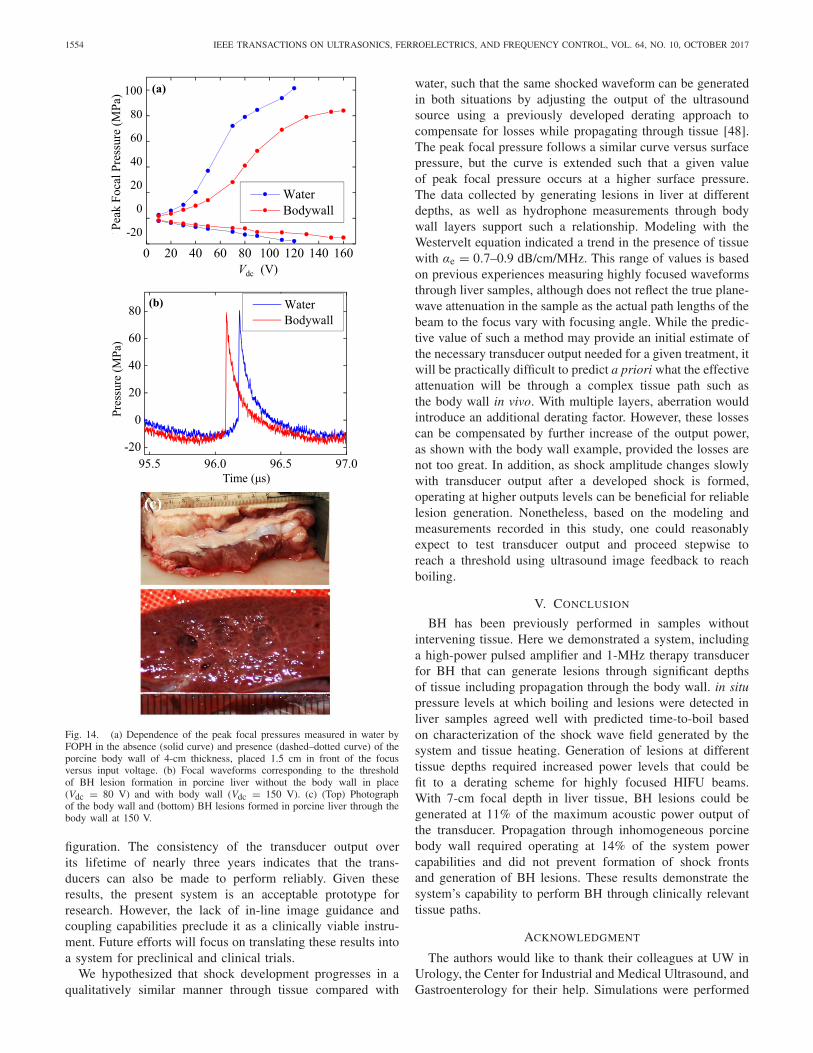
Lesions were also generated in porcine ex vivo liver samplesthrough body wall sections (n = 4 body wall samples).Fig. 14 shows representative FOPH measurements of the peakfocal pressures in water at different Vdc with and without a4-cm-thick abdominal wall section. Also shown are compar-ative focal waveforms with the voltage adjusted to obtainthe same peak positive pressure amplitudes when focusing inwater and in the presence of the body wall. Under these condi-tions, the nonlinear waveform distortion is stronger and shockamplitude is somewhat larger because of the higher value ofβ in tissue compared to water. Similar peak pressure levelswere achieved through the body wall when the voltage wasadjusted for losses. Measurements indicated a derating factor,obtained from the ratio of pressures measured at quasilinearconditions (10 V) with and without body wall in place, to be
1552 IEEE TRANSACTIONS ON ULTRASONICS, FERROELECTRICS, AND FREQUENCY CONTROL, VOL. 64, NO. 10, OCTOBER 2017
Fig. 9. Distributions of the (a)–(c) peak positive p+ and peak negative p− pressures and (d)–(f) intensity over beam axis (left frames) and in two perpendicularaxes in the focal plane, x (center) and y (right) at increasing Vdc = 50–200 V. Dashed vertical lines correspond to the location of the focus z = 140.9 mmdefined as a maximum of the peak positive pressure at 50 V.
Fig. 10. Calculated time-to-boil based on the analytic solution for shock-waveheating with cv = 4.2 × 10⁶J/(°C · m3) and β = 3.5 (dashed blue line) andcv = 3.5 × 10⁶ J/(°C · m3) and β = 4.5 (solid red line). The figure indicatesthat boiling can be achieved in 10 ms (maximum pulse duration) for in situshock amplitudes 58–66 MPa.
0.76 dB/cm or 0.068 Np/cm at 1 MHz. These experimentsconfirm previous results that inhomogeneities of the body walldo not prevent shock formation [12] in tissue and demonstratethe capability of the system to generate BH lesions in clinicallyrelevant situations.
IV. DISCUSSION
The transducer and electronics described in this paperdemonstrate a step toward a BH system that can effectivelyperform transcutaneous mechanical tissue ablation. While pre-vious efforts have examined the morphologic and histologiccharacteristics of BH lesions [15], these studies were per-formed without intervening tissue using commercial linear
Fig. 11. Photographs of lesions at a shallow depth of focusing (18 mm) inliver. At outputs level near shock-forming conditions (top, Vdc = 60 V),lesions form occasionally, while at greater source output (bottom,Vdc = 70 V), corresponding to in situ shock amplitude sufficient to induceboiling in 10 ms, large, consistent lesions are observed.
amplifiers. However, few amplifiers of this type are available inthe frequency and power range needed for transcutaneous BH.The design in this paper used a switching amplifier to achievehigh pulsed power levels with minimal cost and weight, witha tradeoff of some harmonic distortion. The results of thepresent paper shows that BH lesions can be produced throughsignificant thicknesses of tissue and inhomogeneous layersfor clinical applications that treat deep-seated tissue structuressuch as liver or kidney tumors.
MAXWELL et al.: PROTOTYPE THERAPY SYSTEM FOR TRANSCUTANEOUS APPLICATION 1553
Fig. 12. Experimental data for proportion of exposures at different drivingvoltages Vdc that resulted in a lesion (n = 9–18 for each voltage level). Thegray area corresponds to the range of voltages at which estimated boiling timeis 10 ms at 18-mm depth in tissue, depending on tissue properties.
A challenge with performing BH lies in achieving thesufficiently high in situ shock amplitudes for the durationrequired to generate boiling within milliseconds. Time-to-boil is proportionate to the cube of shock amplitude andinversely proportionate to the operating frequency of thetransducer. Recent studies have shown that characteristic shockamplitudes at the focus are controlled by the F-number of thetransducer [1]. Lower F-number transducers produce shockswith greater amplitude. For transducers of F-number = 1, theamplitude of the developed shock is about 76 MPa. In theearlier study, with such a transducer operated at 2 MHz,Canney et al. [12] found that boiling in excised liver can bereached in 5 ms at a derated shock amplitude of 70 MPaand corresponding in situ intensity of 20 kW/cm2. As heatingrate corresponds to the rate at which shocks are applied, it istherefore expected that the time-to-boil at 1 MHz would betwice as long for the same shock amplitude. In this paper,at 1 MHz, lesions were repeatedly generated within 10 msat in situ shock amplitude of 65 MPa and focal intensitiesof 17 kW/cm2, in accordance with the anticipated heating.These data provide further evidence that such calculations canprovide a good estimate of necessary outputs to achieve boilingin considering future BH designs.
Characterization of the system was performed using apreviously developed method combining measurements andmodeling [33]. Holography was used to reconstruct the dis-tribution of vibrational velocity at the surface of the trans-ducer [42]. This distribution was used as a boundary conditionto nonlinear modeling. Then simulations were performedto characterize nonlinear ultrasound fields generated by thetransducer at increasing output levels. Modeling results werevalidated with independent focal measurements of pressurewaveforms. While measurements were possible up to 9% ofthe highest system power because of cavitation, simulationsprovided characterization data within the whole operationalpower range. The holography data also serves to visualize thevibrational pattern of the transducer to ensure the quality ofits fabrication.
With the introduction of larger attenuating tissue pathsthe necessary transducer surface pressure (and power output)
Fig. 13. (a) Example lesions generated in liver through different thicknessesof tissue between 18 and 70 mm. Lesions contain a similar appearanceof mechanical liquefaction of the tissue without thermal necrosis. (b) Datashowing occurrence of boiling in tissue for different transducer drivingvoltages and depths. The gray-shaded area encompasses the range betweenlower and upper bounds for the predicted derating curves based on time-to-boil calculations. Boiling is expected to occur when Vdc is greater or equalto a threshold estimated in the gray region.
increases substantially while the focal pressure requirementsremain the same. For instance, the pulse-average acousticpower needed to repeatedly create a lesion at 18-mm depthwas 525 W, while the acoustic power needed at 70-mmdepth was 1.86 kW. Lesion generation through 4-cm porcinebody wall required 2.48 kW. Clinical HIFU systems havebeen primarily focused on thermal ablation, which requiresgreater time-averaged power but lower peak power than that inhistotripsy. At the present, no clinically available systems canoutput such power levels for sustained pulses, and thereforethe amplifier here offers a method to investigate generation oflesions by BH ex vivo and in vivo. The amplifier, the basisfor which was proposed by Umemura [53] and modified byHall and Cain [31], forms the foundation of a system togenerate high peak power output. The additional capacitiveenergy storage was engineered to allow longer pulse durationsconsistent with the range needed for BH. The transducer’s keyfeatures were the appropriate F-number and focal gain toachieve specific shock amplitudes, and the design that ismechanically robust, using a matching layer and lens con-
1554 IEEE TRANSACTIONS ON ULTRASONICS, FERROELECTRICS, AND FREQUENCY CONTROL, VOL. 64, NO. 10, OCTOBER 2017
Fig. 14. (a) Dependence of the peak focal pressures measured in water byFOPH in the absence (solid curve) and presence (dashed–dotted curve) of theporcine body wall of 4-cm thickness, placed 1.5 cm in front of the focusversus input voltage. (b) Focal waveforms corresponding to the thresholdof BH lesion formation in porcine liver without the body wall in place(Vdc = 80 V) and with body wall (Vdc = 150 V). (c) (Top) Photographof the body wall and (bottom) BH lesions formed in porcine liver through thebody wall at 150 V.
figuration. The consistency of the transducer output overits lifetime of nearly three years indicates that the trans-ducers can also be made to perform reliably. Given theseresults, the present system is an acceptable prototype forresearch. However, the lack of in-line image guidance andcoupling capabilities preclude it as a clinically viable instru-ment. Future efforts will focus on translating these results intoa system for preclinical and clinical trials.
We hypothesized that shock development progresses in aqualitatively similar manner through tissue compared with
water, such that the same shocked waveform can be generatedin both situations by adjusting the output of the ultrasoundsource using a previously developed derating approach tocompensate for losses while propagating through tissue [48].The peak focal pressure follows a similar curve versus surfacepressure, but the curve is extended such that a given valueof peak focal pressure occurs at a higher surface pressure.The data collected by generating lesions in liver at differentdepths, as well as hydrophone measurements through bodywall layers support such a relationship. Modeling with theWestervelt equation indicated a trend in the presence of tissuewith αe = 0.7–0.9 dB/cm/MHz. This range of values is basedon previous experiences measuring highly focused waveformsthrough liver samples, although does not reflect the true plane-wave attenuation in the sample as the actual path lengths of thebeam to the focus vary with focusing angle. While the predic-tive value of such a method may provide an initial estimate ofthe necessary transducer output needed for a given treatment, itwill be practically difficult to predict a priori what the effectiveattenuation will be through a complex tissue path such asthe body wall in vivo. With multiple layers, aberration wouldintroduce an additional derating factor. However, these lossescan be compensated by further increase of the output power,as shown with the body wall example, provided the losses arenot too great. In addition, as shock amplitude changes slowlywith transducer output after a developed shock is formed,operating at higher outputs levels can be beneficial for reliablelesion generation. Nonetheless, based on the modeling andmeasurements recorded in this study, one could reasonablyexpect to test transducer output and proceed stepwise toreach a threshold using ultrasound image feedback to reachboiling.
V. CONCLUSION
BH has been previously performed in samples withoutintervening tissue. Here we demonstrated a system, includinga high-power pulsed amplifier and 1-MHz therapy transducerfor BH that can generate lesions through significant depthsof tissue including propagation through the body wall. in situpressure levels at which boiling and lesions were detected inliver samples agreed well with predicted time-to-boil basedon characterization of the shock wave field generated by thesystem and tissue heating. Generation of lesions at differenttissue depths required increased power levels that could befit to a derating scheme for highly focused HIFU beams.With 7-cm focal depth in liver tissue, BH lesions could begenerated at 11% of the maximum acoustic power output ofthe transducer. Propagation through inhomogeneous porcinebody wall required operating at 14% of the system powercapabilities and did not prevent formation of shock frontsand generation of BH lesions. These results demonstrate thesystem’s capability to perform BH through clinically relevanttissue paths.
ACKNOWLEDGMENT
The authors would like to thank their colleagues at UW inUrology, the Center for Industrial and Medical Ultrasound, andGastroenterology for their help. Simulations were performed
MAXWELL et al.: PROTOTYPE THERAPY SYSTEM FOR TRANSCUTANEOUS APPLICATION 1555
on the “Lomonosov” cluster of the Moscow State Univer-sity supercomputer center. Disclosure: Dr. A. Maxwell andDr. M. Bailey have financial interests with SonoMotion, Inc.
REFERENCES
[1] P. B. Rosnitskiy, P. V. Yuldashev, and V. A. Khokhlova, “Effect of theangular aperture of medical ultrasound transducers on the parametersof nonlinear ultrasound field with shocks at the focus,” Acoust. Phys.,vol. 61, no. 3, pp. 301–307, May 2015.
[2] J. E. Kennedy et al., “High-intensity focused ultrasound for the treat-ment of liver tumours,” Ultrasonics, vol. 42, nos. 1–9, pp. 931–935,Apr. 2004.
[3] F. Wu et al., “Extracorporeal high intensity focused ultrasound ablationin the treatment of patients with large hepatocellular carcinoma,” Ann.Surg. Oncol., vol. 11, pp. 1061–1069, Dec. 2004.
[4] C. Chaussy and S. Thüroff, “High-intensity focused ultrasound in themanagement of prostate cancer,” Expert Rev. Med. Devices, vol. 7, no. 2,pp. 209–217, 2010.
[5] Y.-H. Hsiao, S.-J. Kuo, H.-D. Tsai, M.-C. Chou, and G.-P. Yeh, “Clinicalapplication of high-intensity focused ultrasound in cancer therapy,”J. Cancer, vol. 7, no. 3, pp. 225–231, 2016.
[6] Y. Zhou, S. G. Kargl, and J. H. Hwang, “The effect of the scan-ning pathway in high-intensity focused ultrasound therapy on lesionproduction,” Ultrasound Med. Biol., vol. 37, no. 9, pp. 1457–1468,Sep. 2011.
[7] S. E. Jung, S. H. Cho, J. H. Jang, and J.-Y. Han, “High-intensity focusedultrasound ablation in hepatic and pancreatic cancer: Complications,”Abdominal Imag., vol. 36, no. 2, pp. 185–195, Apr. 2011.
[8] B. Quesson et al., “Real-time volumetric MRI thermometry offocused ultrasound ablation in vivo: A feasibility study in pigliver and kidney,” NMR Biomed., vol. 24, no. 2, pp. 145–153,Feb. 2011.
[9] S. Dasgupta, R. K. Banerjee, P. Hariharan, and M. R. Myers, “Beamlocalization in HIFU temperature measurements using thermocouples,with application to cooling by large blood vessels,” Ultrasonics, vol. 51,no. 2, pp. 171–180, Feb. 2011.
[10] P. Hariharan, M. R. Myers, and R. K. Banerjee, “HIFU procedures atmoderate intensities—Effect of large blood vessels,” Phys. Med. Biol.,vol. 52, no. 12, pp. 3493–3513, 2007.
[11] K. Kieran et al., “Refining histotripsy: Defining the parameter space forthe creation of nonthermal lesions with high intensity, pulsed focusedultrasound of the in vitro kidney,” J. Urol., vol. 178, no. 2, pp. 672–676,Aug. 2007.
[12] M. S. Canney, V. A. Khokhlova, O. V. Bessonova, M. R. Bailey, andL. A. Crum, “Shock-induced heating and millisecond boiling in gels andtissue due to high intensity focused ultrasound,” Ultrasound Med. Biol.,vol. 36, no. 2, pp. 250–267, Feb. 2010.
[13] M. Hoogenboom, D. Eikelenboom, M. H. den Brok, A. Heerschap,J. J. Fütterer, and G. J. Adema, “Mechanical high-intensity focusedultrasound destruction of soft tissue: Working mechanisms and phys-iologic effects,” Ultrasound Med. Biol., vol. 41, no. 6, pp. 1500–1517,Jun. 2015.
[14] V. A. Khokhlova et al., “Histotripsy methods in mechanical disinte-gration of tissue: Towards clinical applications,” Int. J. Hyperthermia,vol. 31, no. 2, pp. 145–162, Feb. 2015.
[15] Y.-N. Wang, T. Khokhlova, M. Bailey, J. H. Hwang, and V. Khokhlova,“Histological and biochemical analysis of mechanical and thermalbioeffects in boiling histotripsy lesions induced by high intensity focusedultrasound,” Ultrasound Med. Biol., vol. 39, no. 3, pp. 424–438,Mar. 2013.
[16] F. Winterroth et al., “Examining and analyzing subcellular morphologyof renal tissue treated by histotripsy,” Ultrasound Med. Biol., vol. 37,no. 1, pp. 78–86, Jan. 2011.
[17] Z. Xu, Z. Fan, T. L. Hall, F. Winterroth, J. B. Fowlkes, andC. A. Cain, “Size measurement of tissue debris particles generated frompulsed ultrasound cavitational therapy—Histotripsy,” Ultrasound Med.Biol., vol. 35, no. 2, pp. 245–255, Feb. 2009.
[18] G. R. Schade, N. R. Styn, T. L. Hall, and W. W. Roberts, “Endo-scopic assessment and prediction of prostate urethral disintegration afterhistotripsy treatment in a canine model,” J. Endourol., vol. 26, no. 2,pp. 183–189, Feb. 2012.
[19] W. W. Roberts, T. L. Hall, K. Ives, J. J. S. Wolf, Jr., J. B. Fowlkes, andC. A. Cain, “Pulsed cavitational ultrasound: A noninvasive technologyfor controlled tissue ablation (histotripsy) in the rabbit kidney,” J. Urol.,vol. 175, no. 2, pp. 734–738, Feb. 2006.
[20] T. D. Khokhlova, M. S. Canney, V. A. Khokhlova, O. A. Sapozhnikov,L. A. Crum, and M. R. Bailey, “Controlled tissue emulsificationproduced by high intensity focused ultrasound shock waves and mil-lisecond boiling,” J. Acoust. Soc. Amer., vol. 130, pp. 3498–3510,May 2011.
[21] A. D. Maxwell, R. S. Hsi, M. R. Bailey, P. Casale, and T. S. Lendvay,“Noninvasive ureterocele puncture using pulsed focused ultrasound:An in vitro study,” J. Endourol., vol. 28, no. 3, pp. 342–346,Feb. 2014.
[22] E. Vlaisavljevich, Y. Kim, G. Owens, W. Roberts, C. Cain, and Z. Xu,“Effects of tissue mechanical properties on susceptibility to histotripsy-induced tissue damage,” Phys. Med. Biol., vol. 59, no. 2, pp. 253–270,2014.
[23] T. L. Hall, K. Kieran, K. Ives, J. B. Fowlkes, C. A. Cain, andW. W. Roberts, “Histotripsy of rabbit renal tissue in vivo: Tempo-ral histologic trends,” J. Endourol., vol. 21, no. 10, pp. 1159–1166,2007.
[24] T. D. Khokhlova et al., “Ultrasound-guided tissue fractionation by highintensity focused ultrasound in an in vivo porcine liver model,” Proc.Nat. Acad. Sci. USA, vol. 111, no. 2, pp. 8161–8166, Jun. 2014.
[25] Z. Xu et al., “Controlled ultrasound tissue erosion,” IEEE Trans.Ultrason., Ferroelect., Freq. Control, vol. 51, no. 6, pp. 726–736,Jun. 2004.
[26] A. D. Maxwell, C. A. Cain, A. P. Duryea, L. Yuan, H. S. Gurm,and Z. Xu, “Noninvasive thrombolysis using pulsed ultrasound cavi-tation therapy—Histotripsy,” Ultrasound Med. Biol., vol. 35, no. 12,pp. 1982–1994, Dec. 2009.
[27] J. E. Parsons, C. A. Cain, G. D. Abrams, and J. B. Fowlkes, “Pulsedcavitational ultrasound therapy for controlled tissue homogenization,”Ultrasound Med. Biol., vol. 32, no. 1, pp. 115–129, Jan. 2006.
[28] A. D. Maxwell et al., “Cavitation clouds created by shock scatteringfrom bubbles during histotripsy,” J. Acoust. Soc. Amer., vol. 130,pp. 1888–1989, Jul. 2011.
[29] Z. Xu, J. B. Fowlkes, E. D. Rothman, A. M. Levin, and C. A. Cain,“Controlled ultrasound tissue erosion: The role of dynamic interactionbetween insonation and microbubble activity,” J. Acoust. Soc. Amer.,vol. 117, no. 1, pp. 424–435, 2005.
[30] J. C. Simon, O. A. Sapozhnikov, V. A. Khokhlova, Y.-N. Wang,L. A. Crum, and M. R. Bailey, “Ultrasonic atomization of tissue andits role in tissue fractionation by high intensity focused ultrasound,”Phys. Med. Biol., vol. 57, no. 23, pp. 8061–8078, 2012.
[31] T. Hall and C. Cain, “A low cost compact 512 channel therapeuticultrasound system for transcutaneous ultrasound surgery,” in Proc. AIPConf., May 2006, vol. 829. pp. 445–449.
[32] Y. Kim, A. D. Maxwell, T. L. Hall, Z. Xu, K.-W. Lin, and C. A. Cain,“Rapid prototyping fabrication of focused ultrasound transducers,”IEEE Trans. Ultrason., Ferroelect., Freq. Control, vol. 61, no. 9,pp. 1559–1574, Sep. 2014.
[33] W. Kreider et al., “Characterization of a multi-element clinical HIFUsystem using acoustic holography and nonlinear modeling,” IEEE Trans.Ultrason., Ferroelect., Freq. Control, vol. 60, no. 8, pp. 1683–1698,Aug. 2013.
[34] O. A. Sapozhnikov, Y. A. Pishchal’nikov, and A. V. Morozov,“Reconstruction of the normal velocity distribution on the surfaceof an ultrasonic transducer from the acoustic pressure measured ona reference surface,” Acoust. Phys., vol. 49, no. 3, pp. 354–360,May 2003.
[35] P. V. Yuldashev and V. A. Khokhlova, “Simulation of three-dimensionalnonlinear fields of ultrasound therapeutic arrays,” Acoust. Phys., vol. 57,no. 3, pp. 334–343, May 2011.
[36] M. F. Hamilton and D. T. Blackstock, Nonlinear Acoustics. San Diego,CA, USA: Academic, 1998.
[37] A. D. Maxwell, “Noninvasive thrombolysis using histotripsy pulsedultrasound cavitation therapy,” Ph.D. dissertation, Dept. Biomed. Eng.,Univ. Michigan, Ann Arbor, MI, USA, 2012.
[38] J. Staudenraus and W. Eisenmenger, “Fibre-optic probe hydrophone forultrasonic and shock-wave measurements in water,” Ultrasonics, vol. 31,no. 4, pp. 267–273, Jul. 1993.
[39] M. S. Canney, M. R. Bailey, L. A. Crum, V. A. Khokhlova, andO. A. Sapozhnikov, “Acoustic characterization of high intensityfocused ultrasound fields: A combined measurement and model-ing approach,” J. Acoust. Soc. Amer., vol. 124, pp. 2406–2420,Jun. 2008.
[40] P. V. Yuldashev, S. M. Shmeleva, S. A. Ilyin, O. A. Sapozhnikov,L. R. Gavrilov, and V. A. Khokhlova, “The role of acoustic non-linearity in tissue heating behind a rib cage using a high-intensityfocused ultrasound phased array,” Phys. Med. Biol., vol. 58, no. 8,pp. 2537–2559, 2013.
1556 IEEE TRANSACTIONS ON ULTRASONICS, FERROELECTRICS, AND FREQUENCY CONTROL, VOL. 64, NO. 10, OCTOBER 2017
[41] O. A. Sapozhnikov, A. E. Ponomarev, and M. A. Smagin, “Transientacoustic holography for reconstructing the particle velocity of the surfaceof an acoustic transducer,” Acoust. Phys., vol. 52, no. 3, pp. 324–330,May 2006.
[42] O. A. Sapozhnikov, S. A. Tsysar, V. A. Khokhlova, and W. Kreider,“Acoustic holography as a metrological tool for characterizing medicalultrasound sources and fields,” J. Acoust. Soc. Amer., vol. 138, no. 3,pp. 1515–1532, 2015.
[43] J. Tavakkoli, D. Cathignol, R. Souchon, and O. A. Sapozhnikov, “Mod-eling of pulsed finite-amplitude focused sound beams in time domain,”J. Acoust. Soc. Amer., vol. 104, no. 4, pp. 2061–2072, 1998.
[44] R. J. Zemp, J. Tavakkoli, and R. S. C. Cobbold, “Modeling of nonlinearultrasound propagation in tissue from array transducers,” J. Acoust. Soc.Amer., vol. 113, no. 1, pp. 139–152, 2003.
[45] T. Varslot and G. Taraldsen, “Computer simulation of forwardwave propagation in soft tissue,” IEEE Trans. Ultrason., Ferroelect.,Freq. Control, vol. 52, no. 9, pp. 1473–1482, Sep. 2005.
[46] S. Kashcheeva, O. Sapozhnikov, V. Khokhlova, M. Averkiou, andL. Crum, “Nonlinear distortion and attenuation of intense acoustic wavesin lossy media obeying a frequency power law,” Acoust. Phys., vol. 46,pp. 170–177, Mar. 2000.
[47] A. Kurganov and E. Tadmor, “New high-resolution central schemesfor nonlinear conservation laws and convection–diffusion equations,”J. Comput. Phys., vol. 160, no. 1, pp. 241–282, May 2000.
[48] O. V. Bessonova, V. A. Khokhlova, M. S. Canney, M. R. Bailey,and L. A. Crum, “A derating method for therapeutic applicationsof high intensity focused ultrasound,” Acoust. Phys., vol. 56, no. 3,pp. 354–363, May 2010.
[49] V. A. Khokhlova, M. R. Bailey, J. A. Reed, B. W. Cunitz,P. J. Kaczkowski, and L. A. Crum, “Effects of nonlinear propagation,cavitation, and boiling in lesion formation by high intensity focusedultrasound in a gel phantom,” J. Acoust. Soc. Amer., vol. 119, no. 3,pp. 1834–1848, 2006.
[50] W. P. Mason, “Aging of the properties of barium titanate and relatedferroelectric ceramics,” J. Acoust. Soc. Amer., vol. 27, no. 1, pp. 73–85,1955.
[51] O. V. Bessonova, V. A. Khokhlova, M. R. Bailey, M. S. Canney, andL. A. Crum, “Focusing of high power ultrasound beams and limitingvalues of shock wave parameters,” Acoust. Phys., vol. 55, nos. 4–5,pp. 463–473, 2009.
[52] F. A. Duck, Physical Properties of Tissue: A Comprehensive ReferenceBook. San Francisco, CA, USA: Academic, 1990.
[53] S. Umemura and C. A. Cain, “Acoustical evaluation of a prototypesector-vortex phased-array applicator,” IEEE Trans. Ultrason., Ferro-elect., Freq. Control, vol. 39, no. 1, pp. 32–38, Jan. 1992.
Adam D. Maxwell (S’08–M’10) received the B.S.degree in electrical engineering from the Univer-sity of Washington, Seattle, WA, USA, the M.S.degree in electrical engineering and the Ph.D. degreein biomedical engineering from the University ofMichigan, Ann Arbor, MI, USA, in 2007 and 2012,respectively.
From 2012 to 2014, he was a Post-DoctoralFellow with the Department of Urology, Universityof Washington, where he is currently a ResearchAssistant Professor. His research interests include
development of image-guided ultrasound therapies including focused ultra-sound for mechanical tissue ablation (histotripsy) and lithotripsy.
Petr V. Yuldashev received the M.S. degree inphysics and the Ph.D. degree in acoustics fromMoscow State University (MSU), Moscow, Russia,in 2008 and 2011, respectively, and the Ph.D. degreein acoustics from the École Centrale de Lyon (ECL),Ecully, France.
He was with MSU, where he is currently aSenior Research Fellow with the Department ofGeneral Physics and Condensed Matter Physics ofthe Physics Faculty. He is also with the Departmentof Fluid Mechanics, Acoustics, and Energetics, ECL,
where he was involved in the propagation of shock waves in a turbulentatmosphere and the utilization of nonlinear acoustics effects to calibrate high-frequency broadband microphones. His research interests include nonlinearacoustics, shock wave focusing, nonlinear wave propagation in inhomoge-neous media, sonic booms, nonlinear modeling, and shadowgraphy measure-ment methods for acoustic phenomena.
Wayne Kreider received the B.S. and M.S. degreesin engineering mechanics from Virginia Tech,Blacksburg, VA, USA, in 1993 and 1995, respec-tively, and the Ph.D. degree in bioengineering fromthe University of Washington, Seattle, WA, USA,in 2008.
He was an Engineer with the Naval SurfaceWarfare Center, Dahlgren, VA, USA, from 1996 to1997. He was with Dominion Engineering Inc.,Reston, VA, USA, from 1997 to 2001. In 2000, hejoined the Commonwealth of Virginia, Richmond,
VA, USA, as a Professional Engineer. He was focused on the developmentand qualification of ultrasonic cleaning technologies for steam generators andfuel in nuclear power plants. Since 2001, he has been with the AppliedPhysics Laboratory, Center for Industrial and Medical Ultrasound, Universityof Washington, Seattle, WA, USA, where he has been a Research Associateand a Senior Engineer since 2012. His research interests include acousticcavitation, transport processes in oscillating bubbles, therapeutic ultrasound,and ultrasound metrology.
Dr. Kreider has been a member of the Acoustical Society of America.He serves as a Technical Representative of the Committee on Standardssince 2013. Related to the characterization of intense ultrasound fields, hehas been a U.S. delegate with the International Electrotechnical Commission,as a member of Technical Committee 87, Working Group 6 since 2015.
Tatiana D. Khokhlova received the Ph.D. degreein physics from Moscow State University (MSU),Moscow, Russia, in 2008.
She was with the Applied Physics Laboratory,the University of Washington (UW), Seattle, WA,USA, for postdoctoral training, and then completeda Research Fellowship with the Department ofMedicine, UW, where she is currently a ResearchAssistant Professor. Her research interests includephysical acoustics, therapeutic ultrasound, and pho-toacoustic imaging.
George R. Schade received the bachelor’s and M.D. degrees from theUniversity of Chicago, Chicago, IL, USA.
He then completed his Urology residency with the University of Michigan,where he developed an interest in therapeutic ultrasound. He was with theUniversity of Washington (UW), Seattle, VA, USA, where he completedthe Society of Urologic Oncology fellowship. He joined the faculty, as anAssistant Professor with the Department of Urology, UW. He is a practicingUrologic Oncologist who aims to develop diagnostic and therapeutic ultra-sound to improve the care of patients with Urologic cancers.
MAXWELL et al.: PROTOTYPE THERAPY SYSTEM FOR TRANSCUTANEOUS APPLICATION 1557
Timothy L. Hall received the Ph.D. degree fromthe University of Michigan, Ann Arbor, MI, USA,in 2007.
He is one of the original developers of histotripsyultrasound therapy. His research interests includeinstrumentation for acoustics and lithotripsy andfurthering medical applications for histotripsy.
Oleg A. Sapozhnikov received the M.S. degree inphysics, in 1985 and the Ph.D. and D.Sc. degreesin acoustics from Moscow State University (MSU),Moscow, Russia, in 1988 and 2008, respectively.
After graduation from the Ph.D. program, he wasappointed by MSU and currently is a Professor inthe Department of Acoustics of the Physics Faculty.Since 1996, he has also been affiliated with theApplied Physics Laboratory, Center for Industrialand Medical Ultrasound, University of Washington,Seattle, WA, USA. His research interests are in the
fields of physical acoustics, nonlinear wave phenomena, medical ultrasoundincluding shock wave lithotripsy, HIFU, and ultrasound-based imaging.
Dr. Sapozhnikov has been a member of the International Society for Ther-apeutic Ultrasound, since 2001; a Member of the Board of the InternationalCongress on Ultrasonics since 2008; the Head of the “Physical Ultrasound”division of the Scientific Council on Acoustics of the Russian Academy ofSciences since 2009; and a Fellow since 2009, and an Associate Editor of TheJournal of the Acoustical Society of America, since 2007. He was a recipientof the M.V. Lomonosov Prize in Physics, in 1991, a Prize of the EuropeanAcademy for Young Russian Scientists, in 1994, and an Early Career Awardof the International Commission for Acoustics, in 2004.
Michael R. Bailey received the B.S. degree inmechanical engineering from Yale, New Haven, CT,USA, in 1991, and the M.S. and Ph.D. degreesin mechanical engineering from the Universityof Texas, Austin, TX, USA, in 1994 and 1997,respectively.
He is currently a Senior Principal Engineer withthe Applied Research Laboratory, an Associate Pro-fessor of Mechanical Engineering, and AdjunctAssociate Professor of Urology with the Universityof Washington, Seattle, VA, USA. His research inter-
ests include cavitation, shock wave lithotripsy, HIFU, and ultrasound imaging;currently his energy is focused on developing ultrasound-based technology toreposition kidney stones.
Dr. Bailey has been a Fellow of the Acoustical Society of America (ASA),since 2007 and currently serves on the ASA Executive Council. He servedon the Board of the International Society for Therapeutic Ultrasound (ISTU)from 2009 to 2012, the Bioeffects Committee of the American Institute forUltrasound in Medicine from 2006 to 2012, and the Biomedical AcousticsTechnical Committee of the ASA from 2005 to 2008. He received EarlyCareer Awards from ASA in 2004 and ISTU in 2008.
Vera A. Khokhlova received the M.S. degree inphysics, in 1986, and the Ph.D. and D.Sc. degreesin acoustics from Moscow State University (MSU),Moscow, Russia, in 1991 and 2012, respectively.
After graduation from the Ph.D. program, she wasappointed by MSU, where she is currently an Asso-ciate Professor with the Department of Acoustics ofthe Physics Faculty. Since 1995, she has been withthe Center for Industrial and Medical Ultrasoundof the Applied Physics Laboratory, University ofWashington, Seattle, WA, USA. Her research inter-
ests include the field of nonlinear acoustics, therapeutic ultrasound includingmetrology and bioeffects of HIFU fields, shock wave focusing, nonlinear wavepropagation in inhomogeneous media, and nonlinear modeling.
Dr. Khokhlova has been a Fellow since 2008, and served as a Member ofthe Executive Council of the Acoustical Society of America from 2012 to2015; a Member of the Board of the International Society for TherapeuticUltrasound from 2004 to 2008 and from 2011 to 2014; a Member of the“Physical Ultrasound” division of the Scientific Council on Acoustics of theRussian Academy of Sciences since 2009, and an Associate Editor of the IEEETRANSACTIONS ON ULTRASONICS, FERROELECTRICS AND FREQUENCY
CONTROL since 2013.


![IEEE TRANSACTIONS ON ULTRASONICS, FERROELECTRICS, AND … · 2020. 6. 23. · with the Shannon–Nyquist theorem [9]. Four times sampling, however, can lead to substantial amounts](https://static.fdocuments.us/doc/165x107/610a4f91319f09736547d7bd/ieee-transactions-on-ultrasonics-ferroelectrics-and-2020-6-23-with-the-shannonanyquist.jpg)