#15.24 WISCONSIN MOUND SOIL ABSORPTION SYSTEMsoils.wisc.edu/sswmp/SSWMP_15.24.pdf · WISCONSIN...
32
1 James C. Converse, Professor, Biological Systems Engineering and E.Jerry Tyler, Professor, Soil Science Department, University of Wisconsin-Madison. Member and Director, respectively, of Small Scale Waste Management Project. Research supported by the College of Agricultural and Life Sciences. 2 This is an updated version of the 1990 mound manual with the same name. It should be used in place of earlier versions. Note: Names of products and equipment mentioned in this publication are for illustrative purposes and do not constitute and endorsement, explicitly or implicitly. #15.24 WISCONSIN MOUND SOIL ABSORPTION SYSTEM: SITING, DESIGN AND CONSTRUCTION MANUAL BY James C. Converse and E.Jerry Tyler 1 January , 2000 2 The Wisconsin mound wastewater soil treatment system was developed in the 1970s to overcome some limitations of in-ground trench and bed units and the Nodak system (Witz, 1974). The objective of the mound, as with other soil-based units, is to treat and disperse domestic and commercial wastewater on-site via subsurface in an environmentally acceptable manner and to protect the public health. The Wisconsin mound has been widely accepted and incorporated in many state and local regulations. In 1980 it was incorporated into the Wisconsin Administrative code. Mound technology was successfully implemented in Wisconsin partially because of an extensive educational program offered during the introduction of the mound concept. For the mounds to continue as a viable “tool” in treating and dispersing on-site wastewater, the soil evaluator, designer, installer, regulator and manager must understand the principles of operation, design, installation and management of the system. Mounds in some areas have not been as successful as in Wisconsin, primarily because of the lack of trained professionals and/or unproven design modifications. Education of all parties involved is essential and care must be taken when making modifications. Figure 1 shows the components of a Wisconsin mound system. It consists of a septic tank, a dosing chamber and the mound. The septic tank removes solids by settling and floatation with some of the solids transformed into soluble material which pass to the dosing chamber. The
Transcript of #15.24 WISCONSIN MOUND SOIL ABSORPTION SYSTEMsoils.wisc.edu/sswmp/SSWMP_15.24.pdf · WISCONSIN...

1 James C. Converse, Professor, Biological Systems Engineering and E.Jerry Tyler, Professor,Soil Science Department, University of Wisconsin-Madison. Member and Director, respectively, ofSmall Scale Waste Management Project. Research supported by the College of Agricultural and LifeSciences.
2 This is an updated version of the 1990 mound manual with the same name. It should be used inplace of earlier versions.
Note: Names of products and equipment mentioned in this publication are for illustrative purposes anddo not constitute and endorsement, explicitly or implicitly.
#15.24WISCONSIN MOUND SOIL ABSORPTION SYSTEM:
SITING, DESIGN AND CONSTRUCTION MANUAL
BY
James C. Converse and E.Jerry Tyler1
January , 20002
The Wisconsin mound wastewater soil treatment system was developed in the 1970s toovercome some limitations of in-ground trench and bed units and the Nodak system (Witz,1974). The objective of the mound, as with other soil-based units, is to treat and dispersedomestic and commercial wastewater on-site via subsurface in an environmentally acceptablemanner and to protect the public health. The Wisconsin mound has been widely accepted and incorporated in many state and localregulations. In 1980 it was incorporated into the Wisconsin Administrative code. Moundtechnology was successfully implemented in Wisconsin partially because of an extensiveeducational program offered during the introduction of the mound concept. For the mounds tocontinue as a viable “tool” in treating and dispersing on-site wastewater, the soil evaluator,designer, installer, regulator and manager must understand the principles of operation, design,installation and management of the system.
Mounds in some areas have not been as successful as in Wisconsin, primarily because of the lackof trained professionals and/or unproven design modifications. Education of all parties involvedis essential and care must be taken when making modifications. Figure 1 shows the components of a Wisconsin mound system. It consists of a septic tank, adosing chamber and the mound. The septic tank removes solids by settling and floatation withsome of the solids transformed into soluble material which pass to the dosing chamber. The

2
Fig. 1. Schematic of the Wisconsin mound system showing septic tank, dosing and mound.
dosing chamber contains a pump or siphon, which transfers effluent, under pressure, to a distribution network of small diameter pipes with small perforations which distributes theeffluent uniformly over the absorption area of the mound. The effluent infiltrates into andpercolates through the mound sand and native soil, the pathogens are removed, the organicmatter is assimilated, nitrogen is transformed to nitrate and phosphorus is retained in the nativesoil and may slowly migrate depending on the soil properties..
Originally, the Wisconsin mound was designed for specific soil and site limitations forwastewater flows of less than 750 gpd (Converse et al., 1975 a, b, c; Converse, 1978). Based onfurther research and evaluation, the mound technology was expanded to larger systems and moredifficult soil and site conditions (Converse and Tyler, 1986a and b; Tyler and Converse, 1985;and Converse and Tyler, 1987). The new criteria were incorporated into a siting, design andconstruction manual (Converse and Tyler, 1990). Many changes have taken place in on-sitetechnology recently especially in sand filter technology. Since the mound is a combination of asingle pass sand filter and dispersal unit, many of the sand filter research findings should beimplemented into mound technology. Thus, the purpose of this publication is to incorporatenew findings into the siting, design and construction of mounds receiving septic tankeffluent.
3
WASTEWATER SOURCE
The wastewater quality and quantity is extremely important to ascertain before designing a soilbased on-site wastewater treatment system. The design and performance of the mound system,as well as other soil based treatment systems, is based on typical domestic waste water which hasbeen pretreated by passing the waste water through a septic tank. Typical domestic effluent willhave a biochemical oxygen demand (BOD) in the range of 150 - 250 mg/L and total suspendedsolids (TSS) in range of 50 - 100 mg/L. Fats oils and greases (FOG) are typically below 15mg/L. These numbers will vary somewhat depending on household activity, water conservationactivities and the biological activity in the septic tank.
The mound is suitable for final treatment and dispersal of highly pretreated effluent from suchunits as aerobic units, sand filters, peat filters and biofilters which typically produce effluent withBOD and TSS less than 25 mg/L. For this quality of waste water, the sand loading rate can beincreased over that used for septic tank effluent and the separation distance can be reduceddepending on code requirements. Current thinking is to double the loading rate and reduce theseparation distance by 12" (Wisc. Adm. Code, 2000).
High strength wastewastes, such as from restaurants, must either 1) be pretreated to similar BOD,TSS and FOG strengths of septic tank effluent from domestic wastewater before it is applied tothe mound or 2) the loading rate to the sand must be reduced significantly so that the organicloading rate to the mound is at or less than that from domestic wastewaster. Extreme care mustbe exercised when working with non- domestic wastewater.
The design loading rates are based on 150 gpd/bedroom resulting in 450 gpd for a 3 bedroomhome. If the mound, as well as other soil based units, is loaded at 450 gpd on a regular basis, itwill likely fail. The daily average flow is expected to be no more than about 60% of design or270 gpd. If water meter readings are used in the design process, the design flow rate must beadjusted upward by at least the same percentage or typically 1.5 - 2 times the meter reading.
The focus of this publication is on domestic septic tank effluent. Adjustments can be made to thedesign for the highly pretreated effluent and high strength wastes as previously stated.
PRETREATMENT
The septic tank serves as a pretreatment unit for all soil absorption units, including the mound,and its primary function is to remove solids via settling and floatation. New technologies can beincorporated into the septic tank with the most common being effluent filters and pump vaults. Converse (1999) provides information relative to effluent filters and other components related toseptic tanks. The dosing chamber/vault is also an essential component to the mound system. Itprovides a home for the pump and controls, stores effluent and can provide extra storage duringdown time. With new technology, pump vaults can be incorporated within a septic tank, thus

4
eliminating a tank. The following are several options available for consideration (Converse,1999):
1. A single compartment septic tank with an effluent filter followed by a singlecompartment pump chamber.
2. A double compartment tank with the first compartment containing an effluent filterserving as the septic tank and the second compartment serving as the pump chamber.
3. A double compartment tank with both compartments serving as a septic tank with aneffluent filter at the outlet of second compartment, followed by single compartmentpump chamber. This may be the desired alternative as a modified aerobic unit, such as aNibbler Jr. (NCS, 1998) or similar product, could be placed in the second compartmentto reduce the organic load to the mound if the mound should ever develop a cloggingmat, pond and breakout. The conversion would cause minimal disturbance as a tank isalready available. Converse et al., (1998) discuss renovation of clogged soil absorptionunits utilizing aeration.
4. A single compartment tank with a pump vault within the septic tank. The effluent filteris incorporated into the pump vault that suspends from the outlet of the septic tank. Analternative is a double compartment septic tank with a hole in the center of the middlewall to connect the two compartments together in the clear zone and the pump vault inthe second compartment. This unit will not provide extra storage capacity as will theindividual tank.
Recent research on single pass sand filters shows that short frequent doses to the sand filterwith closely spaced orifices (4 - 6 ft2/orifice) improves effluent quality (Darby et al., 1996). Short frequent doses requires time dosing instead of demand dosing. Most mounds aredemand dosed with larger areas/orifice of 15 to 20 ft2/orifice. This results in a large quantity ofeffluent discharged at once and applied less uniformly on the infiltrative surface than for sandfilters. This large quantity of effluent moves through the sand rapidly (assuming no pondedcondition), allowing insufficient time for the biota to cleanse the effluent totally. This forcesfecal coliforms and pathogens further into the soil profile. Short frequent doses and moreclosely spaced orifices allows the effluent to be retained in the sand/soil for longer periods. Converse et al. (1994) suggested that the reason for some fecal coliforms found deep in the soilprofile beneath mounds was due to large infrequent doses. Designers should use smaller dosesand more closely spaced orifices. They should consider time dosing in distributing theeffluent to the mound. Timed dosing requires that surge capacity be incorporated into the septictank and/or pump chamber to store the peak flows until it is dosed into the mound and requirescontrol panels which have become very user friendly. Converse (1999) discusses the variousoptions including pump vaults, effluent filters and time/demand dosing. Pressure distributionand dose volumes are discussed in detail by Converse (2000).
5
SITING CRITERIA
A designer of on-site wastewater treatment and dispersal systems must have a basicunderstanding of wastewater movement into and through the soil. The designer should workclosely with the site evaluator to make sure he/she understand how effluent will move into thesoil and away from the system. This understanding is based on information collected during thesite evaluation.
Figure 2 shows a schematic of effluent movement within and away from mound systems undervarious soil profiles. Depending on the type of profile, the effluent moves away from the unitvertically, horizontally or a combination of both. These concepts are true for all on-site systems.
The siting and design concepts presented here and elsewhere results in soil treatment/dispersalunits that are long and narrow (Converse et al., 1989; Tyler et.al., 1986). The more restrictive thesoil profile, the narrower and longer the soil treatment/dispersal unit will be. If these conceptsare not followed, then the system may not perform as expected. The sizing and configurationof all soil absorption units , including the mound, is based on how the effluent moves awayfrom the unit and the rate at which it moves away. Not all of these concepts will apply toall soil and site conditions as soil treatment/dispersal units are not compatible to all sitesand should not be used on such sites.
Separation distances:
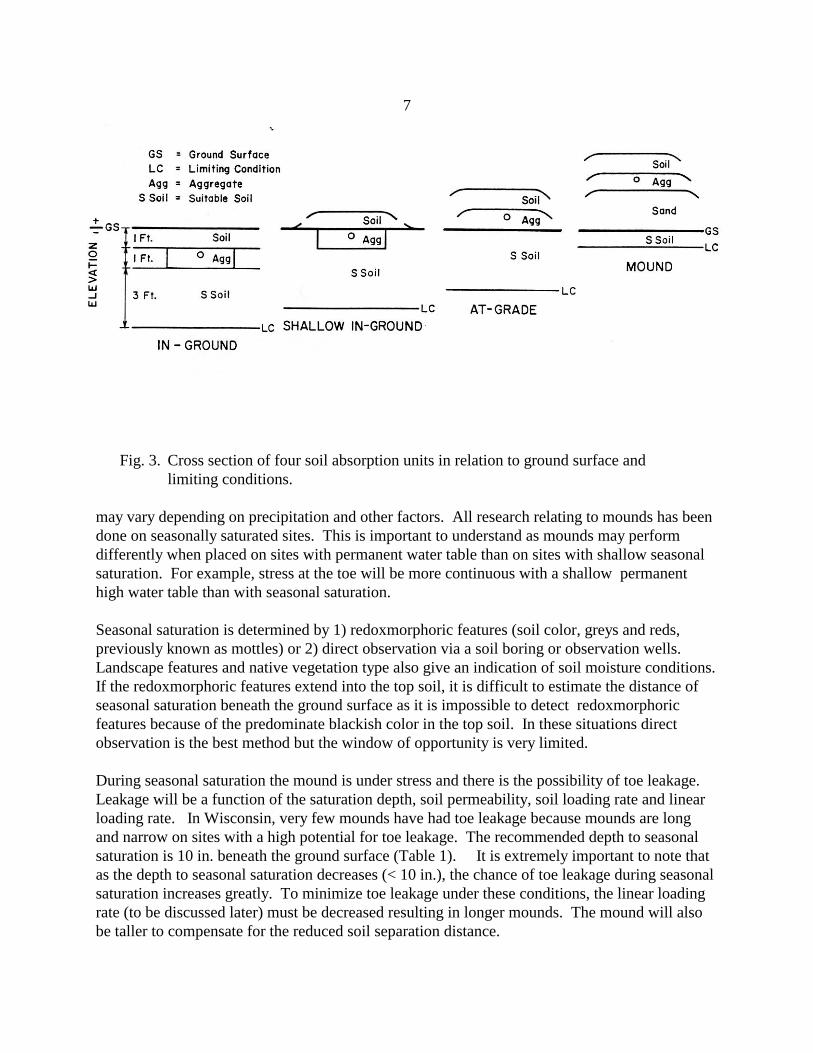
Codes, regulating on-site systems, require a depth of soil or soil and sand fill to treat effluentbefore it reaches a limiting condition such as bedrock or high water table or other restrictivelayers. Figure 3 shows the relationship between the type of system best suited for the site and thelocation of the limiting condition beneath the ground surface where 3 ft of separation is required. This figure can be used for other separation distances which may vary from 1-4 ft depending onthe code requirement.
For the mound unit, this separation distance consists of the distance from the ground surface tothe limiting condition below the ground surface plus the depth of sand between the groundsurface and the infiltrative surface within the mound (sand/aggregate interface or the exposedsurface of chamber units. For example, if the code requires 3 ft of suitable soil and the limitingcondition is 20" beneath the ground surface, the sand fill depth between the ground surface andthe infiltrative surface is 16" for mounds receiving septic tank effluent.
Distance to Water Table:
A distinction should be made between permanent water table and seasonal saturation. Seasonalsaturation is the depth at which the soil is saturated for a period of time (days to weeks) primarilyduring the spring months. This may occur at other times during wet periods and at otherlocations. Permanent water table relates to a water table that is present all the time. The level

6
7
Fig. 3. Cross section of four soil absorption units in relation to ground surface and limiting conditions.
may vary depending on precipitation and other factors. All research relating to mounds has beendone on seasonally saturated sites. This is important to understand as mounds may performdifferently when placed on sites with permanent water table than on sites with shallow seasonalsaturation. For example, stress at the toe will be more continuous with a shallow permanenthigh water table than with seasonal saturation.
Seasonal saturation is determined by 1) redoxmorphoric features (soil color, greys and reds,previously known as mottles) or 2) direct observation via a soil boring or observation wells. Landscape features and native vegetation type also give an indication of soil moisture conditions. If the redoxmorphoric features extend into the top soil, it is difficult to estimate the distance ofseasonal saturation beneath the ground surface as it is impossible to detect redoxmorphoricfeatures because of the predominate blackish color in the top soil. In these situations directobservation is the best method but the window of opportunity is very limited.
During seasonal saturation the mound is under stress and there is the possibility of toe leakage. Leakage will be a function of the saturation depth, soil permeability, soil loading rate and linearloading rate. In Wisconsin, very few mounds have had toe leakage because mounds are long and narrow on sites with a high potential for toe leakage. The recommended depth to seasonalsaturation is 10 in. beneath the ground surface (Table 1). It is extremely important to note thatas the depth to seasonal saturation decreases (< 10 in.), the chance of toe leakage during seasonalsaturation increases greatly. To minimize toe leakage under these conditions, the linear loadingrate (to be discussed later) must be decreased resulting in longer mounds. The mound will alsobe taller to compensate for the reduced soil separation distance.

8
Table 1. Recommended soil and site criteria for the Wisconsin mound system. ________________________________________________________________Parameter-------------------------------------------------------------------------------------------------Depth to high water table 10 in.Depth to crevice bedrock 24 in.aDepth to non-crevice bedrock 10 in.Permeability of top horizon 0.3 gpd/ft2
Site Slope Noteb Filled site Yesc
Over old system Yesd
Flood Plain No________________________________________________________________a Depth recommended if the crevices are open. If the crevices are filled with soil, may consider reducing depth to 18". b Note: Slope is not a factor in the performance of mound. Slope may be limited
due to safe construction techniques. c Suitable according to soil criteria (texture, structure, consistence).d The area and back fill must be treated as fill as it is a disturbed site.
Depth to Bedrock:
Bedrock should be classified as crevice, non-crevice semi-permeable or non-creviceimpermeable. Bedrock has been defined where at least 50% of the material by volume is rock (Wisc. Adm. Code, 1983). Once the effluent reaches the bedrock, treatment may or may not takeplace depending on the bedrock characteristics. In crevice bedrock where the crevices are filledwith soil the flow is concentrated in the crevices which may reduce treatment effectiveness but itwill be more effective than bedrock with open crevices. Therefore, some credit should be givento filled crevices (see footnote a in Table 1).
Soil Permeability:
Table 2 gives the recommended soil loading rate based on soil texture and structure for themound basal area. This table assumes that the soil consistence is loose, friable or firm and notvery firm. In very firm conditions, water movement is very slow and the site is notrecommended for mound placement. Since the basal area receives effluent low in BOD and TSS,the loading rate can be increased compared to soils receiving septic tank effluent. In the pasteffluent quality has not been taken into consideration when sizing the basal area and the soilloading rates have been the same as for septic tank effluent. This change will reduce the basalarea required but will be more in line with loading rates of highly preteated effluent. In mostcases the mound footprint will not change because of the recommended 3:1 side slopes. The 3:1slope was selected for mowing safety.

9
Slopes:
Site slopes are not a limitation for on-site soil units. Slope limitations are primarily forconstruction safety concern. Systems on steep slopes with slowly permeable soils should be longand narrow to reduce the possibility of toe leakage. A 25% limit is recommended which is based on construction concerns (Table 1) and not soil and hydraulic properties.
Filled areas:
Fill is defined as the soil placed to raise the elevation of the site. Textures range from sand toclay or a mixture of textures. Structure is often massive (structureless) or platy. Under thesecircumstances the permeability of the soil is reduced and variable. A more intensive soilevaluation must be done because of the increased variability encountered in filled sites overnaturally occurring sites. Many more observations are generally needed for filled sites comparedto non-filled sites and the site evaluator must be knowledgeable of the ramifications of fill.
Flood Plains:
It is not recommended to install any soil absorption system in a flood plain, drainage ways ordepressions unless flood protection is provided.
Horizontal Separation Distances:
The same separation distances used for other soil based dispersal units should be used for themound unit. On sloping sites the up slope and end distances should be measured from the up slope edge or ends of the aggregate to the respective features and the down slope distance shouldbe measured from the down slope toe of the mound to the respective features. As with all soilbased dispersal units on sloping sites where the flow away from the unit is primarily horizontal, agreater down slope horizontal separation distance may be appropriate to avoid weeping into aditch or basement that may be located down slope.
Sites with Trees and Large Boulders:
Generally, sites with large trees, numerous smaller trees or large boulders are less desirable formound systems because of the difficulty in preparing the site. If a more desirable site is not available, the trees must be cut at ground level leaving the stumps in place. Boulders should notbe removed. If the tree stumps and/or boulders occupy a significant amount of the surface area,(in most cases they do not) the size of the mound basal area should be increased to providesufficient soil to accept the effluent. The site evaluator should provide location and sizeinformation about trees and boulders.
Table 2. Design basal loading rates for mound systems for soil horizons

10
with loose, very friable, friable and firm consistence. These values assume wastewater has been highly pretreated with BOD and TSS < 25 mg/L and based on 150 gpd/bedroom.
Structure
0 pl bk, pr or gr
Texture sg m 1 2 & 3 1 2 & 3
- - - - - - -- - - - - - - - - gpd/ft2 - - - - - - - - - - - - - - - - -
cos 1.6 - - - - -
s 1.2 - - - - -
fs 0.9 - - - - -
vfs 0.6 - - - - -
lcos 1.4 - - - - -
ls 1.0 - - - - -
lfs 0.9 - - - - -
lvfs 0.6 - - - - -
cosl - 0.6 0.5 0.0 0.7 1.0
sl - 0.5 0.4 0.0 0.6 0.9
fsl - 0.5 0.4 0.0 0.6 0.8
vfsl - 0.4 0.3 0.0 0.6 0.8
l - 0.5 0.5 0.0 0.6 0.8
sil - 0.2 0.3 0.0 0.3 0.8
si - 0.0 0.0 0.0 0.3 0.6
scl - 0.0 0.0 0.0 0.3 0.6
cl - 0.0 0.0 0.0 0.3 0.6
sicl - 0.0 0.0 0.0 0.3 0.6
sc - 0.0 0.0 0.0 0.0 0.3
sic - 0.0 0.0 0.0 0.0 0.3
c - 0.0 0.0 0.0 0.0 0.3MOUND DESIGN CONCEPTS

11
As with all soil based treatment/dispersal units, a mound system must be sized and configured tomatch the soil and site conditions and the volume and quality of wastewater applied to it. It isimperative that the designer have sufficient information about the quality and quantity ofeffluent, soil and site features and understands the mound operating principles and movement ofeffluent away from the system. The designer, in cooperation with the soil scientist or siteevaluator, must accurately estimate the design basal loading rate (Table 2), determine thedirection of flow away from the system (Fig. 2) and estimate the linear loading rate, before themound can be designed.
The design consists of estimating the 1) sand media loading rate, 2) basal (soil) loading rate and3) linear loading rate for the site. Once these three design rates are determined, the mound can besized for the site. Fig. 4 shows a cross section and plan view of the mound on a sloping site andshows dimensions that must be determined.
Sand Media Loading Rate:
The design sand loading rate for the absorption area (aggregate/sand interface or chamberbottom/sand interface) is dependent upon the quality of the effluent applied and the type andquality of the fill material. This design assumes that the effluent quality is septic tank effluentfrom domestic waste water. If high strength wastes from commercial establishments is thesource, such as from restaurants, the loading rates must be adjusted based on wastewater strengthwith comparable organic loading rates (BOD, TSS, FOG) (Siegrist et al., 1985) resulting in lowerloading rates or the wastewater pretreated equal to or less than typical domestic septic tankeffluent quality. If highly pretreated effluent (BOD and TSS < 25 mg/L and very low FOG) isused, the loading rate of 2.0 gpd/ft2 is reasonable. Separation distances may be reduceddepending upon the fecal coliform count of the effluent (Converse and Tyler, 1998).
The purpose of the sand fill, along with the native soil, is to treat the effluent to an acceptablelevel. A very coarse sand will not provide adequate treatment and it may not be practical to use amedian to fine sand because of the very low loading rate required to minimize clogging. Thus,the sand must be selected that provides satisfactory treatment and allows for a reasonable loadingrate.
During the initial development of the mound, medium sand (USDA classification) wasconsidered suitable for mound fill but it was soon shown that premature clogging resulted forsand fill that was on the fine side of medium. Bank run sand, which was classified as mediumsand, was also found unsuitable, in most cases, as it was usually poorly sorted (high uniformitycoefficient) and contained a lot of fines. Currently, the recommendation is to use a coarsesand with a minimum amount of fines (< 5%) which appears to give acceptable treatment at an acceptable loading rate and reasonable cost. Standard classifications, such as USDA, are notsuitable as they are very broad. For example, a sand classified as coarse sand may or may not be

12

13
acceptable while a sand classified as medium sand may be as it depends upon a combination ofvarious sand fractions.
Figure 5 can be used as a guide for selecting a suitable mound sand fill. Based on a sieveanalysis of the total sample, the sand fill specification should fit between the ranges given in Fig.5. In addition, the sand fill must not have more than 20% (by wt) material that is greater than 2mm in diameter (coarse fragments) which includes stone, cobbles and gravel. Also, there mustnot be more than 5% silt and clay (<0.53 mm, 270 mesh sieve) in the fill. Less would be better. C-33 specification (ASTM, 1984) for fine aggregate does fit within this guideline but the coarser(>2 mm) and finer (<0.053 mm) fractions must be evaluated to make sure they meet the limits. A sand with an effective diameter (D10) of 0.15 - 0.30 mm and uniformity coefficient (D60/D10)between 4 and 6 fit within these guidelines provided the coarser (>2 mm) and finer (0.053 mm)fractions meet the guideline. Although these guidelines give a range, it is best to stay on thecoarse side (left curve with effective diameter close to 0.30 mm and uniformity coefficient of4.0) than to be on the fine side (near the right curve). The single pass sand filter recommendsa coarser sand with less fine material with effective diameter of 0.30 mm and uniformitycoefficient of <4.0 and 0-2% passing the 100 mesh sieve and 0-1% passing the 200 mesh sieve(Orenco, 1998). Since the mound is a sand filter, the material recommended for sand filterswould be suitable. The recommended sand filter loading rate is slightly higher than for mounds. The sand filter utilizes timed dosing with small frequent doses and less area/orifice, whichenhances treatment quality, instead of demand dosing with large infrequent dosing.
The recommended design loading rate for a sand fill that meets the mound sand fillspecification (Fig. 5) is 1.0 gpd/ft2 for typical domestic septic tank effluent. Some designersmay feel more comfortable using a design loading rate of 0.8 gpd/ft2 . Experience has shownthat a clogging mat may form at this interface and lead to back up or breakout of septic tankeffluent requiring corrective action. Based on many years of experience, some mounds havefailed via clogging. Initial design called for a loading rates of 1.2 gpd/ft2. Reducing the sandloading rate does not substantially increase construction costs.
The 1.0 gpd/ft2 loading rate assumes that there is a safety factor. It assumes, for designpurposes, that a home generates 75 gpcd with two people per bedroom or 150 gallons perbedroom per day with the actual flow in the range of 50 to 60% of design. Converse and Tyler(1987) found, based on water meter readings in the home, that the waste water generatedaveraged 47% of design with a range of 29 to 82%. However, some designers like to use theflow generated based on water meter readings or use the number of people per house times theestimated average of 50 gpd/c for design purposes. If this approach is used, then a factor ofsafety of 1.5 to 2 must be incorporated or the design loading rate in gpd/ft2 reducedaccordingly. Similar procedures should be followed for commercial establishments includinglower loading rates due to the higher strengths effluents as discussed previously.

14

15
Basal Loading Rate:
The basal area (sand/soil interface in Fig. 4) is the area enclosed by B(A+I) for sloping sites andB(A+I+J) for level sites where J = I for level sites. In the past basal loading rates assumed aclogging mat would form. Experience has shown that the clogging mat will not form at thisinterface because most of the organic matter (BOD and TSS) have been removed as it passesthrough the sand. Thus, the basal loading rate (gpd/ft2) be higher than for septic tank effluent. Table 2 provides basal loading rates for septic tank effluent after having passed through themound sand. These values assigned to the basal loading rate (BOD and TSS < 30 mg/L) shouldbe used with some caution because there is limited experience. Also, the basal dimension (I)calculated by these numbers is usually less than the value calculated for the side slope (3:1)except in very slowly permeable soils.
Hydraulic Linear Loading Rate:
The hydraulic linear loading rate is the volume of effluent (gallons) applied per day perlinear foot of the system along the natural contour (gpd/ft). The design hydraulic linearloading rate is a function of effluent movement rate away from the system and the direction ofmovement away from the system (horizontal, vertical or combination, Fig. 2). If the movementis primarily vertical (Fig. 2a), then the hydraulic linear loading rate is not critical. If themovement is primarily horizontal (Fig. 2d), the hydraulic linear loading rate is extremelyimportant. Figure 6 illustrates the effect of hydraulic linear loading rate on the configurationselected. Other factors such as gas transfer beneath the absorption area suggest that theabsorption area width be relatively narrowregardless of the hydraulic linear loading rate(Tyler et al., 1986).
Fig. 6. The effect of linear loading rate based on system configuration on a sloping site. The sand orsoil loading rates (gpd/ft2) are the same but the linear loading rate for the right figure is twicethat of the left figure. The soil may not be able to move the effluent away from the system fastenough resulting in back up and breakout at the mound toe. This is more critical as mounds are

16
placed on more difficult sites (shallow seasonal saturation and slowly permeable soils). It is somewhat difficult to estimate the hydraulic linear loading rate for a variety of soil and flowconditions but based on the authors’ experience “good estimates” can be given. If the flow isprimarily vertical (Fig. 2a), then the hydraulic linear loading rate can be high but the gaseouslinear loading rate (oxygen transfer to meet the oxygen demand) should be limited to 8-10 gpd/ftof typical domestic septic tank effluent. The slower the gas transport or the higher thewastewater BOD, the narrow the absorption area needed in order to meet the oxygen demandbeneath the absorption area. If the flow is primarily horizontal, because of a shallow restrictivelayer or limiting condition such as seasonal saturation or bedrock (Fig. 2d), then the linearloading rate should be in the range of 3-4 gpd/ft, resulting in long and narrow systems. Converse(1998) gives a more detailed explanation and provides two examples of estimating linear loadingrate.
Sizing the Mound:
Figure 4 shows the cross section and plan view of the mound for sloping site. The dimensionsare based on the site conditions and loading rates which are site specific. Prior to designing, the designer needs to determine the following loading rates:
Design Flow Rate - gpdSand loading rate - gpd/ft2
Basal loading rate - gpd/ft2
Hydraulic linear loading rate - gpd/ft
Absorption Area Width (A): The width of the absorption area is a function of the hydrauliclinear loading rate and the design sand loading rate.
A = (Hydraulic Linear Loading Rate / Sand Loading Rate) = (gpd/ft)/ (gpd/ft2) = ft
Note: If the designer doesn’t feel comfortable with using linear loading rate, he/she canselect a width. It is recommended that width be less than 10 ft which may be to widefor some sites. Selecting a width, in essence, is selecting a linear loading rate. If thesand loading rate is 1.0 gpd/ft2 then the linear loading rate and width values are thesame.
Absorption Area Length (B): The length of the absorption area, along the natural surfacecontour, is a function of the design flow rate (gpd) and the linear loading rate (gpd/lf).
B= (Design Flow Rate / Hydraulic Linear Loading Rate) = (gpd)/ (gpd/ft) = ft
Basal Length (B) and Width (I, A and J): The basal length is (B) and the basal width forsloping sites is (I + A) and for level sites it is (I + A +J). The width is based on the linear loadingrate and the basal loading rate for highly pretreated effluent ( Table 2).
17
For sloping sites:
I +A = ( Hydraulic Linear Loading Rate / Basal Loading Rate) = (gpd/ft)/(gpd/ft2) = ft
For level sites:
I+A+J = (Hydraulic Linear Loading Rate / Basal Loading Rate) = (gpd/ft)/(gpd/ft2) = ft
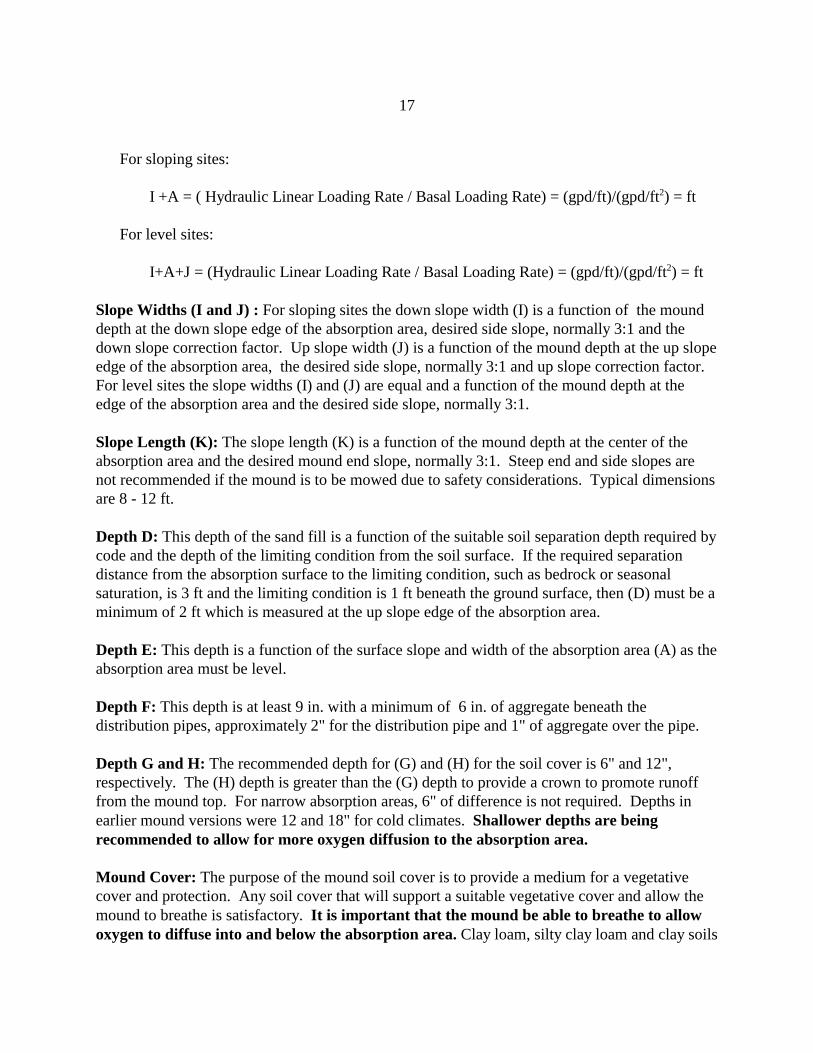
Slope Widths (I and J) : For sloping sites the down slope width (I) is a function of the mounddepth at the down slope edge of the absorption area, desired side slope, normally 3:1 and thedown slope correction factor. Up slope width (J) is a function of the mound depth at the up slopeedge of the absorption area, the desired side slope, normally 3:1 and up slope correction factor. For level sites the slope widths (I) and (J) are equal and a function of the mound depth at theedge of the absorption area and the desired side slope, normally 3:1.
Slope Length (K): The slope length (K) is a function of the mound depth at the center of theabsorption area and the desired mound end slope, normally 3:1. Steep end and side slopes arenot recommended if the mound is to be mowed due to safety considerations. Typical dimensionsare 8 - 12 ft.
Depth D: This depth of the sand fill is a function of the suitable soil separation depth required bycode and the depth of the limiting condition from the soil surface. If the required separationdistance from the absorption surface to the limiting condition, such as bedrock or seasonalsaturation, is 3 ft and the limiting condition is 1 ft beneath the ground surface, then (D) must be aminimum of 2 ft which is measured at the up slope edge of the absorption area.
Depth E: This depth is a function of the surface slope and width of the absorption area (A) as theabsorption area must be level.
Depth F: This depth is at least 9 in. with a minimum of 6 in. of aggregate beneath thedistribution pipes, approximately 2" for the distribution pipe and 1" of aggregate over the pipe.
Depth G and H: The recommended depth for (G) and (H) for the soil cover is 6" and 12",respectively. The (H) depth is greater than the (G) depth to provide a crown to promote runofffrom the mound top. For narrow absorption areas, 6" of difference is not required. Depths inearlier mound versions were 12 and 18" for cold climates. Shallower depths are beingrecommended to allow for more oxygen diffusion to the absorption area.
Mound Cover: The purpose of the mound soil cover is to provide a medium for a vegetativecover and protection. Any soil cover that will support a suitable vegetative cover and allow themound to breathe is satisfactory. It is important that the mound be able to breathe to allowoxygen to diffuse into and below the absorption area. Clay loam, silty clay loam and clay soils

18
restricts oxygen diffusion. Thicker soil covers also reduce oxygen transfer. The recommendedmound cover consists of the sandy loam, loamy sands and silt loams. These coarser soils will notshed the precipitation as well as heavier soils and will not hold as much moisture during thesummer dry periods but the benefits of breathing is probably superior to the negatives. If the soilcover does not support good vegetative cover, other means, such as decorative stone, must beimplemented to avoid surface erosion.
Observation Tubes: It is essential that all soil absorption systems, including mounds, haveobservation tubes extending from the infiltrative surface (aggregate/sand interface for mounds) toor above the ground surface to observe ponding at the infiltrative surface. Tubes should beplaced at approximately 1/4 and 3/4 points along the length of the absorption area. Fig. 7illustrates three methods of anchoring the observation tubes. The bottom 4" must haveperforations in the sides to allow ponded effluent to enter and exit the pipes. Ponded
effluent will not enter from the bottom of the pipe.

19
Fig. 7. Three methods of securing observation tubes.
Effluent Distribution Network: Pressure distribution network is essential for distributing theseptic tank effluent. Gravity flow is unacceptable as it will not distribute the effluent uniformlyover the infiltrative surface or along the length of the mound (Converse, 1974, Machmeier andAnderson, 1988). Otis (1981) provides design criteria and examples for pressure distribution. Converse (2000) discusses pressure distribution and provides a design example for the newcriteria.
DESIGN EXAMPLE
Design an on-site system based on the following soil profile description.
Site Criteria
1. Soil Profile - Summary of 3 soil pits evaluations.
A. 0 - 6 in. 10YR6/4&2/1; silt loam (Sil); strong, moderate, angular blocky structure;friable consistence.
E. 6 -11 in. 10YR5/3; silt loam (Sil); moderate, fine platy structure; firm consistence.
B. 11-20 in. 10YR6/3; silty clay loam (Sicl); moderate, fine, subangular blocky structure; firm consistence; few, medium, distinct mottles starting at 11".
C. 20-36 in. 10YR5/3; silty clay (sic); massive structure; very firm consistence; many,medium, prominent mottles.
2. Slope 20%
3. The area available consists of 170 ft along the contour and 50 ft along the slope. Thereare 3 medium size trees in the area.
4. The establishment generates 300 gallons of wastewater of domestic septic tank effluentper day based on water meter readings.
Step 1. Evaluate the quantity and quality of the wastewater generated.
For all on-site systems a careful evaluation must be done on the quantity of wastewatergenerated. As indicated earlier, most code values have a factor of safety built into theflows generated daily. These are the values that are typically used for design. It isappropriate for the designer to assess if the code value is appropriate for the given
20
facility and if not, work with the regulators on a suitable number. If metered values areused, a suitable factor of safety must be added to the daily average flow such as 50 to
100%. The average flow should be based on a realistic period of time and not be, for example,an average of six months of very low daily flow rates and 6 months of very high flow rates inwhich case then the high flow rates should be used for design plus the factor of safety. It is bestto over design rather than under design even though the cost is greater but systemperformance and longevity should be greater.
Effluent quality must also be assessed. If it is typical domestic septic tank effluent, these sizingcriteria may be used. If it is commercial septic tank effluent, lower loading rates (gpd/ft2) mustbe used (Siegrist, et al., 1985) or the effluent pretreated to acceptable BOD and TSS. Use a factorof safety of 150%.
Design Flow Rate = 300 gpd X 1.5 = 450 gpd.
Typical design flows are 150 gpd/bedroom.
(Experience has shown that some mounds designed at 150 gpd/bedroom haveponded even though the actual flow was probably well below the design).
Step 2. Evaluate the soil profile and site description for design linear loading rate and soilloading rate.
For this example and convenience the one soil profile description is representative of thesite. A minimum of 3 evaluations must be done on the site. More may be requireddepending on the variability of the soil. The soil evaluator must do as many borings asrequired to assure that the evaluation is representative of the site. Soil pits are betterthan borings but a combination are satisfactory. In evaluating this soil profile, thefollowing comments can be made:
The silt loam (A) horizon (0 - 6") is relatively permeable because of its texture,structure and consistence. The effluent flow through this horizon should be primarilyvertical.
The silt loam (E) horizon (6 - 11") has a platy structure and firm consistence. Theconsistence will slow the flow and the platy structure will imped vertical flow andcause the flow to move horizontally. If this layer is tilled, the platy structure will berearranged and the flow will be primarily vertical. Thus, tillage must be done atleast 11 in. deep on this site to rearrange the platy structure. If the structure inthis horizon was not platy, then tillage would be limited to 5-6" in-depth.
The silty clay loam (B) horizon (11-20 in.) is slowly permeable because of the texture and firm consistence. The flow will be a combination of vertical and horizontal flowin the upper portion and primarily horizontal flow in the lower portion of the horizon

21
due to the nature of the next lower horizon. During wet weather the “B” horizon maybe saturated with all flow moving horizontally.
The silty clay (C) horizon (20 - 36 in.) will accept some vertical flow as the effluentmoves horizontally down slope in the upper horizons. The flow through this profilewill be similar to the cross section shown in Fig. 2c and during seasonal saturation asshown in Fig. 2b.
Based on experience a properly designed mound system should function on this site. It meets the minimum site recommendations found in Table 1.
Linear loading rates range from about 1 - 10 gpd/lf. Since this site has a very shallowseasonal saturation and a very slowly permeable horizon at about 20", and seasonalsaturation at 11", the linear loading value for this site should be 3-4 gpd/lf.
Linear Loading Rate = 4 gpd/lf
Note: LLR = 3 could be used for a more conservative design and less risk oftoe leakage especially during seasonal saturation.
A basal loading rate for the soil horizon in contact with the sand (basal area) isselected based on the surface horizon (A). Use table 2 to determine the design basalloading rate.
Basal Loading Rate = 0.8 gpd/ft2
Step 3. Select the sand fill loading rate.
The section entitled “Sand Fill Loading Rate” and Fig. 6 give guidelines for selecting asuitable sand fill for the mound. Other fills may be used but caution should be used asperformance data is very limited with the other fills.
Sand Loading Rate = 1.0 gpd/ft2
No absorption area credit is given for use of chambers in mounds.
Step 4. Determine the absorption area width (A).
A = Linear Loading Rate / Sand Loading Rate
= 4 gpd/ft / 1.0 gpd/ft2 = 4 ft (Since this appears to be the weak point in the mound, consider making it
6 ft wide. A 6 ft wide absorption area would give a sand loading rate of
22
0.67 gpd/gpd/ft2.. The linear loading rate will remain at 4 gpd/lf .However, increasing the area will require more orifices in the pressuredistribution network).
Step 5. Determine the absorption area length ( B).
B = Design Flow Rate / Linear Loading Rate
= 450 gpd / 4 gpd/lf = 113 ft.
Step 6. Determine the basal width (A + I).
The basal area required to absorb the effluent into the natural soil is based on the soilat the sand/soil interface and not on the lower horizons in the profile. An assessmentof the lower horizons was done in Step 2 when the linear loading rate was estimated.
A + I = Linear Loading Rate / Basal Loading Rate
= 4 gpd/ft / 0.8 gpd/ft2 = 5.0 ft (The effluent should be absorbed into the native soil, within a 5 ft.)
Since A = 4 ft
I = 5.0' - 4.0' = 1 ft. ( “I” will also be calculated based on side slope)
Step 7. Determine the mound fill depth (D).
Assuming the code requires 3 ft of suitable soil and soil profile indicates 11 in. ofsuitable soil then:
D =36" - 11" = 25 in.
Step 8. Determine mound fill depth (E).
For a 20% slope with the bottom of the absorption area level then:
E = D + 0.20(A) = 25" + 0.20 (48") = 35 in.
Step 9. Determine mound depths (F), (G) and (H)

23
F = 9 in. (6 in. of aggregate, 2 in. for pipe and 1 in. for aggregate cover over pipe)
G = 6 in.
H = 12 in.
These depths have changed from 12 and 18" so as to allow more oxygen to diffuseinto and beneath the absorption area. Sand filters have only 6" of cover andfreezing is not a problem as long as the distribution network drains after eachdose. Granted most sand filters are below grade which may be a factor.
Step 10. Determine the up slope width (J)
Using the recommended mound side slope of 3:1 then:
J = 3 (D + F+ G) (Slope Correction Factor from Table 3)
= 3(25" + 9"+ 6") (0.625) = 6.25 ft or 6 ft
Step 11. Determine the end slope length (K).
Using the recommended mound end slope of 3:1 then:
K = 3((D + E)/2 + F + H)
= 3 ((25" + 35")/2 + 9" + 12") = 12.75 ft or 13 ft
Step 12. Determine the down slope width (I)
Using the recommended mound side slope of 3:1 then:
I = 3(E + F + G) (Slope Correction Factor from Table 3) = 3(35" + 9" + 6")(2.5) = 37.5 ft.
Since the I dimension becomes quite large on steeper slopes, it may be desirable tomake the down slope steeper such as 2:1 and not mow the mound. If the natural slopeis 6% instead of 20% the mound width would be 28 ft (9 + 4 + 15).
Step 13. Overall length and width (L + W)

24
L = B + 2K
= 113 + 2(13) = 139 ft
W = I + A + J
= 31 + 4 + 6 = 41 ft
Step 14. Design a Pressure Distribution Network
A pressure distribution network, including the distribution piping, dosing chamber andpump, must be designed. A design example is presented by Converse, 2000. Items toconsider when designing the pressure distribution network.
- Using 3/16" holes instead of 1/4" holes with an effluent filter in the tank.
- Using 6 ft2/orifice instead of the typical 15 - 20 ft2/orifice that has been used.
- Provide easy access to flush the laterals such as turn-ups at end of laterals.
- Dose volume at 5 times the lateral pipe volume and not to exceed 20% of thedesign flow and not dose at the previously recommended 1/4 the design flow or10 times the lateral void volume.
- Timed dosing which requires surge capacity in the septic tank/pump chamber. With the configuration of the mound (long and narrow), the dose volume is largerthan for sand filter and time dosing may not be appropriate if larger dose volumesare required due to 5 times the lateral volume.
MOUND PERFORMANCE
The first Wisconsin mound system of the current design was installed in 1973. In Wisconsinthere are over 30,000 mounds based on estimates by state regulators. Many other states haveadopted the technology. Proper siting of all soils absorption units, including the mound, isessential otherwise the system will not function as planned.
In Wisconsin the mound system has a success rate of over 95% based on a survey by Converseand Tyler (1986b). This success rate is due in part to a very strong educational program relating to siting, design and construction.

25
A mound can fail either at the 1) aggregate or chamber/sand interface due to a clogging mat, 2) atthe sand/soil interface due to the inability of the soil to accept the influent or 3) plugging of thepressure distribution network. Converse and Tyler (1989) discuss the mechanism that maycause failure and methods to rectify the problem. Another alternative (not discussed in thatpublication) to renovate mounds, that have severe ponding, is to introduce highly pretreated
Table 4. Down slope and up slope correction factors_________________________________________________ Slope Down Slope Up Slope
% Correction Factor Correction Factor--------------------------------------------------------------------------
0 1.00 1.00 1 1.03 0.97 2 1.06 0.94
3 1.10 0.92 4 1.14 0.89 5 1.18 0.88 6 1.22 0.85 7 1.27 0.83 8 1.32 0.80 9 1.38 0.7910 1.44 0.7711 1.51 0.7512 1.57 0.7313 1.64 0.7214 1.72 0.7115 1.82 0.6916 1.92 0.6817 2.04 0.6618 2.17 0.6519 2.33 0.6420 2.50 0.6221 2.70 0.6122 2.94 0.6023 3.23 0.5924 3.57 0.5825 4.00 0.57
_______________________________________________
effluent to the mound by installing an aerobic unit, Nibbler Jr (NCS, 1998) or equivalent betweenthe septic tank and pump chamber (Converse et al., 1998).
Converse et al., (1994) evaluated 13 mound systems for performance based on fecal coliform

26
movement, nitrogen and chloride movement beneath the mound. Some fecals were foundoutside the 3 ft treatment zone beneath the system. The cause, though not definitive, may berelated to the large infrequent doses of septic tank effluent to the mound which is typical ofdemand dosing and the large orifice spacing (15 to 20 ft2).
MOUND CONSTRUCTION
A construction plan for any on-site system is essential. A clear understanding between the siteevaluator, the designer, contractor and inspector is critical if a successful system is installed. It isimportant that the contractor and inspector understand the principles of operation of the moundsystem before construction commences otherwise the system will not function as intended. It isalso important to anticipate and plan for the weather. It is best to be able to complete the moundbefore it rains on it. The tilled area (basal area) and the absorption area must be protected fromrain by placing sand on the tilled area and aggregate on the absorption area prior to precipitation. There are several different ways to construct a mound as long as the basic principles andconcepts are not violated. The following are suggested construction steps:
1. The mound must be placed on the contour. Measure the average ground surface elevationprior to tillage along the up slope edge of the absorption area. This contour will serve as thebase line for determining the elevation of the bottom of the absorption area.
2. Grass, shrubs and trees must be cut close to the ground surface and removed from the site. Inwooded areas with excess litter, it is recommended to rake the majority of it from the site. Do not pull out the stumps and do not remove the sod or the top soil or boulders.
3. Determine where the force main from the pump chamber enters the mound. It will either becenter feed or end feed. For long mounds, center feed is preferred and all end feeds can bemade into center feed. For center feed the force main can enter from the up slope center(preferred), the down slope center or exit the native soil at the end and be placed horizontallyon a slight slope in the sand beneath the aggregate or just up slope of the aggregate. If it mustbe brought in from the down slope side, especially on slowly permeable soils with highseasonal saturation where the effluent flow may be horizontal, it should be brought inperpendicular to the side of the mound with minimal disturbance to the down slope area. Allvehicular traffic must be kept in a very narrow corridor. Minimal damage is done if the soilis dry. Soil should be packed around the pipe and anti-seep collars should be installed tominimize effluent and water following the pipe. Entering from the down slope center shouldbe the last choice on sites that are slowly permeable with shallow seasonal saturation.
4. The footprint of the mound must be tilled only when the soil moisture is within a satisfactoryrange. The satisfactory moisture range, to a depth of 6-7", is defined as where the soil willcrumble and not form a wire when rolled between the palms. The purpose of tillage is toroughen the surface to allow better infiltration into the top soil. It also provides more contact

27
between the sand and the soil. Excessive tillage will destroy soil structure and reduceinfiltration. The preferred method is using chisel teeth mounted on a backhoe which can beeasily remove, followed by a chisel plow pulled behind a tractor, followed by the backhoebucket with short teeth which requires flipping the soil. Normally it takes much longer to usethe backhoe bucket than a chisel teeth mounted on the backhoe with the added cost quicklyrecovered. Moldboard plows have been used successfully but are the least preferred.Rototillers are prohibited on structured soils but may be used on unstructured soils such assand to break up the vegetation. However, they are not recommended. All tilling must bedone following the contour.
If a platy structure is present in the upper horizons, the tillage depth should be deep enough totry to break it up without bringing an excessive amount of subsoil to the surface. Deep tillingfor the sake of deep tilling is not recommended. Till around the stumps without exposing anexcessive amount of roots. Chisel teeth, mounded on a backhoe, is the preferred and aneasier method for tilling around stumps. Stumps are not to be removed but some small onesmay be inadvertently pulled out during tilling. If so, remove them from the site. If there arean excessive number of stumps and large boulders, the basal area should be enlarged oranother site selected but that is the rare occasion.
5. Once the site has been tilled, a layer of sand must be placed before it rains. Driving on theexposed tilled soil is prohibited so as not to compact it or rut it up. Sand should be placedwith a backhoe (preferred) or placed with a blade and track type tractor. A wheeled tractorwill rut up the surface. All work is to be done from the up slope side so as not to compactthe down slope area especially if the effluent flow is horizontally away from the mound.
6. Place the proper depth of sand, then form the absorption area with the bottom area rakedlevel. The sand should be reasonably compacted in the trench area to minimize settling. Agood backhoe operator can form the trench with minimal hand work.
7. Place a clean sound aggregate to the desired depth. Limestone is not recommended. Ifchambers are used, proper procedures must be performed to keep the chambers from settlinginto the sand. Procedures are available from the manufacturers that include compacting thesand to a certain specification and placing a coarse netting on the compacted surface prior tochamber placement.
8. Place the pressure distribution network with holes located downward and cover it with 1 in.of aggregate. Connect the force main to the distribution network. If chambers are used, thepressure distribution laterals must be suspended from the chambers with holes upward. Provisions must be made to allow the laterals to drain after dosing. This is accomplished byhaving several holes located downward or sloping the pipe in the chamber toward the forcemain. The laterals and force main must drain after each dose.
9. Cover the aggregate with a geotextile synthetic fabric.

28
10. Place suitable soil cover on the mound. There should be 6" on the sides and shoulder (G) and12" on the top center (H) after settling. The soil cover should support vegetation. If notprovisions must be made to control erosion.
11. Final grade the mound and area so surface water moves away from and does not accumulateon the up slope side of the mound. Use lightweight equipment.
12. Seed and mulch the entire exposed area to avoid erosion. Advise the homeowner on properlandscaping. The top of the mound becomes dry during the summer and the down slope toemay be wet during the wet seasons. Avoid deep rooted vegetation on the top of the mound tominimize root penetration into the distribution network (Schutt, K., et al. 1981)
13. Inform homeowner about the type of system, maintenance requirements and do’s and don’tsassociated with on-site soil based systems.
REFERENCES
ASTM. 1994. Standard specifications for concrete aggregate. C-33. American Society ofTesting materials. Converse, J.C. 1974 Distribution of domestic waste effluent in soil absorption beds. Trans. ofthe ASAE. 17:299-304.
Converse, J.C., R.J. Otis, J. Bouma, W.G. Walker, J.L. Anderson, and D.E. Steward. 1975a. Adesign and construction procedure for mounds in slowly permeable soils with and withoutseasonally high water tables. Small Scale Waste Management Project. 345 King Hall, Universityof Wisconsin-Madison, 1525 Linden Drive, Madison, WI 53706.
Converse, J.C., R.J. Otis, and J. Bouma. 1975b. Design and construction procedures for fillsystems in permeable soils with high water tables. Small Scale Waste Management Project. 345King Hall, University of Wisconsin-Madison, 1525 Linden Drive, Madison, WI 53706.
Converse, J.C., R.J. Otis and J. Bouma. 1975c. Design and construction procedures for fillsystems in permeable soils with shallow crevice bedrock. Small Scale Waste ManagementProject. 345 King Hall, University of Wisconsin-Madison, 1525 Linden Drive, Madison, WI53706.
Converse, J.C. 1978. Design and construction of Wisconsin mounds. Small Scale WasteManagement Project. 345 King Hall, University of Wisconsin-Madison, 1525 Linden Drive,Madison, WI 53706.
Converse, J.C. And E.J. Tyler. 1986a. The Wisconsin mound siting, design and construction.Small Scale Waste Management Project. 345 King Hall, University of Wisconsin-Madison, 1525

29
Linden Drive, Madison, WI 53706.
Converse, J.C. and E.J. Tyler, 1986b. Wisconsin mound performance. Small Scale WasteManagement Project. 345 King Hall, University of Wisconsin-Madison, 1525 Linden Drive,Madison, WI 53706.
Converse, J.C. and E.J. Tyler. 1987. On-site wastewater treatment using Wisconsin mounds ondifficult sites. Transactions of the ASAE. 30:362-368.
Converse, J.C., E.J. Tyler and J.O. Peterson. 1989. Wisconsin at-grade absorption systemmanual: siting, design- construction. Small Scale Waste Management Project. 345 King Hall,University of Wisconsin-Madison, 1525 Linden Drive, Madison, WI 53706.
Converse, J.C. and E.J. Tyler. 1989. Inspecting and troubleshooting Wisconsin mounds. G3406.Agricultural Publications, 30 N. Murray St. Madison, WI. 53706.
Converse J.C. and E.J. Tyler. 1990. Wisconsin mound soil absorption systems siting, design andconstruction manual. Small Scale Waste Management Project. 345 King Hall, University ofWisconsin-Madison, 1525 Linden Drive, Madison, WI 53706.
Converse, J.C., E.J. Tyler and S.G. Litman, 1994. Nitrogen and fecal coliform removal inWisconsin mound systems. In: On-site Wastewater Treatment. Proceedings of the SeventhNational Symposium on Individual and Small Community Sewage Systems. ASAE. St. Joseph<MI. pp. 514-525.
Converse, J.C. 1998. Linear loading rates for on-site systems. Small Scale Waste ManagementProject. 345 King Hall, University of Wisconsin-Madison, 1525 Linden Drive, Madison, WI53706.
Converse, J.C. and E.J. Tyler, 1998. Soil Treatment of Aerobically Treated Domestic Wastewaterwith Emphasis on Modified Mounds. In: On-site Wastewater Treatment. Proceedings of theEight National Symposium on Individual and Small Community Sewage Systems. ASAE. St.Joseph< MI. pp. 306-319.
Converse, J.C., M.M. Converse and E.J. Tyler. 1998. Aerobically treated effluent for renovatingfailing sewage systems. In. Proceedings of the 9th on-site Wastewater Treatment Short Courseand Equipment Exhibition. University of Washington, Seattle, WA.
Converse, J.C. 1999. Septic tanks- with emphasis on filters, risers, pumps, surge capacity and time dosing. Small Scale Waste Management Project. 345 King Hall, University of Wisconsin-Madison, 1525 Linden Drive, Madison, WI 53706.
Converse, J.C. 2000. Pressure distribution network design. Small Scale Waste Management

30
Project. 345 King Hall, University of Wisconsin-Madison, 1525 Linden Drive, Madison, WI53706.
Darby, J, G. Tchobanoglous, M.Arsi Nor and D. Maciolek. 1996. Shallow intermittent sandfiltration: performance evaluation. The Small Flows Journal. 2:3-16.
Machmeier, R.E. and J.L Anderson. 1988. Flow distribution by gravity flow in perforated pipe. In. On-site Wastewater Treatment. Proceedings of the Fifth National Symposium on Individualand Small Community Sewage Systems. ASE. Joseph, MI 49085.
NCS, 1998. Northwest Cascade-Stuth, P.O. Box 73399, Puyallup, WA 98373.
Orenco, 1998. Orenco Systems Inc. Sutherlin, OR.
Otis, R.J. 1981. Design of pressure distribution networks for septic tank- soil absorptionsystems. Small Scale Waste Management Project. 345 King Hall, University of Wisconsin-Madison, 1525 Linden Drive, Madison, WI 53706. Publication No. 9.6.
Schutt, K., J.C. Converse, D. Vala and R.J. Otis. 1981. Locating and landscaping the moundsystem of onsite wastewater disposal. Small Scale Waste Management Project. 345 King Hall,University of Wisconsin-Madison, 1525 Linden Drive, Madison, WI 53706.
Siegrist, R.L., D.L. Andersen, and J.C. Converse. 1985. Commercial wastewater on-sitetreatment and disposal. In. Proceeding of the Fourth National Symposium on Individual andSmall Community Sewage Systems. ASE, St. Joseph, MI 49085.
Tyler, E.J. and J.C. Converse. 1985. Soil evaluation and design selections for large or clusterwastewater soil absorption systems. In. Proceeding of the Fourth National Symposium onIndividual and Small Community Sewage Systems. ASE, St. Joseph, MI 49085.
Tyler , E.J., J.C. Converse and D.E. Parker. 1986. Soil systems for community wastewaterdisposal-treatment and absorption case histories. In. Proceedings of a Workshop on Disposal andTreatment of Wastes on Land. Soil Science Society of America, Madison, WI 53711
Wisconsin Administrative Code. 1983. Private sewage systems. Comm. 83. State of Wisconsin,Department of Commerce, Bureau of Plumbing, Safety and Building Division. (Formerly:Department of Industry, Labor and Human Relations),Madison, WI
Wisconsin Administrative Code. 2000. Private on-site sewage systems. Comm 83. State ofWisconsin, Department of Commerce, Bureau of Plumbing, Safety and Building Division,. Madison, WI.
Witt, M.R., R.L. Siegrist, and W.C. Boyle. 1974. Rural household characteristics. Home

31
Sewage Disposal. ASE Publication. Proc. 175. ASE, St. Joseph, MI. 49085
Witz, R.L. 1974, Twenty-five years with the North Dakota waste disposal system. Home SewageDisposal. ASE Publication. Proc. 175. ASE, St. Joseph, MI. 49085

32