
15.0 PharmaNutra SpA · growth rate produces an equity value of between € 20.43-27.36/s...
16
PharmaNutra SpA Italy - Pharmaceutical Buoyant results, bright perspectives 25 th March 2019 FY-18 RESULT RELEASE RIC: PHN.MI BBG: PHN IM PharmaNutra reported a soaring set of results, better than our projections, characterised by pronounced growth driven by foreign sales and a much more than proportional progression of margins. The robust improvement in NFP will allow the company to feed further R&D and growth. Rating: Buy Price Target: € 23.30 (€ 19.20) Upside/(Downside): 40.4% Last Price: € 16.60 Market Cap.: € 160.7 1Y High/Low: € 17.90/€ 12.60 Free Float: 22.2% Major shareholders: Andrea Lacorte 30.7% Roberto Lacorte 22.5% Stock price performance 1M 3M 12M Absolute -1.8% 7.8% 29.2% Rel.to AIM Italia -2.8% 1.8% 36.4% Rel.to EU Sector 0.4% 8.4% 32.7% Analysts: Luca Arena +39 02 30343 395 [email protected] Gianluca Mozzali +39 02 30343 396 [email protected] New PT of € 23.30/s (€ 19.20). Stock offers 40.4% upside: Buy reiterated We have revised our model: 1) robust performance of the two blockbusters, recent new product launches and distribution agreements abroad boosted top line faster than in the past, 2) the lower-than-proportional progression of direct costs linked to externalisation sustained profitability. On the other hand, PHN is investing to adapt its structure to the reached relevant level of volumes in addition to a new R&D and production facility (exclusively for the sucrosomial synthesis), for a total consideration of € 7.5m in 2019- 2021, in order to preserve its core IP. The result is operating estimates basically unchanged and upgraded at Net Profit (lower tax rate). We have updated DCF valuation criteria. new DCF based PT of € 23.30/share (€ 19.20), 40.4% upside. Buy. FY-18 sales up 23.5%, exports 26% of total Revenues grew 23.5% to € 46.7m, driven by the 15.6% increase in domestic sales and by the 52.4% rise in foreign turnover, representing 73.5% and 26.5% respectively from 78.5% and 21.5% of 2017. The strategy to enlarge the weight of foreign countries is corroborated by numbers and growth perspectives outside Italy. The robust top line increase was the result of R&D investments and new distribution agreements abroad. EBITDA adj. up 24.5%, 25.4% margin. Cash positive NFP for € 11.4m EBITDA adj. soared more than proportionally to top line, and reached € 11.8m, +24.5% YoY, margin of 25.4% vs. 25.2% in 2017. The adjustments are related to 2015-17 tax credits on R&D sustained by Pharmanutra and Alesco. Net Profit adj. totalled € 7.8m, up 28.3% YoY. NFP improved significantly: PharmaNutra had a net cash position for € 11.4m from € 9.1m cash in FY-17. The BoD will propose the AGM the distribution of an € 0.50/s dividend (62% pay-out, 3.0% yield), o/w € 0.08 extraordinary: ex-dividend date May 6, 2019, record date on May 7, 2019 and with payment on May 8, 2019. Strategy: expansion of sales network, acceleration abroad and M&A PHN in Italy aims for 1) the expansion from 150 scientific salespersons to 200 by Dec-19; 2) new commercial activities for Cetilar also via umbrella brand development, 3) the development of new areas of use for their oral iron supplement, i.e. in Patient Blood Management and 4) the launch of new products with significant market potential. Abroad, PHN is 1) enlarging its selling proposition with existing partners, 2) penetrating new markets and 3) approaching directly the most important markets, i.e. the USA, the UK, France, and Germany, also via new subsidiaries. PNH is also seeking to boost growth via acquisitions, chasing not only products, but also structured sales teams. PharmaNutra, key financials and ratios € m 2017 2018 2019e 2020e 2021e Sales 37.8 46.7 53.2 59.5 66.4 EBITDA 9.4 12.6 12.5 14.4 16.5 EBITDA adjusted 9.5 11.8 12.5 14.4 16.5 EBIT 8.9 11.9 11.9 13.7 15.7 EBIT adj. 8.9 11.2 11.9 13.7 15.7 Net profit 6.0 8.6 8.5 9.8 11.3 Net profit adjusted 6.1 7.8 8.5 9.8 11.3 NFP (cash)/debt (9.1) (11.4) (15.1) (19.4) (24.6) ROCE 33.6% 37.2% 33.0% 32.6% 32.2% EPS adjusted FD 0.63 0.81 0.88 1.02 1.17 EPS adj. FD growth 46.4% 28.3% 8.9% 15.4% 14.7% DPS ord. €/s 0.33 0.50 0.44 0.51 0.58 Dividend yield 2.0% 3.0% 2.7% 3.1% 3.5% Free Cash Flow Yield 2.8% 2.6% 5.2% 5.3% 6.2% PER adj. x 26.4 20.6 18.9 16.3 14.2 EV/Sales x 3.09 3.20 2.74 2.38 2.05 EV/EBITDA adj. x 15.9 12.6 11.6 9.8 8.3 EV/EBIT adj. x 17.0 13.4 12.3 10.3 8.7 11.0 12.0 13.0 14.0 15.0 16.0 17.0 18.0 mar-18 mag-18 lug-18 set-18 nov-18 gen-19 mar-19 PHNU FTSE Pharma & Biothech
Transcript of 15.0 PharmaNutra SpA · growth rate produces an equity value of between € 20.43-27.36/s...

PharmaNutra SpA
Italy - Pharmaceutical Buoyant results, bright perspectives
25th March 2019
FY-18 RESULT RELEASE
RIC: PHN.MI BBG: PHN IM
PharmaNutra reported a soaring set of results, better than our
projections, characterised by pronounced growth driven by foreign
sales and a much more than proportional progression of margins. The
robust improvement in NFP will allow the company to feed further R&D
and growth.
Rating:
Buy
Price Target:
€ 23.30 (€ 19.20)
Upside/(Downside): 40.4%
Last Price: € 16.60
Market Cap.: € 160.7
1Y High/Low: € 17.90/€ 12.60
Free Float: 22.2%
Major shareholders: Andrea Lacorte 30.7% Roberto Lacorte 22.5%
Stock price performance
1M 3M 12M
Absolute -1.8% 7.8% 29.2%
Rel.to AIM Italia -2.8% 1.8% 36.4%
Rel.to EU Sector 0.4% 8.4% 32.7%
Analysts:
Luca Arena +39 02 30343 395 [email protected]
Gianluca Mozzali +39 02 30343 396 [email protected]
New PT of € 23.30/s (€ 19.20). Stock offers 40.4% upside: Buy reiterated We have revised our model: 1) robust performance of the two blockbusters, recent new product launches and distribution agreements abroad boosted top line faster than in the past, 2) the lower-than-proportional progression of direct costs linked to externalisation sustained profitability. On the other hand, PHN is investing to adapt its structure to the reached relevant level of volumes in addition to a new R&D and production facility (exclusively for the sucrosomial synthesis), for a total consideration of € 7.5m in 2019-2021, in order to preserve its core IP. The result is operating estimates basically unchanged and upgraded at Net Profit (lower tax rate). We have updated DCF valuation criteria. new DCF based PT of € 23.30/share (€ 19.20), 40.4% upside. Buy.
FY-18 sales up 23.5%, exports 26% of total Revenues grew 23.5% to € 46.7m, driven by the 15.6% increase in domestic sales and by the 52.4% rise in foreign turnover, representing 73.5% and 26.5% respectively from 78.5% and 21.5% of 2017. The strategy to enlarge the weight of foreign countries is corroborated by numbers and growth perspectives outside Italy. The robust top line increase was the result of R&D investments and new distribution agreements abroad.
EBITDA adj. up 24.5%, 25.4% margin. Cash positive NFP for € 11.4m EBITDA adj. soared more than proportionally to top line, and reached € 11.8m, +24.5% YoY, margin of 25.4% vs. 25.2% in 2017. The adjustments are related to 2015-17 tax credits on R&D sustained by Pharmanutra and Alesco. Net Profit adj. totalled € 7.8m, up 28.3% YoY. NFP improved significantly: PharmaNutra had a net cash position for € 11.4m from € 9.1m cash in FY-17. The BoD will propose the AGM the distribution of an € 0.50/s dividend (62% pay-out, 3.0% yield), o/w € 0.08 extraordinary: ex-dividend date May 6, 2019, record date on May 7, 2019 and with payment on May 8, 2019.
Strategy: expansion of sales network, acceleration abroad and M&A PHN in Italy aims for 1) the expansion from 150 scientific salespersons to 200 by Dec-19; 2) new commercial activities for Cetilar also via umbrella brand development, 3) the development of new areas of use for their oral iron supplement, i.e. in Patient Blood Management and 4) the launch of new products with significant market potential. Abroad, PHN is 1) enlarging its selling proposition with existing partners, 2) penetrating new markets and 3) approaching directly the most important markets, i.e. the USA, the UK, France, and Germany, also via new subsidiaries. PNH is also seeking to boost growth via acquisitions, chasing not only products, but also structured sales teams.
PharmaNutra, key financials and ratios
€ m 2017 2018 2019e 2020e 2021e
Sales 37.8 46.7 53.2 59.5 66.4
EBITDA 9.4 12.6 12.5 14.4 16.5
EBITDA adjusted 9.5 11.8 12.5 14.4 16.5
EBIT 8.9 11.9 11.9 13.7 15.7
EBIT adj. 8.9 11.2 11.9 13.7 15.7
Net profit 6.0 8.6 8.5 9.8 11.3
Net profit adjusted 6.1 7.8 8.5 9.8 11.3
NFP (cash)/debt (9.1) (11.4) (15.1) (19.4) (24.6)
ROCE 33.6% 37.2% 33.0% 32.6% 32.2%
EPS adjusted FD 0.63 0.81 0.88 1.02 1.17
EPS adj. FD growth 46.4% 28.3% 8.9% 15.4% 14.7%
DPS ord. €/s 0.33 0.50 0.44 0.51 0.58
Dividend yield 2.0% 3.0% 2.7% 3.1% 3.5%
Free Cash Flow Yield 2.8% 2.6% 5.2% 5.3% 6.2%
PER adj. x 26.4 20.6 18.9 16.3 14.2
EV/Sales x 3.09 3.20 2.74 2.38 2.05
EV/EBITDA adj. x 15.9 12.6 11.6 9.8 8.3
EV/EBIT adj. x 17.0 13.4 12.3 10.3 8.7
11.0
12.0
13.0
14.0
15.0
16.0
17.0
18.0
mar-18 mag-18 lug-18 set-18 nov-18 gen-19 mar-19
PHNU FTSE Pharma & Biothech

PharmaNutra SpA
2
1. PharmaNutra at a glance
PharmaNutra is a global nutraceutical firm, headquartered in Pisa, founded in 2003
with the aim of developing nutraceuticals and medical devices. The group
comprises three 100% owned companies: PharmaNutra (nutraceutical company,
established in 2003, active in the oral iron supplement market and in the muscular
pain market), Junia Pharma (established in 2010, focussed on paediatric products)
and Alesco (established in 2000, exclusively for the production and distribution of
ingredients in Italy).
With revenues to the tune of € 46.7m and EBITDA adj. of 25.4% of turnover,
PharmaNutra shows a 21.2% and 33.9% CAGR15-18 respectively.
The group focuses on two main business areas: oral iron supplements (82% of
turnover, with the Sideral product line) and muscle and joint pain relievers (10% of
revenues, with the Cetilar product line, launched in 2016 following the experience
in the same field with Celadrin).
Chart 1 – PharmaNutra, 2018 sales by products and by market
Source: Company data
PharmaNutra operates in 49 nations via distribution agreements with 33 partners:
foreign countries totalled 26% of revenues in 2018 and a higher portion in volumes,
due to the difference in the distribution contract terms (via distributors abroad –
directly in Italy). However, profitability is fairly similar between domestic and foreign
markets.
Main milestones from 2000 to date
2000 Establishment of Alesco, distribution of functional ingredients in Italy
2003 PharmaNutra starts development of nutraceuticals and medical
devices dedicated to adults
2005 Launch of the first PharmaNutra branded product, via a network of
medical science informants with a single mandate
2010 Junia Pharma establishment, production of pharmaceuticals and
paediatric medical devices
2012 Alesco extends its business to proprietary active principles, covered
by patents and produced in Italy (i.e. Ultramins and Ultramir)
2013 First foreign distribution contract
2015 Acquisition of Junia Pharma
2017 Acquisition of a minority stake by IPO Challenger 1 and listing on AIM
Italia
82%10%
8%
Iron supplements Muscle pains Other
74%
38%
26%
62%
0%
20%
40%
60%
80%
100%
Values Volumes
Italy Foreign countries
PharmaNutra SpA
3
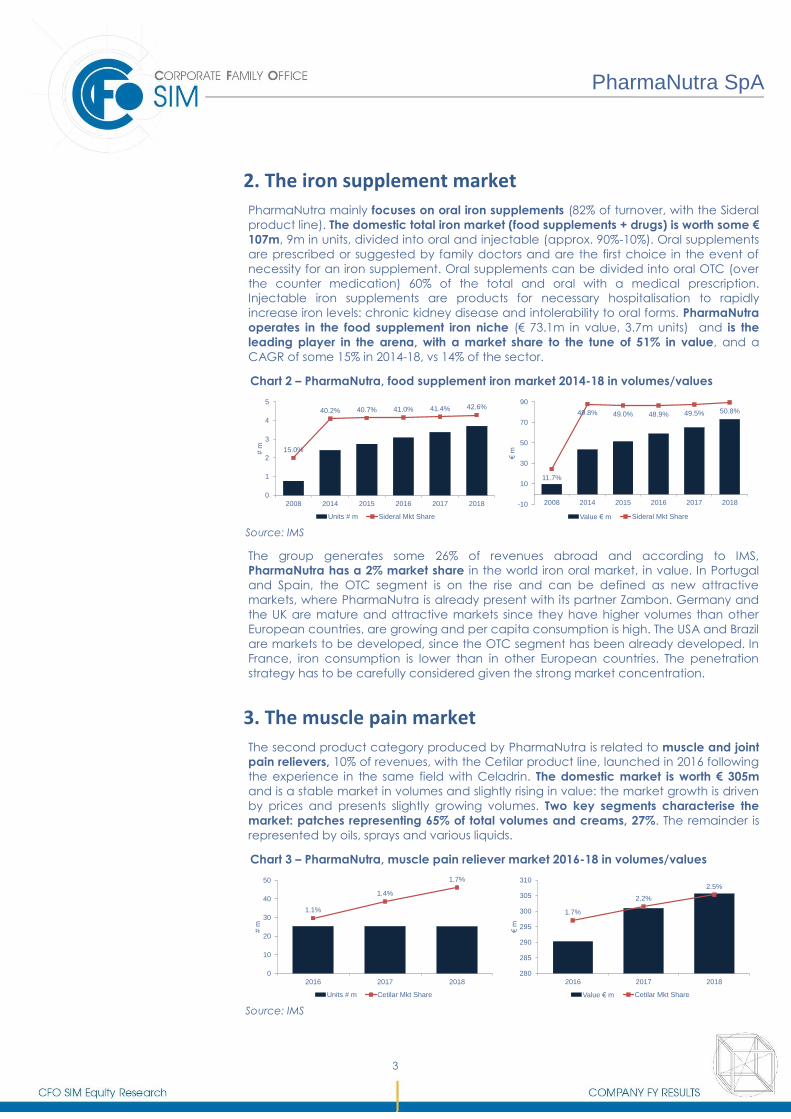
2. The iron supplement market
PharmaNutra mainly focuses on oral iron supplements (82% of turnover, with the Sideral
product line). The domestic total iron market (food supplements + drugs) is worth some €
107m, 9m in units, divided into oral and injectable (approx. 90%-10%). Oral supplements
are prescribed or suggested by family doctors and are the first choice in the event of
necessity for an iron supplement. Oral supplements can be divided into oral OTC (over
the counter medication) 60% of the total and oral with a medical prescription.
Injectable iron supplements are products for necessary hospitalisation to rapidly
increase iron levels: chronic kidney disease and intolerability to oral forms. PharmaNutra
operates in the food supplement iron niche (€ 73.1m in value, 3.7m units) and is the
leading player in the arena, with a market share to the tune of 51% in value, and a
CAGR of some 15% in 2014-18, vs 14% of the sector.
Chart 2 – PharmaNutra, food supplement iron market 2014-18 in volumes/values
Source: IMS
The group generates some 26% of revenues abroad and according to IMS,
PharmaNutra has a 2% market share in the world iron oral market, in value. In Portugal
and Spain, the OTC segment is on the rise and can be defined as new attractive
markets, where PharmaNutra is already present with its partner Zambon. Germany and
the UK are mature and attractive markets since they have higher volumes than other
European countries, are growing and per capita consumption is high. The USA and Brazil
are markets to be developed, since the OTC segment has been already developed. In
France, iron consumption is lower than in other European countries. The penetration
strategy has to be carefully considered given the strong market concentration.
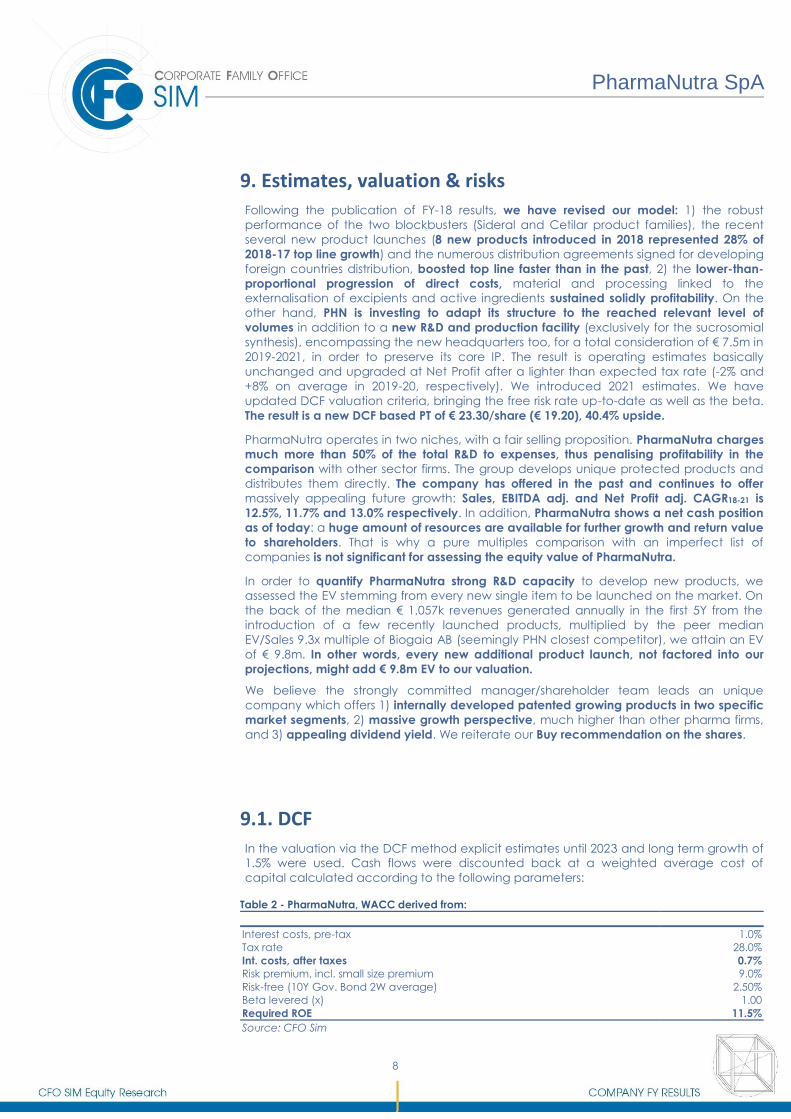
3. The muscle pain market
The second product category produced by PharmaNutra is related to muscle and joint
pain relievers, 10% of revenues, with the Cetilar product line, launched in 2016 following
the experience in the same field with Celadrin. The domestic market is worth € 305m
and is a stable market in volumes and slightly rising in value: the market growth is driven
by prices and presents slightly growing volumes. Two key segments characterise the
market: patches representing 65% of total volumes and creams, 27%. The remainder is
represented by oils, sprays and various liquids.
Chart 3 – PharmaNutra, muscle pain reliever market 2016-18 in volumes/values
Source: IMS
15.0%
40.2% 40.7% 41.0% 41.4% 42.6%
0
1
2
3
4
5
2008 2014 2015 2016 2017 2018
# m
Units # m Sideral Mkt Share
11.7%
49.8% 49.0% 48.9% 49.5% 50.8%
-10
10
30
50
70
90
2008 2014 2015 2016 2017 2018
€m
Value € m Sideral Mkt Share
1.1%
1.4%
1.7%
0
10
20
30
40
50
2016 2017 2018
# m
Units # m Cetilar Mkt Share
1.7%
2.2%
2.5%
280
285
290
295
300
305
310
2016 2017 2018
€m
Value € m Cetilar Mkt Share

PharmaNutra SpA
4
4. Competitive landscape: the iron supplement market
PharmaNutra generates some 82% of revenues, i.e. € 38.3m in 2018, in oral iron
supplements with the Sideral product line. The line is based on the patented proprietary
developed sucrosomial technology: the iron molecule is embedded in two layers so
that the active ingredient passes through the gastric environment without coming into
contact with the mucous membranes and without interacting with other nutrients and is
then fully absorbed. The result is a unique competitive advantage: clinical studies have
shown that the efficacy of Sideral is comparable to intravenous iron and it has better
tolerability and no side effects. That is why PharmaNutra is the market leader in the
domestic OTC oral market with a market share of some 51%.
PharmaNutra has a strong competitive position in a market valued at some € 107m,
characterised by medium price sensitivity and quite a high level of competitive
intensity. It has the top three products in the market: Sideral Forte, Sideral and Sideral
Folico (with prices far above average), then Ferrograd (Teofarma) and Tardyfer (Pierre
Fabre Pharma).
The domestic OTC market is particularly crowded with 250 companies for a total of 435
references. In 2018 52 new products were launched. The top five products have a 53%
market share in value then the rest is highly fragmented: products from 6th to 15th reach
a market share close to 18%. The oral iron market segment with obligatory prescriptions
is stable, with only three references launched from 2010 to date. Prices are lower than
those of OTC products and most are reimbursed by the national healthcare system.
There are currently 20 companies operating in the market for a total of 28 products.
5. Competitive landscape: the muscular pain market
The second business unit of PharmaNutra is the muscle and joint pain segment, 10% of
revenues, with the Cetilar product line, launched in 2016 following the experience in the
same field with Celadrin. This business is characterized by the presence of large
corporations, namely GSK Consumer Health, Bayer, Menarini, Pfizer Consumer Health.
The entire PharmaNutra product category in this market represents some 4% of the total
share in volumes. However, only three months after its launch, Cetilar reached some
1.9% market share in values; it was 2.5% at end-18. PharmaNutra has an interesting
medium competitive position in a market valued at some € 300m, characterised by low
price sensitivity and quite a high level of competitive intensity.
Cetilar focuses on active sporty people and is to be positioned as the top product in the
creams and patches category. It is estimated that Cetilar will achieve a total of some €
18.2m in 2021 made up of some 82% from cream packs (source IMS, market value).
In the cream segment Voltaren Emulgel (GSK CH) is the leading product with a 29%
market share in value, followed by Thermacare (Pfizer) and Voltadol (Menarini) with
shares of some 6% each.

PharmaNutra SpA
5
6. Business model & strategy
PharmaNutra operates mainly in two markets, muscular pain and iron supplements. It
manufactures specific and original products, managing the entire production process
from raw materials to finished product, but outsourcing the production process. The
notable degree of outsourced capacity allows the group production flexibility and lean
capital structure.
In Italy the group directly manages distribution, promotion and sales of its selling
proposition. PharmaNutra scientific salesmen cover the entire distribution chain from
doctors to pharmacies and wholesalers. The group is present indirectly in 49 countries
worldwide via 33 selected distributor partners, amongst the key pharmaceutical and
nutraceutical firms.
R&D totals 3-5% of revenues on average in the last years, o/w less than 50% capitalised.
The efficacy of group products is validated by a significant amount of proprietary
clinical data. To date, PharmaNutra boasts 91published studies, 13 clinical trials in
progress and over 6,000 treated patients. In a highly competitive arena, characterised
by a quick time to market and the presence of pretty similar products, PharmaNutra has
built effective entry barriers represented by the intellectual property.
The group holds 10 patents (10 pending) for reinforcing and protecting its competitive
advantage, 25 brands (12 pending), fundamental to gain market recognition and
create brand awareness, 91 clinical studies to demonstrate the product scientific profile
to doctors and 13 proprietary raw materials to retain the value of the controlling process
of sourcing.
PharmaNutra strategy in the domestic market entails:
the expansion of the commercial network, increasing the current team of 150
(Dec-18) scientific salespersons to some 200 by the end of 2019;
new commercial activities for Cetilar also via umbrella brand development, an
increase in advertising expenditure aimed at direct customers;
the development of new areas of use for oral iron supplements, i.e. in Patient
Blood Management (that is to say the orientation towards good management
of blood during surgical interventions).
Abroad, PharmaNutra is
enlarging its selling proposition to current distributors;
in the process of penetrating new markets, namely the USA, the UK, France,
Poland and Germany, also via new subsidiaries;
The group is also seeking to accelerate growth via acquisitions, chasing not only
products, but also structured and deep rooted selling teams. The search is oriented both
in Italy and abroad.

PharmaNutra SpA
6
7. FY-18 results
PharmaNutra reported once again a soaring set of results, characterised by
pronounced growth driven by foreign sales and a much more than proportional
progression of margins. Figures came in better than our projections.
Table 1 – PharmaNutra, FY-18 results summary
P&L € m 2018 2017 % YoY 2018e %diff. vs. 18e
Revenues 46.7 37.8 23.5 43.2 7.9
Raw material and processing (2.5) (1.8) (2.9)
Services (29.7) (23.8) (26.7)
Personnel expenses (2.8) (2.5) (2.8)
Other opex 0.9 (0.3) 0.3
EBITDA 12.6 9.4 33.2 11.1 13.4
% margin 26.9 25.0 25.7
D&A (0.7) (0.6) (0.7)
EBIT 11.9 8.9 34.5 10.4 15.0
% margin 25.5 23.4 24.0
Financial Income 0.0 0.0 0.1
Financial Costs (0.1) (0.1) (0.2)
Extraordinary 0.0 0.0 0.0
Pre-Tax profit 11.9 8.8 35.2 10.3 15.4
% margin 25.4 23.2 23.8
Income taxes (3.3) (2.7) (3.4)
Tax rate 27.8% 31.2% 33.0%
Minorities 0.0 0.0 0.0
Net Profit 8.6 6.0 41.9 6.9 24.3
% margin 18.3 16.0 15.9
EBITDA adj. 11.8 9.5 24.5 11.1 6.7
% margin 25.4 25.2 25.7
Net Profit adj. 7.8 6.1 28.3 6.9 13.6
% margin 16.8 16.1 15.9
Source: Company data, CFO estimates
Revenues grew 23.5% to € 46.7m, driven by the 15.6% increase in domestic sales and by
the 52.4% rise in foreign turnover, representing 73.5% and 26.5% respectively from 78.5%
and 21.5% of 2017. The strategy to enlarge the weight of foreign countries is
corroborated by numbers and the growth perspectives outside Italy. The robust top line
increase was the result of R&D investments, clinical activities generating a greater
awareness of product efficacy by doctors and a growing quality perception by
consumers and new distribution agreements outside Italy.
EBITDA reported soared more than proportionally to top line, +33.2% reaching € 12.6m
with a 26.9% margin, thanks to the lower-than-proportional progression of direct costs,
material and processing linked to the externalisation process of excipients and active
ingredients which drove the increase in service costs. If we exclude € 0.8m related to
2015-17 R&D tax credits sustained by Pharmanutra and Alesco, EBITDA adj. reached €
11.8m, +24.5% YoY, margin of 25.4% vs. 25.2% in 2017.
Low level of financial charges, and a tax rate decreased to 27.8% (31.2% in FY-17), net
profit soared by 41.9% YoY to € 8.6m, 18.3% margin. Net Profit adj. totalled € 7.8m, up
28.3% YoY.
NFP improved significantly: PharmaNutra had a net cash position for € 11.4m from €
9.1m cash in FY-17, reflecting substantial operating cash flow and the low amount of
capex, evidence of a lean capital structure, explained by the relevant degree of
outsourced production capacity. The BoD will propose the AGM the distribution of an €
0.50/s dividend (62% pay-out, 3.0% yield), o/w € 0.08 extraordinary: ex-dividend date
May 6, 2019, record date on May 7, 2019 and with payment on May 8, 2019.

PharmaNutra SpA
7
8. Recent developments
PharmaNutra has a solid R&D attitude, fed by a fully dedicated research team
supported by R&D expenses to the tune of 3-5% of revenues, with constant new product
launches every year. In 2018, the company launched 8 new products:
Capricare – the only goat milk formula clinically evaluated, is a nutritionally
complete milk made from whole goat milk. It is based on the unique proteins of
goat milk at a level that has been optimised for babies from 6 to 12 months. It
contains the nutrients needed for infants such as lactose, vitamins, minerals and
essential fatty acids from selected vegetable oils.
Neo D3 Forte – a dietary supplement of vegetable DHA, vitamins, phospholipids
and beta-palmitic acid. Vitamin D contributes to the normal absorption and
use of calcium and phosphorus and intervenes in the cell division process.
SiderAL Folico30 is the new, practical stick version of Sucrosomial Iron for oral
use, whose dosage was increased from 21 to 30 mg, with Quaterfolic a new
Folic Acid in active form, and is useful for preventing iron deficiency in women
at different stages of life.
UltraMag, an entirely Sucrosomial magnesium based dietary supplement. Initial
market reaction is supportive: with 10,000 units sold in the very first month alone,
UltraMag is the most successful product launch in the history of the group. These
results are backed up not only by scientific evidence, but also by the positive
feedback recorded by doctors, pharmacists and consumers, who confirm that
the new Sucrosomial magnesium is particularly effective in terms of rapid
absorption and tolerability.
SiderAL H is a new formula of Sucrosomial Iron in powder to be taken dissolved
in water expressly developed for hospital use and is a valid alternative to more
invasive treatments such as intravenous iron therapy.
Apportal, the first complete nutritional supplement with 5 minerals (iron,
selenium, zinc, iodine, magnesium) based on the Sucrosomial Technology,
vitamins, amino acids and vegetable extracts. All the minerals in Apportal are
enhanced with Sucrosomial Technology, to develop a unique product, with
muscular antioxidants, immunomodulatory, toning and energizing properties.
SiderAL Gocce Forte is a new formula in drops, with a higher dosage of
Sucrosomial Iron (14mg/ml), developed for cases of serious iron deficiency.
SiderAL Oro 14 is the new, practical stick version of Sucrosomial Iron for oral use,
whose dosage was increased from 12 to 14 mg, corresponding to 100% of the
Daily Recommended Nutritional Value, and is useful for preventing iron
deficiency or treating lack of energy in adolescents and the elderly.
Abroad, PharmaNutra in 2018 has signed seven new distribution agreements: in Vietnam
(including also Laos, Cambodia and Burma), Malaysia (with Singapore), South
Africa/Namibia, Egypt (with Al-Esraa Pharmaceutical Optima), Poland (with
Pharmapoint) in the first part of the year and in Switzerland (Fresenius Kabi) in
September, in Thailand in December (American Taiwan Biopharm). During the first
months of 2019 the company signed three other distribution agreements: in Pakistan in
January (with Trigen Pharma International) and in Greece and Ukraine in February (with
WinMedica and Medintorg respectively). Currently, there are 16 new negotiations
ongoing in other areas. In addition, PharmaNutra is supporting the efficacy of its selling
proposition presenting clinical evidence at the most important overseas scientific
conferences. Moreover PharmaNutra is expanding the distribution agreements with
existing partners to new products such as Ultramag and Cetilar. In particular, thanks to
the agreement signed with Renapharma, (partner of PharmaNutra since 2014 for the
distribution of SiderAL® Forte in the Scandinavian region), Cetilar® will be soon available
in Sweden and Norway. In addition, a contract with Fresenius Kabi Austria for the launch
of Ultramag and Cetilar in Austria.
PharmaNutra SpA
8
9. Estimates, valuation & risks
Following the publication of FY-18 results, we have revised our model: 1) the robust
performance of the two blockbusters (Sideral and Cetilar product families), the recent
several new product launches (8 new products introduced in 2018 represented 28% of
2018-17 top line growth) and the numerous distribution agreements signed for developing
foreign countries distribution, boosted top line faster than in the past, 2) the lower-than-
proportional progression of direct costs, material and processing linked to the
externalisation of excipients and active ingredients sustained solidly profitability. On the
other hand, PHN is investing to adapt its structure to the reached relevant level of
volumes in addition to a new R&D and production facility (exclusively for the sucrosomial
synthesis), encompassing the new headquarters too, for a total consideration of € 7.5m in
2019-2021, in order to preserve its core IP. The result is operating estimates basically
unchanged and upgraded at Net Profit after a lighter than expected tax rate (-2% and
+8% on average in 2019-20, respectively). We introduced 2021 estimates. We have
updated DCF valuation criteria, bringing the free risk rate up-to-date as well as the beta.
The result is a new DCF based PT of € 23.30/share (€ 19.20), 40.4% upside.
PharmaNutra operates in two niches, with a fair selling proposition. PharmaNutra charges
much more than 50% of the total R&D to expenses, thus penalising profitability in the
comparison with other sector firms. The group develops unique protected products and
distributes them directly. The company has offered in the past and continues to offer
massively appealing future growth: Sales, EBITDA adj. and Net Profit adj. CAGR18-21 is
12.5%, 11.7% and 13.0% respectively. In addition, PharmaNutra shows a net cash position
as of today: a huge amount of resources are available for further growth and return value
to shareholders. That is why a pure multiples comparison with an imperfect list of
companies is not significant for assessing the equity value of PharmaNutra.
In order to quantify PharmaNutra strong R&D capacity to develop new products, we
assessed the EV stemming from every new single item to be launched on the market. On
the back of the median € 1,057k revenues generated annually in the first 5Y from the
introduction of a few recently launched products, multiplied by the peer median
EV/Sales 9.3x multiple of Biogaia AB (seemingly PHN closest competitor), we attain an EV
of € 9.8m. In other words, every new additional product launch, not factored into our
projections, might add € 9.8m EV to our valuation.
We believe the strongly committed manager/shareholder team leads an unique
company which offers 1) internally developed patented growing products in two specific
market segments, 2) massive growth perspective, much higher than other pharma firms,
and 3) appealing dividend yield. We reiterate our Buy recommendation on the shares.
9.1. DCF
In the valuation via the DCF method explicit estimates until 2023 and long term growth of
1.5% were used. Cash flows were discounted back at a weighted average cost of
capital calculated according to the following parameters:
Table 2 - PharmaNutra, WACC derived from:
Interest costs, pre-tax 1.0%
Tax rate 28.0%
Int. costs, after taxes 0.7%
Risk premium, incl. small size premium 9.0%
Risk-free (10Y Gov. Bond 2W average) 2.50%
Beta levered (x) 1.00
Required ROE 11.5%
Source: CFO Sim

PharmaNutra SpA
9
Risk premium at 9.0% factors in the minute size of the company and basically all AIM
Italia market segment related concerns and disquiets that an investor might have. Beta
at 1.00x has been calculated taking peer group specific levered beta for each
competitor, deleveraging it using each peer precise D/E structure, then leveraging it for
PharmaNutra 40/60 debt/equity long term sustainable balance sheet structure.
Table 3 - PharmaNutra, DCF model
€ m 2019e 2020e 2021e 2022e 2023e Term. Val.
EBIT 11.9 13.7 15.7 17.4 19.1
Tax rate 28.0% 28.0% 28.0% 28.0% 28.0%
Operating profit (NOPAT) 8.5 9.8 11.3 12.5 13.8
Change working capital 2.2 1.5 (0.6) (0.5) (0.1)
Depreciation 0.7 0.8 0.8 0.9 1.0
Investments (4.3) (3.8) (1.7) (1.7) (1.0)
Free Cash Flows 7.1 8.3 9.8 11.2 13.7 243.8
Present value 6.8 7.4 8.1 8.6 9.8 175.1
WACC 7.2% 7.2% 7.2% 7.2% 7.2%
Long-term growth rate 1.5%
Source: CFO Sim
Table 4 – PharmaNutra, DCF equity value derived from:
Total EV present value € m 215.8
thereof terminal value 81.1%
NFP FY-18 11.4
Pension provision FY-18 (1.7)
Equity value € m 225.5
#m shares 9.68
Equity value €/s 23.30
% upside/(downside) 40.4%
Source: CFO Sim
The application of the model produces an equity value of € 225.5m, corresponding to €
23.30/share (€ 19.20), 40.4% upside to current price.
The following tables illustrate that sensitivity 1) compared to changes in the terminal
growth rate produces an equity value of between € 20.43-27.36/s (perpetuity range of
between 0.50% and +2.50%), while 2) compared to changes in the free risk rate produces
an equity value of € 21.07-26.04/s (free risk range of between 3.50% and 1.50%) and 3)
compared to changes in the risk premium, including small size premium results into an
equity value of € 19.23-29.53/s (risk premium range of between 11.0%% and 7.0%).
Table 5 – PharmaNutra, equity value sensitivity to changes in terminal growth rate
€ m 0.50% 0.75% 1.00% 1.25% 1.50% 1.75% 2.00% 2.25% 2.50%
Present value of CF 40.7 40.7 40.7 40.7 40.7 40.7 40.7 40.7 40.7
PV of terminal value 147.5 153.6 160.2 167.3 175.1 183.6 192.9 203.2 214.6
Total value 188.1 194.3 200.9 208.0 215.8 224.3 233.6 243.9 255.2
NFP last reported (FY-18) 11.4 11.4 11.4 11.4 11.4 11.4 11.4 11.4 11.4
Pension provision FY-18 (1.7) (1.7) (1.7) (1.7) (1.7) (1.7) (1.7) (1.7) (1.7)
Equity value 197.8 203.9 210.5 217.7 225.5 234.0 243.3 253.6 264.9
Equity value/share € 20.43 21.06 21.75 22.49 23.30 24.17 25.13 26.19 27.36
Source: CFO Sim
Table 6 – PharmaNutra, equity value sensitivity to changes in free risk rate
€ m 1.50% 1.75% 2.00% 2.25% 2.50% 2.75% 3.00% 3.25% 3.50%
Present value of CF 41.4 41.2 41.0 40.9 40.7 40.5 40.4 40.2 40.0
PV of terminal value 201.1 194.0 187.3 181.1 175.1 169.5 164.1 159.1 154.2
Total value 242.4 235.2 228.4 221.9 215.8 210.0 204.5 199.2 194.3
NFP last reported (FY-18) 11.4 11.4 11.4 11.4 11.4 11.4 11.4 11.4 11.4
Pension provision FY-18 (1.7) (1.7) (1.7) (1.7) (1.7) (1.7) (1.7) (1.7) (1.7)
Equity value 252.1 244.9 238.0 231.6 225.5 219.7 214.2 208.9 203.9
Equity value/share € 26.04 25.29 24.59 23.92 23.30 22.69 22.12 21.58 21.07
Source: CFO Sim

PharmaNutra SpA
10
Table 7 – PharmaNutra, equity value sensitivity to changes in risk premium
€ m 7.00% 7.50% 8.00% 8.50% 9.00% 9.50% 10.00% 10.50% 11.00%
Present value of CF 42.1 41.7 41.4 41.0 40.7 40.4 40.0 39.7 39.4
PV of terminal value 234.2 216.6 201.1 187.3 175.1 164.1 154.2 145.3 137.1
Total value 276.2 258.3 242.4 228.4 215.8 204.5 194.3 185.0 176.5
NFP last reported (FY-18) 11.4 11.4 11.4 11.4 11.4 11.4 11.4 11.4 11.4
Pension provision FY-18 (1.7) (1.7) (1.7) (1.7) (1.7) (1.7) (1.7) (1.7) (1.7)
Equity value 285.9 267.9 252.1 238.0 225.5 214.2 203.9 194.7 186.2
Equity value/share € 29.53 27.68 26.04 24.59 23.30 22.12 21.07 20.11 19.23
Source: CFO Sim
9.2. Market multiples
We have reshuffled our peer list, trying to identify the closest competitors of PharmaNutra
in terms of business model, reach and size. We have picked 9 pharmaceutical firms: our
panel now comprises Bachem Holding AG (manufactures ingredients for
pharmaceuticals, generic drugs, and research supplies), Biogaia AB (seemingly the
closest comparable within the sample - develops and markets health care products and
sells foods with healthy additives and nutritional products with therapeutic effects for
adults and children), Cambrex Corp (supplies products, services, and technologies for
the Life Sciences and fine chemicals industry, small molecule Active Pharmaceutical
Ingredients - APIs), Consort Medical PLC (develops and manufactures metered dose
inhaler valves actuators, compliance-aids, dry powder devices, disposable face masks,
breathing circuits and laryngeal tubes to pharmaceutical companies), Faes Pharma SA
(develops, manufactures and markets pharmaceutical products, prescription products
combat cardiovascular, respiratory, central nervous system, musculoskeletal and
osteoporosis related ailments), Laboratorio Reig Jofre SA (research, development,
manufacturing, and marketing of medicines and nutritional supplements), Recipharm AB
(specialises in contract development and manufacture of pharmaceuticals of products
in forms that include solid dose, granulates and powders, liquids, sprays, ecc), Siegfried
Holding AG (development services and the production of active pharmaceutical
ingredients (API), intermediates, controlled and standard substances, and complex
formulations) and Usana Health Science Inc (develops, manufactures, and markets
nutritionals, personal care, and weight management products).
PharmaNutra operates in two distinctive market segments, with a fair selling proposition.
Contrarily to the other players, which buy IP from third parties and capitalise R&D almost
entirely, PharmaNutra charges much more than 50% of the total R&D to expenses, thus
penalising profitability in the comparison. The group develops unique protected products
and distributes them directly. The group has offered in the past and continues to offer
massively appealing future growth: Sales, EBITDA adj. and Net Profit adj. CAGR18-21 is
12.5%, 11.7% and 13.0% respectively, much higher than peers. In addition, PharmaNutra
shows a net cash position in 2018, only 2 players within the sample do the same: a huge
amount of resources are available for further growth and return value to shareholders. The
group is the smallest in the list in terms of turnover and has an EBITDA margin much higher
than peer average.
That is why a pure multiple comparison with this list is not particularly significant for
assessing the equity value of PharmaNutra but rather a methodology to substantiate the
value obtained via DCF.

PharmaNutra SpA
11
Table 8 – PharmaNutra, peer group summary table
€ m Mkt Cap Sales
FY1
EBITDA
FY1 EBITDA %
Sales
CAGR18-21
EBITDA
CAGR18-21
EBIT
CAGR18-21
Net Profit
CAGR19-21
NFP
FY1
NFP
/EBITDA
Bachem Holding AG 721 267 75 28.2% 6.5% 8.0% 10.4% 11.3% 101 1.3
Biogaia AB 755 78 27 34.6% 12.9% 12.7% 12.8% 20.8% (31) (1.2)
Cambrex Corp 1,136 571 138 24.2% 10.1% 4.9% 1.4% 21.1% 343 2.5
Consort Medical PLC 493 356 64 18.0% 2.3% 0.8% 5.7% 16.1% 103 1.6
Faes Farma SA 988 356 84 23.8% 5.4% 11.3% 12.5% 8.5% (61) (0.7)
Laboratorio Reig Jofre SA 162 183 18 9.9% 4.8% 17.9% 17.9% 28.7% 45 2.5
Recipharm AB (publ) 677 697 115 16.4% 6.5% 9.9% 22.3% 18.7% 303 2.6
Siegfried Holding AG 1,356 744 132 17.7% 5.9% 10.8% 17.9% 11.1% 162 1.2
USANA Health Sciences Inc 1,777 1,135 200 17.6% 6.7% 7.8% 6.0% 6.1% (296) (1.5)
Median 755 356 84 18.0% 6.5% 9.9% 12.5% 16.1% 101 1.3
PharmaNutra 161 53 13 23.6% 12.5% 11.7% 11.9% 9.6% (15) (1.2)
Source: Thomson Reuters Eikon, CFO Sim
Table 9 – PharmaNutra, peer group multiples table
EV & Price multiples x PER
FY1
PER
FY2
PER
FY3
Sales
FY1
Sales
FY2
Sales
FY3
EBITDA
FY1
EBITDA
FY2
EBITDA
FY3
EBIT
FY1
EBIT
FY2
EBIT
FY3
Bachem Holding AG 16.5 14.3 13.3 3.07 2.80 2.73 10.9 9.8 9.5 14.8 12.9 12.6
Biogaia AB 37.0 30.0 25.4 9.27 7.90 6.72 26.8 21.5 18.0 27.6 22.1 18.5 Cambrex Corp 20.4 20.3 13.9 2.59 2.40 2.18 10.7 9.9 8.9 16.4 14.8 13.2 Consort Medical PLC 16.0 14.3 11.9 1.67 1.60 1.48 9.3 8.6 7.8 12.8 11.9 11.6 Faes Farma SA 16.1 13.7 13.7 2.61 2.36 2.36 11.0 9.0 9.0 12.5 10.2 10.2 Laboratorio Reig Jofre SA 23.2 19.1 14.0 1.13 1.08 1.00 11.5 9.8 8.0 22.5 18.9 14.0 Recipharm AB (publ) 19.5 15.5 13.8 1.41 1.27 1.23 8.6 7.5 7.2 16.5 13.5 12.1 Siegfried Holding AG 20.7 17.3 16.7 2.04 1.95 1.89 11.5 10.4 10.3 17.4 15.1 14.0 USANA Health Sciences Inc 15.2 13.7 n.a. 1.31 1.16 n.a. 7.4 6.5 n.a. 8.5 7.5 n.a.
Median 19.5 15.5 13.9 2.04 1.95 2.04 10.9 9.8 9.0 16.4 13.5 12.9
PharmaNutra 20.6 18.9 16.3 3.20 2.74 2.38 12.6 11.6 9.8 13.4 12.3 10.3
% prem./(disc.) to peers 5.5 22.0 17.9 56.9 40.1 16.5 15.6 18.5 9.2 (18.4) (9.4) (19.9)
Source: Thomson Reuters Eikon, CFO Sim
Looking at EV/EBIT stock trades at double digit discount. If we take into consideration the
closest peers within the sample, Biogaia AB, PharmaNutra trades at huge discount, only
partially explained by current lower profitability.

PharmaNutra SpA
12
9.3. Stock performance
PharmaNutra was listed on AIM Italia (Alternative Investment Market) on the 18th July 2017
at € 10.0/share, corresponding to a market capitalization post money of € 89.5m, through
the pre-booking company IPO Challenger 1, whose investors/ex-bondholders were
reimbursed in kind with the listed shares and warrants of PharmaNutra, becoming direct
shareholders and free float of the company.
Pharmanutra reached 1Y max of € 17.90 last 21-Feb-19 and 1Y min of € 12.60 last 23-Mar-
18. The PharmaNutra shares outperformed peer median and indexes and EU sector at 1Y.
Table 10 - PharmaNutra, peers group and indexes absolute performance
% 1D 1W 1M 3M 6M YTD 1Y
Bachem Holding AG (0.3) (4.5) 8.2 9.6 (6.6) 4.9 1.2
Biogaia AB 2.6 (0.7) 7.5 49.6 2.6 48.7 16.0
Cambrex Corp (2.7) (3.4) (5.4) 0.6 (37.6) 1.1 (28.5)
Consort Medical PLC (1.4) 1.2 (6.5) 4.3 (30.0) (8.6) (22.4)
Faes Farma SA 0.4 3.2 7.1 17.1 (1.7) 19.0 30.0
Laboratorio Reig Jofre SA 0.8 (2.0) (5.3) 7.8 (4.6) 8.8 8.9
Recipharm AB (publ) (1.6) (1.8) 3.1 19.3 (8.7) 18.9 46.1
Siegfried Holding AG (1.2) (0.8) (0.6) 7.0 (21.7) 6.5 5.0
USANA Health Sciences Inc (2.5) (6.3) (16.8) (24.4) (27.7) (26.8) 4.2
Median (1.2) (1.8) (0.6) 7.8 (8.7) 6.5 5.0
MSCI World Index (1.6) (0.7) 0.4 14.2 (4.8) 11.2 1.1
EURO STOXX (1.8) (2.1) 0.8 10.7 (5.1) 10.5 (2.7)
EURO STOXX Health Care (1.9) (4.4) (0.8) 4.8 (8.9) 5.1 (4.2)
FTSE Pharma & Biothech (0.0) (2.3) (2.2) (0.6) (17.4) (2.4) (3.5)
FTSE AIM Italia (0.0) 0.5 1.0 6.0 (7.9) 4.9 (7.2)
FTSE STAR (0.9) (0.2) 3.1 16.6 (8.5) 14.3 (5.6)
FTSE MIB Italia (1.4) 0.2 4.0 14.6 (2.1) 15.0 (5.9)
PharmaNutra SpA (1.5) 0.6 (1.8) 7.8 9.2 9.9 29.2
Source: Thomson Reuters Eikon
Table 11 – PharmaNutra relative performances
% 1D 1W 1M 3M 6M YTD 1Y
PHNU to Peer Median (0.2) 2.4 (1.2) (0.0) 17.9 3.4 24.2
FTSE AIM Italia (1.5) 0.1 (2.8) 1.8 17.1 5.0 36.4
FTSE STAR Italia (0.5) 0.8 (4.9) (8.8) 17.7 (4.4) 34.8
FTSE MIB Italia (0.1) 0.4 (5.8) (6.8) 11.3 (5.1) 35.1
EU Sector (1.5) 2.9 0.4 8.4 26.6 12.4 32.7
Source: Thomson Reuters Eikon
9.4. Risks
The principal investment risks in PharmaNutra include:
impacts on economics and balance sheet profile triggered by a deep decline in
local and global economic growth,
impact on profitability deriving from changes in the legislation environment,
risks related to product responsibility and collateral effects,
longer than expected distribution authorization procedures in existing or new
markets,
risks related to relevant competition in the reference markets,
dilution on profitability stemming from the acquisition campaign.

PharmaNutra SpA
13
10. SWOT Analysis
S.W.O.T. ANALYSIS
Strong recognised leadership in the
iron supplement market with a share
close to 50%
The company basically operates in
only two segments
Massive cash flow generation and a
sound balance sheet allow external
growth opportunities and appealing
dividend yield
PharmaNutra products are not
refundable by the national health
systems.
Strong internally developed IP
protected blockbuster products
Cetilar, recently launched, is still in an
early stage of development
Cetilar boasts more effective clinical
study results than other recent
launches
80% of revenues from iron supplements:
highly concentrated turnover
Strong team of motivated
managers/shareholders
Cetilar growth perspectives driven by
advertising expenditures
Expansion via external growth might
erode marginality to a certain extent
Foreign markets further expansion
led by iron supplements
Quite crowded markets, with several
new product launches
Growth opportunities for iron
supplement in Patient Blood
Management
Legislation environment changes might
affect profitability
STRENGTHS WEAKNESSES
OPPORTUNITIES THREATS

PharmaNutra SpA
14
Income statement (€ m) 2017 2018 2019e 2020e 2021e
Revenues 37.8 46.7 53.2 59.5 66.4
Raw material and processing (1.8) (2.5) (2.8) (3.2) (3.5)
Services (23.8) (29.7) (34.8) (38.6) (42.5)
Personnel expenses (2.5) (2.8) (3.2) (3.6) (4.0)
Other opex/revenues (0.3) 0.9 0.2 0.2 0.1
EBITDA 9.4 12.6 12.5 14.4 16.5
D&A (0.6) (0.7) (0.7) (0.8) (0.8)
EBIT 8.9 11.9 11.9 13.7 15.7
Financial Income 0.0 0.0 0.1 0.1 0.1
Financial Costs (0.1) (0.1) (0.1) (0.1) (0.1)
Extraordinary 0.0 0.0 0.0 0.0 0.0
Pre-Tax profit 8.8 11.9 11.8 13.7 15.7
Income taxes (2.7) (3.3) (3.3) (3.8) (4.4)
Minorities 0.0 0.0 0.0 0.0 0.0
Net Profit 6.0 8.6 8.5 9.8 11.3
EBITDA adj. 9.5 11.8 12.5 14.4 16.5
EBIT adj. 8.9 11.2 11.9 13.7 15.7
Net Profit adj. 6.1 7.8 8.5 9.8 11.3
Balance sheet (€ m) 2017 2018 2019e 2020e 2021e
Net Working Capital 7.1 8.5 6.2 4.8 5.4
Net Fixed Assets 5.8 5.9 9.6 12.6 13.4
Equity Investments 0.3 0.3 0.0 0.0 0.0
Other M/L Term A/L (3.2) (1.6) (2.8) (3.0) (3.4)
Net Invested Capital 10.0 13.1 13.0 14.3 15.4
Net Financial Position (9.1) (11.4) (15.1) (19.4) (24.6)
Minorities 0.0 0.0 0.0 0.0 0.0
Group's Shareholders Equity 19.1 24.4 28.1 33.7 40.1
Net Financial Position & Equity 10.0 13.1 13.0 14.3 15.4
Cash Flow statement (€ m) 2017 2018 2019e 2020e 2021e
Total net income 6.0 8.6 8.5 9.8 11.3
Depreciation 0.6 0.7 0.7 0.8 0.8
Other non-cash charges 0.8 (2.4) 1.3 0.2 0.2
Cash Flow from Oper. (CFO) 7.4 6.8 10.5 10.8 12.3
Change in NWC (1.5) (1.4) 2.2 1.5 (0.6)
FCF from Operations (FCFO) 6.0 5.4 12.7 12.2 11.7
Net Investments (CFI) (1.4) (1.3) (4.3) (3.8) (1.7)
Free CF to the Firm (FCFF) 4.6 4.1 8.4 8.5 10.0
CF from financials (CFF) 7.4 (3.0) (4.8) (4.3) (4.9)
Free Cash Flow to Equity (FCFE) 12.0 1.1 3.6 4.2 5.1
Financial ratios 2017 2018 2019e 2020e 2021e
EBITDA adj. margin 25.2% 25.4% 23.6% 24.3% 24.8%
EBIT margin 23.4% 25.5% 22.3% 23.0% 23.6%
Net profit adj. margin 16.1% 16.8% 16.0% 16.5% 17.0%
Tax rate 31.2% 27.8% 28.0% 28.0% 28.0%
Interest coverage x 0.01 0.01 0.01 0.01 0.01
Net Debt/EBITDA x (0.96) (0.90) (1.20) (1.34) (1.49)
Debt-to-Equity x (0.48) (0.47) (0.54) (0.58) (0.61)
ROIC 60.3% 65.5% 65.4% 68.8% 73.0%
ROCE 33.6% 37.2% 33.0% 32.6% 32.2%
ROACE 45.6% 40.8% 34.9% 35.1% 34.6%
ROE 31.6% 35.0% 30.3% 29.2% 28.2%
Payout ratio 52.4% 61.9% 50.0% 50.0% 50.0%
Per share figures 2017 2018 2019e 2020e 2021e
Number of issued ordinary shares # m 9.68 9.68 9.68 9.68 9.68
Number of shares Fully Diluted # m 9.68 9.68 9.68 9.68 9.68
Average Number of shares Fully Diluted # m 9.68 9.68 9.68 9.68 9.68
EPS reported € 0.62 0.88 0.88 1.02 1.17
EPS adjusted € 0.63 0.81 0.88 1.02 1.17
EPS reported FD € 0.62 0.88 0.88 1.02 1.17
EPS adjusted FD € 0.63 0.81 0.88 1.02 1.17
EBITDA € 0.98 1.30 1.29 1.49 1.70
EBIT € 0.92 1.23 1.23 1.41 1.62
BV € 1.97 2.52 2.90 3.48 4.14
FCFO € 0.62 0.56 1.31 1.26 1.21
FCFF € 0.47 0.43 0.87 0.87 1.03
FCFE € 1.23 0.12 0.37 0.43 0.52Dividend € 0.33 0.50 0.44 0.51 0.58

PharmaNutra SpA
15
The company in a nutshell
PharmaNutra is a global pharmaceutical firm, headquartered in Pisa, founded in 2003 with the aim of developing nutraceuticals
and medical devices. The group comprises three 100% owned companies: PharmaNutra (nutraceutical company, established in
2003, active in the oral iron supplement market and in the muscular pain relief market), Junia Pharma (established in 2010,
focussed on paediatric products) and Alesco (established in 2000, exclusively for the production and distribution of ingredients in
Italy). With revenues to the tune of € 46.7m and EBITDA adj. of 25.4% of turnover, PharmaNutra shows a 21.2% and 33.9% CAGR15-18
respectively. The group focuses on two main business areas: oral iron supplements (82% of turnover, with the Sideral product line)
and muscle and joint pain relief (10% of revenues, with the Cetilar product line, launched in 2016 following the experience in the
same field with Celadrin). PharmaNutra operates in 49 nations via distribution agreements: foreign countries totalled 26% of
revenues in 2018.
PharmaNutra was listed on AIM Italia (Alternative Investment Market) on 18 July 2017 at € 10.0/share, corresponding to a market
capitalization post money of € 89.5m (including the Price Adjustment Shares detained by PharmaNutra core shareholders),
through the pre-booking company IPO Challenger 1, whose investors/ex-bondholders were reimbursed in kind with the listed
shares and warrants of PharmaNutra, becoming direct shareholders and free float of the company.
2018 Turnover by product
2018 Turnover by country
Shareholder structure
# m %
A. Lacorte 2.973 30.7%
R. Lacorte 2.175 22.5%
Beda S.r.l. 0.943 9.7%
G. Lazzarini 0.798 8.2%
Other 0.363 3.7%
Historical PHN Shareholders 7.250 74.9%
IPOC Srl 0.284 2.9%
Free Float 2.147 22.2%
o/w IPO Club 0.496 5.1%
Total 9.681 100.0%
Source: Thomson Reuters Eikon, Company data
Peer group absolute performance
1D 1W 1M 3M 6M YTD
Bachem Holding AG (0.3) (4.5) 8.2 9.6 (6.6) 4.9
Biogaia AB 2.6 (0.7) 7.5 49.6 2.6 48.7
Cambrex Corp (2.7) (3.4) (5.4) 0.6 (37.6) 1.1
Consort Medical PLC (1.4) 1.2 (6.5) 4.3 (30.0) (8.6)
Faes Farma SA 0.4 3.2 7.1 17.1 (1.7) 19.0
Laboratorio Reig Jofre SA 0.8 (2.0) (5.3) 7.8 (4.6) 8.8
Recipharm AB (publ) (1.6) (1.8) 3.1 19.3 (8.7) 18.9
Siegfried Holding AG (1.2) (0.8) (0.6) 7.0 (21.7) 6.5
USANA Health Sciences Inc (2.5) (6.3) (16.8) (24.4) (27.7) (26.8)
Median (1.2) (1.8) (0.6) 7.8 (8.7) 6.5
PharmaNutra SpA (1.5) 0.6 (1.8) 7.8 9.2 9.9
Source: Thomson Reuters Eikon
Peers group multiples table
Price & EV multiples x PER FY1 PER FY2 PER FY3 Sales FY1 Sales FY2 Sales FY3 EBITDA FY1 EBITDA FY2 EBITDA FY3
Bachem Holding AG 16.5 14.3 13.3 3.07 2.80 2.73 10.9 9.8 9.5
Biogaia AB 37.0 30.0 25.4 9.27 7.90 6.72 26.8 21.5 18.0
Cambrex Corp 20.4 20.3 13.9 2.59 2.40 2.18 10.7 9.9 8.9
Consort Medical PLC 16.0 14.3 11.9 1.67 1.60 1.48 9.3 8.6 7.8
Faes Farma SA 16.1 13.7 13.7 2.61 2.36 2.36 11.0 9.0 9.0
Laboratorio Reig Jofre SA 23.2 19.1 14.0 1.13 1.08 1.00 11.5 9.8 8.0
Recipharm AB (publ) 19.5 15.5 13.8 1.41 1.27 1.23 8.6 7.5 7.2
Siegfried Holding AG 20.7 17.3 16.7 2.04 1.95 1.89 11.5 10.4 10.3
USANA Health Sciences Inc 15.2 13.7 n.a. 1.31 1.16 n.a. 7.4 6.5 n.a.
Median 19.5 15.5 13.9 2.04 1.95 2.04 10.9 9.8 9.0
PharmaNutra 20.6 18.9 16.3 3.20 2.74 2.38 12.6 11.6 9.8
Source: CFO Sim, Thomson Reuters Eikon
82%10%
8%
Iron supplements Muscle pains Other
74%
38%
26%
62%
0%
20%
40%
60%
80%
100%
Values Volumes
Italy Foreign countries

PharmaNutra SpA
16
ANALYST CERTIFICATION
This publication was prepared by LUCA ARENA, Head of the Equity Research Department of “Corporate Family Office SIM S.p.A.” (“CFO SIM”) and
GIANLUCA MOZZALI, Equity Analyst of CFO SIM. This is to certify that the views expressed on the companies mentioned in this document reflect the
analysts’ personal opinions and that no direct or indirect recompense has been, or will be, received by the analyst further to the views expressed herein.
DISCLAIMER
This document has been drafted by CFO SIM, authorised by the Bank of Italy to provide investment services. CFO SIM does not have a specific interest in
either the issuer, the financial instruments or the transactions covered by the analysis. The news and data used in this document come from information
supplied to the public by the company concerned and/or from other documentation of public domain. CFO SIM is not liable for the accuracy,
completeness, exactitude and impartiality of such news and data. This document has been drafted autonomously and independently and without the
collaboration of the company analysed or of any company linked to the latter by shareholdings or control. This document has been prepared by the
financial analysts of the Equity Research Department of CFO SIM, whose names are indicated therein. LUCA ARENA, Head of the Equity Research
Department of CFO SIM is an ordinary member of the Italian Association of Financial Analysts (AIAF). In no case can the company and the analysts, as
authors of this document be held liable (culpably or otherwise) for damage stemming from use of the information or opinions set out therein. The
purpose of this document is solely informative. The document cannot be reproduced directly or indirectly and redistributed to third parties, nor can it be
published, either totally or in part, for any reason whatsoever. This document is not an invitation to purchase, nor is it intended to solicit the purchase or
sale of the securities in question. The recipients of this document are formally bound to observe the constraints indicated above. CFO SIM wishes to
provide ongoing coverage of the stocks mentioned in this document, with a frequency depending on circumstances considered to be important
(corporate events and changes of recommendation, etc.). CFO SIM acts as a Nominated Adviser, Specialist and Corporate Broker for PharmaNutra
stock, listed on the AIM Italia. The next table shows the ratings issued on the stock in the last 24 months.
DATE TARGET PRICE RATING
25/03/2019 €23.30 BUY
04/10/2018 €19.20 BUY
19/04/2018 €17.70 BUY
19/09/2017 €13.70 NEUTRAL
18/07/2017 €13.20 BUY
This document is distributed via electronic mail and fax as from the date indicated in the document itself and addressed to over 300 Italian and non-
Italian professional investors. The document is available in electronic format at CFO SIM’s Internet site, to Italian and non-Italian institutional investors,
and/or in Borsa Italiana’s Internet site.
RATING SYSTEM
a BUY rating is assigned if the target price is at least 15% higher than the market price;
a SELL rating is assigned if the target price is at least 15% lower than the market price;
a NEUTRAL rating is assigned if the difference between the current price and target price lies within the +/ -15% bands identified using the
preceding criteria.
The rating is determined on the basis of the expected absolute return 12 months forward and not on the basis of the estimated out/underperformance
relative to a market index. Thus, the rating can be directly linked with the estimated percentage difference between current price and target price. The
prices of the financial securities mentioned in the report (also used for the calculation of market capitalisation and market multiples) are the reference
prices of the stock market trading day preceding the publication date of the report, otherwise stated.
12.5
14.0
15.5
17.0
18.5
20.0
21.5
23.0
mar-18 apr-18 mag-18 giu-18 ago-18 set-18 ott-18 nov-18 dic-18 gen-19 feb-19
Pharmanutra S.p.A. Target Price
CORPORATE FAMILY OFFICE SIM S.p.A.
Società di Intermediazione Mobiliare
Capitale Sociale Euro 2.500.000,00 i.v.
Aderente al Fondo Nazionale di Garanzia
Sede: Via dell’Annunciata, 23/4 ∙20121 Milano
Tel. +39 02 30343.1 ∙ Fax. +39 02 30343.243
E-mail: [email protected]
Unità locale: Viale della Libertà, 67 ∙ 33170 Pordenone
Tel. +39 0434 5467.11∙ Fax. +39 0434 5467.99
www.cfosim.com


![Complaint [Word] - ADA.gov Web viewFla. Stat. §§ 20.43, 391.016, 391.021(2), ... The Findings Letter identified numerous remedial measures the State could take to comply with federal](https://static.fdocuments.us/doc/165x107/5a70cebe7f8b9ab6538c441d/complaint-word-adagov-homepagewwwadagovolmsteaddocumentsfl-complaint-olmsteadoc.jpg)