15 Mohammad
15
1 Application of CAPM in Measuring Risk and Return for Selected Markets of Iran’s Economy Mohammad Reza Tavakoli Baghdadabad Capital asset pricing model (CAPM) is an equilibrium model which uses to show the relationship between the risk and return of an individual asset or portfolio of assets. According to the portfolio theory, investors use diversification in order to reduce unsystematic risk. Efficient portfolios will dominate other investments and each investor will select one of the efficient portfolios based on the degree of his risk- aversion. Previous studies done in Iran or other countries o n CAPM, cons idered the application of the model for individual stocks, portfolios of stocks, specific assets, or the market indexes. Only few studies applied the CAPM for major real assets of the economy. Considering this gap of research that extended this model to other markets, this study applies the CAPM to measure systematic risk and expected return of selected markets in Iran’s economy, currency market, stock market and real estate market, for the period from the first quarter of 1995 to the second quarter of 2007. The research results showed that negative relationship exist between systematic risk with realized and expected return of the currency market, a negative relationship between risk and expected return rate in the stock market, and a positive linkage between these two variables in the real estate market. Furthermore, there is no significant relationship between risk and realized return in the stock and the real estate market. GDP also can be a suitable market index to test the CAPM in two markets of currency and stock in Iran’s economy. Key Words: CAPM, Systematic risk, Expected Return, Real Return Introduction CAPM is an equilibrium model used to show the relationship between risk and expected return for individual assets and for portfolios. CAPM assume that investors use diversification in an attempt to reduce unsystematic risk. According to the portfolio theory, efficient portfolios will dominate other investments and each investor will select one of the efficient portfolios based on the degree of his risk-aversion (Treynor 1961; Sharp 1964; Lintner 1965). To date, various studies have been done to describe the relationship between risk and expected return of stock market in Iran and other countries. These studies mostly considered stocks of one company, the stocks combination of some companies, specific assets, or the market indexes. They mainly attempt to answer two questions (1) how the risk of assets should be measured, and (2) what relationship exist between risk and expected return of investors (i.e. Basu 1977; Bakhshande 1990; Hamedani and Pirsalehi 1993; Shafizadeh 1995). To answer these two questions, first it is assumed that investors are able to select their preferred portfolio among different portfolios based on the DBA student in University Kebangsaan Malaysia(UKM), 0126776046, [email protected]
-
Upload
asih-pujiastuti -
Category
Documents
-
view
220 -
download
0
Transcript of 15 Mohammad
8/8/2019 15 Mohammad
http://slidepdf.com/reader/full/15-mohammad 1/15
1
Application of CAPM in Measuring Risk and Return for
Selected Markets of Iran’s Economy
Mohammad Reza Tavakoli Baghdadabad
Capital asset pricing model (CAPM) is an equilibrium model which uses to show the
relationship between the risk and return of an individual asset or portfolio of assets.
According to the portfolio theory, investors use diversification in order to reduce
unsystematic risk. Efficient portfolios will dominate other investments and each
investor will select one of the efficient portfolios based on the degree of his risk-
aversion. Previous studies done in Iran or other countries on CAPM, considered the
application of the model for individual stocks, portfolios of stocks, specific assets, or
the market indexes. Only few studies applied the CAPM for major real assets of the
economy. Considering this gap of research that extended this model to other markets,
this study applies the CAPM to measure systematic risk and expected return of
selected markets in Iran’s economy, currency market, stock market and real estate
market, for the period from the first quarter of 1995 to the second quarter of 2007.
The research results showed that negative relationship exist between systematic risk
with realized and expected return of the currency market, a negative relationship
between risk and expected return rate in the stock market, and a positive linkage
between these two variables in the real estate market. Furthermore, there is no
significant relationship between risk and realized return in the stock and the real
estate market. GDP also can be a suitable market index to test the CAPM in two
markets of currency and stock in Iran’s economy.
Key Words: CAPM, Systematic risk, Expected Return, Real Return
Introduction
CAPM is an equilibrium model used to show the relationship between risk and
expected return for individual assets and for portfolios. CAPM assume that investors use
diversification in an attempt to reduce unsystematic risk. According to the portfolio
theory, efficient portfolios will dominate other investments and each investor will selectone of the efficient portfolios based on the degree of his risk-aversion (Treynor 1961;
Sharp 1964; Lintner 1965).To date, various studies have been done to describe the relationship between risk and
expected return of stock market in Iran and other countries. These studies mostlyconsidered stocks of one company, the stocks combination of some companies, specific
assets, or the market indexes. They mainly attempt to answer two questions (1) how therisk of assets should be measured, and (2) what relationship exist between risk and
expected return of investors (i.e. Basu 1977; Bakhshande 1990; Hamedani and Pirsalehi
1993; Shafizadeh 1995). To answer these two questions, first it is assumed that investors
are able to select their preferred portfolio among different portfolios based on the
DBA student in University Kebangsaan Malaysia(UKM), 0126776046, [email protected]
8/8/2019 15 Mohammad
http://slidepdf.com/reader/full/15-mohammad 2/15
2
expected return and the variance. Second, all investors agree on investment horizon and
distribution of expected returns of assets, and also there are no imperfections in the
capital market (Copeland, Weston and Shastri 2005).
On the other hand, the empirical research mostly investigated the asset’s return
dependence on the market return and also the linear relationship between risk andexpected return in each selected stock markets (i.e. Lakonishok and Shapiro 1986;
Shafizadeh 1995; Zarif fard and Ghaemi 2003). In general, studies on CAPM model were
not limited only to the stock markets, this model was also used in other markets to
explain the relationship between risk and return (i.e. Kullmann 2001; NG 2003; Jafari
samimi et al., 2006).
Many of research about CAPM in the context of stock markets in one hand and thelack of research to extend this model to other markets in the other hand, provide this
opportunity to generalize CAPM to other markets. In other words, this study will apply
CAPM to estimate the systematic risk and expected return in three selected markets in the
Iranian economy, namely, real estate market, stock market, and currency market from thefirst quarter of 1995 to the second quarter of 2007.
This study in addition to estimating the systematic risk for these three selected
markets based on CAPM, tried to find out the following (1) Is there a significant
relationship between the systematic risk and the corresponding rate of expected return in
these three markets, (2) Is there a significant relationship between the systematic risk andthe realized return in the selected markets, and finally If so, what type of relationship
exists? In addition, since three macro markets of Iran’s economy are considered in order to test the CAPM, then it is necessary to find a suitable measure that shows the market
performance so well. Therefore, this paper seeks to find whether exist a significance
relationship between GDP as market index and realized return as independent variable in
each markets.This paper is organized as follows; Section II discusses the existing empirical
literature on the CAPM and its development in other areas. Section III states the
applications in measuring the systematic risk and return of three selected markets. The
data used in the study and the methodology is explained in Section IV, and finally the
results and findings of research are concluded in Section V.
Literature Review
The CAPM is a pricing model that relates the expected return rate of an individualsecurity to single index (Sharpe 1964; Lintner 1965). The sensitivity of the asset return to
changes in that index is a measure of the asset systematic risk. In fact, the index may beany variable thought to be the dominant influence on stock returns and need not be a
stock index (Jones, 1991).The CAPM predicts that the expected return on an asset above the risk-free rate is
linearly related to the non-diversifiable risk, which is measured by the asset’s beta. TheCAPM is a single-period ex ante model. However, since the ex ante returns are
unobservable, researchers usually rely on realized returns to test the validity of the
CAPM. Jagannathan and Wang (1996) show that the lack of empirical support for the
CAPM may be due to the inappropriateness of basic assumptions made to facilitate the
empirical analysis. For example, most empirical tests of the CAPM assume that the returnon broad stock market indices is a good proxy for the return on the market portfolio of all
8/8/2019 15 Mohammad
http://slidepdf.com/reader/full/15-mohammad 3/15
3
assets in the economy. However, these types of market indexes do not capture all assets
in the economy such as human capital.
Benz (1982) found that adding the market value of the firms to the regression
between return and stock beta helps to have a better clarification for the average return of
company’s stock differences. Lakonishok and Shapiro (1986) found that there is a weak relationship between beta with stock return, and a significant relation between market’s
prices of stock return with stock return.
To conclude, the testing of the CAPM is susceptible to many difficulties. Among
those, the problem of finding a suitable market proxy. To overcome this problem, Hou
(2003) used a hypothetical market portfolio to proxy the true market portfolio in the
CAPM testing. This aggregate market portfolio has GDP as its dividends. As a result, it issupposed to include every factor that contributes to the accumulation of wealth. This
approach is particularly relevant to this study since we will test three different markets
and no other proxy can serve as a market portfolio for the selected markets.
In Iran, studies done on CAPM, such as Bakhshande (1990), Hamedani et al., (1993)and Shafizadeh (1995) on risk and return in Tehran Stock Market found that there is alinear relationship between systematic risk and return of common stock. The research
evidence of Pourreza (2000) detected that there is a significant relation between stock
return, portfolio, macro and monetary factors of the economy. Shafiezadeh (1995)
showed that systematic risk and return have significant relation, so that non linear relationship helps to have a better clarification for the relation of systematic risk and
stock return in comparison with linear models. In continue Zariffard and Ghaemi (2003)mentioned that measuring systematic risk alone can’t satisfy the stock return changes.
In all studies mentioned above, CAPM were used to analyze the risk and return in
stock markets (mainly companies stocks). Researches which studied the applications of
CAPM in other economic activities other than the stock market have also been done. The purpose was to prove that CAPM has capabilities to be used for analyzing other assets,especially for assets in the macro economy.
Using an intertemporal multifactor CAPM, Doukas, Hall and Lang (1999) tested
whether foreign currency exposure is priced in the capital market of Japan. This study
relies on the assumption that the currency-risk premium changes through the time in
response to changes in business conditions and investors’ perception of risk. Their asset
pricing model tests showed that the foreign exchange-rate risk premium is a significantcomponent of Japanese stock returns. Specifically, the results suggested that currency-
risk exposure controls a significant risk premium for multinational and high-exportingJapanese firms. The currency risk factor is found to be less influential in explaining the
behavior of average returns for low-exporting and domestic firms. However, it is shownto exhibit large return volatility that is likely to be perceived by investors, who wish to
control portfolio risk, as an important underlying source of risk.Kullmann (2001) used CAPM to examine whether residential and commercial real
estate risks carry positive risk premiums. By using both Fama Macbeth cross-sectional
regression techniques and a stochastic discount factor, GMM framework is tested to find
whether the cross-sectional explanatory power of well-known asset pricing models can be
improved by adding a real estate factor. He found strong evidence for the hypothesis that both residential and commercial real estate risks are priced by the market and therefore
8/8/2019 15 Mohammad
http://slidepdf.com/reader/full/15-mohammad 4/15
4
have a definite role in empirical asset pricing specifications. The research evidence
showed that returns of real estate market are not sensitive to the pricing of the assets.
Ng (2003) investigated the relationship between average return of currency market
and the stock market of U.S., Japan, Germany and England. He mentioned that
international CAPM has a great potential to be used to analyze risk and return for the twomain economic assets in those countries, i.e. the Stock market and foreign exchange
market. Jafari samimi et al., (2006) applied the combined method of Markowitz efficient
portfolio and CAPM on petro-chemistry, gas injection, and gas export in Iran. They
found optimal portfolios, which derived from various allocations to different gas
consumption choices and also create the best value in different risk levels, through the
Markowitz efficient portfolio theory. The authors reached to an efficient frontier bycombining all of these efficient portfolios. Then through implementing CAPM they found
the efficient portfolio. Based on this model Jafari samimi et al., (2006) computed the
efficient portfolio for alternative combinations of petro-chemistry, gas and gas injection
projects in five different scenarios of 100, 200, 300, 400, 500 million cubic meters.This study will add to the literature in a sense that CAPM will be utilized in new
markets for the first time in determining the systematic risk of the three selected markets
in Iran and in using GDP as replacement measure of market index.
Methodology and DataA. Extending of the CAPM model to the entire economy
To measure the systematic risk of the three major economic markets, first the required
variables for the CAPM should be calculated for each of them. Required variables are
return for each asset, risk free return, portfolio return (or return of total market).The calculation of each asset’s return and risk free return is no major problem;
however the main problem is selecting an appropriate alternative criterion. In thecalculation of company’s stocks systematic risk, total return of the stock market or totalreturn of the specific industry is considered as an index. But when we look at the
selection of appropriate assets from macro approach, the chosen index should indicate the
average return of the investments in the entire economy. If an investor is going to invest
in one of these three major selected markets, the main assumptions of CAPM should be
considered, first: the ability of choosing among the different portfolios based on theinvestors’ desired expected return and the variance. Second, the information about
investment horizon and the distribution of asset’s return are clearly exist.
Thus for each of the markets the same return will be expected. On the other hand an
investor can invest in every other markets of the economy and obtain the same return.
The average return of total economy can be a suitable criterion for portfolio return, because the economic growth achieved from average return of all markets’ returns in aneconomy, and one expects that with investing in each of the economy markets obtain anaverage return equal to the economic growth, and if the obtained return was less than the
amount, he gain less than the portfolio return and vice versa. In choosing the growth of
GDP to proxy the market portfolio we are following (Hou 2003). He used GDP as a
hypothetical market portfolio to proxy the true market portfolio in the CAPM testing.
So the average return of total economy can be a good criterion that a person canconsider if he wants to invest in any of these three selected markets. Economic growth
indeed can be defined as a return of physical and human capitals exists in an economy in
a specific period. In other words, a person with utilizing his human and physical capitals-
8/8/2019 15 Mohammad
http://slidepdf.com/reader/full/15-mohammad 5/15
5
respect to the production function in the economy– can add to the production flow of the
economy.
If K considers as the amount of physical capital of a person, and L considers as the
human capital, an investor who utilizes his capital in the economy can obtain certain
amount of return. The average expected return depends on the production function of theentire economy. Therefore one can expect Q amount of production in T periods of time
through average production function of economy F , with applying his capitals:
),( t t t L K F Q = (1)
A change in production in each periods of time is due to the changes of human and physical capitals:
dt
dL
L
F
dt
dK
K
F
dt dQt ..
∂
∂+
∂
∂= (2)
t
t
t
t
t
t
t
t
t
t
t
t
t
t
Ldt
dL
Q
L
L
F
K dt
dK
Q
K
K
F Q
Q
dt
dQ
1...
1...
∂
∂+
∂
∂=≡ &
(3)
LQ
L
L
F K
Q
K
K
F Q
t
t
t
t
t
t
t
t &&& ....∂
∂+
∂
∂= (4)
L K Q L K &&& η η += (5)
These equations indicate that economic growth in specific period of time is due to
the growth of the one’s human and physical capitals. If obtained return was less than this
amount it means that he gain less than portfolio return and vice versa.B. Describe the Method Used to Calculate the Return
To measure systematic risk for the three selected markets of the economy first returnsfor all of them were calculated. In order to find the Currency market return, the
percentage of dollar exchange rate in non-official foreign exchange market of Tehran was
considered. For Currency, the owner of one dollar note will gain return with the increase
in the dollar exchange rate. For Stock market, the percentage change in total index of
Tehran Stock Exchange was considered, because it is assumed that one’s stock price will be increased in average the same amount as the total stock market increase. Finally, for
the estate market, total percentage changes of house rental index in large cities and
property index, rental fees and business activities as an outcome of housing and realestate is considered.
As for the risk free rate of return, short-term interest rates for deposits has been used.
Meanwhile, for the growth rate of GDP, the constant 1996 prices compared with the samequarter at the previous year, as the return criterion was considered. All data used are
quarterly and include the years from 1995 to 2007. All data were gathered from time
series data bank of Central Bank of Islamic Republic of Iran. The expected rate of return
is the rate of return when one invest in an asset and expect to gain benefit with the
proportional amount of imposed risk in the future.
A. Systematic Risk of Three Selected Markets in Iran
To measure the systematic risk of each market, first the average rate of return for the
market and the portfolio return were calculated. Then variance of the market prices,
market correlation, and systematic risk during the selected period was determined.
8/8/2019 15 Mohammad
http://slidepdf.com/reader/full/15-mohammad 6/15
6
Since the linear regression is applied to test the research hypotheses and the existence
of time series for the research variables, each independent and dependent variables
should be tested to confirm their stationary by using the testing of unit root. According to
this test, all independent and dependent variables of this research are stationary due to
being lower than the absolute value of ADF Statistic relative to each the critical valuesand being lower than 0.05% of P-Value.
To continue, each of the selected markets will be analyzed in terms of the CAPM
assumptions.1. Currency Market
The currency market is considered as a vital substitute market for formal markets inIran’s economy. Risk of this market explains the sensitivity of the expected return
fluctuations of investment in currency with the portfolio return. Changes in exchange rate
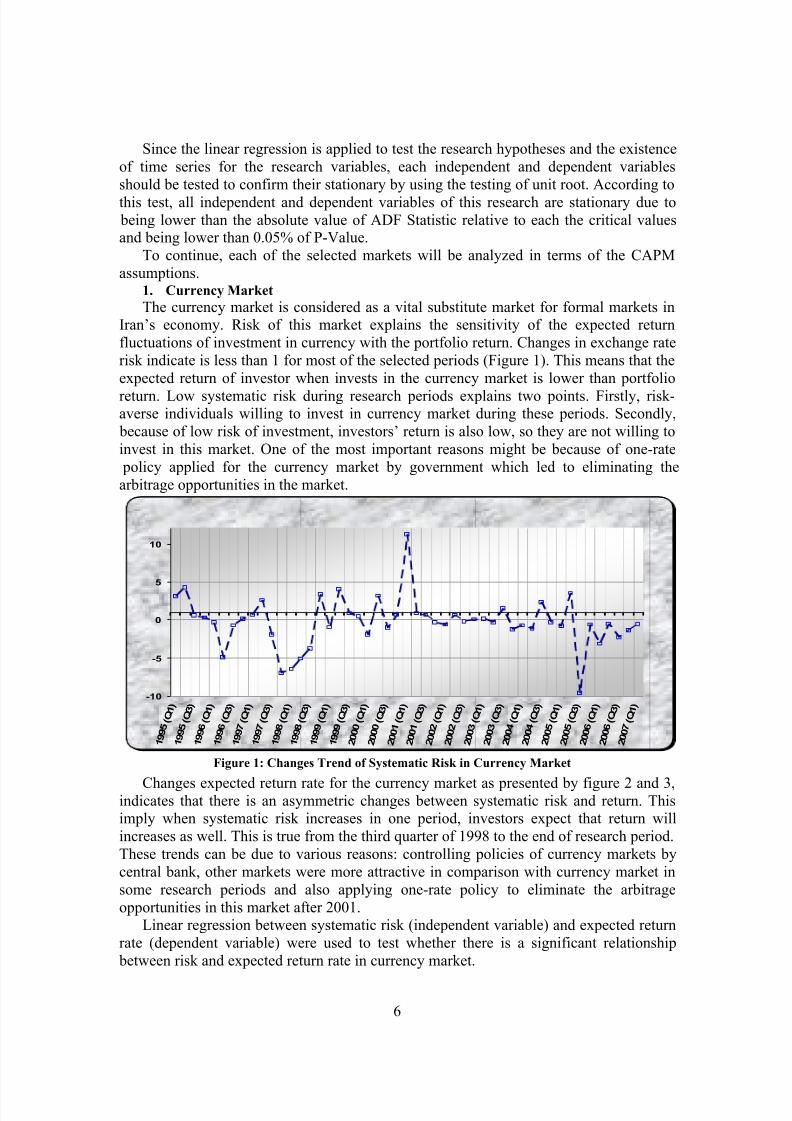
risk indicate is less than 1 for most of the selected periods (Figure 1). This means that the
expected return of investor when invests in the currency market is lower than portfolio
return. Low systematic risk during research periods explains two points. Firstly, risk-averse individuals willing to invest in currency market during these periods. Secondly,
because of low risk of investment, investors’ return is also low, so they are not willing to
invest in this market. One of the most important reasons might be because of one-rate
policy applied for the currency market by government which led to eliminating the
arbitrage opportunities in the market.
-10
-5
0
5
10
1 9 9 5 ( Q
1 )
1 9 9 5 ( Q
3 )
1 9 9 6 ( Q
1 )
1 9 9 6 ( Q
3 )
1 9 9 7 ( Q
1 )
1 9 9 7 ( Q
3 )
1 9 9 8 ( Q
1 )
1 9 9 8 ( Q
3 )
1 9 9 9 ( Q
1 )
1 9 9 9 ( Q
3 )
2 0 0 0 ( Q
1 )
2 0 0 0 ( Q
3 )
2 0 0 1 ( Q
1 )
2 0 0 1 ( Q
3 )
2 0 0 2 ( Q
1 )
2 0 0 2 ( Q
3 )
2 0 0 3 ( Q
1 )
2 0 0 3 ( Q
3 )
2 0 0 4 ( Q
1 )
2 0 0 4 ( Q
3 )
2 0 0 5 ( Q
1 )
2 0 0 5 ( Q
3 )
2 0 0 6 ( Q
1 )
2 0 0 6 ( Q
3 )
2 0 0 7 ( Q
1 )
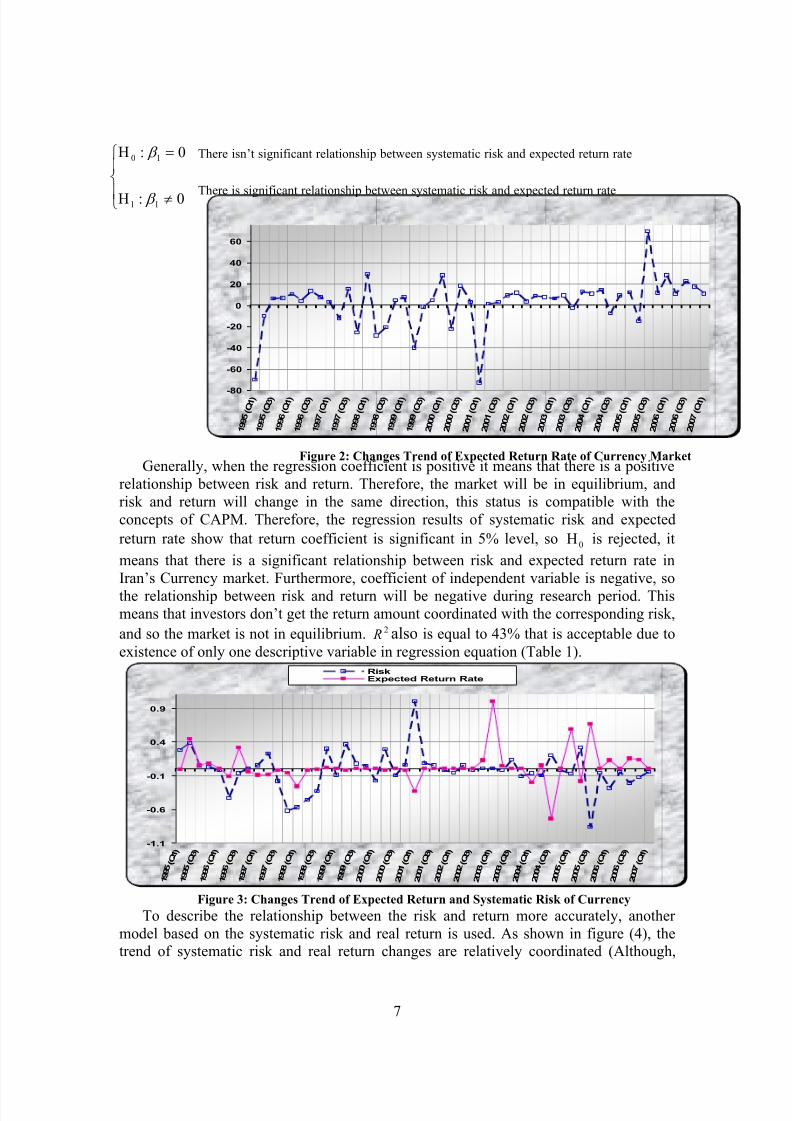
Changes expected return rate for the currency market as presented by figure 2 and 3,indicates that there is an asymmetric changes between systematic risk and return. Thisimply when systematic risk increases in one period, investors expect that return will
increases as well. This is true from the third quarter of 1998 to the end of research period.
These trends can be due to various reasons: controlling policies of currency markets by
central bank, other markets were more attractive in comparison with currency market in
some research periods and also applying one-rate policy to eliminate the arbitrage
opportunities in this market after 2001.Linear regression between systematic risk (independent variable) and expected return
rate (dependent variable) were used to test whether there is a significant relationship
between risk and expected return rate in currency market.
Figure 1: Changes Trend of Systematic Risk in Currency Market
8/8/2019 15 Mohammad
http://slidepdf.com/reader/full/15-mohammad 7/15
7
-80
-60
-40
-20
0
20
40
60
1 9 9 5 ( Q 1 )
1 9 9 5 ( Q 3 )
1 9 9 6 ( Q 1 )
1 9 9 6 ( Q 3 )
1 9 9 7 ( Q 1 )
1 9 9 7 ( Q 3 )
1 9 9 8 ( Q 1 )
1 9 9 8 ( Q 3 )
1 9 9 9 ( Q 1 )
1 9 9 9 ( Q 3 )
2 0 0 0 ( Q 1 )
2 0 0 0 ( Q 3 )
2 0 0 1 ( Q 1 )
2 0 0 1 ( Q 3 )
2 0 0 2 ( Q 1 )
2 0 0 2 ( Q 3 )
2 0 0 3 ( Q 1 )
2 0 0 3 ( Q 3 )
2 0 0 4 ( Q 1 )
2 0 0 4 ( Q 3 )
2 0 0 5 ( Q 1 )
2 0 0 5 ( Q 3 )
2 0 0 6 ( Q 1 )
2 0 0 6 ( Q 3 )
2 0 0 7 ( Q 1 )
Generally, when the regression coefficient is positive it means that there is a positive
relationship between risk and return. Therefore, the market will be in equilibrium, and
risk and return will change in the same direction, this status is compatible with the
concepts of CAPM. Therefore, the regression results of systematic risk and expected
return rate show that return coefficient is significant in 5% level, so 0Η is rejected, it
means that there is a significant relationship between risk and expected return rate in
Iran’s Currency market. Furthermore, coefficient of independent variable is negative, so
the relationship between risk and return will be negative during research period. This
means that investors don’t get the return amount coordinated with the corresponding risk,
and so the market is not in equilibrium. 2 R also is equal to 43% that is acceptable due to
existence of only one descriptive variable in regression equation (Table 1).
-1.1
-0.6
-0.1
0.4
0.9
1 9 9 5 ( Q 1 )
1 9 9 5 ( Q 3 )
1 9 9 6 ( Q 1 )
1 9 9 6 ( Q 3 )
1 9 9 7 ( Q 1 )
1 9 9 7 ( Q 3 )
1 9 9 8 ( Q 1 )
1 9 9 8 ( Q 3 )
1 9 9 9 ( Q 1 )
1 9 9 9 ( Q 3 )
2 0 0 0 ( Q 1 )
2 0 0 0 ( Q 3 )
2 0 0 1 ( Q 1 )
2 0 0 1 ( Q 3 )
2 0 0 2 ( Q 1 )
2 0 0 2 ( Q 3 )
2 0 0 3 ( Q 1 )
2 0 0 3 ( Q 3 )
2 0 0 4 ( Q 1 )
2 0 0 4 ( Q 3 )
2 0 0 5 ( Q 1 )
2 0 0 5 ( Q 3 )
2 0 0 6 ( Q 1 )
2 0 0 6 ( Q 3 )
2 0 0 7 ( Q 1 )
RiskExpected Return Rate
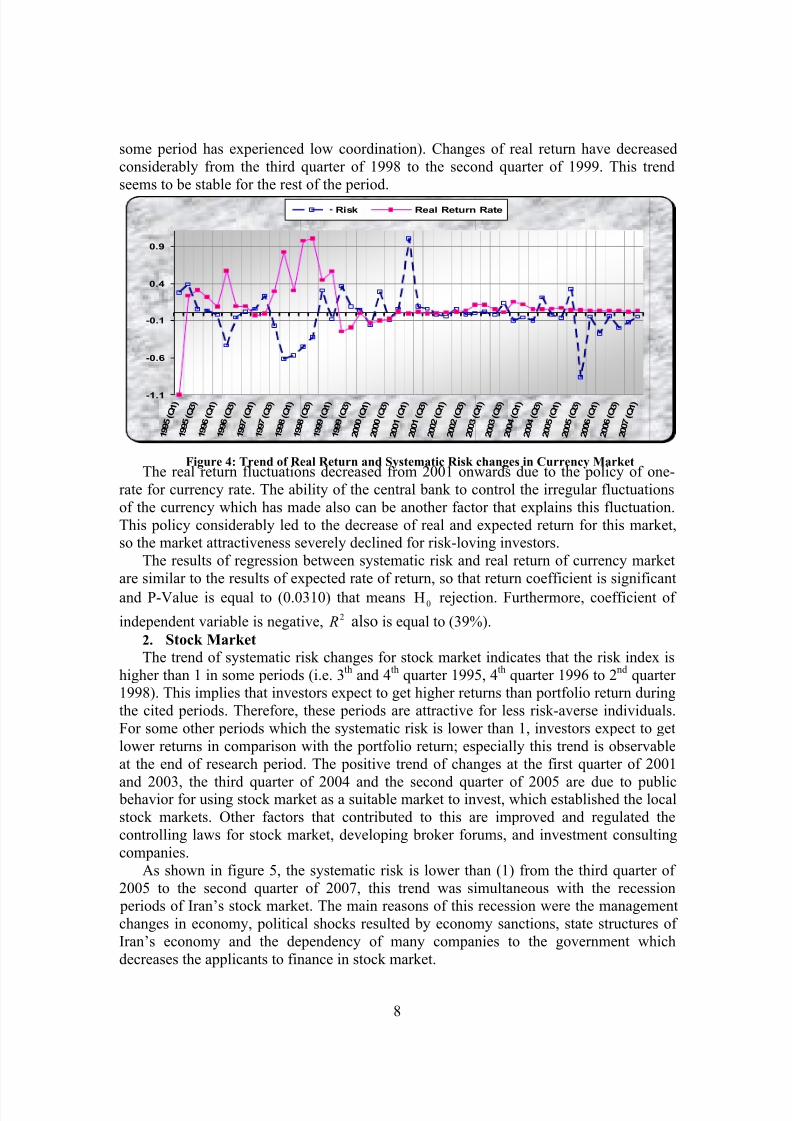
To describe the relationship between the risk and return more accurately, another
model based on the systematic risk and real return is used. As shown in figure (4), thetrend of systematic risk and real return changes are relatively coordinated (Although,
There isn’t significant relationship between systematic risk and expected return rate
There is significant relationship between systematic risk and expected return rate
≠Η
=Η
0:
0:
11
10
β
β
Figure 2: Changes Trend of Expected Return Rate of Currency Market
Figure 3: Changes Trend of Expected Return and Systematic Risk of Currency
8/8/2019 15 Mohammad
http://slidepdf.com/reader/full/15-mohammad 8/15
8
some period has experienced low coordination). Changes of real return have decreased
considerably from the third quarter of 1998 to the second quarter of 1999. This trend
seems to be stable for the rest of the period.
-1.1
-0.6
-0.1
0.4
0.9
1 9 9 5 ( Q 1 )
1 9 9 5 ( Q 3 )
1 9 9 6 ( Q 1 )
1 9 9 6 ( Q 3 )
1 9 9 7 ( Q 1 )
1 9 9 7 ( Q 3 )
1 9 9 8 ( Q 1 )
1 9 9 8 ( Q 3 )
1 9 9 9 ( Q 1 )
1 9 9 9 ( Q 3 )
2 0 0 0 ( Q 1 )
2 0 0 0 ( Q 3 )
2 0 0 1 ( Q 1 )
2 0 0 1 ( Q 3 )
2 0 0 2 ( Q 1 )
2 0 0 2 ( Q 3 )
2 0 0 3 ( Q 1 )
2 0 0 3 ( Q 3 )
2 0 0 4 ( Q 1 )
2 0 0 4 ( Q 3 )
2 0 0 5 ( Q 1 )
2 0 0 5 ( Q 3 )
2 0 0 6 ( Q 1 )
2 0 0 6 ( Q 3 )
2 0 0 7 ( Q 1 )
Risk Real Return Rate
The real return fluctuations decreased from 2001 onwards due to the policy of one-
rate for currency rate. The ability of the central bank to control the irregular fluctuations
of the currency which has made also can be another factor that explains this fluctuation.
This policy considerably led to the decrease of real and expected return for this market,so the market attractiveness severely declined for risk-loving investors.
The results of regression between systematic risk and real return of currency market
are similar to the results of expected rate of return, so that return coefficient is significant
and P-Value is equal to (0.0310) that means0Η rejection. Furthermore, coefficient of
independent variable is negative, 2 R also is equal to (39%).
2. Stock Market
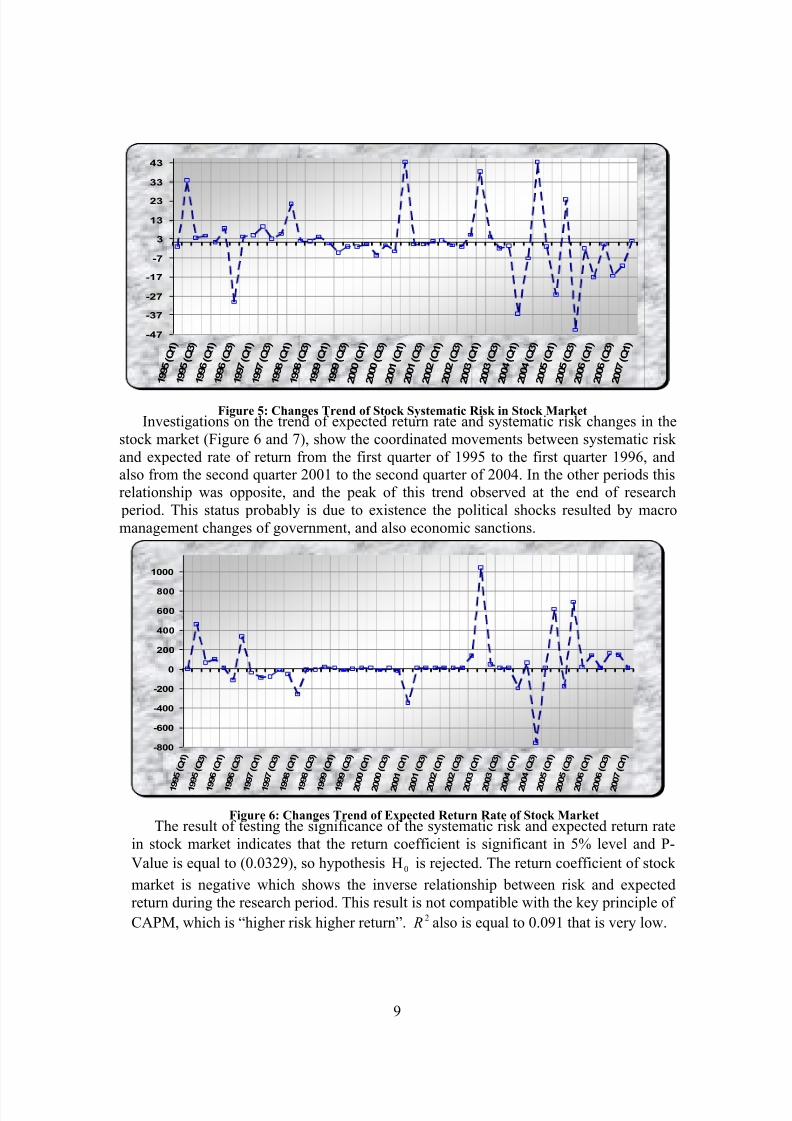
The trend of systematic risk changes for stock market indicates that the risk index is
higher than 1 in some periods (i.e. 3th
and 4th
quarter 1995, 4th
quarter 1996 to 2nd
quarter 1998). This implies that investors expect to get higher returns than portfolio return during
the cited periods. Therefore, these periods are attractive for less risk-averse individuals.
For some other periods which the systematic risk is lower than 1, investors expect to get
lower returns in comparison with the portfolio return; especially this trend is observable
at the end of research period. The positive trend of changes at the first quarter of 2001
and 2003, the third quarter of 2004 and the second quarter of 2005 are due to public behavior for using stock market as a suitable market to invest, which established the local
stock markets. Other factors that contributed to this are improved and regulated the
controlling laws for stock market, developing broker forums, and investment consulting
companies.
As shown in figure 5, the systematic risk is lower than (1) from the third quarter of
2005 to the second quarter of 2007, this trend was simultaneous with the recession periods of Iran’s stock market. The main reasons of this recession were the management
changes in economy, political shocks resulted by economy sanctions, state structures of
Iran’s economy and the dependency of many companies to the government which
decreases the applicants to finance in stock market.
Figure 4: Trend of Real Return and Systematic Risk changes in Currency Market
8/8/2019 15 Mohammad
http://slidepdf.com/reader/full/15-mohammad 9/15
9
-47
-37
-27
-17
-7
3
13
23
33
43
1 9 9 5 ( Q 1 )
1 9 9 5 ( Q 3 )
1 9 9 6 ( Q 1 )
1 9 9 6 ( Q 3 )
1 9 9 7 ( Q 1 )
1 9 9 7 ( Q 3 )
1 9 9 8 ( Q 1 )
1 9 9 8 ( Q 3 )
1 9 9 9 ( Q 1 )
1 9 9 9 ( Q 3 )
2 0 0 0 ( Q 1 )
2 0 0 0 ( Q 3 )
2 0 0 1 ( Q 1 )
2 0 0 1 ( Q 3 )
2 0 0 2 ( Q 1 )
2 0 0 2 ( Q 3 )
2 0 0 3 ( Q 1 )
2 0 0 3 ( Q 3 )
2 0 0 4 ( Q 1 )
2 0 0 4 ( Q 3 )
2 0 0 5 ( Q 1 )
2 0 0 5 ( Q 3 )
2 0 0 6 ( Q 1 )
2 0 0 6 ( Q 3 )
2 0 0 7 ( Q 1 )
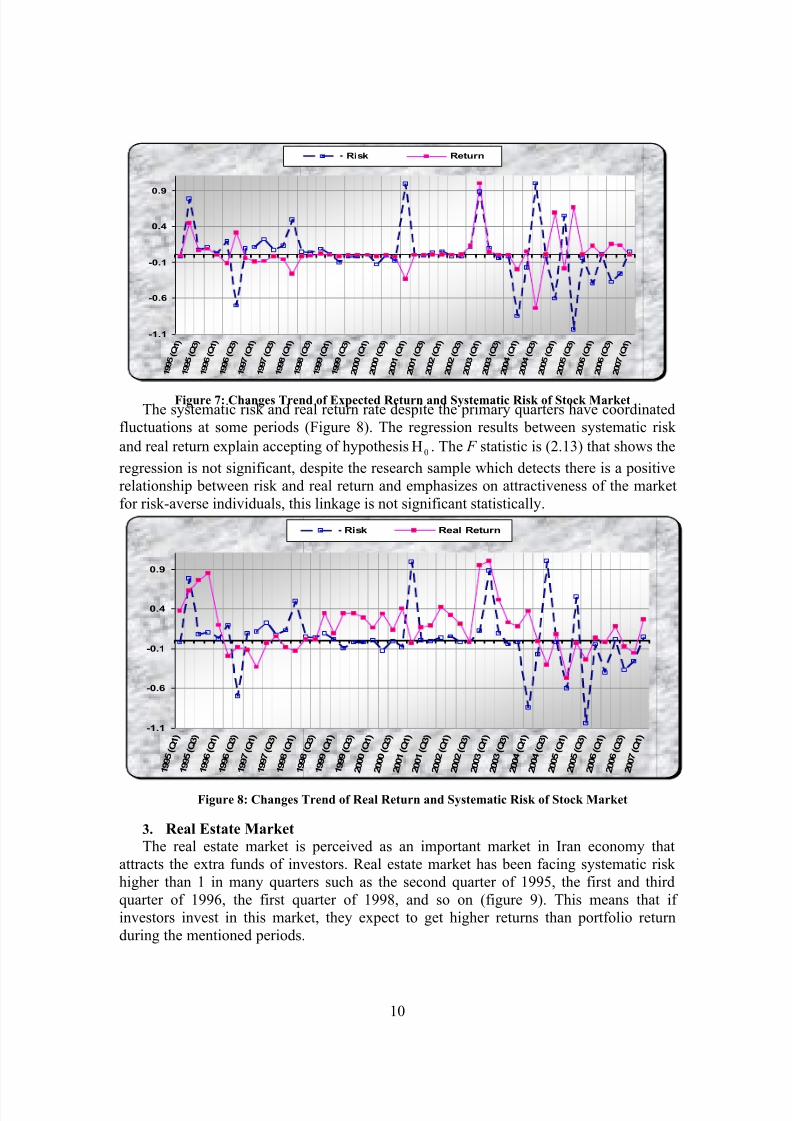
Investigations on the trend of expected return rate and systematic risk changes in the
stock market (Figure 6 and 7), show the coordinated movements between systematic risk
and expected rate of return from the first quarter of 1995 to the first quarter 1996, andalso from the second quarter 2001 to the second quarter of 2004. In the other periods thisrelationship was opposite, and the peak of this trend observed at the end of research
period. This status probably is due to existence the political shocks resulted by macro
management changes of government, and also economic sanctions.
-800
-600
-400
-200
0
200
400
600
800
1000
1 9
9 5 ( Q
1 )
1 9
9 5 ( Q
3 )
1 9
9 6 ( Q
1 )
1 9
9 6 ( Q
3 )
1 9
9 7 ( Q
1 )
1 9
9 7
( Q 3 )
1 9
9 8 ( Q
1 )
1 9
9 8 ( Q
3 )
1 9
9 9 ( Q
1 )
1 9
9 9
( Q 3 )
2 0
0 0 ( Q
1 )
2 0
0 0 ( Q
3 )
2 0
0 1
( Q 1 )
2 0
0 1 ( Q
3 )
2 0
0 2 ( Q
1 )
2 0
0 2 ( Q
3 )
2 0
0 3 ( Q
1 )
2 0
0 3 ( Q
3 )
2 0
0 4 ( Q
1 )
2 0
0 4 ( Q
3 )
2 0
0 5 ( Q
1 )
2 0
0 5 ( Q
3 )
2 0
0 6 ( Q
1 )
2 0
0 6 ( Q
3 )
2 0
0 7
( Q 1 )
The result of testing the significance of the systematic risk and expected return rate
in stock market indicates that the return coefficient is significant in 5% level and P-
Value is equal to (0.0329), so hypothesis 0Η is rejected. The return coefficient of stock
market is negative which shows the inverse relationship between risk and expected
return during the research period. This result is not compatible with the key principle of
CAPM, which is “higher risk higher return”. 2 R also is equal to 0.091 that is very low.
Figure 5: Changes Trend of Stock Systematic Risk in Stock Market
Figure 6: Changes Trend of Expected Return Rate of Stock Market
8/8/2019 15 Mohammad
http://slidepdf.com/reader/full/15-mohammad 10/15
10
-1.1
-0.6
-0.1
0.4
0.9
1 9 9 5 ( Q 1 )
1 9 9 5 ( Q 3 )
1 9 9 6 ( Q 1 )
1 9 9 6 ( Q 3 )
1 9 9 7 ( Q 1 )
1 9 9 7 ( Q 3 )
1 9 9 8 ( Q 1 )
1 9 9 8 ( Q 3 )
1 9 9 9 ( Q 1 )
1 9 9 9 ( Q 3 )
2 0 0 0 ( Q 1 )
2 0 0 0 ( Q 3 )
2 0 0 1 ( Q 1 )
2 0 0 1 ( Q 3 )
2 0 0 2 ( Q 1 )
2 0 0 2 ( Q 3 )
2 0 0 3 ( Q 1 )
2 0 0 3 ( Q 3 )
2 0 0 4 ( Q 1 )
2 0 0 4 ( Q 3 )
2 0 0 5 ( Q 1 )
2 0 0 5 ( Q 3 )
2 0 0 6 ( Q 1 )
2 0 0 6 ( Q 3 )
2 0 0 7 ( Q 1 )
Risk Return
The systematic risk and real return rate despite the primary quarters have coordinated
fluctuations at some periods (Figure 8). The regression results between systematic risk
and real return explain accepting of hypothesis 0Η . The F statistic is (2.13) that shows the
regression is not significant, despite the research sample which detects there is a positive
relationship between risk and real return and emphasizes on attractiveness of the market
for risk-averse individuals, this linkage is not significant statistically.
-1.1
-0.6
-0.1
0.4
0.9
1 9 9 5 ( Q
1 )
1 9 9 5 ( Q
3 )
1 9 9 6 ( Q
1 )
1 9 9 6 ( Q
3 )
1 9 9 7 ( Q
1 )
1 9 9 7
( Q 3 )
1 9 9 8 ( Q
1 )
1 9 9 8 ( Q
3 )
1 9 9 9 ( Q
1 )
1 9 9 9
( Q 3 )
2 0 0 0 ( Q
1 )
2 0 0 0 ( Q
3 )
2 0 0 1 ( Q
1 )
2 0 0 1 ( Q
3 )
2 0 0 2 ( Q
1 )
2 0 0 2 ( Q
3 )
2 0 0 3 ( Q
1 )
2 0 0 3
( Q 3 )
2 0 0 4 ( Q
1 )
2 0 0 4 ( Q
3 )
2 0 0 5 ( Q
1 )
2 0 0 5 ( Q
3 )
2 0 0 6 ( Q
1 )
2 0 0 6 ( Q
3 )
2 0 0 7
( Q 1 )
Risk Real Return
3. Real Estate Market
The real estate market is perceived as an important market in Iran economy that
attracts the extra funds of investors. Real estate market has been facing systematic risk
higher than 1 in many quarters such as the second quarter of 1995, the first and third
quarter of 1996, the first quarter of 1998, and so on (figure 9). This means that if
investors invest in this market, they expect to get higher returns than portfolio return
during the mentioned periods.
Figure 7: Changes Trend of Expected Return and Systematic Risk of Stock Market
Figure 8: Changes Trend of Real Return and Systematic Risk of Stock Market
8/8/2019 15 Mohammad
http://slidepdf.com/reader/full/15-mohammad 11/15
11
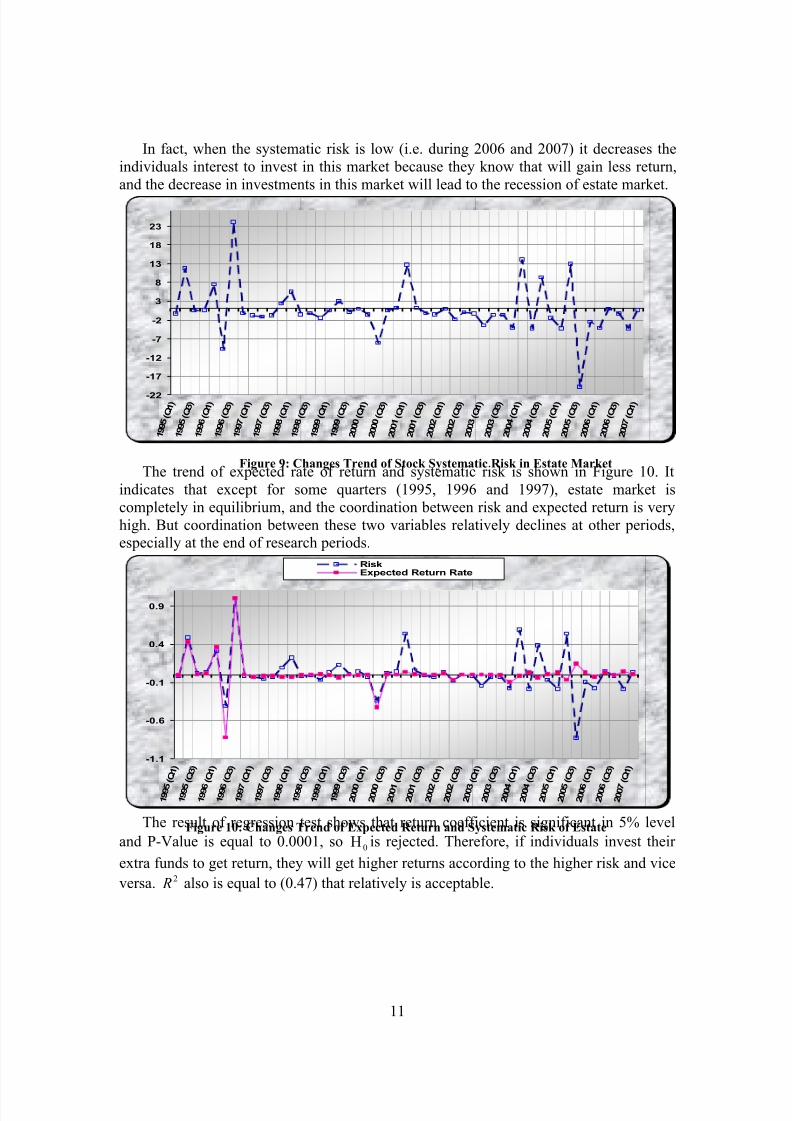
In fact, when the systematic risk is low (i.e. during 2006 and 2007) it decreases the
individuals interest to invest in this market because they know that will gain less return,
and the decrease in investments in this market will lead to the recession of estate market.
-22
-17
-12
-7
-2
3
8
13
18
23
1 9 9 5 ( Q 1 )
1 9 9 5 ( Q 3 )
1 9 9 6 ( Q 1 )
1 9 9 6 ( Q 3 )
1 9 9 7 ( Q 1 )
1 9 9 7 ( Q 3 )
1 9 9 8 ( Q 1 )
1 9 9 8 ( Q 3 )
1 9 9 9 ( Q 1 )
1 9 9 9 ( Q 3 )
2 0 0 0 ( Q 1 )
2 0 0 0 ( Q 3 )
2 0 0 1 ( Q 1 )
2 0 0 1 ( Q 3 )
2 0 0 2 ( Q 1 )
2 0 0 2 ( Q 3 )
2 0 0 3 ( Q 1 )
2 0 0 3 ( Q 3 )
2 0 0 4 ( Q 1 )
2 0 0 4 ( Q 3 )
2 0 0 5 ( Q 1 )
2 0 0 5 ( Q 3 )
2 0 0 6 ( Q 1 )
2 0 0 6 ( Q 3 )
2 0 0 7 ( Q 1 )
The trend of expected rate of return and systematic risk is shown in Figure 10. It
indicates that except for some quarters (1995, 1996 and 1997), estate market is
completely in equilibrium, and the coordination between risk and expected return is very
high. But coordination between these two variables relatively declines at other periods,especially at the end of research periods.
-1.1
-0.6
-0.1
0.4
0.9
1 9 9 5
( Q 1 )
1 9 9 5
( Q 3 )
1 9 9 6
( Q 1 )
1 9 9 6
( Q 3 )
1 9 9 7
( Q 1 )
1 9 9 7
( Q 3 )
1 9 9 8
( Q 1 )
1 9 9 8
( Q 3 )
1 9 9 9
( Q 1 )
1 9 9 9
( Q 3 )
2 0 0 0
( Q 1 )
2 0 0 0
( Q 3 )
2 0 0 1
( Q 1 )
2 0 0 1
( Q 3 )
2 0 0 2
( Q 1 )
2 0 0 2
( Q 3 )
2 0 0 3
( Q 1 )
2 0 0 3
( Q 3 )
2 0 0 4
( Q 1 )
2 0 0 4
( Q 3 )
2 0 0 5
( Q 1 )
2 0 0 5
( Q 3 )
2 0 0 6
( Q 1 )
2 0 0 6
( Q 3 )
2 0 0 7
( Q 1 )
RiskExpected Return Rate
The result of regression test shows that return coefficient is significant in 5% level
and P-Value is equal to 0.0001, so0Η is rejected. Therefore, if individuals invest their
extra funds to get return, they will get higher returns according to the higher risk and vice
versa. 2 R also is equal to (0.47) that relatively is acceptable.
Figure 9: Changes Trend of Stock Systematic Risk in Estate Market
Figure 10: Changes Trend of Expected Return and Systematic Risk of Estate
8/8/2019 15 Mohammad
http://slidepdf.com/reader/full/15-mohammad 12/15
12
-1.1
-0.6
-0.1
0.4
0.9
1 9 9
5 ( Q 1 )
1 9 9
5 ( Q
3 )
1 9 9
6 ( Q
1 )
1 9 9
6 ( Q 3 )
1 9 9
7 ( Q 1 )
1 9 9
7 ( Q 3 )
1 9 9
8 ( Q
1 )
1 9 9
8 ( Q 3 )
1 9 9
9 ( Q 1 )
1 9 9
9 ( Q
3 )
2 0 0
0 ( Q 1 )
2 0 0
0 ( Q 3 )
2 0 0
1 ( Q 1 )
2 0 0
1 ( Q
3 )
2 0 0
2 ( Q 1 )
2 0 0
2 ( Q 3 )
2 0 0
3 ( Q
1 )
2 0 0
3 ( Q 3 )
2 0 0
4 ( Q 1 )
2 0 0
4 ( Q 3 )
2 0 0
5 ( Q 1 )
2 0 0
5 ( Q
3 )
2 0 0
6 ( Q 1 )
2 0 0
6 ( Q 3 )
2 0 0
7 ( Q 1 )
Risk Real Return
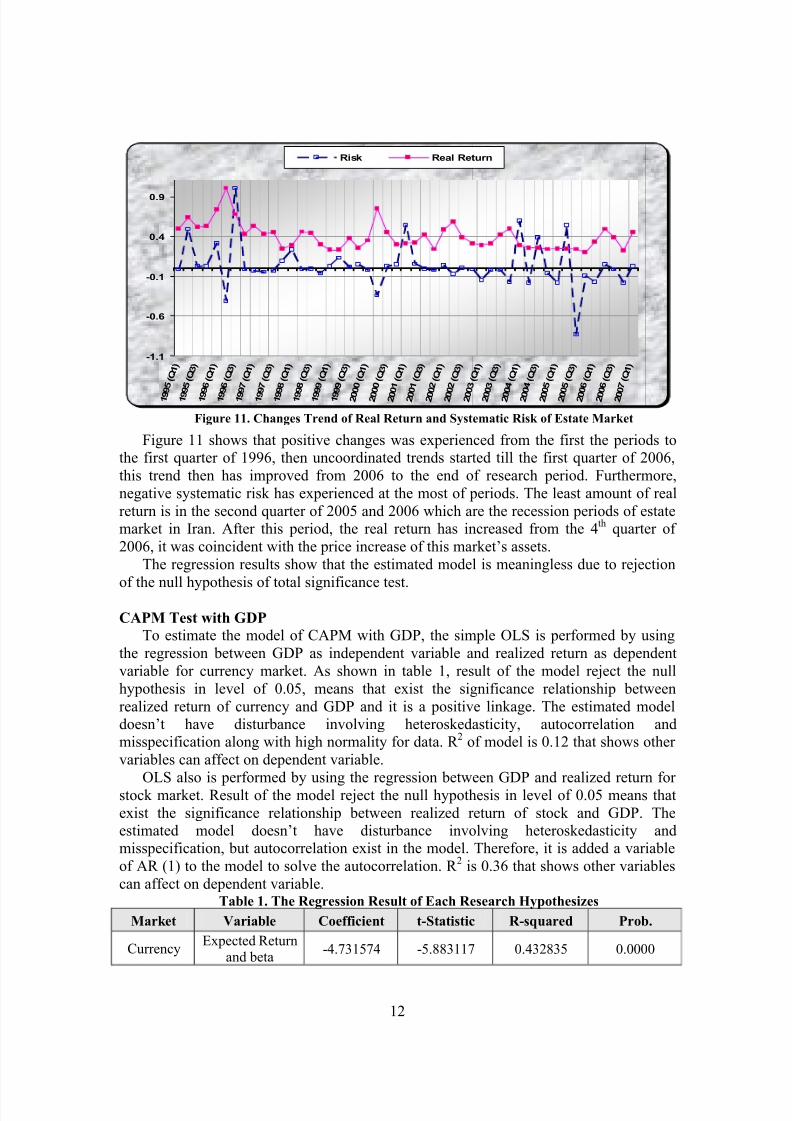
Figure 11 shows that positive changes was experienced from the first the periods tothe first quarter of 1996, then uncoordinated trends started till the first quarter of 2006,
this trend then has improved from 2006 to the end of research period. Furthermore,
negative systematic risk has experienced at the most of periods. The least amount of real
return is in the second quarter of 2005 and 2006 which are the recession periods of estatemarket in Iran. After this period, the real return has increased from the 4
thquarter of
2006, it was coincident with the price increase of this market’s assets.
The regression results show that the estimated model is meaningless due to rejection
of the null hypothesis of total significance test.
CAPM Test with GDP
To estimate the model of CAPM with GDP, the simple OLS is performed by using
the regression between GDP as independent variable and realized return as dependent
variable for currency market. As shown in table 1, result of the model reject the null
hypothesis in level of 0.05, means that exist the significance relationship between
realized return of currency and GDP and it is a positive linkage. The estimated modeldoesn’t have disturbance involving heteroskedasticity, autocorrelation andmisspecification along with high normality for data. R 2 of model is 0.12 that shows other
variables can affect on dependent variable.
OLS also is performed by using the regression between GDP and realized return for
stock market. Result of the model reject the null hypothesis in level of 0.05 means that
exist the significance relationship between realized return of stock and GDP. Theestimated model doesn’t have disturbance involving heteroskedasticity andmisspecification, but autocorrelation exist in the model. Therefore, it is added a variable
of AR (1) to the model to solve the autocorrelation. R 2
is 0.36 that shows other variables
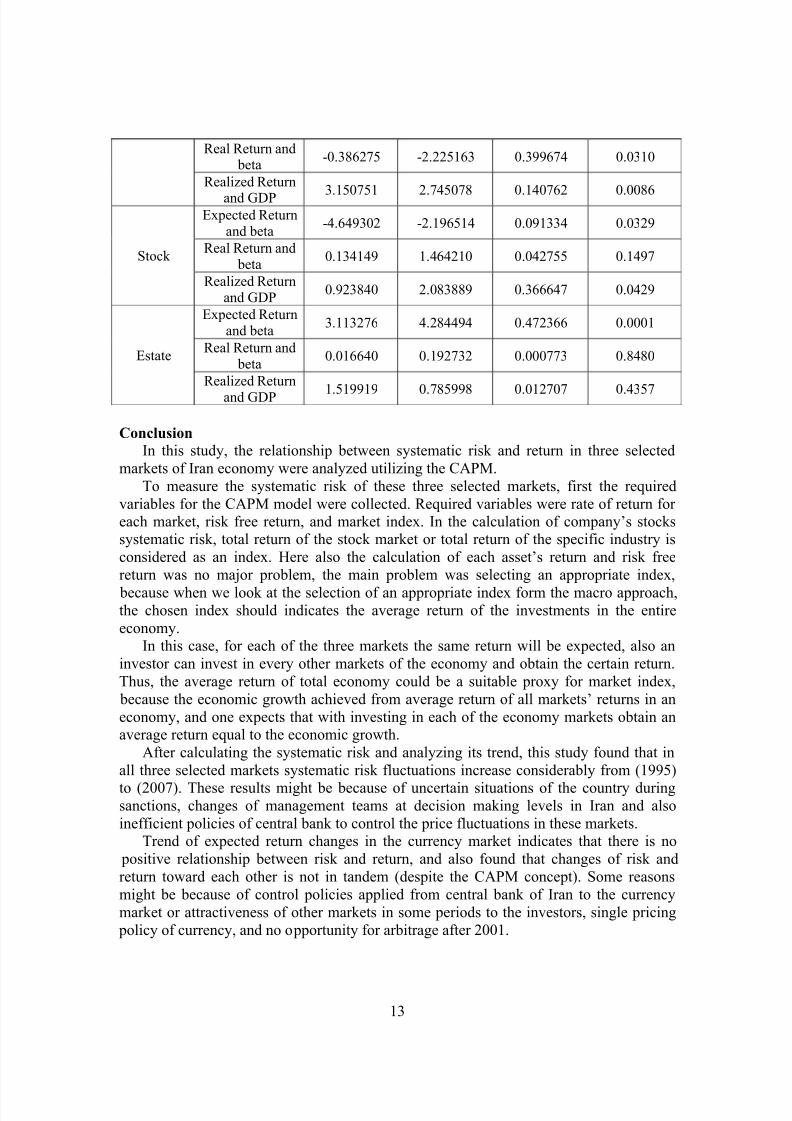
can affect on dependent variable.Table 1. The Regression Result of Each Research Hypothesizes
Market Variable Coefficient t-Statistic R-squared Prob.
CurrencyExpected Return
and beta -4.731574 -5.883117 0.432835 0.0000
Figure 11. Changes Trend of Real Return and Systematic Risk of Estate Market
8/8/2019 15 Mohammad
http://slidepdf.com/reader/full/15-mohammad 13/15
8/8/2019 15 Mohammad
http://slidepdf.com/reader/full/15-mohammad 14/15
14
Changes trend of systematic risk in the stock market indicated the mentioned risk
from the first quarter (1999) to the end of research period, except in six quarters, were
lower than (1), which means the stock market was attractive for risk-averse investors
during that period. The graph was negative or close to zero at the most mentioned
periods, the peak was from (2005) onwards which are corresponding to the recession periods of stock market. In other world, this trend is consistent with stock market
recession from (2005).
Respect to the analyzes of the relationship between the systematic risk and the real
return in the Currency market and Stock market, this study found that in each of these
two markets there is a negative relationship among systematic risk and expected return
and also the real return (except the relationship between risk and real return in stock market) In other words, this pattern in these two markets is not consistent with CAPM.
Although regressions done for investigating those relationships in Estate market and
shows that positive relation exists between systematic risk and expected return, but
between systematic risk and the real return in this market no significant relationshipswere found.
So this study concludes that in the financial markets of Iran economy, (Currency and
Stock markets), taking more systematic risks do not guarantee the higher returns, but this
expectation exists in physical assets market (Estate market). Therefore CAPM forecasts
are not compatible in the financial markets of Iran economy. It might be because thefinancial markets of Iran are not developed very well, or investors are not quite familiar
with the market. Also the higher returns of physical markets encourage people to investin Estate market instead of financial markets.
Furthermore, other section of this paper is relevant to use the GDP as a market measure
to test the CAPM in these three markets. The evidence shows that exists the significance
relationship between GDP and the realized return of currency and stock market in Iran’seconomy. In other world, GDP can be an appropriate market index in estimating therelation between risk and return in currency and stock market.
References
1. Bakhshandeh, S. (1990). The relationship between risk and return in Tehran stock market: MSc of Marketing Management thesis. Tehran, Tehran University.
2. Basu, S. (1977). Investment Performance of Common Stocks in Relation to Their
Price-Earnings Ratios: A Test of the Efficient Market Hypothesis, Journal of Finance
32. 663-682.
3. Black, F., Jensen, M., and Scholes, M. (1972). The Capital Asset Pricing Model:Some Empirical Test, in M. C. Jensen, ed., Studies in the theory of capital markets.
Praeger, New York, 79-124.
8/8/2019 15 Mohammad
http://slidepdf.com/reader/full/15-mohammad 15/15
15
4. Copeland, T.E. Weston, J.F and Shastri. K. (2005). Financial Theory and Corporate
Policy, Fourth Edition.
5. Doukas, J. P, Hall, L. Lang, L. (1999). The pricing of currency risk in Japan, Journal
of Banking & Finance 23.
6. Hamedani, Z. et al., (1993). The relationship between risk and return in Tehran stock market: MSc of Accounting thesis. Tehran University.
7. Hou, Yuanfeng. 2003. Essays on credit risk, Interest Rate Risk and Macroeconomic
Risk. Ph. D. thesis. Yale University.
8. Jafari Samimi, A., et al., (2006). CAPM application in optimal allocation of natural
gas reserves, Journal of Knowledge and Development 21, 197-217.
9. Jagannathan, R. and Wang, Z. 1996. The conditional CAPM and the cross-section of expected returns. Journal of Finance 51: 3-53.
10. Jones, P. (1991), Investments Analysis and Management, 3rd ed., John Wiley &
Sons, New York, NY.
11. Kullmann, C. (2001). Real Estate and its Role in Asset Pricing, Graduate School of Business Columbia University. Available in SSRN, id291788.
12. Lakonishok, J. Shapiro, A. 1986. Systematic Risk, Total Risk and Size as
Determinants of Stock Market Returns. Journal of Banking and Finance 10. 115-132.
13. Lintner, J. 1965. The Valuation of Risk Assets and Selection of Risky Investments in
Stock Portfolios and Capital Budgets. Review of Economics and Statistics 47.13-37.
14. Ng D.T(2004),"The international CAPM when expected returns are time-varying",
Journal of International Money and Finance 23(2): 189-230.
15. Pour reza. M., (2000) Application of multifactor model to forecast the stock returns of Tehran stock market, MSc thesis. Imam Sadegh University.
16. Shafizadeh, A., (1995) Research on the relationship between systematic risk and
stock return in Tehran stock market, MSc of Accounting thesis, Tehran University.17. Sharpe, W. F. 1964. Capital Asset Prices: A Theory of Market Equilibrium under
Conditions of Risk. Journal of Finance 19.425-442.
18. Treynor, J. L. 1961. Market Value, Time, and Risk. Unpublished manuscript. "RoughDraft" dated. #95-209.
19. Zarif far, A. and Ghaemi, M., (2003) Empirical study of CAPM in Tehran stock
market, Social and Human Science Journal of Shiraz University 19, 2-38.20. www.cbi.ir