15-18 Nov 2011Regional CH PM Meeting, KTM1 Child health programmes: What do we need to measure?...
21
15-18 Nov 2011 Regional CH PM Meeting, KTM 1 Child health programmes: What do we need to measure? CAH-SEARO
-
Upload
eustacia-christiana-matthews -
Category
Documents
-
view
214 -
download
0
Transcript of 15-18 Nov 2011Regional CH PM Meeting, KTM1 Child health programmes: What do we need to measure?...

15-18 Nov 2011 Regional CH PM Meeting, KTM 1
Child health programmes:What do we need to measure?
CAH-SEARO
15-18 Nov 2011 Regional CH PM Meeting, KTM 2
Uses of Data
• Determine public health priorities• Data informed planning• Effective implementation:
– Scale– Quality– Equity
• Monitoring progress of implementation• Evaluation

15-18 Nov 2011 Regional CH PM Meeting, KTM 3
Programmatic pathway for improving child health
IMPLEMENTATION OF ACTIVITIES
Advocacy for Child health
Human, material and financial resource
mobilization
Human resource capacity
development
Communication with adolescents, families
& communities
Health system supports
strengthened
Progress tracked
IMPROVED
Availability and access to health
care
Quality of care
Demand for care
Knowledge of adolescents, families and communities
INCREASED POPULATION-
BASED COVERAGE
of key effective interventions
IMPROVED SURVIVAL
AND HEALTH
Social determinants

15-18 Nov 2011 Regional CH PM Meeting, KTM 4
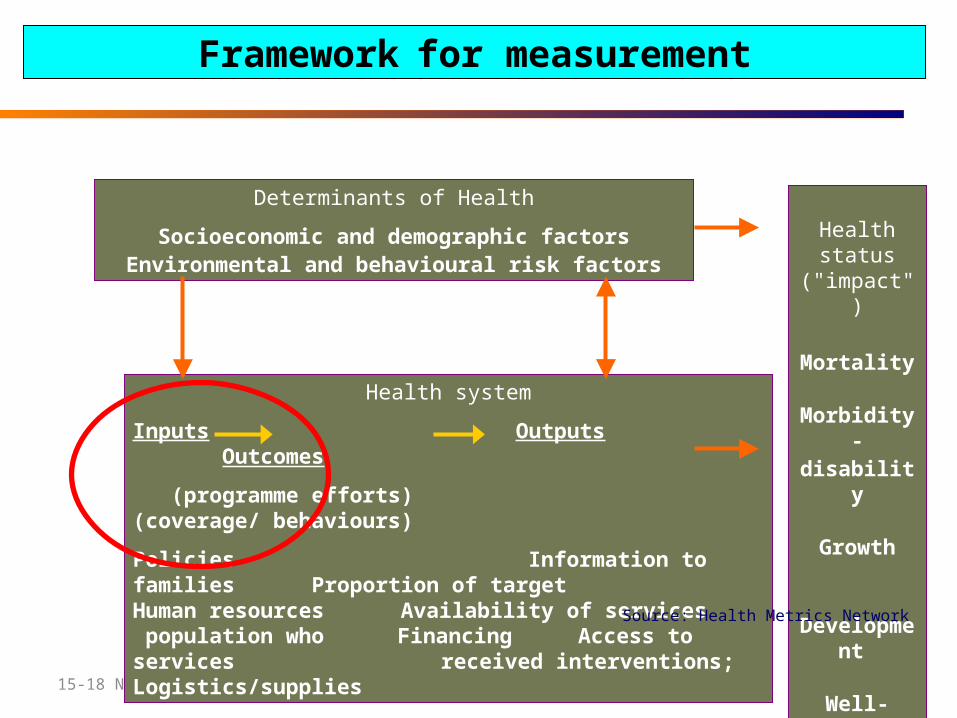
Health system
Inputs Outputs Outcomes
(programme efforts) (coverage/ behaviours)
Policies Information to families Proportion of targetHuman resources Availability of services population who Financing Access to services received interventions;Logistics/supplies Quality of services
Determinants of Health
Socioeconomic and demographic factorsEnvironmental and behavioural risk factors
Health status
("impact")
Mortality
Morbidity -disability
Growth
Development
Well-being
Source: Health Metrics Network
Framework for measurement

15-18 Nov 2011 Regional CH PM Meeting, KTM 5
Health Status Indicators(Source: Vital Registration, DHS surveys)
• Mortality– U5MR– IMR– NMR– Cause specific mortality
• Nutrition status– LBW– Wasting– Stunting

15-18 Nov 2011 Regional CH PM Meeting, KTM 6
Mortality in SEAR
Infant Mortality Rates (IGME 2011)
Under-five Mortality Rates (IGME 2011)
4856
3363
3515
6650
1713
55
0 20 40 60 80
BangladeshBhutan
DPR KoreaIndia
IndonesiaMaldives
MyanmarNepal
Sri LankaThailand
Timor Leste
Percent

15-18 Nov 2011 Regional CH PM Meeting, KTM 7
Neonatal Mortality Rate (UN IGME 2011)
27
26
18
32
17
9
32
28
10
8
24
0 5 10 15 20 25 30 35
Bangladesh
Bhutan
DPR Korea
India
Indonesia
Maldives
Myanmar
Nepal
Sri Lanka
Thailand
Timor Leste
Percent

15-18 Nov 2011 Regional CH PM Meeting, KTM 8
DisparitiesUnder Five Mortality Rate by Sex
7670
56
8580
85
7279
46
6978 75
0102030405060708090
BAN IND INO MMR NEP TLS
Mor
tality
/100
0 live
birth
s
Male
Female
Under Five Mortality Rate by Wealth Quintile
86
101
77
98
4334 32
47
0
20
40
60
80
100
120
BAN IND INO NEP
Mor
talit
y/10
00 liv
e bi
rths
Poorest
Richest
Source: Bangladesh DHS 2007; Bhutan National Nutrition and Young Child Feeding Survey 2009; DPRK National Nutrition Survey 2004; India NFHS-2005-06; Indonesia DHS 2007; Maldives DHS 2009; Myanmar FRHS 2007; Nepal DHS 2006; Sri Lanka DHS 2006-07; Thailand MICS 2005-06; Timor Leste DHS 2003 (for ARI data) and 2009-10

15-18 Nov 2011 Regional CH PM Meeting, KTM 9
Deaths among children under-five Neonatal deaths
Major causes of death in children under-five neonatesin the South-east Asia Region 2008 (revised )
Source: WHO. The World Health Statistics 2011
Pneumonia (postneonatal)
12%
Neonatal deaths52%
Other 12%
Measles 4%
Noncommunicable diseases (postneonatal)
4%
Injuries (postneonatal)4%
Diarrhoeal diseases (postneonatal)
12%
Malaria 1%
Neonatal infections28%
Prematurity and lowbirth w eight
26%
Birth asphyxia andbirth trauma
20%
Neonatal tetanus 1% Diarrhoeal diseases 3%
Congenital anomalies 4%
Other 17%
15-18 Nov 2011 Regional CH PM Meeting, KTM 10
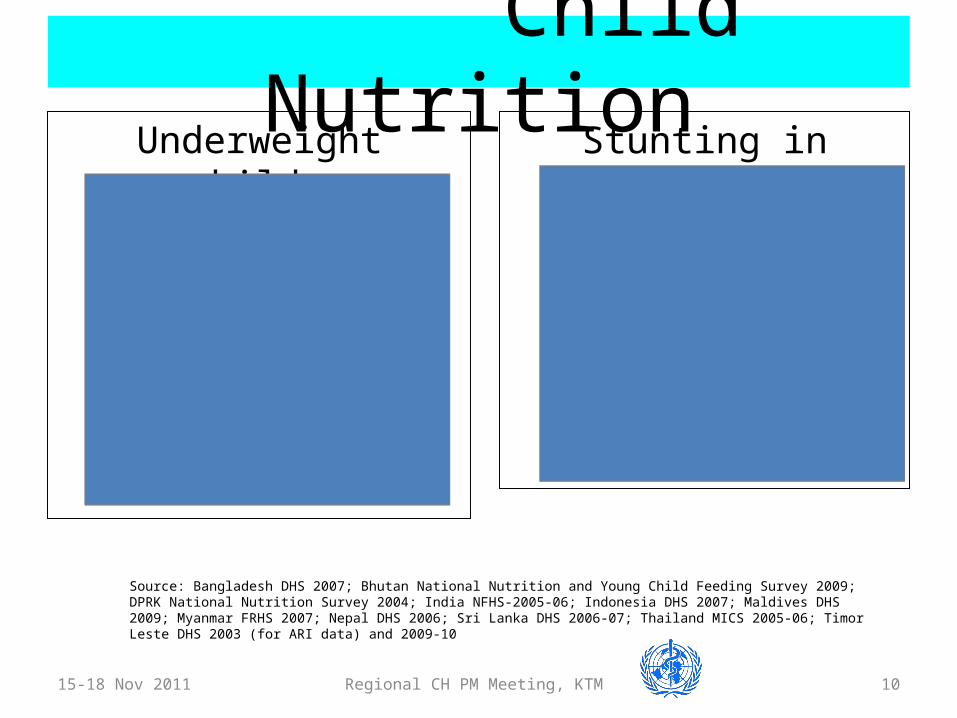
Child NutritionUnderweight children Stunting in children
Source: Bangladesh DHS 2007; Bhutan National Nutrition and Young Child Feeding Survey 2009; DPRK National Nutrition Survey 2004; India NFHS-2005-06; Indonesia DHS 2007; Maldives DHS 2009; Myanmar FRHS 2007; Nepal DHS 2006; Sri Lanka DHS 2006-07; Thailand MICS 2005-06; Timor Leste DHS 2003 (for ARI data) and 2009-10

15-18 Nov 2011 Regional CH PM Meeting, KTM 11
Low birth weight in SEA Region
Source: State of the World’s Children 2008, UNICEF
15
30
97
22
15
21 22
9
12
22
0
5
10
15
20
25
30
35

15-18 Nov 2011 Regional CH PM Meeting, KTM 12
Health system
Inputs Outputs Outcomes
(programme efforts) (coverage/ behaviours)
Policies Information to families Proportion of targetHuman resources Availability of services population who Financing Access to services received interventions;Logistics/supplies Quality of services
Determinants of Health
Socioeconomic and demographic factorsEnvironmental and behavioural risk factors
Health status
("impact")
Mortality
Morbidity -disability
Growth
Development
Well-being
Scope
Source: Health Metrics Network
Framework for measurement of health information
15-18 Nov 2011 Regional CH PM Meeting, KTM 13
Outcome indicators(Source: Coverage surveys including DHS/MICS surveys)

15-18 Nov 2011 Regional CH PM Meeting, KTM 14
Newborn Interventions• Proportion of deliveries
assisted by SBAs• Neonates protected against
tetanus at birth
18
71
97
47
79
98
64
19
99
97
30
0 20 40 60 80 100 120
Bangladesh
Bhutan
DPR Korea
India
Indonesia
Maldives
Myanmar
Nepal
Sri Lanka
Thailand
Timor Leste
Percent

15-18 Nov 2011 Regional CH PM Meeting, KTM 15
Management of sick children Children 0-59 months with
diarrhoea past two weeks given ORS
Children 0-59 months with suspected pneumonia taken to health care provider and received antibiotics (red bars)
Source: Bangladesh DHS 2007; Bhutan National Nutrition and Young Child Feeding Survey 2009; DPRK National Nutrition Survey 2004; India NFHS-2005-06; Indonesia DHS 2007; Maldives DHS 2009; Myanmar FRHS 2007; Nepal DHS 2006; Sri Lanka DHS 2006-07; Thailand MICS 2005-06; Timor Leste DHS 2003 (for ARI data) and 2009-10

15-18 Nov 2011 Regional CH PM Meeting, KTM 16
Health system
Inputs Outputs Outcomes
(programme efforts) (coverage/ behaviours)
Policies Information to families Proportion of targetHuman resources Availability of services population who Financing Access to services received interventions;Logistics/supplies
Determinants of Health
Socioeconomic and demographic factorsEnvironmental and behavioural risk factors
Health status
("impact")
Mortality
Morbidity -disability
Growth
Development
Well-being
Source: Health Metrics Network
Quality of Service
Framework for measurement

15-18 Nov 2011 Regional CH PM Meeting, KTM 17
Output indicators(Source: HFS, Hospital Assessment, MNCAH surveys)
OOUUTTPPUUTT IINNDDIICCAATTOORRSS
1. Proportion of first–level facilities with at least 60% of health workers who care for children trained in IMCI
2. Proportion of first-level health facilities with at least 1 trained midwife available
3. Proportion of hospitals or maternity facilities accredited as baby friendly in the previous two years
4. Availability of emergency obstetric care services
5. Proportion of villages with a trained CHW
6. Proportion of first level health facilities with all essential medicines for IMCI
7. Proportion of facilities that manage severely ill children with oxygen and paediatric delivery systems available in the paediatric ward
8. Proportion of sick children 0-59 months needing an antibiotic and/or an antimalarial who are prescribed the drug correctly
9. Proportion of caretakers of children 0-59 months who know at least two danger signs for seeking care immediately
15-18 Nov 2011 Regional CH PM Meeting, KTM 18
Health system
Inputs Outputs Outcomes
(programme efforts) (coverage/ behaviours)
Policies Information to families Proportion of targetHuman resources Availability of services population who Financing Access to services received interventions;Logistics/supplies
Determinants of Health
Socioeconomic and demographic factorsEnvironmental and behavioural risk factors
Health status
("impact")
Mortality
Morbidity -disability
Growth
Development
Well-being
Source: Health Metrics Network
Framework for measurement

15-18 Nov 2011 Regional CH PM Meeting, KTM 19
Input indicators(Source: Programme Reviews, Administrative records)
IINNPPUUTT IINNDDIICCAATTOORRSS
1. CRC reporting mechanism established and working
2. Maternity Protection Convention 183 ratified
3. Mechanism for monitoring the International Code for Marketing of Breastmilk substitutes established and working
4. Costed national plan for ensuring universal access to maternal, newborn and child survival interventions available
5. National maternal, newborn and child health coordinating committee established and meeting regularly
6. Proportion of medical, nursing and other health professional training schools giving pre-service IMCI training
7. Proportion of key service delivery policies and guidelines adopted
8. Proportion of districts implementing IMCI
9. Proportion of districts with a training plan for facility and community-based MNCH health workers

15-18 Nov 2011 Regional CH PM Meeting, KTM 20
Way forward
Collaborate for developing a Regional framework in alignment with Global framework including UN Information and Accountability Framework
15-18 Nov 2011 Regional CH PM Meeting, KTM 21