15-1 Why monopolies arise
29
299 I f you own a personal computer, it probably uses some version of Windows, the operating system sold by the Microsoft Corporation. When Microsoft first designed Windows many years ago, it applied for and received a copyright from the government. The copyright gives Microsoft the exclusive right to make and sell copies of the Windows operating system. If a person wants to buy a copy of Windows, she has little choice but to give Microsoft the approximately $100 that the firm has decided to charge for its product. Microsoft is said to have a monopoly in the market for Windows. Microsoft’s business decisions are not well described by the model of firm behavior we developed in the previous chapter. In that chapter, we analyzed competitive markets, in which many firms offer essentially identical prod- ucts, so each firm has little influence over the price it receives. By contrast, a monopoly such as Microsoft has no close competitors and, therefore, has the CHAPTER 15 Monopoly Copyright 2013 Cengage Learning. All Rights Reserved. May not be copied, scanned, or duplicated, in whole or in part. Due to electronic rights, some third party content may be suppressed from the eBook and/or eChapter(s). Editorial review has deemed that any suppressed content does not materially affect the overall learning experience. Cengage Learning reserves the right to remove additional content at any time if subsequent rights restrictions require it.
Transcript of 15-1 Why monopolies arise

299
If you own a personal computer, it probably uses some version of Windows, the operating system sold by the Microsoft Corporation. When Microsoft first designed Windows many years ago, it applied for and received a copyright
from the government. The copyright gives Microsoft the exclusive right to make and sell copies of the Windows operating system. If a person wants to buy a copy of Windows, she has little choice but to give Microsoft the approximately $100 that the firm has decided to charge for its product. Microsoft is said to have a monopoly in the market for Windows.
Microsoft’s business decisions are not well described by the model of firm behavior we developed in the previous chapter. In that chapter, we analyzed competitive markets, in which many firms offer essentially identical prod-ucts, so each firm has little influence over the price it receives. By contrast, a
monopoly such as Microsoft has no close competitors and, therefore, has the
Chapter
15Monopoly
65875_ch15_ptg01_299-328.indd 299 16/10/13 12:07 PM
Copyright 2013 Cengage Learning. All Rights Reserved. May not be copied, scanned, or duplicated, in whole or in part. Due to electronic rights, some third party content may be suppressed from the eBook and/or eChapter(s).Editorial review has deemed that any suppressed content does not materially affect the overall learning experience. Cengage Learning reserves the right to remove additional content at any time if subsequent rights restrictions require it.

300 Part V Firm Behavior and the organization oF industry
power to influence the market price of its product. Whereas a competitive firm is a price taker, a monopoly firm is a price maker.
In this chapter, we examine the implications of this market power. We will see that market power alters the relationship between a firm’s costs and the price at which it sells its product. A competitive firm takes the price of its output as given by the market and then chooses the quantity it will supply so that price equals marginal cost. By contrast, a monopoly charges a price that exceeds marginal cost. This result is clearly true in the case of Microsoft’s Windows. The marginal cost of Windows—the extra cost that Microsoft incurs by printing one more copy of the program onto a CD—is only a few dollars. The market price of Windows is many times its marginal cost.
It is not surprising that monopolies charge high prices for their products. Customers of monopolies might seem to have little choice but to pay whatever the monopoly charges. But if so, why does a copy of Windows not cost $1,000? Or $10,000? The reason is that if Microsoft were to set the price that high, fewer people would buy the product. People would buy fewer computers, switch to other operating systems, or make illegal copies. A monopoly firm can control the price of the good it sells, but because a high price reduces the quantity that its cus-tomers buy, the monopoly’s profits are not unlimited.
As we examine the production and pricing decisions of monopolies, we also consider the implications of monopoly for society as a whole. Monopoly firms, like competitive firms, aim to maximize profit. But this goal has very different ramifications for competitive and monopoly firms. In competitive markets, self-interested consumers and producers reach an equilibrium that promotes general economic well-being, as if guided by an invisible hand. By contrast, because monopoly firms are unchecked by competition, the outcome in a market with a monopoly is often not in the best interest of society.
One of the Ten Principles of Economics in Chapter 1 is that governments can sometimes improve market outcomes. The analysis in this chapter sheds more light on this principle. As we examine the problems that monopolies raise for society, we discuss the various ways in which government policymakers might respond to these problems. The U.S. government, for example, keeps a close eye on Microsoft’s business decisions. In 1994, it blocked Microsoft from buying Intuit, a leading seller of personal finance software, on the grounds that combin-ing the two firms would concentrate too much market power. Similarly, in 1998, the U.S. Department of Justice objected when Microsoft started integrating its Internet browser into its Windows operating system, claiming that this addition would extend the firm’s market power into new areas. In recent years, regulators in the United States and abroad have shifted their focus to firms with growing market power, such as Google and Samsung, but they also continue to monitor Microsoft’s compliance with the antitrust laws.
monopolya firm that is the sole seller of a product without close substitutes
15-1 Why monopolies ariseA firm is a monopoly if it is the sole seller of its product and if its product does not have close substitutes. The fundamental cause of monopoly is barriers to entry: A monopoly remains the only seller in its market because other firms cannot enter the market and compete with it. Barriers to entry, in turn, have three main sources:
• Monopoly resources: A key resource required for production is owned by a single firm.
65875_ch15_ptg01_299-328.indd 300 16/10/13 12:07 PM
Copyright 2013 Cengage Learning. All Rights Reserved. May not be copied, scanned, or duplicated, in whole or in part. Due to electronic rights, some third party content may be suppressed from the eBook and/or eChapter(s).Editorial review has deemed that any suppressed content does not materially affect the overall learning experience. Cengage Learning reserves the right to remove additional content at any time if subsequent rights restrictions require it.
CHaPtEr 15 monopoLy 301
• Government regulation: The government gives a single firm the exclusive right to produce some good or service.
• The production process: A single firm can produce output at a lower cost than can a larger number of firms.
Let’s briefly discuss each of these.
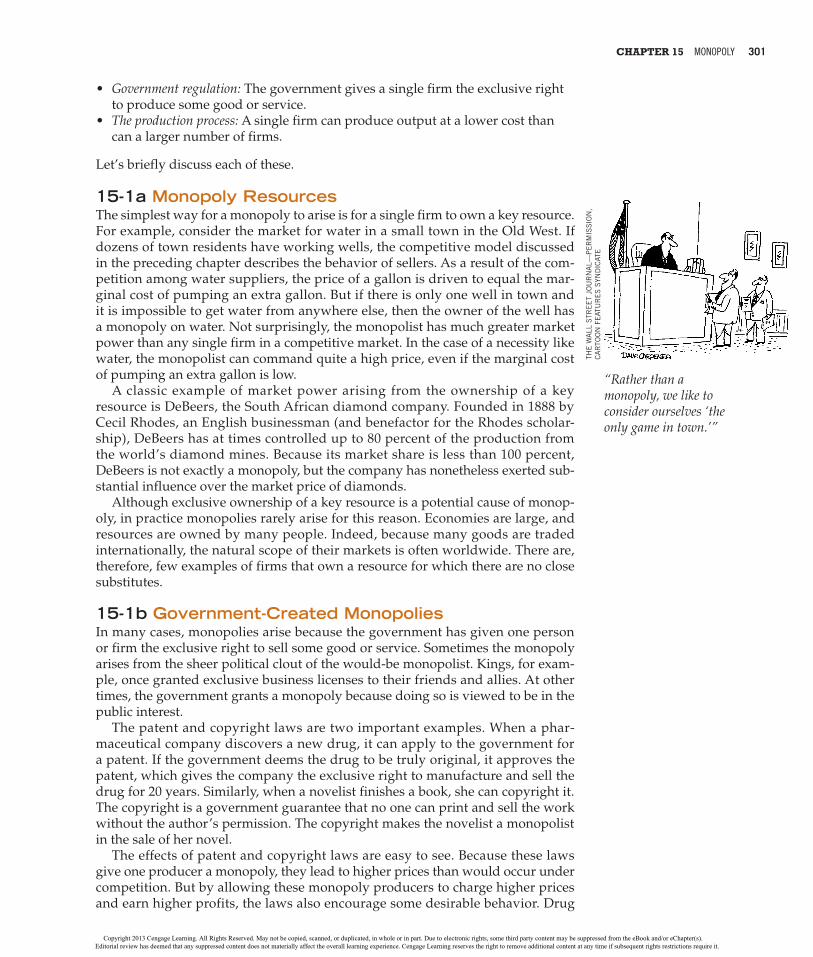
15-1a Monopoly ResourcesThe simplest way for a monopoly to arise is for a single firm to own a key resource. For example, consider the market for water in a small town in the Old West. If dozens of town residents have working wells, the competitive model discussed in the preceding chapter describes the behavior of sellers. As a result of the com-petition among water suppliers, the price of a gallon is driven to equal the mar-ginal cost of pumping an extra gallon. But if there is only one well in town and it is impossible to get water from anywhere else, then the owner of the well has a monopoly on water. Not surprisingly, the monopolist has much greater market power than any single firm in a competitive market. In the case of a necessity like water, the monopolist can command quite a high price, even if the marginal cost of pumping an extra gallon is low.
A classic example of market power arising from the ownership of a key resource is DeBeers, the South African diamond company. Founded in 1888 by Cecil Rhodes, an English businessman (and benefactor for the Rhodes scholar-ship), DeBeers has at times controlled up to 80 percent of the production from the world’s diamond mines. Because its market share is less than 100 percent, DeBeers is not exactly a monopoly, but the company has nonetheless exerted sub-stantial influence over the market price of diamonds.
Although exclusive ownership of a key resource is a potential cause of monop-oly, in practice monopolies rarely arise for this reason. Economies are large, and resources are owned by many people. Indeed, because many goods are traded internationally, the natural scope of their markets is often worldwide. There are, therefore, few examples of firms that own a resource for which there are no close substitutes.
15-1b Government-Created MonopoliesIn many cases, monopolies arise because the government has given one person or firm the exclusive right to sell some good or service. Sometimes the monopoly arises from the sheer political clout of the would-be monopolist. Kings, for exam-ple, once granted exclusive business licenses to their friends and allies. At other times, the government grants a monopoly because doing so is viewed to be in the public interest.
The patent and copyright laws are two important examples. When a phar-maceutical company discovers a new drug, it can apply to the government for a patent. If the government deems the drug to be truly original, it approves the patent, which gives the company the exclusive right to manufacture and sell the drug for 20 years. Similarly, when a novelist finishes a book, she can copyright it. The copyright is a government guarantee that no one can print and sell the work without the author’s permission. The copyright makes the novelist a monopolist in the sale of her novel.
The effects of patent and copyright laws are easy to see. Because these laws give one producer a monopoly, they lead to higher prices than would occur under competition. But by allowing these monopoly producers to charge higher prices and earn higher profits, the laws also encourage some desirable behavior. Drug
“Rather than a monopoly, we like to consider ourselves ‘the only game in town.’”
THE
WA
LL S
TRE
ET
JOU
RN
AL—
PE
RM
ISS
ION
,
CA
RTO
ON
FE
ATU
RE
S S
YND
ICAT
E
65875_ch15_ptg01_299-328.indd 301 16/10/13 12:07 PM
Copyright 2013 Cengage Learning. All Rights Reserved. May not be copied, scanned, or duplicated, in whole or in part. Due to electronic rights, some third party content may be suppressed from the eBook and/or eChapter(s).Editorial review has deemed that any suppressed content does not materially affect the overall learning experience. Cengage Learning reserves the right to remove additional content at any time if subsequent rights restrictions require it.

302 Part V Firm Behavior and the organization oF industry
companies are allowed to be monopolists in the drugs they discover to encour-age research. Authors are allowed to be monopolists in the sale of their books to encourage them to write more and better books.
Thus, the laws governing patents and copyrights have benefits and costs. The benefits of the patent and copyright laws are the increased incentives for creative activity. These benefits are offset, to some extent, by the costs of monopoly pricing, which we examine fully later in this chapter.
15-1c Natural MonopoliesAn industry is a natural monopoly when a single firm can supply a good or service to an entire market at a lower cost than could two or more firms. A natu-ral monopoly arises when there are economies of scale over the relevant range of output. Figure 1 shows the average total costs of a firm with economies of scale. In this case, a single firm can produce any amount of output at the least cost. That is, for any given amount of output, a larger number of firms leads to less output per firm and higher average total cost.
An example of a natural monopoly is the distribution of water. To provide water to residents of a town, a firm must build a network of pipes throughout the town. If two or more firms were to compete in the provision of this service, each firm would have to pay the fixed cost of building a network. Thus, the average total cost of water is lowest if a single firm serves the entire market.
We saw other examples of natural monopolies when we discussed public goods and common resources in Chapter 11. We noted that club goods are exclud-able but not rival in consumption. An example is a bridge used so infrequently that it is never congested. The bridge is excludable because a toll collector can prevent someone from using it. The bridge is not rival in consumption because use of the bridge by one person does not diminish the ability of others to use it. Because there is a large fixed cost of building the bridge and a negligible marginal cost of additional users, the average total cost of a trip across the bridge (the total cost divided by the number of trips) falls as the number of trips rises. Hence, the bridge is a natural monopoly.
When a firm is a natural monopoly, it is less concerned about new entrants erod-ing its monopoly power. Normally, a firm has trouble maintaining a monopoly
natural monopolya monopoly that arises because a single firm can supply a good or service to an entire market at a smaller cost than could two or more firms
FIGURE1EconomiesofScaleasaCauseofMonopolyWhen a firm’s average-total-cost curve continually declines, the firm has what is called a natural monopoly. In this case, when production is divided among more firms, each firm produces less, and average total cost rises. As a result, a single firm can produce any given amount at the least cost.
Quantity of Output
Averagetotalcost
0
Cost
65875_ch15_ptg01_299-328.indd 302 16/10/13 12:07 PM
Copyright 2013 Cengage Learning. All Rights Reserved. May not be copied, scanned, or duplicated, in whole or in part. Due to electronic rights, some third party content may be suppressed from the eBook and/or eChapter(s).Editorial review has deemed that any suppressed content does not materially affect the overall learning experience. Cengage Learning reserves the right to remove additional content at any time if subsequent rights restrictions require it.

CHaPtEr 15 monopoLy 303
position without ownership of a key resource or protection from the government. The monopolist’s profit attracts entrants into the market, and these entrants make the market more competitive. By contrast, entering a market in which another firm has a natural monopoly is unattractive. Would-be entrants know that they cannot achieve the same low costs that the monopolist enjoys because, after entry, each firm would have a smaller piece of the market.
In some cases, the size of the market is one determinant of whether an industry is a natural monopoly. Again, consider a bridge across a river. When the popula-tion is small, the bridge may be a natural monopoly. A single bridge can satisfy the entire demand for trips across the river at lowest cost. Yet as the population grows and the bridge becomes congested, satisfying the entire demand may require two or more bridges across the same river. Thus, as a market expands, a natural monopoly can evolve into a more competitive market.
Quick Quiz What are the three reasons that a market might have a monopoly? • Give two examples of monopolies and explain the reason for each.
15-2 how monopolies make production and pricing decisionsNow that we know how monopolies arise, we can consider how a monopoly firm decides how much of its product to make and what price to charge for it. The analysis of monopoly behavior in this section is the starting point for evaluating whether monopolies are desirable and what policies the government might pur-sue in monopoly markets.
15-2a Monopoly versus CompetitionThe key difference between a competitive firm and a monopoly is the monopoly’s ability to influence the price of its output. A competitive firm is small relative to the market in which it operates and, therefore, has no power to influence the price of its output. It takes the price as given by market conditions. By contrast, because a monopoly is the sole producer in its market, it can alter the price of its good by adjusting the quantity it supplies to the market.
One way to view this difference between a competitive firm and a monopoly is to consider the demand curve that each firm faces. When we analyzed profit maximization by competitive firms in the preceding chapter, we drew the market price as a horizontal line. Because a competitive firm can sell as much or as little as it wants at this price, the competitive firm faces a horizontal demand curve, as in panel (a) of Figure 2. In effect, because the competitive firm sells a product with many perfect substitutes (the products of all the other firms in its market), the demand curve that any one firm faces is perfectly elastic.
By contrast, because a monopoly is the sole producer in its market, its demand curve is the market demand curve. Thus, the monopolist’s demand curve slopes downward for all the usual reasons, as in panel (b) of Figure 2. If the monopolist raises the price of its good, consumers buy less of it. Looked at another way, if the monopolist reduces the quantity of output it produces and sells, the price of its output increases.
The market demand curve provides a constraint on a monopoly’s ability to profit from its market power. A monopolist would prefer, if it were possible, to charge a high price and sell a large quantity at that high price. The market demand
65875_ch15_ptg01_299-328.indd 303 16/10/13 12:07 PM
Copyright 2013 Cengage Learning. All Rights Reserved. May not be copied, scanned, or duplicated, in whole or in part. Due to electronic rights, some third party content may be suppressed from the eBook and/or eChapter(s).Editorial review has deemed that any suppressed content does not materially affect the overall learning experience. Cengage Learning reserves the right to remove additional content at any time if subsequent rights restrictions require it.

304 Part V Firm Behavior and the organization oF industry
curve makes that outcome impossible. In particular, the market demand curve describes the combinations of price and quantity that are available to a monopoly firm. By adjusting the quantity produced (or equivalently, the price charged), the monopolist can choose any point on the demand curve, but it cannot choose a point off the demand curve.
What price and quantity of output will the monopolist choose? As with com-petitive firms, we assume that the monopolist’s goal is to maximize profit. Because the firm’s profit is total revenue minus total costs, our next task in explaining monopoly behavior is to examine a monopolist’s revenue.
15-2b A Monopoly’s RevenueConsider a town with a single producer of water. Table 1 shows how the monopo-ly’s revenue might depend on the amount of water produced.
The first two columns show the monopolist’s demand schedule. If the monop-olist produces 1 gallon of water, it can sell that gallon for $10. If it produces 2 gal-lons, it must lower the price to $9 to sell both gallons. If it produces 3 gallons, it must lower the price to $8. And so on. If you graphed these two columns of num-bers, you would get a typical downward-sloping demand curve.
The third column of the table presents the monopolist’s total revenue. It equals the quantity sold (from the first column) times the price (from the second column). The fourth column computes the firm’s average revenue, the amount of revenue the firm receives per unit sold. We compute average revenue by taking the number for total revenue in the third column and dividing it by the quantity of output in the first column. As we discussed in the previous chapter, average revenue always equals the price of the good. This is true for monopolists as well as for competitive firms.
The last column of Table 1 computes the firm’s marginal revenue, the amount of revenue that the firm receives for each additional unit of output. We compute
FIGURE2 Because competitive firms are price takers, they in effect face horizontal demand curves, as in panel (a). Because a monopoly firm is the sole producer in its market, it faces the downward-sloping market demand curve, as in panel (b). As a result, the monopoly has to accept a lower price if it wants to sell more output.
DemandCurvesforCompetitiveandMonopolyFirms
Quantity of Output
Demand
(a) A Competitive Firm’s Demand Curve (b) A Monopolist’s Demand Curve
0
Price
Quantity of Output0
Price
Demand
65875_ch15_ptg01_299-328.indd 304 16/10/13 12:07 PM
Copyright 2013 Cengage Learning. All Rights Reserved. May not be copied, scanned, or duplicated, in whole or in part. Due to electronic rights, some third party content may be suppressed from the eBook and/or eChapter(s).Editorial review has deemed that any suppressed content does not materially affect the overall learning experience. Cengage Learning reserves the right to remove additional content at any time if subsequent rights restrictions require it.

CHaPtEr 15 monopoLy 305
marginal revenue by taking the change in total revenue when output increases by 1 unit. For example, when the firm is producing 3 gallons of water, it receives total revenue of $24. Raising production to 4 gallons increases total revenue to $28. Thus, marginal revenue from the sale of the fourth gallon is $28 minus $24, or $4.
Table 1 shows a result that is important for understanding monopoly behavior: A monopolist’s marginal revenue is always less than the price of its good. For example, if the firm raises production of water from 3 to 4 gallons, it will increase total revenue by only $4, even though it will be able to sell each gallon for $7. For a monopoly, marginal revenue is lower than price because a monopoly faces a downward-sloping demand curve. To increase the amount sold, a monopoly firm must lower the price it charges to all customers. Hence, to sell the fourth gallon of water, the monopolist will get $1 less revenue for each of the first 3 gallons. This $3 loss accounts for the difference between the price of the fourth gallon ($7) and the marginal revenue of that fourth gallon ($4).
Marginal revenue for monopolies is very different from marginal revenue for competitive firms. When a monopoly increases the amount it sells, this action has two effects on total revenue (P × Q):
• The output effect: More output is sold, so Q is higher, which tends to increase total revenue.
• The price effect: The price falls, so P is lower, which tends to decrease total revenue.
Because a competitive firm can sell all it wants at the market price, there is no price effect. When it increases production by 1 unit, it receives the market price for
AMonopoly’sTotal,Average,andMarginalRevenue
TAblE1Quantity of Water
(Q )Price (P )
Total Revenue (TR = P × Q )
Average Revenue (AR = TR / Q )
Marginal Revenue (MR = ∆TR / ∆Q )
0 gallons $11 $ 0 —$10
1 10 10 $108
2 9 18 96
3 8 24 84
4 7 28 72
5 6 30 60
6 5 30 5−2
7 4 28 4−4
8 3 24 3
65875_ch15_ptg01_299-328.indd 305 16/10/13 12:07 PM
Copyright 2013 Cengage Learning. All Rights Reserved. May not be copied, scanned, or duplicated, in whole or in part. Due to electronic rights, some third party content may be suppressed from the eBook and/or eChapter(s).Editorial review has deemed that any suppressed content does not materially affect the overall learning experience. Cengage Learning reserves the right to remove additional content at any time if subsequent rights restrictions require it.
306 Part V Firm Behavior and the organization oF industry
that unit, and it does not receive any less for the units it was already selling. That is, because the competitive firm is a price taker, its marginal revenue equals the price of its good. By contrast, when a monopoly increases production by 1 unit, it must reduce the price it charges for every unit it sells, and this cut in price reduces revenue on the units it was already selling. As a result, a monopoly’s marginal revenue is less than its price.
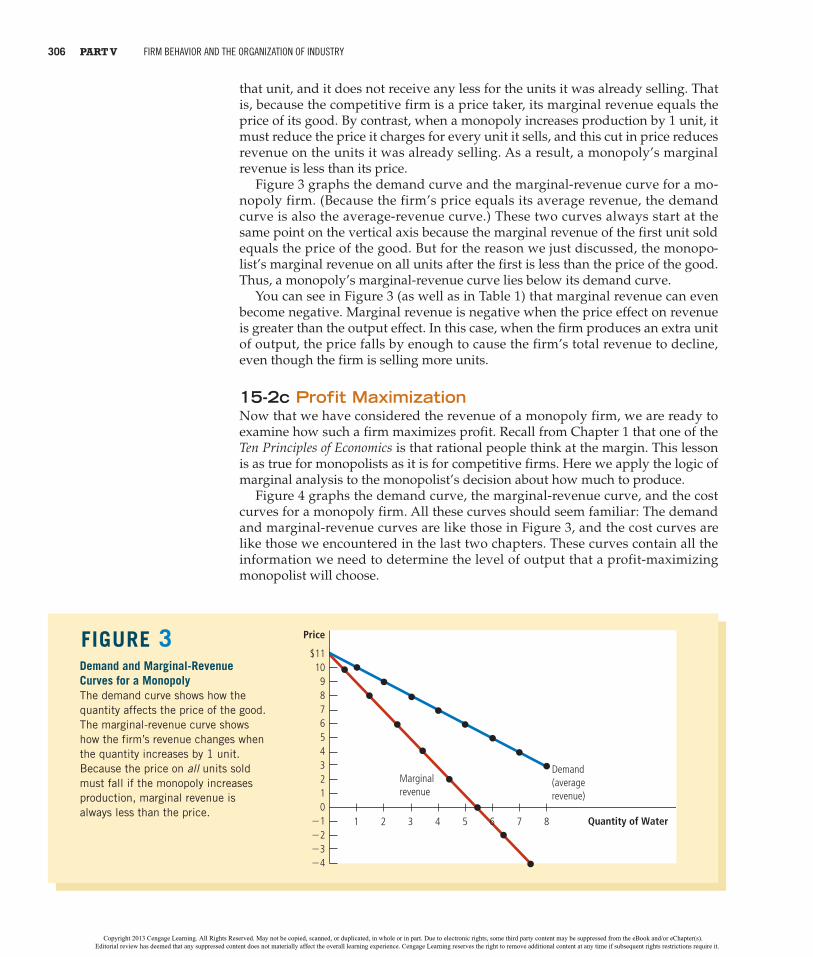
Figure 3 graphs the demand curve and the marginal-revenue curve for a mo-nopoly firm. (Because the firm’s price equals its average revenue, the demand curve is also the average-revenue curve.) These two curves always start at the same point on the vertical axis because the marginal revenue of the first unit sold equals the price of the good. But for the reason we just discussed, the monopo-list’s marginal revenue on all units after the first is less than the price of the good. Thus, a monopoly’s marginal-revenue curve lies below its demand curve.
You can see in Figure 3 (as well as in Table 1) that marginal revenue can even become negative. Marginal revenue is negative when the price effect on revenue is greater than the output effect. In this case, when the firm produces an extra unit of output, the price falls by enough to cause the firm’s total revenue to decline, even though the firm is selling more units.
15-2c Profit MaximizationNow that we have considered the revenue of a monopoly firm, we are ready to examine how such a firm maximizes profit. Recall from Chapter 1 that one of the Ten Principles of Economics is that rational people think at the margin. This lesson is as true for monopolists as it is for competitive firms. Here we apply the logic of marginal analysis to the monopolist’s decision about how much to produce.
Figure 4 graphs the demand curve, the marginal-revenue curve, and the cost curves for a monopoly firm. All these curves should seem familiar: The demand and marginal-revenue curves are like those in Figure 3, and the cost curves are like those we encountered in the last two chapters. These curves contain all the information we need to determine the level of output that a profit-maximizing monopolist will choose.
FIGURE3DemandandMarginal-RevenueCurvesforaMonopolyThe demand curve shows how the quantity affects the price of the good. The marginal-revenue curve shows how the firm’s revenue changes when the quantity increases by 1 unit. Because the price on all units sold must fall if the monopoly increases production, marginal revenue is always less than the price.
Quantity of Water
Price
$11109876543210
21222324
Demand(averagerevenue)
Marginalrevenue
1 2 3 4 5 6 7 8
65875_ch15_ptg01_299-328.indd 306 16/10/13 12:07 PM
Copyright 2013 Cengage Learning. All Rights Reserved. May not be copied, scanned, or duplicated, in whole or in part. Due to electronic rights, some third party content may be suppressed from the eBook and/or eChapter(s).Editorial review has deemed that any suppressed content does not materially affect the overall learning experience. Cengage Learning reserves the right to remove additional content at any time if subsequent rights restrictions require it.

CHaPtEr 15 monopoLy 307
Suppose, first, that the firm is producing at a low level of output, such as Q1. In this case, marginal cost is less than marginal revenue. If the firm increased pro-duction by 1 unit, the additional revenue would exceed the additional costs, and profit would rise. Thus, when marginal cost is less than marginal revenue, the firm can increase profit by producing more units.
A similar argument applies at high levels of output, such as Q2. In this case, marginal cost is greater than marginal revenue. If the firm reduced produc-tion by 1 unit, the costs saved would exceed the revenue lost. Thus, if mar-ginal cost is greater than marginal revenue, the firm can raise profit by reducing production.
In the end, the firm adjusts its level of production until the quantity reaches QMAX, at which marginal revenue equals marginal cost. Thus, the monopolist’s profit-maximizing quantity of output is determined by the intersection of the marginal-revenue curve and the marginal-cost curve. In Figure 4, this intersection occurs at point A.
You might recall from the previous chapter that competitive firms also choose the quantity of output at which marginal revenue equals marginal cost. In follow-ing this rule for profit maximization, competitive firms and monopolies are alike. But there is also an important difference between these types of firms: The mar-ginal revenue of a competitive firm equals its price, whereas the marginal revenue of a monopoly is less than its price. That is,
For a competitive firm: P = MR = MC.For a monopoly firm: P > MR = MC.
The equality of marginal revenue and marginal cost determines the profit- maximizing quantity for both types of firm. What differs is how the price is related to marginal revenue and marginal cost.
FIGURE4ProfitMaximizationforaMonopolyA monopoly maximizes profit by choosing the quantity at which marginal revenue equals marginal cost (point A). It then uses the demand curve to find the price that will induce consumers to buy that quantity (point B).
Monopolyprice
QuantityQ1 Q2QMAX0
Costs andRevenue
Demand
Average total cost
Marginal revenue
Marginalcost
B
1. The intersection of themarginal-revenue curveand the marginal-costcurve determines theprofit-maximizingquantity . . .
A
2. . . . and then the demandcurve shows the priceconsistent with this quantity.
65875_ch15_ptg01_299-328.indd 307 16/10/13 12:07 PM
Copyright 2013 Cengage Learning. All Rights Reserved. May not be copied, scanned, or duplicated, in whole or in part. Due to electronic rights, some third party content may be suppressed from the eBook and/or eChapter(s).Editorial review has deemed that any suppressed content does not materially affect the overall learning experience. Cengage Learning reserves the right to remove additional content at any time if subsequent rights restrictions require it.

308 Part V Firm Behavior and the organization oF industry
How does the monopoly find the profit-maximizing price for its product? The demand curve answers this question because the demand curve relates the amount that customers are willing to pay to the quantity sold. Thus, after the monopoly firm chooses the quantity of output that equates marginal revenue and marginal cost, it uses the demand curve to find the highest price it can charge for that quantity. In Figure 4, the profit-maximizing price is found at point B.
We can now see a key difference between markets with competitive firms and markets with a monopoly firm: In competitive markets, price equals marginal cost. In monopolized markets, price exceeds marginal cost. As we will see in a moment, this finding is crucial to understanding the social cost of monopoly.
15-2d A Monopoly’s ProfitHow much profit does a monopoly make? To see a monopoly firm’s profit in a graph, recall that profit equals total revenue (TR) minus total costs (TC):
Profit = TR − TC.
We can rewrite this as
Profit = (TR/Q − TC/Q) × Q.
TR/Q is average revenue, which equals the price, P, and TC/Q is average total cost, ATC. Therefore,
Profit = (P − ATC) × Q.
This equation for profit (which also holds for competitive firms) allows us to mea-sure the monopolist’s profit in our graph.
Consider the shaded box in Figure 5. The height of the box (the segment BC) is price minus average total cost, P − ATC, which is the profit on the typical unit
Why a Monopoly Does Not Have a Supply Curve
you may have noticed that we have analyzed the price in a monopoly market using the market demand curve and the firm’s cost curves.
We have not made any mention of the market supply curve. By contrast, when we analyzed prices in competitive markets beginning in Chapter 4, the two most important words were always supply and demand.
What happened to the supply curve? although monopoly firms make decisions about what quantity to supply (in the way described in this chapter), a monopoly does not have a supply curve. a supply curve tells us the quantity that firms choose to supply at any given price. this concept makes sense when we are analyzing competitive firms, which are price takers. But a monopoly firm is a price maker, not a price taker. it is not meaningful to ask what amount such a firm would produce at
any price because the firm sets the price at the same time as it chooses the quan-tity to supply.
indeed, the monopolist’s decision about how much to supply is impossible to separate from the demand curve it faces. the shape of the demand curve determines the shape of the marginal-revenue curve, which in turn determines the monopolist’s profit-maximizing quantity. in a competitive market, supply decisions can be ana-lyzed without knowing the demand curve, but that is not true in a monopoly market. therefore, we never talk about a monopoly’s supply curve.
FYI
65875_ch15_ptg01_299-328.indd 308 16/10/13 12:08 PM
Copyright 2013 Cengage Learning. All Rights Reserved. May not be copied, scanned, or duplicated, in whole or in part. Due to electronic rights, some third party content may be suppressed from the eBook and/or eChapter(s).Editorial review has deemed that any suppressed content does not materially affect the overall learning experience. Cengage Learning reserves the right to remove additional content at any time if subsequent rights restrictions require it.

CHaPtEr 15 monopoLy 309
sold. The width of the box (the segment DC) is the quantity sold, QMAX. Therefore, the area of this box is the monopoly firm’s total profit.
FIGURE5TheMonopolist’sProfitThe area of the box BCDE equals the profit of the monopoly firm. The height of the box (BC) is price minus average total cost, which equals profit per unit sold. The width of the box (DC) is the number of units sold.
Monopolyprice
Averagetotalcost
QuantityQMAX0
Costs andRevenue
Demand
Marginal cost
Marginal revenue
B
C
E
D
Monopolyprofit
Average total cost
Monopoly Drugs versus Generic DrugsAccording to our analysis, prices are determined differently in
monopolized markets and competitive markets. A natural place to test this theory is the market for pharmaceutical drugs because this market takes
on both market structures. When a firm discovers a new drug, patent laws give the firm a monopoly on the sale of that drug. But eventually, the firm’s patent runs out, and any company can make and sell the drug. At that time, the market switches from being monopolistic to being competitive.
What should happen to the price of a drug when the patent runs out? Figure 6 shows the market for a typical drug. In this figure, the marginal cost of produc-ing the drug is constant. (This is approximately true for many drugs.) During the life of the patent, the monopoly firm maximizes profit by producing the quantity at which marginal revenue equals marginal cost and charging a price well above marginal cost. But when the patent runs out, the profit from making the drug should encourage new firms to enter the market. As the market becomes more competitive, the price should fall to equal marginal cost.
Experience is, in fact, consistent with our theory. When the patent on a drug expires, other companies quickly enter and begin selling so-called generic prod-ucts that are chemically identical to the former monopolist’s brand-name product. And just as our analysis predicts, the price of the competitively produced generic drug is well below the price that the monopolist was charging.
The expiration of a patent, however, does not cause the monopolist to lose all its market power. Some consumers remain loyal to the brand-name drug, per-haps out of fear that the new generic drugs are not actually the same as the drug
case study
65875_ch15_ptg01_299-328.indd 309 16/10/13 12:08 PM
Copyright 2013 Cengage Learning. All Rights Reserved. May not be copied, scanned, or duplicated, in whole or in part. Due to electronic rights, some third party content may be suppressed from the eBook and/or eChapter(s).Editorial review has deemed that any suppressed content does not materially affect the overall learning experience. Cengage Learning reserves the right to remove additional content at any time if subsequent rights restrictions require it.

310 Part V Firm Behavior and the organization oF industry
15-3 the Welfare Cost of monopolies
FIGURE6TheMarketforDrugsWhen a patent gives a firm a monopoly over the sale of a drug, the firm charges the monopoly price, which is well above the marginal cost of making the drug. When the patent on a drug runs out, new firms enter the market, making it more competitive. As a result, the price falls from the monopoly price to marginal cost.
Priceduring
patent life
Price afterpatentexpires
QuantityMonopolyquantity
Competitivequantity
0
Costs andRevenue
Demand
Marginalcost
Marginalrevenue
they have been using for years. As a result, the former monopolist can continue to charge a price above the price charged by its new competitors.
For example, one of the most widely used antidepressants is the drug fluox-etine, which is taken by millions of Americans. Because the patent on this drug expired in 2001, a consumer today has the choice between the original drug, sold under the brand name Prozac, and a generic version of the same medicine. Prozac sells for about three times the price of generic fluoxetine. This price differential can persist because some consumers are not convinced that the two pills are per-fect substitutes.
Quick Quiz Explain how a monopolist chooses the quantity of output to produce and the price to charge.
Is monopoly a good way to organize a market? We have seen that a monopoly, in contrast to a competitive firm, charges a price above marginal cost. From the standpoint of consumers, this high price makes monopoly undesirable. At the same time, however, the monopoly is earning profit from charging this high price. From the standpoint of the owners of the firm, the high price makes monopoly very desirable. Is it possible that the benefits to the firm’s owners exceed the costs imposed on consumers, making monopoly desirable from the standpoint of soci-ety as a whole?
We can answer this question using the tools of welfare economics. Recall from Chapter 7 that total surplus measures the economic well-being of buyers and sellers in a market. Total surplus is the sum of consumer surplus and producer surplus. Consumer surplus is consumers’ willingness to pay for a good minus
65875_ch15_ptg01_299-328.indd 310 16/10/13 12:08 PM
Copyright 2013 Cengage Learning. All Rights Reserved. May not be copied, scanned, or duplicated, in whole or in part. Due to electronic rights, some third party content may be suppressed from the eBook and/or eChapter(s).Editorial review has deemed that any suppressed content does not materially affect the overall learning experience. Cengage Learning reserves the right to remove additional content at any time if subsequent rights restrictions require it.

CHaPtEr 15 monopoLy 311
the amount they actually pay for it. Producer surplus is the amount producers receive for a good minus their costs of producing it. In this case, there is a single producer—the monopolist.
You can probably guess the result of this analysis. In Chapter 7, we concluded that the equilibrium of supply and demand in a competitive market is not only a natural outcome but also a desirable one. The invisible hand of the market leads to an allocation of resources that makes total surplus as large as it can be. Because a monopoly leads to an allocation of resources different from that in a competi-tive market, the outcome must, in some way, fail to maximize total economic well-being.
15-3a The Deadweight LossWe begin by considering what the monopoly firm would do if it were run by a benevolent social planner. The social planner cares not only about the profit earned by the firm’s owners but also about the benefits received by the firm’s consumers. The planner tries to maximize total surplus, which equals producer surplus (profit) plus consumer surplus. Keep in mind that total surplus equals the value of the good to consumers minus the costs of making the good incurred by the monopoly producer.
Figure 7 analyzes how a benevolent social planner would choose the monopoly’s level of output. The demand curve reflects the value of the good to consumers, as measured by their willingness to pay for it. The marginal-cost curve reflects the costs of the monopolist. Thus, the socially efficient quantity is found where the demand curve and the marginal-cost curve intersect. Below this quantity, the value
FIGURE7TheEfficientlevelofOutputA benevolent social planner maximizes total surplus in the market by choosing the level of output where the demand curve and the marginal-cost curve intersect. Below this level, the value of the good to the marginal buyer (as reflected in the demand curve) exceeds the marginal cost of making the good. Above this level, the value to the marginal buyer is less than the marginal cost.
Quantity0
Price
Demand(value to buyers)
Efficientquantity
Marginal cost
Value to buyersis greater thancost to seller.
Value to buyersis less thancost to seller.
Costto
monopolist
Costto
monopolist
Valueto
buyers
Valueto
buyers
65875_ch15_ptg01_299-328.indd 311 16/10/13 12:08 PM
Copyright 2013 Cengage Learning. All Rights Reserved. May not be copied, scanned, or duplicated, in whole or in part. Due to electronic rights, some third party content may be suppressed from the eBook and/or eChapter(s).Editorial review has deemed that any suppressed content does not materially affect the overall learning experience. Cengage Learning reserves the right to remove additional content at any time if subsequent rights restrictions require it.
312 Part V Firm Behavior and the organization oF industry
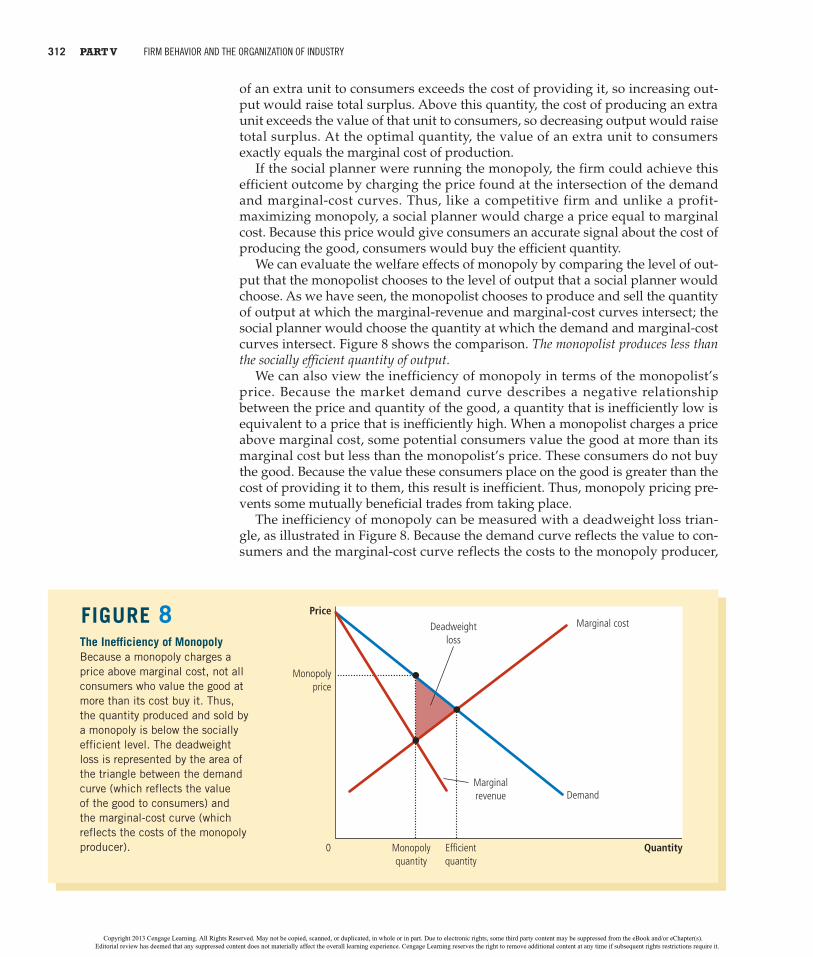
of an extra unit to consumers exceeds the cost of providing it, so increasing out-put would raise total surplus. Above this quantity, the cost of producing an extra unit exceeds the value of that unit to consumers, so decreasing output would raise total surplus. At the optimal quantity, the value of an extra unit to consumers exactly equals the marginal cost of production.
If the social planner were running the monopoly, the firm could achieve this efficient outcome by charging the price found at the intersection of the demand and marginal-cost curves. Thus, like a competitive firm and unlike a profit- maximizing monopoly, a social planner would charge a price equal to marginal cost. Because this price would give consumers an accurate signal about the cost of producing the good, consumers would buy the efficient quantity.
We can evaluate the welfare effects of monopoly by comparing the level of out-put that the monopolist chooses to the level of output that a social planner would choose. As we have seen, the monopolist chooses to produce and sell the quantity of output at which the marginal-revenue and marginal-cost curves intersect; the social planner would choose the quantity at which the demand and marginal-cost curves intersect. Figure 8 shows the comparison. The monopolist produces less than the socially efficient quantity of output.
We can also view the inefficiency of monopoly in terms of the monopolist’s price. Because the market demand curve describes a negative relationship between the price and quantity of the good, a quantity that is inefficiently low is equivalent to a price that is inefficiently high. When a monopolist charges a price above marginal cost, some potential consumers value the good at more than its marginal cost but less than the monopolist’s price. These consumers do not buy the good. Because the value these consumers place on the good is greater than the cost of providing it to them, this result is inefficient. Thus, monopoly pricing pre-vents some mutually beneficial trades from taking place.
The inefficiency of monopoly can be measured with a deadweight loss trian-gle, as illustrated in Figure 8. Because the demand curve reflects the value to con-sumers and the marginal-cost curve reflects the costs to the monopoly producer,
FIGURE8TheInefficiencyofMonopolyBecause a monopoly charges a price above marginal cost, not all consumers who value the good at more than its cost buy it. Thus, the quantity produced and sold by a monopoly is below the socially efficient level. The deadweight loss is represented by the area of the triangle between the demand curve (which reflects the value of the good to consumers) and the marginal-cost curve (which reflects the costs of the monopoly producer). Quantity0
Price
Efficientquantity
Monopolyprice
Monopolyquantity
Deadweightloss
DemandMarginalrevenue
Marginal cost
65875_ch15_ptg01_299-328.indd 312 16/10/13 12:08 PM
Copyright 2013 Cengage Learning. All Rights Reserved. May not be copied, scanned, or duplicated, in whole or in part. Due to electronic rights, some third party content may be suppressed from the eBook and/or eChapter(s).Editorial review has deemed that any suppressed content does not materially affect the overall learning experience. Cengage Learning reserves the right to remove additional content at any time if subsequent rights restrictions require it.

CHaPtEr 15 monopoLy 313
the area of the deadweight loss triangle between the demand curve and the marginal-cost curve equals the total surplus lost because of monopoly pricing. It is the reduction in economic well-being that results from the monopoly’s use of its market power.
The deadweight loss caused by monopoly is similar to the deadweight loss caused by a tax. Indeed, a monopolist is like a private tax collector. As we saw in Chapter 8, a tax on a good places a wedge between consumers’ willingness to pay (as reflected by the demand curve) and producers’ costs (as reflected by the supply curve). Because a monopoly exerts its market power by charging a price above marginal cost, it creates a similar wedge. In both cases, the wedge causes the quantity sold to fall short of the social optimum. The difference between the two cases is that the government gets the revenue from a tax, whereas a private firm gets the monopoly profit.
15-3b The Monopoly’s Profit: A Social Cost?It is tempting to decry monopolies for “profiteering” at the expense of the public. And indeed, a monopoly firm does earn a profit by virtue of its market power. According to the economic analysis of monopoly, however, the firm’s profit is not in itself necessarily a problem for society.
Welfare in a monopolized market, like all markets, includes the welfare of both consumers and producers. Whenever a consumer pays an extra dollar to a pro-ducer because of a monopoly price, the consumer is worse off by a dollar and the producer is better off by the same amount. This transfer from the consumers of the good to the owners of the monopoly does not affect the market’s total surplus—the sum of consumer and producer surplus. In other words, the monopoly profit itself represents not a reduction in the size of the economic pie but merely a big-ger slice for producers and a smaller slice for consumers. Unless consumers are for some reason more deserving than producers—a normative judgment about equity that goes beyond the realm of economic efficiency—the monopoly profit is not a social problem.
The problem in a monopolized market arises because the firm produces and sells a quantity of output below the level that maximizes total surplus. The deadweight loss measures how much the economic pie shrinks as a result. This inefficiency is connected to the monopoly’s high price: Consumers buy fewer units when the firm raises its price above marginal cost. But keep in mind that the profit earned on the units that continue to be sold is not the problem. The problem stems from the inefficiently low quantity of output. Put differently, if the high monopoly price did not discourage some consumers from buying the good, it would raise producer surplus by exactly the amount it reduced consumer surplus, leaving total surplus the same as could be achieved by a benevolent social planner.
There is, however, a possible exception to this conclusion. Suppose that a monopoly firm has to incur additional costs to maintain its monopoly position. For example, a firm with a government-created monopoly might need to hire lob-byists to convince lawmakers to continue its monopoly. In this case, the monopoly may use up some of its monopoly profits paying for these additional costs. If so, the social loss from monopoly includes both these costs and the deadweight loss resulting from reduced output.
Quick Quiz How does a monopolist’s quantity of output compare to the quantity of output that maximizes total surplus? How does this difference relate to the concept of dead-weight loss?
65875_ch15_ptg01_299-328.indd 313 16/10/13 12:08 PM
Copyright 2013 Cengage Learning. All Rights Reserved. May not be copied, scanned, or duplicated, in whole or in part. Due to electronic rights, some third party content may be suppressed from the eBook and/or eChapter(s).Editorial review has deemed that any suppressed content does not materially affect the overall learning experience. Cengage Learning reserves the right to remove additional content at any time if subsequent rights restrictions require it.

314 Part V Firm Behavior and the organization oF industry
15-4 price discriminationSo far, we have been assuming that the monopoly firm charges the same price to all customers. Yet in many cases, firms sell the same good to different customers for different prices, even though the costs of producing for the two customers are the same. This practice is called price discrimination.
Before discussing the behavior of a price-discriminating monopolist, we should note that price discrimination is not possible when a good is sold in a competi-tive market. In a competitive market, many firms are selling the same good at the market price. No firm is willing to charge a lower price to any customer because the firm can sell all it wants at the market price. And if any firm tried to charge a higher price to a customer, that customer would buy from another firm. For a firm to price discriminate, it must have some market power.
15-4a A Parable about PricingTo understand why a monopolist would price discriminate, let’s consider an example. Imagine that you are the president of Readalot Publishing Company. Readalot’s best-selling author has just written a new novel. To keep things simple, let’s imagine that you pay the author a flat $2 million for the exclusive rights to publish the book. Let’s also assume that the cost of printing the book is zero (as it would be, for example, for an e-book). Readalot’s profit, therefore, is the revenue from selling the book minus the $2 million it has paid to the author. Given these assumptions, how would you, as Readalot’s president, decide the book’s price?
Your first step is to estimate the demand for the book. Readalot’s marketing department tells you that the book will attract two types of readers. The book will appeal to the author’s 100,000 die-hard fans who are willing to pay as much as $30. In addition, the book will appeal to about 400,000 less enthusiastic readers who will pay up to $5.
If Readalot charges a single price to all customers, what price maximizes profit? There are two natural prices to consider: $30 is the highest price Readalot can charge and still get the 100,000 die-hard fans, and $5 is the highest price it can charge and still get the entire market of 500,000 potential readers. Solving Readalot’s problem is a matter of simple arithmetic. At a price of $30, Readalot sells 100,000 copies, has revenue of $3 million, and makes profit of $1 million. At a price of $5, it sells 500,000 copies, has revenue of $2.5 million, and makes profit of $500,000. Thus, Readalot maximizes profit by charging $30 and forgoing the opportunity to sell to the 400,000 less enthusiastic readers.
Notice that Readalot’s decision causes a deadweight loss. There are 400,000 readers willing to pay $5 for the book, and the marginal cost of providing it to them is zero. Thus, $2 million of total surplus is lost when Readalot charges the higher price. This deadweight loss is the inefficiency that arises whenever a monopolist charges a price above marginal cost.
Now suppose that Readalot’s marketing department makes a discovery: These two groups of readers are in separate markets. The die-hard fans live in Australia, and the other readers live in the United States. Moreover, it is hard for readers in one country to buy books in the other.
In response to this discovery, Readalot can change its marketing strategy and increase profits. To the 100,000 Australian readers, it can charge $30 for the book. To the 400,000 American readers, it can charge $5 for the book. In this case, rev-enue is $3 million in Australia and $2 million in the United States, for a total
price discriminationthe business practice of selling the same good at different prices to different customers
65875_ch15_ptg01_299-328.indd 314 16/10/13 12:08 PM
Copyright 2013 Cengage Learning. All Rights Reserved. May not be copied, scanned, or duplicated, in whole or in part. Due to electronic rights, some third party content may be suppressed from the eBook and/or eChapter(s).Editorial review has deemed that any suppressed content does not materially affect the overall learning experience. Cengage Learning reserves the right to remove additional content at any time if subsequent rights restrictions require it.

CHaPtEr 15 monopoLy 315
of $5 million. Profit is then $3 million, which is substantially greater than the $1 million the company could earn charging the same $30 price to all customers. Not surprisingly, Readalot chooses to follow this strategy of price discrimination.
The story of Readalot Publishing is hypothetical, but it describes accurately the business practice of many publishing companies. Textbooks, for example, are often sold at a lower price in Europe than in the United States. Even more impor-tant is the price differential between hardcover books and paperbacks. When a publisher has a new novel, it initially releases an expensive hardcover edition and later releases a cheaper paperback edition. The difference in price between these two editions far exceeds the difference in printing costs. The publisher’s goal is just as in our example. By selling the hardcover to die-hard fans and the paperback to less enthusiastic readers, the publisher price discriminates and raises its profit.
15-4b The Moral of the StoryLike any parable, the story of Readalot Publishing is stylized. Yet also like any parable, it teaches some general lessons. In this case, three lessons can be learned about price discrimination.
The first and most obvious lesson is that price discrimination is a rational strategy for a profit-maximizing monopolist. That is, by charging different prices to different customers, a monopolist can increase its profit. In essence, a price- discriminating monopolist charges each customer a price closer to her willingness to pay than is possible with a single price.
The second lesson is that price discrimination requires the ability to separate customers according to their willingness to pay. In our example, customers were separated geographically. But sometimes monopolists choose other differences, such as age or income, to distinguish among customers.
A corollary to this second lesson is that certain market forces can prevent firms from price discriminating. In particular, one such force is arbitrage, the process of buying a good in one market at a low price and selling it in another market at a higher price to profit from the price difference. In our example, if Australian bookstores could buy the book in the United States and resell it to Australian readers, the arbitrage would prevent Readalot from price discriminating, because no Australian would buy the book at the higher price.
The third lesson from our parable is the most surprising: Price discrimination can raise economic welfare. Recall that a deadweight loss arises when Readalot charges a single $30 price because the 400,000 less enthusiastic readers do not end up with the book, even though they value it at more than its marginal cost of production. By contrast, when Readalot price discriminates, all readers get the book, and the outcome is efficient. Thus, price discrimination can eliminate the inefficiency inherent in monopoly pricing.
Note that in this example the increase in welfare from price discrimination shows up as higher producer surplus rather than higher consumer surplus. Consumers are no better off for having bought the book: The price they pay exactly equals the value they place on the book, so they receive no consumer surplus. The entire increase in total surplus from price discrimination accrues to Readalot Publishing in the form of higher profit.
15-4c The Analytics of Price DiscriminationLet’s consider a bit more formally how price discrimination affects economic wel-fare. We begin by assuming that the monopolist can price discriminate perfectly. Perfect price discrimination describes a situation in which the monopolist knows
65875_ch15_ptg01_299-328.indd 315 16/10/13 12:08 PM
Copyright 2013 Cengage Learning. All Rights Reserved. May not be copied, scanned, or duplicated, in whole or in part. Due to electronic rights, some third party content may be suppressed from the eBook and/or eChapter(s).Editorial review has deemed that any suppressed content does not materially affect the overall learning experience. Cengage Learning reserves the right to remove additional content at any time if subsequent rights restrictions require it.

316 Part V Firm Behavior and the organization oF industry
exactly each customer’s willingness to pay and can charge each customer a differ-ent price. In this case, the monopolist charges each customer exactly her willing-ness to pay, and the monopolist gets the entire surplus in every transaction.
Figure 9 illustrates producer and consumer surplus with and without price dis-crimination. To keep things simple, this figure is drawn assuming constant per unit costs—that is, marginal cost and average total cost are constant and equal. Without price discrimination, the firm charges a single price above marginal cost, as shown in panel (a). Because some potential customers who value the good at more than marginal cost do not buy it at this high price, the monopoly causes a deadweight loss. Yet when a firm can perfectly price discriminate, as shown in panel (b), each customer who values the good at more than marginal cost buys the good and is charged her willingness to pay. All mutually beneficial trades take place, no deadweight loss occurs, and the entire surplus derived from the market goes to the monopoly producer in the form of profit.
In reality, of course, price discrimination is not perfect. Customers do not walk into stores with signs displaying their willingness to pay. Instead, firms price discriminate by dividing customers into groups: young versus old, week-day versus weekend shoppers, Americans versus Australians, and so on. Unlike those in our parable of Readalot Publishing, customers within each group differ in their willingness to pay for the product, making perfect price discrimination impossible.
How does this imperfect price discrimination affect welfare? The analysis of these pricing schemes is complicated, and it turns out that there is no general
FIGURE9 Panel (a) shows a monopoly that charges the same price to all customers. Total surplus in this market equals the sum of profit (producer surplus) and consumer surplus. Panel (b) shows a monopoly that can perfectly price discriminate. Because consumer surplus equals zero, total surplus now equals the firm’s profit. Comparing these two panels, you can see that perfect price discrimination raises profit, raises total surplus, and lowers consumer surplus.
WelfarewithandwithoutPriceDiscrimination
(a) Monopolist with Single Price
Price
0 QuantityQuantity sold Quantity sold
(b) Monopolist with Perfect Price Discrimination
Price
0 Quantity
Monopolyprice
Pro�tPro�t
Deadweightloss
Demand Demand
Marginal cost
Marginalrevenue
Consumersurplus
Marginal cost
65875_ch15_ptg01_299-328.indd 316 16/10/13 8:20 PM
Copyright 2013 Cengage Learning. All Rights Reserved. May not be copied, scanned, or duplicated, in whole or in part. Due to electronic rights, some third party content may be suppressed from the eBook and/or eChapter(s).Editorial review has deemed that any suppressed content does not materially affect the overall learning experience. Cengage Learning reserves the right to remove additional content at any time if subsequent rights restrictions require it.

CHaPtEr 15 monopoLy 317
answer to this question. Compared to the monopoly outcome with a single price, imperfect price discrimination can raise, lower, or leave unchanged total surplus in a market. The only certain conclusion is that price discrimination raises the monopoly’s profit; otherwise, the firm would choose to charge all customers the same price.
15-4d Examples of Price DiscriminationFirms in our economy use various business strategies aimed at charging differ-ent prices to different customers. Now that we understand the economics of price discrimination, let’s consider some examples.
Movie tickets Many movie theaters charge a lower price for children and sen-ior citizens than for other patrons. This fact is hard to explain in a competitive market. In a competitive market, price equals marginal cost, and the marginal cost of providing a seat for a child or senior citizen is the same as the marginal cost of providing a seat for anyone else. Yet the differential pricing is easily explained if movie theaters have some local monopoly power and if children and senior citizens have a lower willingness to pay for a ticket. In this case, movie theaters raise their profit by price discriminating.
airline Prices Seats on airplanes are sold at many different prices. Most airlines charge a lower price for a round-trip ticket between two cities if the traveler stays over a Saturday night. At first, this seems odd. Why should it matter to the air-line whether a passenger stays over a Saturday night? The reason is that this rule provides a way to separate business travelers and leisure travelers. A passenger on a business trip has a high willingness to pay and, most likely, does not want to stay over a Saturday night. By contrast, a passenger traveling for personal reasons has a lower willingness to pay and is more likely to be willing to stay over a Saturday night. Thus, the airlines can successfully price discriminate by charging a lower price for passengers who stay over a Saturday night.
Discount Coupons Many companies offer discount coupons to the public in newspapers, magazines, or online. A buyer simply has to clip the coupon to get $0.50 off her next purchase. Why do companies offer these coupons? Why don’t they just cut the price of the product by $0.50?
The answer is that coupons allow companies to price discriminate. Companies know that not all customers are willing to spend time clipping coupons. Moreover, the willingness to clip coupons is related to the customer’s willingness to pay for the good. A rich and busy executive is unlikely to spend her time clipping dis-count coupons out of the newspaper, and she is probably willing to pay a higher price for many goods. A person who is unemployed is more likely to clip coupons and to have a lower willingness to pay. Thus, by charging a lower price only to those customers who clip coupons, firms can successfully price discriminate.
Financial aid Many colleges and universities give financial aid to needy students. One can view this policy as a type of price discrimination. Wealthy students have greater financial resources and, therefore, a higher willingness to pay than needy students. By charging high tuition and selectively offering financial aid, schools in effect charge prices to customers based on the value they place on going to that school. This behavior is similar to that of any price-discriminating monopolist.
“Would it bother you to hear how little I paid for this flight?”
HA
MIL
TON
© U
NIV
ER
SA
L P
RE
SS
SYN
DIC
ATE
.
65875_ch15_ptg01_299-328.indd 317 16/10/13 12:08 PM
Copyright 2013 Cengage Learning. All Rights Reserved. May not be copied, scanned, or duplicated, in whole or in part. Due to electronic rights, some third party content may be suppressed from the eBook and/or eChapter(s).Editorial review has deemed that any suppressed content does not materially affect the overall learning experience. Cengage Learning reserves the right to remove additional content at any time if subsequent rights restrictions require it.

318 Part V Firm Behavior and the organization oF industry
Quantity Discounts So far in our examples of price discrimination, the monopolist charges different prices to different customers. Sometimes, however, monopolists price discriminate by charging different prices to the same customer for different units that the customer buys. For example, many firms offer lower prices to customers who buy large quantities. A bakery might charge $0.50 for each donut but $5 for a dozen. This is a form of price discrimination because the customer pays a higher price for the first unit bought than for the twelfth. Quantity discounts are often a successful way of price discriminating because a customer’s willingness to pay for an additional unit declines as the customer buys more units.
Misconceptions 101: Why College Costs aren’t Soaring
By Evan Soltas
Conventional wisdom suggests that u.s. colleges and universities have become
sharply more expensive in recent years.“When kids do graduate, the most daunt-
ing challenge can be the cost of college,” president Barack obama said in his 2012 state of the union address. “We can’t just keep subsidizing skyrocketing tuition; we’ll run out of money.”
at first, the view that the cost of college is rising appears to have data on its side. published tuition prices and fees at colleges have risen three times faster than the rate of Consumer price index inflation since 1978, according to the Bureau of Labor statistics. . . .
real tuition and fees have increased, to be sure, but hardly as significantly as the media often report or the data suggest at face value. the inflation-adjusted net price
of college has risen only modestly over the last two decades, according to data from the College Board’s annual survey of Colleges.
What has happened is a shift toward price discrimination—offering multiple prices for the same product. universities have offset the increase in sticker price for most families through an expansion of grant-based finan-cial aid and scholarships. that has caused the BLs measure to rise without increasing the net cost.
Wealthier families now pay more than ever to send their children to college. But for much of the middle class, the real net cost of college has not changed significantly; for much of the poor, the expansion of aid has increased the accessibility and affordability of a college education. . . .
the nation’s most selective institutions are leading the trend toward income-based price discrimination. For example, at harvard university, the majority of students receive financial aid: in 2012, one year of undergrad-uate education had a sticker price of $54,496 and came with an average grant of roughly $41,000.
in other words, the cost burden of college has become significantly more progressive since the 1990s. students from wealthier families not only now pay more for their own educations but also have come to heavily subsidize the costs of the less fortunate.
Source: Bloomberg.com, november 27, 2012.
Price Discrimination in Higher Education
Colleges and universities are increasingly charging different prices to different students, which makes data on the cost of education harder to interpret.
IN THE NEWS
© m
onas
hee
Fran
tz/a
lam
y
Quick Quiz Give two examples of price discrimination. • How does perfect price dis-crimination affect consumer surplus, producer surplus, and total surplus?
65875_ch15_ptg01_299-328.indd 318 16/10/13 12:08 PM
Copyright 2013 Cengage Learning. All Rights Reserved. May not be copied, scanned, or duplicated, in whole or in part. Due to electronic rights, some third party content may be suppressed from the eBook and/or eChapter(s).Editorial review has deemed that any suppressed content does not materially affect the overall learning experience. Cengage Learning reserves the right to remove additional content at any time if subsequent rights restrictions require it.

CHaPtEr 15 monopoLy 319
15-5 public policy toward monopoliesWe have seen that monopolies, in contrast to competitive markets, fail to allocate resources efficiently. Monopolies produce less than the socially desirable quantity of output and charge prices above marginal cost. Policymakers in the government can respond to the problem of monopoly in one of four ways:
• By trying to make monopolized industries more competitive.• By regulating the behavior of the monopolies.• By turning some private monopolies into public enterprises.• By doing nothing at all.
15-5a Increasing Competition with Antitrust LawsIf Coca-Cola and PepsiCo wanted to merge, the deal would be closely examined by the federal government before it went into effect. The lawyers and economists in the Department of Justice might well decide that a merger between these two large soft-drink companies would make the U.S. soft-drink market substantially less competitive and, as a result, would reduce the economic well-being of the country as a whole. If so, the Department of Justice would challenge the merger in court, and if the judge agreed, the two companies would not be allowed to merge. It is precisely this kind of challenge that prevented software giant Microsoft from buying Intuit in 1994.
The government derives this power over private industry from the antitrust laws, a collection of statutes aimed at curbing monopoly power. The first and most important of these laws was the Sherman Antitrust Act, which Congress passed in 1890 to reduce the market power of the large and powerful “trusts” that were viewed as dominating the economy at the time. The Clayton Antitrust Act, passed in 1914, strengthened the government’s powers and authorized private lawsuits. As the U.S. Supreme Court once put it, the antitrust laws are “a comprehensive charter of economic liberty aimed at preserving free and unfettered competition as the rule of trade.”
The antitrust laws give the government various ways to promote competition. They allow the government to prevent mergers, such as our hypothetical merger between Coca-Cola and PepsiCo. They also allow the government to break up companies. For example, in 1984, the government split up AT&T, the large tele-communications company, into eight smaller companies. Finally, the antitrust laws prevent companies from coordinating their activities in ways that make mar-kets less competitive.
Antitrust laws have costs as well as benefits. Sometimes companies merge not to reduce competition but to lower costs through more efficient joint production. These benefits from mergers are sometimes called synergies. For example, many U.S. banks have merged in recent years and, by combining operations, have been able to reduce administrative staff. If antitrust laws are to raise social welfare, the government must be able to determine which mergers are desirable and which are not. That is, it must be able to measure and compare the social benefit from synergies with the social costs of reduced competition. Critics of the antitrust laws are skeptical that the gov-ernment can perform the necessary cost–benefit analysis with sufficient accuracy.
15-5b RegulationAnother way the government deals with the problem of monopoly is by regulat-ing the behavior of monopolists. This solution is common in the case of natural
“But if we do merge with Amalgamated, we’ll have enough resources to fight the antitrust violation caused by the merger.”
Sci
ence
Car
toon
sPlu
s.co
m
65875_ch15_ptg01_299-328.indd 319 16/10/13 12:08 PM
Copyright 2013 Cengage Learning. All Rights Reserved. May not be copied, scanned, or duplicated, in whole or in part. Due to electronic rights, some third party content may be suppressed from the eBook and/or eChapter(s).Editorial review has deemed that any suppressed content does not materially affect the overall learning experience. Cengage Learning reserves the right to remove additional content at any time if subsequent rights restrictions require it.

320 Part V Firm Behavior and the organization oF industry
monopolies, such as water and electric companies. These companies are not al-lowed to charge any price they want. Instead, government agencies regulate their prices.
What price should the government set for a natural monopoly? This question is not as easy as it might at first appear. One might conclude that the price should equal the monopolist’s marginal cost. If price equals marginal cost, customers will buy the quantity of the monopolist’s output that maximizes total surplus and the allocation of resources will be efficient.
There are, however, two practical problems with marginal-cost pricing as a reg-ulatory system. The first arises from the logic of cost curves. By definition, natural monopolies have declining average total cost. As we first discussed in Chapter 13, when average total cost is declining, marginal cost is less than average total cost. This situation is illustrated in Figure 10, which shows a firm with a large fixed cost and then constant marginal cost thereafter. If regulators were to set price equal to marginal cost, that price would be less than the firm’s average total cost and the firm would lose money. Instead of charging such a low price, the monopoly firm would just exit the industry.
Regulators can respond to this problem in various ways, none of which is perfect. One way is to subsidize the monopolist. In essence, the government picks up the losses inherent in marginal-cost pricing. Yet to pay for the subsidy, the gov-ernment needs to raise money through taxation, which involves its own dead-weight losses. Alternatively, the regulators can allow the monopolist to charge a price higher than marginal cost. If the regulated price equals average total cost, the monopolist earns exactly zero economic profit. Yet average-cost pricing leads to deadweight losses because the monopolist’s price no longer reflects the marginal cost of producing the good. In essence, average-cost pricing is like a tax on the good the monopolist is selling.
FIGURE10Marginal-CostPricingforaNaturalMonopolyBecause a natural monopoly has declining average total cost, marginal cost is less than average total cost. Therefore, if regulators require a natural monopoly to charge a price equal to marginal cost, price will be below average total cost, and the monopoly will lose money.
Average totalcost
Regulatedprice
Quantity0
Loss
Price
Demand
Marginal cost
Average total cost
65875_ch15_ptg01_299-328.indd 320 16/10/13 12:08 PM
Copyright 2013 Cengage Learning. All Rights Reserved. May not be copied, scanned, or duplicated, in whole or in part. Due to electronic rights, some third party content may be suppressed from the eBook and/or eChapter(s).Editorial review has deemed that any suppressed content does not materially affect the overall learning experience. Cengage Learning reserves the right to remove additional content at any time if subsequent rights restrictions require it.

CHaPtEr 15 monopoLy 321
The second problem with marginal-cost pricing as a regulatory system (and with average-cost pricing as well) is that it gives the monopolist no incentive to reduce costs. Each firm in a competitive market tries to reduce its costs because lower costs mean higher profits. But if a regulated monopolist knows that regulators will reduce prices whenever costs fall, the monopolist will not benefit from lower costs. In practice, regulators deal with this problem by allowing monopolists to keep some of the benefits from lower costs in the form of higher profit, a practice that requires some departure from marginal-cost pricing.
15-5c Public OwnershipThe third policy used by the government to deal with monopoly is public own-ership. That is, rather than regulating a natural monopoly that is run by a pri-vate firm, the government can run the monopoly itself. This solution is common in many European countries, where the government owns and operates utilities such as telephone, water, and electric companies. In the United States, the gov-ernment runs the Postal Service. The delivery of ordinary first-class mail is often thought to be a natural monopoly.
Economists usually prefer private to public ownership of natural monopolies. The key issue is how the ownership of the firm affects the costs of production. Private owners have an incentive to minimize costs as long as they reap part of the benefit in the form of higher profit. If the firm’s managers are doing a bad job of keeping costs down, the firm’s owners will fire them. By contrast, if the govern-ment bureaucrats who run a monopoly do a bad job, the losers are the customers and taxpayers, whose only recourse is the political system. The bureaucrats may become a special-interest group and attempt to block cost-reducing reforms. Put simply, as a way of ensuring that firms are well run, the voting booth is less reli-able than the profit motive.
15-5d Doing NothingEach of the foregoing policies aimed at reducing the problem of monopoly has drawbacks. As a result, some economists argue that it is often best for the gov-ernment not to try to remedy the inefficiencies of monopoly pricing. Here is the assessment of economist George Stigler, who won the Nobel Prize for his work in industrial organization:
A famous theorem in economics states that a competitive enterprise economy will produce the largest possible income from a given stock of resources. No real economy meets the exact conditions of the theorem, and all real economies will fall short of the ideal economy—a difference called “market failure.” In my view, however, the degree of “market failure” for the American economy is much smaller than the “political failure” arising from the imperfections of economic policies found in real political systems.
As this quotation makes clear, determining the proper role of the government in the economy requires judgments about politics as well as economics.
Quick Quiz Describe the ways policymakers can respond to the inefficiencies caused by monopolies. List a potential problem with each of these policy responses.
65875_ch15_ptg01_299-328.indd 321 16/10/13 12:08 PM
Copyright 2013 Cengage Learning. All Rights Reserved. May not be copied, scanned, or duplicated, in whole or in part. Due to electronic rights, some third party content may be suppressed from the eBook and/or eChapter(s).Editorial review has deemed that any suppressed content does not materially affect the overall learning experience. Cengage Learning reserves the right to remove additional content at any time if subsequent rights restrictions require it.

322 Part V Firm Behavior and the organization oF industry
15-6 Conclusion: the prevalence of monopoliesThis chapter has discussed the behavior of firms that have control over the prices they charge. We have seen that these firms behave very differently from the com-petitive firms studied in the previous chapter. Table 2 summarizes some of the key similarities and differences between competitive and monopoly markets.
From the standpoint of public policy, a crucial result is that a monopolist pro-duces less than the socially efficient quantity and charges a price above marginal cost. As a result, a monopoly causes deadweight losses. In some cases, these inef-ficiencies can be mitigated through price discrimination by the monopolist, but other times, they call for policymakers to take an active role.
How prevalent are the problems of monopoly? There are two answers to this question.
In one sense, monopolies are common. Most firms have some control over the prices they charge. They are not forced to charge the market price for their goods because their goods are not exactly the same as those offered by other firms. A Ford Taurus is not the same as a Toyota Camry. Ben and Jerry’s ice cream is not the same as Breyer’s. Each of these goods has a downward-sloping demand curve, which gives each producer some degree of monopoly power.
Yet firms with substantial monopoly power are rare. Few goods are truly unique. Most have substitutes that, even if not exactly the same, are similar. Ben and Jerry can raise the price of their ice cream a little without losing all their sales, but if they raise it a lot, sales will fall substantially as their customers switch to other brands.
In the end, monopoly power is a matter of degree. It is true that many firms have some monopoly power. It is also true that their monopoly power is usually limited. In such a situation, we will not go far wrong assuming that firms operate in competitive markets, even if that is not precisely the case.
CompetitionversusMonopoly:ASummaryComparison
TAblE2Competition Monopoly
SimilaritiesGoal of firms Maximize profits Maximize profitsRule for maximizing MR = MC MR = MCCan earn economic profits in the short run? Yes Yes
DifferencesNumber of firms Many OneMarginal revenue MR = P MR < PPrice P = MC P > MCProduces welfare-maximizing level of output? Yes NoEntry in the long run? Yes NoCan earn economic profits in the long run? No YesPrice discrimination possible? No Yes
65875_ch15_ptg01_299-328.indd 322 16/10/13 12:08 PM
Copyright 2013 Cengage Learning. All Rights Reserved. May not be copied, scanned, or duplicated, in whole or in part. Due to electronic rights, some third party content may be suppressed from the eBook and/or eChapter(s).Editorial review has deemed that any suppressed content does not materially affect the overall learning experience. Cengage Learning reserves the right to remove additional content at any time if subsequent rights restrictions require it.
CHaPtEr 15 monopoLy 323
• A monopoly is a firm that is the sole seller in its mar-ket. A monopoly arises when a single firm owns a key resource, when the government gives a firm the exclusive right to produce a good, or when a single firm can supply the entire market at a lower cost than many firms could.
• Because a monopoly is the sole producer in its mar-ket, it faces a downward-sloping demand curve for its product. When a monopoly increases production by 1 unit, it causes the price of its good to fall, which reduces the amount of revenue earned on all units pro-duced. As a result, a monopoly’s marginal revenue is always below the price of its good.
• Like a competitive firm, a monopoly firm maximizes profit by producing the quantity at which marginal revenue equals marginal cost. The monopoly then sets the price at which that quantity is demanded. Unlike a competitive firm, a monopoly firm’s price exceeds its marginal revenue, so its price exceeds marginal cost.
• A monopolist’s profit-maximizing level of output is below the level that maximizes the sum of consumer and producer surplus. That is, when the monopoly charges a price above marginal cost, some consumers
who value the good more than its cost of production do not buy it. As a result, monopoly causes dead-weight losses similar to those caused by taxes.
• A monopolist can often increase profits by charging different prices for the same good based on a buyer’s willingness to pay. This practice of price discrimina-tion can raise economic welfare by getting the good to some consumers who otherwise would not buy it. In the extreme case of perfect price discrimina-tion, the deadweight loss of monopoly is completely eliminated and the entire surplus in the market goes to the monopoly producer. More generally, when price discrimination is imperfect, it can either raise or lower welfare compared to the outcome with a single monopoly price.
• Policymakers can respond to the inefficiency of monopoly behavior in four ways. They can use the antitrust laws to try to make the industry more compet-itive. They can regulate the prices that the monopoly charges. They can turn the monopolist into a govern-ment-run enterprise. Or, if the market failure is deemed small compared to the inevitable imperfections of poli-cies, they can do nothing at all.
Summary
monopoly, p. 300 natural monopoly, p. 302 price discrimination, p. 314
Key Concepts
1. Give an example of a government-created monopoly. Is creating this monopoly necessarily bad public policy? Explain.
2. Define natural monopoly. What does the size of a mar-ket have to do with whether an industry is a natural monopoly?
3. Why is a monopolist’s marginal revenue less than the price of its good? Can marginal revenue ever be nega-tive? Explain.
4. Draw the demand, marginal-revenue, average-total-cost, and marginal-cost curves for a monopolist. Show the profit-maximizing level of output, the profit- maximizing price, and the amount of profit.
5. In your diagram from the previous question, show the level of output that maximizes total surplus.
Show the deadweight loss from the monopoly. Explain your answer.
6. Give two examples of price discrimination. In each case, explain why the monopolist chooses to follow this business strategy.
7. What gives the government the power to regulate mergers between firms? Give a good reason and a bad reason (from the perspective of society’s welfare) that two firms might want to merge.
8. Describe the two problems that arise when regulators tell a natural monopoly that it must set a price equal to marginal cost.
Questions for Review
65875_ch15_ptg01_299-328.indd 323 16/10/13 12:08 PM
Copyright 2013 Cengage Learning. All Rights Reserved. May not be copied, scanned, or duplicated, in whole or in part. Due to electronic rights, some third party content may be suppressed from the eBook and/or eChapter(s).Editorial review has deemed that any suppressed content does not materially affect the overall learning experience. Cengage Learning reserves the right to remove additional content at any time if subsequent rights restrictions require it.

324 Part V Firm Behavior and the organization oF industry
1. A publisher faces the following demand schedule for the next novel from one of its popular authors:
Price Quantity Demanded
$100 0 novels90 100,00080 200,00070 300,00060 400,00050 500,00040 600,00030 700,00020 800,00010 900,0000 1,000,000
The author is paid $2 million to write the book, and the marginal cost of publishing the book is a constant $10 per book.a. Compute total revenue, total cost, and profit at
each quantity. What quantity would a profit-maximizing publisher choose? What price would it charge?
b. Compute marginal revenue. (Recall that MR = ΔTR/ΔQ.) How does marginal revenue compare to the price? Explain.
c. Graph the marginal-revenue, marginal-cost, and demand curves. At what quantity do the marginal-revenue and marginal-cost curves cross? What does this signify?
d. In your graph, shade in the deadweight loss. Explain in words what this means.
e. If the author were paid $3 million instead of $2 million to write the book, how would this affect the publisher’s decision regarding what price to charge? Explain.
f. Suppose the publisher was not profit-maximizing but was concerned with maximizing economic efficiency. What price would it charge for the book? How much profit would it make at this price?
2. A small town is served by many competing supermar-kets, which have the same constant marginal cost.a. Using a diagram of the market for groceries, show
the consumer surplus, producer surplus, and total surplus.
Problems and Applications
1. A firm is a natural monopoly if it exhibits the following as its output increases:a. decreasing marginal revenueb. increasing marginal costc. decreasing average revenued. decreasing average total cost
2. For a profit-maximizing monopoly that charges the same price to all consumers, what is the relationship between price P, marginal revenue MR, and marginal cost MC?a. P = MR and MR = MC.b. P > MR and MR = MC.c. P = MR and MR > MC.d. P > MR and MR > MC.
3. If a monopoly’s fixed costs increase, its price will _________ and its profit will _________.a. increase, decreaseb. decrease, increasec. increase, stay the samed. stay the same, decrease
4. Compared to the social optimum, a monopoly firm choosesa. a quantity that is too low and a price that is too
high.
b. a quantity that is too high and a price that is too low.
c. a quantity and a price that are both too high.d. a quantity and a price that are both too low.
5. The deadweight loss from monopoly arises becausea. the monopoly firm makes higher profits than a
competitive firm would.b. some potential consumers who forgo buying the
good value it more than its marginal cost.c. consumers who buy the good have to pay more
than marginal cost, reducing their consumer surplus.
d. the monopoly firm chooses a quantity that fails to equate price and average revenue.
6. When a monopolist switches from charging a single price to perfect price discrimination, it reducesa. the quantity produced.b. the firm’s profit.c. consumer surplus.d. total surplus.
Quick Check Multiple Choice
65875_ch15_ptg01_299-328.indd 324 16/10/13 12:08 PM
Copyright 2013 Cengage Learning. All Rights Reserved. May not be copied, scanned, or duplicated, in whole or in part. Due to electronic rights, some third party content may be suppressed from the eBook and/or eChapter(s).Editorial review has deemed that any suppressed content does not materially affect the overall learning experience. Cengage Learning reserves the right to remove additional content at any time if subsequent rights restrictions require it.

CHaPtEr 15 monopoLy 325
b. Now suppose that the independent supermarkets combine into one chain. Using a new diagram, show the new consumer surplus, producer surplus, and total surplus. Relative to the competitive market, what is the transfer from consumers to producers? What is the deadweight loss?
3. Johnny Rockabilly has just finished recording his latest CD. His record company’s marketing department determines that the demand for the CD is as follows:
Price Number of CDs
$24 10,00022 20,00020 30,00018 40,00016 50,00014 60,000
The company can produce the CD with no fixed cost and a variable cost of $5 per CD.a. Find total revenue for quantity equal to 10,000,
20,000, and so on. What is the marginal revenue for each 10,000 increase in the quantity sold?
b. What quantity of CDs would maximize profit? What would the price be? What would the profit be?
c. If you were Johnny’s agent, what recording fee would you advise Johnny to demand from the record company? Why?
4. A company is considering building a bridge across a river. The bridge would cost $2 million to build and nothing to maintain. The following table shows the company’s anticipated demand over the lifetime of the bridge:
Price per CrossingNumber of Crossings,
in Thousands
$8 07 1006 2005 3004 4003 5002 6001 7000 800
a. If the company were to build the bridge, what would be its profit-maximizing price? Would that be the efficient level of output? Why or why not?
b. If the company is interested in maximizing profit, should it build the bridge? What would be its profit or loss?
c. If the government were to build the bridge, what price should it charge?
d. Should the government build the bridge? Explain.
5. Larry, Curly, and Moe run the only saloon in town. Larry wants to sell as many drinks as possible without losing money. Curly wants the saloon to bring in as much revenue as possible. Moe wants to make the largest possible profits. Using a single diagram of the saloon’s demand curve and its cost curves, show the price and quantity combinations favored by each of the three partners. Explain.
6. The residents of the town Ectenia all love econom-ics, and the mayor proposes building an economics museum. The museum has a fixed cost of $2,400,000 and no variable costs. There are 100,000 town residents, and each has the same demand for museum visits: QD = 10 − P, where P is the price of admission.a. Graph the museum’s average-total-cost curve
and its marginal-cost curve. What kind of market would describe the museum?
b. The mayor proposes financing the museum with a lump-sum tax of $24 and then opening the museum to the public for free. How many times would each person visit? Calculate the benefit each person would get from the museum, measured as consumer surplus minus the new tax.
c. The mayor’s antitax opponent says the museum should finance itself by charging an admission fee. What is the lowest price the museum can charge without incurring losses? (Hint: Find the number of visits and museum profits for prices of $2, $3, $4, and $5.)
d. For the break-even price you found in part (c), cal-culate each resident’s consumer surplus. Compared with the mayor’s plan, who is better off with this admission fee, and who is worse off? Explain.
e. What real-world considerations absent in the problem above might provide reasons to favor an admission fee?
7. Consider the relationship between monopoly pricing and price elasticity of demand.a. Explain why a monopolist will never produce a
quantity at which the demand curve is inelastic. (Hint: If demand is inelastic and the firm raises its price, what happens to total revenue and total costs?)
b. Draw a diagram for a monopolist, precisely labeling the portion of the demand curve that is inelastic. (Hint: The answer is related to the marginal-revenue curve.)
c. On your diagram, show the quantity and price that maximize total revenue.
8. You live in a town with 300 adults and 200 children, and you are thinking about putting on a play to
65875_ch15_ptg01_299-328.indd 325 16/10/13 12:08 PM
Copyright 2013 Cengage Learning. All Rights Reserved. May not be copied, scanned, or duplicated, in whole or in part. Due to electronic rights, some third party content may be suppressed from the eBook and/or eChapter(s).Editorial review has deemed that any suppressed content does not materially affect the overall learning experience. Cengage Learning reserves the right to remove additional content at any time if subsequent rights restrictions require it.

326 Part V Firm Behavior and the organization oF industry
entertain your neighbors and make some money. A play has a fixed cost of $2,000, but selling an extra ticket has zero marginal cost. Here are the demand schedules for your two types of customers:
Price Adults Children
$10 0 09 100 08 200 07 300 06 300 05 300 1004 300 2003 300 2002 300 2001 300 2000 300 200
a. To maximize profit, what price would you charge for an adult ticket? For a child’s ticket? How much profit do you make?
b. The city council passes a law prohibiting you from charging different prices to different customers. What price do you set for a ticket now? How much profit do you make?
c. Who is worse off because of the law prohibiting price discrimination? Who is better off? (If you can, quantify the changes in welfare.)
d. If the fixed cost of the play were $2,500 rather than $2,000, how would your answers to parts (a), (b), and (c) change?
9. Only one firm produces and sells soccer balls in the country of Wiknam, and as the story begins, international trade in soccer balls is prohibited. The following equations describe the monopolist’s demand, marginal revenue, total cost, and marginal cost:
Demand: P = 10 − QMarginal Revenue: MR = 10 − 2Q
Total Cost: TC = 3 + Q + 0.5Q2
Marginal Cost: MC = 1 + Q
where Q is quantity and P is the price measured in Wiknamian dollars.a. How many soccer balls does the monopolist
produce? At what price are they sold? What is the monopolist’s profit?
b. One day, the King of Wiknam decrees that hence-forth there will be free trade—either imports or exports— of soccer balls at the world price of $6. The firm is now a price taker in a competitive market. What happens to domestic production of soccer balls? To domestic consumption? Does Wiknam export or import soccer balls?
c. In our analysis of international trade in Chapter 9, a country becomes an exporter when the price with-out trade is below the world price and an importer when the price without trade is above the world price. Does that conclusion hold in your answers to parts (a) and (b)? Explain.
d. Suppose that the world price was not $6 but, instead, happened to be exactly the same as the domestic price without trade as determined in part (a). Would allowing trade have changed anything in the Wiknamian economy? Explain. How does the result here compare with the analysis in Chapter 9?
10. Based on market research, a film production company in Ectenia obtains the following information about the demand and production costs of its new DVD:
Demand: P = 1,000 − 10Q
Total Revenue: TR = 1,000Q − 10Q2
Marginal Revenue: MR = 1,000 − 20Q
Marginal Cost: MC = 100 + 10Q
where Q indicates the number of copies sold and P is the price in Ectenian dollars.a. Find the price and quantity that maximize the
company’s profit.b. Find the price and quantity that would maximize
social welfare.c. Calculate the deadweight loss from monopoly.d. Suppose, in addition to the costs above, the director
of the film has to be paid. The company is consider-ing four options:
i. a flat fee of 2,000 Ectenian dollars. ii. 50 percent of the profits. iii. 150 Ectenian dollars per unit sold. iv. 50 percent of the revenue.
For each option, calculate the profit-maximizing price and quantity. Which, if any, of these compensation schemes would alter the deadweight loss from monopoly? Explain.
11. Many schemes for price discriminating involve some cost. For example, discount coupons take up the time and resources of both the buyer and the seller. This question considers the implications of costly price discrimination. To keep things simple, let’s assume that our monopolist’s production costs are simply proportional to output so that average total cost and marginal cost are constant and equal to each other.a. Draw the cost, demand, and marginal-revenue
curves for the monopolist. Show the price the monopolist would charge without price discrimination.
b. In your diagram, mark the area equal to the monopolist’s profit and call it X. Mark the area equal to consumer surplus and call it Y. Mark the area equal to the deadweight loss and call it Z.
65875_ch15_ptg01_299-328.indd 326 16/10/13 12:08 PM
Copyright 2013 Cengage Learning. All Rights Reserved. May not be copied, scanned, or duplicated, in whole or in part. Due to electronic rights, some third party content may be suppressed from the eBook and/or eChapter(s).Editorial review has deemed that any suppressed content does not materially affect the overall learning experience. Cengage Learning reserves the right to remove additional content at any time if subsequent rights restrictions require it.

CHaPtEr 15 monopoLy 327
c. Now suppose that the monopolist can perfectly price discriminate. What is the monopolist’s profit? (Give your answer in terms of X, Y, and Z.)
d. What is the change in the monopolist’s profit from price discrimination? What is the change in total surplus from price discrimination? Which change is larger? Explain. (Give your answer in terms of X, Y, and Z.)
e. Now suppose that there is some cost of price discrimination. To model this cost, let’s assume that the monopolist has to pay a fixed cost C to price discriminate. How would a monopolist make the decision whether to pay this fixed cost? (Give your answer in terms of X, Y, Z, and C.)
f. How would a benevolent social planner, who cares about total surplus, decide whether the monopolist should price discriminate? (Give your answer in terms of X, Y, Z, and C.)
g. Compare your answers to parts (e) and (f). How does the monopolist’s incentive to price discrimi-nate differ from the social planner’s? Is it possible that the monopolist will price discriminate even though doing so is not socially desirable?
Go to CengageBrain.com to purchase access to the proven, critical Study Guide to accompany this text, which features additional notes and context, practice tests, and much more.
65875_ch15_ptg01_299-328.indd 327 16/10/13 12:08 PM
Copyright 2013 Cengage Learning. All Rights Reserved. May not be copied, scanned, or duplicated, in whole or in part. Due to electronic rights, some third party content may be suppressed from the eBook and/or eChapter(s).Editorial review has deemed that any suppressed content does not materially affect the overall learning experience. Cengage Learning reserves the right to remove additional content at any time if subsequent rights restrictions require it.