15-024 Garber WEB
19
May–June 2016 | PCI Journal 68 T o properly design prestressed concrete girders, designers must estimate the prestressing force that the strands apply on the concrete section, allowing the stress in the concrete to be estimated. The designer will typically accomplish this objective by specifying the initial force or stress to which the strand should be tensioned, which is known as f pi or the jacking stress f pj , and then estimating the amount of stress the strand will lose due to the time-dependent deformations (prestress loss ∆f p ). The total prestress loss is composed of loss due to shrinkage of the concrete ∆f pSR , loss due to concrete creep deformations ∆f pCR , and loss due to strand relaxation ∆f pR . For design, the prestress loss is used to e stimate the stress in the concrete at different sections (primarily to prevent cracking in the concrete) and to estimate deformations of the beam (to ensure constructibility and serviceability of the bridge). The accuracy, precision, and conservatism of prestress loss estimation must be carefully balanced to ensure a safe, serviceable, durable, and economically viable girder. When prestress loss is underestimated, the designer assumes a greater stress in the strands than is actually present. This underestimation can lead to service-load cracking and long-term durability concerns due to corrosion. Overesti- mation of prestress loss may lead to uneconomical designs and large cambers, which are both a result of an excessive number of strands being required. ■ Thirty full-scale bridge girde rs with a variety of design param- eters were instrumented, constructed, monitored, and tested; a comprehensive experimental database containing data from 140 full-scale bridge girders was assembled; and an extensive analytical program was conducted to investigate the sensitivity of current estimation methods and implications of loss estima- tion on fin al designs ■ Through the work of this proj ect, a prestress lo ss estimation procedure was developed that is simple to use and precise. ■ This procedure can be used for bo th time-dependent and final prestress loss estimation. Prestress loss calculations: Another perspective David B. Garber, José M. Gallardo, Dean J. Deschenes, and Oguzhan Bayrak Book MJ16.indb 68 4/20/16 10:30 AM
Transcript of 15-024 Garber WEB
7/25/2019 15-024 Garber WEB
http://slidepdf.com/reader/full/15-024-garber-web 1/18
May–June 2016 | PCI Journal68
T
o properly design prestressed concrete girders,
designers must estimate the prestressing force that
the strands apply on the concrete section, allowing
the stress in the concrete to be estimated. The designer willtypically accomplish this objective by specifying the initial
force or stress to which the strand should be tensioned,
which is known as f pi or the jacking stress f pj, and then
estimating the amount of stress the strand will lose due to
the time-dependent deformations (prestress loss ∆f p). The
total prestress loss is composed of loss due to shrinkage of
the concrete ∆f pSR, loss due to concrete creep deformations
∆f pCR, and loss due to strand relaxation ∆f pR. For design, the
prestress loss is used to estimate the stress in the concrete
at different sections (primarily to prevent cracking in the
concrete) and to estimate deformations of the beam (to
ensure constructibility and serviceability of the bridge).
The accuracy, precision, and conservatism of prestress loss
estimation must be carefully balanced to ensure a safe,
serviceable, durable, and economically viable girder. When
prestress loss is underestimated, the designer assumes a
greater stress in the strands than is actually present. This
underestimation can lead to service-load cracking and
long-term durability concerns due to corrosion. Overesti-
mation of prestress loss may lead to uneconomical designs
and large cambers, which are both a result of an excessive
number of strands being required.
■ Thirty full-scale bridge girders with a variety of design param-
eters were instrumented, constructed, monitored, and tested;
a comprehensive experimental database containing data from
140 full-scale bridge girders was assembled; and an extensive
analytical program was conducted to investigate the sensitivity
of current estimation methods and implications of loss estima-
tion on final designs
■ Through the work of this project, a prestress loss estimation
procedure was developed that is simple to use and precise.
■ This procedure can be used for both time-dependent and final
prestress loss estimation.
Prestress loss calculations:
Another perspective
David B. Garber, José M. Gallardo, Dean J. Deschenes,and Oguzhan Bayrak
Book_MJ16.indb 68 4/20/16 10:30 AM
7/25/2019 15-024 Garber WEB
http://slidepdf.com/reader/full/15-024-garber-web 2/18
69PCI Journal | M ay–June 2016
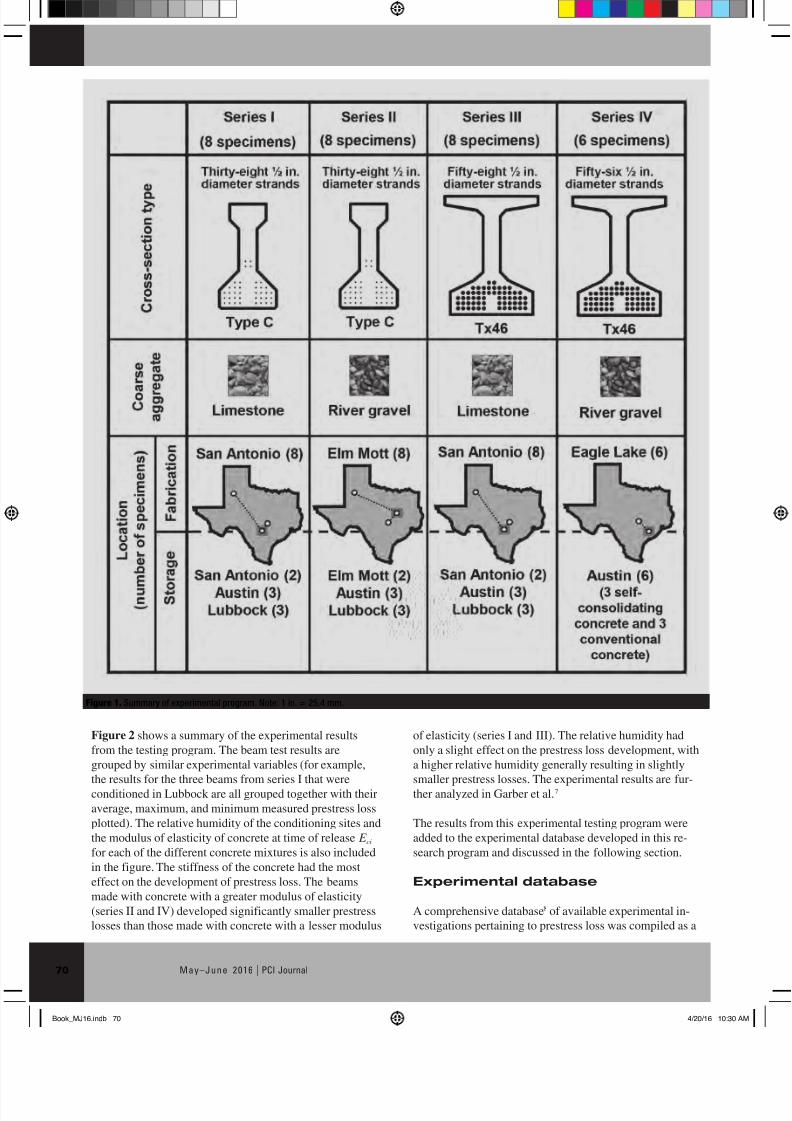
prestress losses in structures fabricated within the United
States (Fig. 1).
Sixteen of the 30 beams were Type C beams (40 in.
[1000 mm] deep I-girder section); the remaining 14 beams
were Tx46 beams (46 in. [1200 mm] deep bulb-tee sec-
tion).11
The I-girder and bulb-tee sections represent thetwo most commonly used section types in standard bridge
design. The concrete and coarse aggregate types were inten-
tionally varied from series to series to investigate their effect
on prestress loss. Series I and III were fabricated in San An-
tonio, Tex., with conventional concrete and limestone coarse
aggregate; series II was fabricated in Elm Mott, Tex., using
conventional concrete and river gravel coarse aggregate;
and series IV was fabricated near Eagle Lake, Tex., using
both conventional and self-consolidating concrete with river
gravel coarse aggregate. The specimens were conditioned
for periods ranging from 93 days (one girder from series IV)
to 980 days (final girder tested in series III) with an verage
beam age of 700 days. The specimens were conditioned at
a total of fi e different storage locations across the state of
Texas in order to investigate the effect of different relative
humidities: San Antonio (average relative humidity RH of
63%), Austin (62%), Lubbock (51%), Elm Mott (63%), and
Eagle Lake (75%).
The long-term loss of prestress within the specimens was
assessed through the use of internal strain monitoring and
fl xural testing. The twofold assessment allowed for the vali-
dation of the accuracy and consistency of both methods. The
development of prestress loss within 18 of the 30 specimens
was monitored through the use of internal strain instrumenta-
tion. Concrete strains and temperatures were measured at
several points through the depth of each instrumented crosssection using vibrating wire gauges and were then used to
calculate the change of strain at the centroid of the prestress-
ing strands. Due to compatibility between the prestressing
strands and the surrounding concrete, it was possible to
further calculate the loss in prestressing force on the basis of
the prestressing strand modulus and area. By monitoring the
strain and temperature periodically throughout the condition-
ing of each specimen, the prestress loss could be calculated
over time.
The fl xural demands (for example, moment due to load)
under which a pretensioned girder will crack are uniquely de-
pendent on the beam geometry, concrete tensile strength, andeffective prestressing force. Measurement of the cracking mo-
ment and concrete tensile strength combined with knowledge
of the beam geometry enables the calculation of the effective
prestressing force, and by association, the prestress loss at the
time of testing. By measuring the prestress loss through both
internal strain monitoring and external service load testing,
two of the most commonly used methods for loss measure-
ment were verified (ensuring the accura y of both the experi-
mental result of this research program and those included in
the experimental database discussed in the following).
Prestress loss estimation shares a history with prestressed
concrete design that began with simplicity and conser-
vatism and led to complexity and accuracy. Attempting
to improve the accuracy of prestress loss estimation and
applicability to modern materials and structural shapes,
the National Cooperative Highway Research Program
(NCHRP) project 18-07 was funded in 2000.1
The endproduct of this research was NCHRP Report 496,1 which
provided new approximate and refined methods to estimate
prestress losses. The NCHRP Report 496 methods were
then incorporated into the American Association of State
Highway and Transportation Officials’ AASHTO LRFD
Bridge Design Specifications, 3 d Edition—2005 Interim
Revisions2 with minimal modifications. The approach
offered in this revised procedure is a reversal in both
complexity and conservatism from its predecessor: the
new procedure is significantly more compl x and leads to
substantially smaller prestress loss estimates.
This paper focuses on the development of a conservative
and precise method for estimating prestress loss that is
based on a large research effort.3 The loss estimation proce-
dure developed during this research project expanded on
the work in NCHRP Report 496.
For the purpose of this paper, the most recent AASHTO
LRFD specifications 4 the 2012 edition, will be referenced
for the prestress loss procedure developed in NCHRP
Report 4961 and implemented in the 2005 interim revi-
sions. The predecessor to this procedure will be referred
to by the last year it was in the AASHTO LRFD specific -
tions, which was 2004.5 The prestress loss procedure found
in the PCI Bridge Design Manual6 will also be used as a
point of comparison in this paper to show differing designphilosophies.
Experimental procedure
The research conducted for this project was accomplished
through full-scale experimental testing,7 the assembly of
a comprehensive experimental database,8 and an ana-
lytical study investigating the sensitivity of the refined
AASHTO LRFD specification 4 procedure and the design
implications of its use. Each of the three major research
efforts will be discussed. A more in-depth discussion of
the research efforts and findings can be found in other
sources.3,7–10
Experimental program
In total, 30 full-scale pretensioned, precast concrete beams
were fabricated to provide a relevant experimental basis
for investigating the parameters influencing prestress loss
and in order to assess the existing prestress loss provisions.
This experimental program is discussed in more depth in
Garber et al.7 These specimens were representative of a
broad range of the most influential actors that may affect
Book_MJ16.indb 69 4/20/16 10:30 AM
7/25/2019 15-024 Garber WEB
http://slidepdf.com/reader/full/15-024-garber-web 3/18
May–June 2016 | PCI Journal70
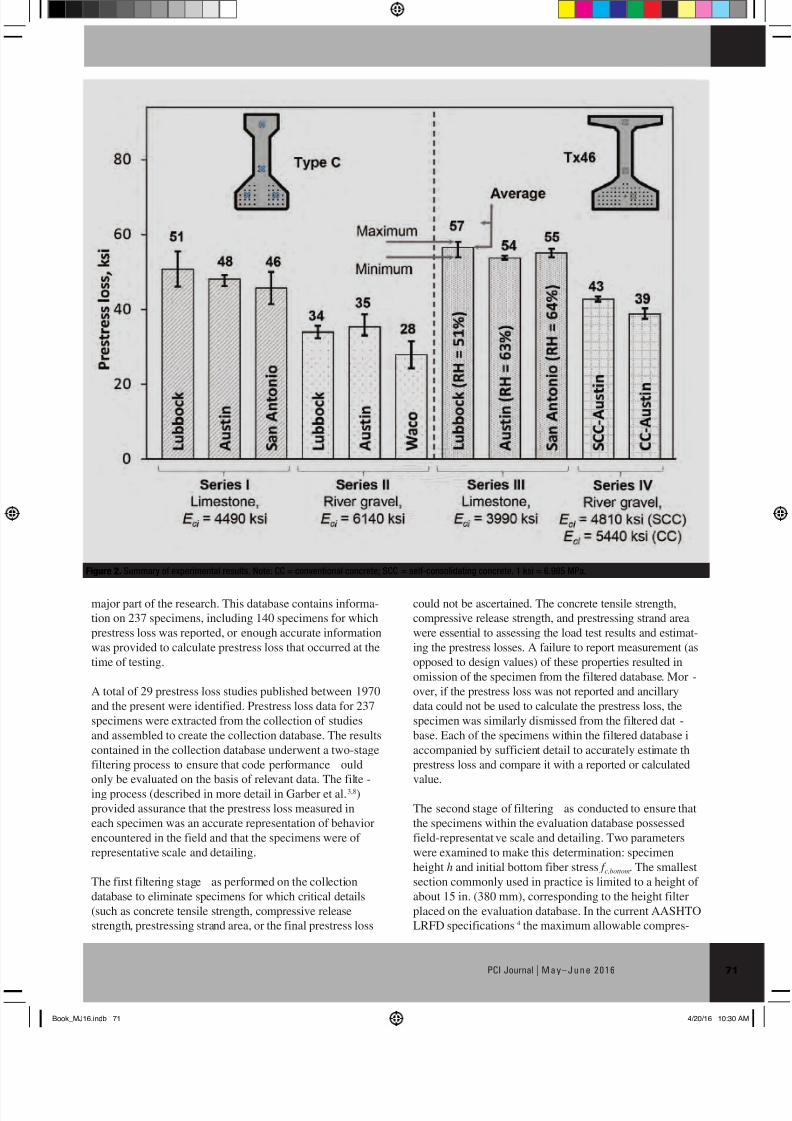
of elasticity (series I and III). The relative humidity had
only a slight effect on the prestress loss development, with
a higher relative humidity generally resulting in slightly
smaller prestress losses. The experimental results are fur-
ther analyzed in Garber et al.7
The results from this experimental testing program were
added to the experimental database developed in this re-
search program and discussed in the following section.
Experimental database
A comprehensive database8 of available experimental in-
vestigations pertaining to prestress loss was compiled as a
Figure 2 shows a summary of the experimental results
from the testing program. The beam test results are
grouped by similar experimental variables (for example,
the results for the three beams from series I that were
conditioned in Lubbock are all grouped together with their
average, maximum, and minimum measured prestress loss
plotted). The relative humidity of the conditioning sites and
the modulus of elasticity of concrete at time of release E ci
for each of the different concrete mixtures is also included
in the figure. The stiffness of the concrete had the most
effect on the development of prestress loss. The beams
made with concrete with a greater modulus of elasticity
(series II and IV) developed significantly smaller prestress
losses than those made with concrete with a lesser modulus
Figure 1. Summary of experimental program. Note: 1 in. = 25.4 mm.
Book_MJ16.indb 70 4/20/16 10:30 AM
7/25/2019 15-024 Garber WEB
http://slidepdf.com/reader/full/15-024-garber-web 4/18
71PCI Journal | M ay–June 2016
could not be ascertained. The concrete tensile strength,
compressive release strength, and prestressing strand area
were essential to assessing the load test results and estimat-
ing the prestress losses. A failure to report measurement (as
opposed to design values) of these properties resulted in
omission of the specimen from the filtered database. Mor -
over, if the prestress loss was not reported and ancillary
data could not be used to calculate the prestress loss, the
specimen was similarly dismissed from the filtered dat -
base. Each of the specimens within the filtered database i
accompanied by sufficient detail to accurately estimate th
prestress loss and compare it with a reported or calculated
value.
The second stage of filtering as conducted to ensure that
the specimens within the evaluation database possessed
field-representat ve scale and detailing. Two parameters
were examined to make this determination: specimen
height h and initial bottom fiber stress f c,bottom. The smallest
section commonly used in practice is limited to a height of
about 15 in. (380 mm), corresponding to the height filter
placed on the evaluation database. In the current AASHTO
LRFD specifications 4 the maximum allowable compres-
major part of the research. This database contains informa-
tion on 237 specimens, including 140 specimens for which
prestress loss was reported, or enough accurate information
was provided to calculate prestress loss that occurred at the
time of testing.
A total of 29 prestress loss studies published between 1970
and the present were identified. Prestress loss data for 237
specimens were extracted from the collection of studies
and assembled to create the collection database. The results
contained in the collection database underwent a two-stage
filtering process to ensure that code performance ould
only be evaluated on the basis of relevant data. The filte -
ing process (described in more detail in Garber et al.3,8)
provided assurance that the prestress loss measured in
each specimen was an accurate representation of behavior
encountered in the field and that the specimens were of
representative scale and detailing.
The first filtering stage as performed on the collection
database to eliminate specimens for which critical details
(such as concrete tensile strength, compressive release
strength, prestressing strand area, or the final prestress loss
Figure 2. Summary of experimental results. Note: CC = conventional concrete; SCC = self-consolidating concrete. 1 ksi = 6.985 MPa.
Book_MJ16.indb 71 4/20/16 10:30 AM
7/25/2019 15-024 Garber WEB
http://slidepdf.com/reader/full/15-024-garber-web 5/18
May–June 2016 | PCI Journal72
sive stress at prestress transfer is 0.6 . Research12 has
suggested that this limit may be increased to a higher valueof 0.65 or 0.7 , which corresponds to the filter placed
on the evaluation database (compressive stress at release
less than or equal to 0.7 ). The final valuation database,
which consists of 140 specimens, contains only specimens
from the filtered database that met the height and initial
stress qualifications outlined pr viously.
The evaluation database contained a wide assortment of
specimens from across the United States, with the major-
ity of the specimens being constructed or conditioned in
Texas. Although the majority of the specimens are from
Texas, many other states are also represented to ensure that
various climates and fabrication techniques are captured by
the database, thus no bias occurred in the results or equa-
tions. The average relative humidity of the conditioning
locations varied from 45% to 80%, with the majority of the
specimens being conditioned in climates with an average
relative humidity between 60% and 70%.
The evaluation database primarily contained specimens in
which prestress loss was determined using either vibrating
wire gauges or fl xural cracking tests. These two methods
correspond to the measurement methods chosen for the
experimental program within this study and were validated
against each other through testing and direct comparisons.
A variety of different specimen geometries are captured
by the specimens in the evaluation database. The majority
of the specimens are 25 to 75 ft (7.5 to 23 m) long and 20
to 60 in. (500 to 1500 mm) high, though longer spans anddeeper cross sections are also present.
In addition, a variety of concrete mixtures with different
types of aggregates are captured within the evaluation
database. The majority of the specimens were fabricated
using conventional concrete, though some specimens
were fabricated using self-consolidating concrete. The
two main types of coarse aggregate used in common
practice (river gravel and limestone) make up the major-
ity of the specimens in the database. Concrete release
strengths within the database range from 4.0 to 13 ksi (28
to 90 MPa) and concrete 28-day strengths range from 5
to 15 ksi (34 to 103 MPa), with 89 of the 140 specimens
attaining a 28-day compressive strength of more than 10
ksi (69 MPa).
The specimens contained in the evaluation database were
used in order to evaluate the existing prestress loss esti-
mation procedures and develop the simplified approach
presented within this paper. A more in-depth discussion
and analysis of the experimental database can be found in
Garber et al.3,8
Analytical investigation
A parametric study was undertaken to investigate the infl -
ence of various inputs on output loss estimation parameters(sensitivity analysis) and assess the impact of prestress loss
estimation on beam design (impact analysis). Both of these
analyses will be covered in brief in this section. A more
thorough treatment of them can be found in Garber et al.3
Sensitivity analysis A sensitivity analysis was con-
ducted on the 2012 AASHTO LRFD specifications’ loss
procedure using an extreme value analysis. In an extreme
value analysis, the effect of the maximum and minimum
possible values for the input variables on the output param-
eters is investigated. For this study, the extreme value
analysis was used to investigate the effect that various input
parameters have on the calculation of the different compo-
nents of prestress loss.
Two different factorial designs were used in the experi-
mental design for the extreme value analysis, one factor
at a time (Table 1) and full factorial (Table 2). The one
factor at a time design was used to investigate the effect of
each individual input variable on the output variables. For
this analysis, only one variable is set to a design extreme
while the other input variables are kept at an average value
(Table 1).
Table 1. Sample analysis design for two-variable system using one
factor at a time design
Analysis number Variable 1 Variable 2
1 Average Average
2 Minimum Average
3 Maximum Average
4 Average Minimum
5 Average Maximum
Table 2. Sample analysis design for two-variable system using
full-factorial design
Analysis number Variable 1 Variable 2
1 Minimum Average
2 Minimum Minimum
3 Minimum Maximum
4 Average Average
5 Average Minimum
6 Average Maximum
7 Maximum Average
8 Maximum Minimum
9 Maximum Maximum
Book_MJ16.indb 72 4/20/16 10:30 AM
7/25/2019 15-024 Garber WEB
http://slidepdf.com/reader/full/15-024-garber-web 6/18
73PCI Journal | M ay–June 2016
The general trends observed in the one factor at a time
analysis can be observed in the input parameters’ effect on
the total prestress loss (Fig. 3). A larger spread in the plot
signifies that the input ariable (for example, cross-section
type) has a significant e fect on the output (for example,
the total prestress loss). The concrete release strength and
the beam length were found to have the largest impact on
the total prestress loss estimate. The cross-section size,
relative humidity, and coarse aggregate correction factor
were each found to have a relatively similar impact on
the loss estimate. The time of deck placement does notsignificantly a fect the loss estimate.
The second factorial design used was a full factorial
design (Table 2). In this technique, the input variables
are systematically varied from their maximum and
minimum design extremes in order to attempt to fin
the most severe combination of extreme input variables
on each output parameter. Every possible combination
of design minimums, maximums, and average values
of each variable are investigated within a full factorial
design. Through the full factorial analysis, the loss due to
relaxation ∆f pR and the differential shrinkage of the deck
concrete ∆f pSS
were found to have only a minor contribu-
tion to the total prestress loss and had the least amount of
variation.
Impact analysis In addition to the sensitivity analy-
sis, an impact analysis was conducted to investigate
the tangible design impact inferred from different loss
expressions. The impact analysis was accomplished by
completing a full girder design for more than 1800 dif-
ferent design scenarios. Through the analysis, different
cross-section types (I-girders, bulb tees, box beams,
and U beams), bridge layouts (with various girder spac-
ing and span lengths), and different concrete types and
strengths were investigated.
Figure 4 shows a sample of the trends observed in the im-
pact analysis. The difference in the number of prestressing
strands required for a design using 2012 AASHTO LRFD
specifications compared with a design using the 200
AASHTO LRFD specifications is sh wn for eight different
span lengths. Because the design of shorter span lengths is
typically controlled by fl xural strength requirements (asopposed to compressive or tensile stress limits), there is no
difference in strands required between the two specific -
tions. This is a result of the ultimate strength capacity not
being affected by prestress loss (because it only depends on
the strands’ ultimate strength). For the cross-section types
investigated, the transition point between service-level
fl xural stresses and ultimate fl xural strength controlling
design occurred between 75% and 85% of the maximum al-
lowable span length. When one or both of the designs were
governed by stress limit checks, a difference in the strands
required by the two specifications as generally observed.
The controlling stress limit was typically the bottom-fibe
tensile stress check at midspan under service loading. The
design highlighted in Fig. 4 was a Type C girder at a span
of approximately 90% of the maximum span length Lmax .
A design using the 2012 AASHTO LRFD specification
would require 10 fewer strands than a design using the
2004 AASHTO LRFD specifications, about a 25% redu -
tion in the number of required strands.
The results and observations from the analytical investiga-
tion were used in the assessment of the current prediction
methods and the development of the simplified procedure.
Figure 3. Sample results from sensitivity analysis, range of total estimated
prestress loss for variation of different input parameters. Note: '
ci f = concrete
strength at release of prestress; K 1 = correction factor for source aggregate;
L beam = total girder length; t d = age of concrete at time of deck placement. 1 ksi
= 6.895 MPa.
Figure 4. Sample results from impact analysis, difference in total strands
required by 2004 AASHTO LRFD specifications versus 2012. Note '
cf = speci-
fied comp essive strength of concrete; '
ci f = concrete strength at release of
prestress; L max = maximum length achievable using a specific section type
and strand layout; L span = total distance from center to center of supports; n =
number of strands; ∆strands = difference in strands between design using 2004
AASHTO and 2012 AASHTO LRFD specifications p estress loss procedures.
Book_MJ16.indb 73 4/20/16 10:30 AM
7/25/2019 15-024 Garber WEB
http://slidepdf.com/reader/full/15-024-garber-web 7/18
May–June 2016 | PCI Journal74
The focus of this section is the optimization of the pro-
cedure developed by Tadros et al.1 and found in the 2012
AASHTO LRFD specifications. The experimental results
gathered from the aforementioned efforts were used in the
development of this approach for estimating prestress loss.
The experimental program, involving the construction,
monitoring, and testing of 30 full-scale girders, was used
to investigate the influence of s veral variables thought
to influence prestress loss d velopment. The analytical
program was used to evaluate the value of each individual
parameter currently used in loss estimation with the objec-
tive of eliminating unnecessary complexity. The compre-
hensive experimental database was used to evaluate all
of the prestress loss estimation procedures to assess theiraccuracy, conservatism, and precision.
The scope of this paper does not include an explanation
of each of the different methods explored in this investi-
gation, though a better knowledge of how each method
should be used would aid in the understanding of the pro-
visions developed in this paper). The authors recommend
several other resources for this purpose.3,6,8,17,18
Performance of current prestress
loss estimation procedures
Elastic shortening loss The performance of a vari-
ety of different prestress loss estimation procedures was
investigated using the evaluation database (introduced pre-
viously). Because loss estimation is typically broken down
into elastic shortening (or short-term loss) and long-term
loss, the performance of elastic shortening loss estimation
procedures was separated. Table 3 shows the estimated
versus measured elastic shortening loss for 36 specimens in
the experimental database in which elastic shortening loss
was reported. Table 3 shows the proposed method and the
three currently used procedures for estimating elastic short-
A complete description of the analytical investigation is be-
yond the scope of this paper and can be found elsewhere.3,9
Optimizing existing methods
As mentioned, the main objective of these research efforts
was to develop a simple and precise method for estimating
prestress loss. During the early stages of development, many
different loss estimation procedures and concrete material
behavioral models were considered. The concrete material
models13–15 typically have been developed and calibrated
based on comprehensive creep and shrinkage databases pri-
marily composed of standard concrete cylinder size samples
(4 in. [100 mm] diameter and 8 in. [200 mm] length). Theresearchers found that these models did not adequately rep-
resent the observed behavior in full-scale prestressed beam
specimens (when directly implemented). Further work was
done by Gallardo10 (and is ongoing) to investigate ways to
use these detailed material-based models for the estimation
of prestress loss in full-scale bridge girders.
The subsequent investigations were focused on methods
currently (and previously) used for estimating the prestress
loss in bridge design. Many of the previous loss estimation
procedures5,6,16 offer simple methods for estimating loss
with large levels of conservatism. These methods were all
considered and investigated during the development of the
loss procedure proposed in this paper.
The work of Tadros et al. in NCHRP Report 4961 was
aimed at bridging the gap between the material-based
models and the simple models developed solely for girder
design. This effort resulted in a complex procedure that
provides a relatively accurate estimate of prestress loss.
This procedure was seen as a satisfactory starting point for
optimizing the estimation procedure for prestress loss in
prestressed members.
Table 3. Comparison of procedure performance for elastic shortening loss estimations using estimated-to-measured ratio E/M from the evaluation
database (36 specimens)
Transformed section
approach
Gross section
approximation
Iterative gross
section approachProposed
Minimum E /M 0.70 0.68 0.69 0.71
Average E /M 0.89 0.87 0.87 0.92
Maximum E /M 1.18 1.15 1.15 1.31
COV of E /M 0.14 0.14 0.14 0.15
Standard deviation
of E /M 0.12 0.12 0.12 0.14
0.8 ≤ E /M < 1.0 21 19 20 25
0.6 ≤ E /M < 0.8 8 12 10 3
E /M < 0.6 0 0 0 0
Note: COV = coefficient of vari tion.
Book_MJ16.indb 74 4/20/16 10:30 AM
7/25/2019 15-024 Garber WEB
http://slidepdf.com/reader/full/15-024-garber-web 8/18
75PCI Journal | M ay–June 2016
were all factored in when the recommended elastic shorten-
ing loss estimation procedure was developed.
Final loss The performance of numerous prestress loss
estimation procedures was also investigated using the fina
measured prestress loss gathered for the specimens in the
evaluation database. Figure 5 and Table 4 show the E/M
for two simplified procedures (PCI simplifie 6 and 2004
AASHTO LRFD specifications) and two detailed procedures
ening loss: the transformed section approach, gross section
approximation, and the iterative gross section approach.
Although the three different methods vary significantlyin
complexity, all three of the methods performed similarly,
with average estimated-to-measured ratios E/M of about
0.88 and coefficientsof variation COV of 0.14. In a signifi-
cant number of specimens (12 out of 36 specimens for the
gross section approximation), the elastic shortening loss
was underestimated by more than 20%. These observations
Figure 5. Estimated versus measured final p estress loss. Note: 1 ksi = 6.895 MPa.
Book_MJ16.indb 75 4/20/16 10:30 AM
7/25/2019 15-024 Garber WEB
http://slidepdf.com/reader/full/15-024-garber-web 9/18
May–June 2016 | PCI Journal76
1. Dissociation of deck placement and long-term estimates
2. Consideration of typical construction details
3. Further simplifications (related to concrete release
strength and elastic shortening)
Each of these optimization steps will be briefly discussed
in this section.
Dissociation of deck placement and long-term estimates The first series of simplificationswas
made to simplify the loss estimation with relation to time.
In the 2012 AASHTO LRFD specifications, there are three
different components that introduce time dependency:
• the use of the stress loss caused by other prestress loss
to determine the additional creep component
• a time development factor k td
• including stress gain resulting from differential shrink-
age between the deck and the girder
The creep after deck placement is calculated using two
different stresses:
• stress developed from prestress losses before deck
placement
• stress developed from sustained dead loads
This creep stress is then used to calculate the additional
prestress loss due to creep that the girder will undergo from
(refinedAASHTO LRFD specification 4 and a time step
approach18). The PCI simplifiedand 2004 AASHTO LRFD
specifications approaches offered the most conservative esti-
mation of the final prestress loss. The other three approaches
all performed similarly, with similar average E/M , COV , and
number of unconservatively estimated loss values.
The simplicity of the various proposals was investigated by
comparing the total variables and total number of math-
ematical operations required to estimate the final prestress
loss for each of the procedures.
• The PCI Design Manual has approximately 40 opera-
tions and 14 variables.
• The 2004 AASHTO LRFD specifications has approx -
mately 40 operations and 12 variables.
• The 2012 AASHTO LRFD specifications has approx -
mately 600 operations and 70 variables.
• The proposed method has approximately 60 operations
and 24 variables.
The 2004 AASHTO LRFD specifications procedure as
designed to be both simple and conservative. The 2012
AASHTO LRFD specifications procedure as created
with theoretical accuracy in mind, which is reflected in the
greater magnitude of complexity.
Optimization process
The proposed prestress loss procedure was developed
through the following optimization steps:
Table 4. Comparison of procedure performance for final loss estim tion using estimated-to-measured ratio E / M from the evaluation database (140
specimens)
Simplified method Detailed methods
ProposedPCI simplifie
2004
AASHTO LRFD
specification
Simplified 2012
AASHTO LRFD
specification
Refined 2012
AASHTO LRFD
specification
Time step
Minimum E /M 0.79 0.89 0.73 0.59 0.74 0.84
Average E /M 1.42 1.74 1.15 1.25 1.13 1.32
Maximum E /M 2.69 3.69 2.12 2.20 1.99 2.31
COV of E /M 0.23 0.26 0.22 0.24 0.22 0.20
Standard
deviation of E /M 0.32 0.45 0.25 0.30 0.24 0.27
0.8 ≤ E /M < 1.0 6 1 34 22 34 21
0.6 ≤ E /M < 0.8 1 0 8 7 8 0
E /M < 0.6 0 0 0 1 0 0
Note: COV = coefficient of vari tion
Book_MJ16.indb 76 4/20/16 10:30 AM

7/25/2019 15-024 Garber WEB
http://slidepdf.com/reader/full/15-024-garber-web 10/18
77PCI Journal | M ay–June 2016
sufficient and will simplify the procedure. Using a tim
development factor of 1.0 would also be conservative for
calculating the prestress loss at the time of deck place-
ment. For more sensitive designs and situations in which
the time development of prestress loss is required, this
factor can be reintroduced. Time dependency is discussed
further in a later section.
An additional stress gain is thought to develop as a result
of differential shrinkage between the deck and the girder
(Fig. 6). Extending the shear stirrups into the deck cre-
ates composite action between the deck and the girder.
At the time of deck placement (typically up to 180 days
after casting the girder), the girder usually has already
undergone the majority of its shrinkage. The shrinkage
of the deck concrete is then thought to cause the girder
to go into positive bending, increasing the stress in the
strand and the concrete around the strand (Fig. 6).
In most cases, partial-depth precast concrete deck panels
or deck forms are used (Fig. 6). In these situations,
the precast concrete panel will resist much of the deck
shrinkage so there will be negligible effect on the girder.
The differential shrinkage component was removed from
the procedure because it does not accurately model the
true behavior of the system and is only a minor contribu-
tor to the overall final estimated prestress loss
By making these three simplifications, the creep-, shrin -
age-, and relaxation-related prestress loss can be found in
one step.
Consideration of typical construction details
The next three simplificationswere made based on typi-cal construction details found in bridge design. More than
1800 unique bridge designs were created using the 2012
AASHTO LRFD specifications(within the analytical inves-
tigation discussed previously) and by keeping track of all
of the output variables. Two different variables introduced
in the 2012 AASHTO LRFD specifications procedure were
found to have minimal variation throughout the analytical
investigation, the transformed section coefficient K id and
the shape factor k s. Figure 7 shows a small sample of these
results. The transformed section coefficientwas found to
always fall between 0.8 and 0.9 for typical bridge configur -
tions in which the prestress loss would affect design. The
shape factor was found to nearly always be 1.0 (other than
in a few situations where it was only up to 1.05). With these
two observations in mind, the procedure was simplified by
setting the transformed section coefficient to 0.9 (a conser-
vative simplification) and setting the shape factor to 1.0.
The creep coefficient as further simplified by settin
standard times for release (one day after initial casting)
and deck placement (120 days after initial casting). These
simplifications were both made with standard constru -
tion practices and conservatism in mind.
the time of deck placement until final time ∆f pCD. The stresses
that develop as a result of the prestress loss before deck
placement are minor compared with those developed from
sustained dead load. This results in less than a 1 ksi (6.9 MPa)
difference in the post-deck-placement creep-related prestress
loss. Such a minor difference does not warrant the complexity
that including the pre-deck-placement loss causes.
The 2012 AASHTO LRFD specifications account fo
the development of creep- and shrinkage-related pre-
stress loss using a time development factor k td . In typical
design, the use of the time development factor simply
divides the shrinkage- and creep-related prestress loss
into before- and after-deck-placement components.
If the prestress loss at the time of deck placement is not
needed, then using a time development factor of 1.0 is
Figure 6. Stress introduced to system by differential shrinkage of deck concrete.
Figure 7. Typical values for transformed section coefficients K id and shape
factors k s .
Book_MJ16.indb 77 4/20/16 10:30 AM
7/25/2019 15-024 Garber WEB
http://slidepdf.com/reader/full/15-024-garber-web 11/18
May–June 2016 | PCI Journal78
decrease the bias found in higher concrete release
strengths (Fig. 8) in which the slope of the line of best
fit is significantly closer to zero (a value representing
no bias).
The final simplification of the loss estimation procedu
involved modifying and clarifying the elastic short-
ening loss estimation. From the investigation of the
elastic shortening procedures, there was little varia-
tion observed between the performances of each of the
methods. For this reason, a gross-section approximation
was chosen because it offered both conservatism and
simplicity.
All of these optimization steps were undertaken to
develop the proposed prestress loss estimation procedure
described in the following section.
Further simplifications The finaltwo simplific -
tions involved a recalibration of the procedure based on
concrete release strengths and simplification of elastic
shortening estimations.
The estimated-to-measured final prestress loss ratio
using the refined AASHTO LRFD specifications pro-
cedure is plotted against the concrete release strength
in Fig. 8. As the concrete release strength increases,
the conservatism of the 2012 AASHTO LRFD speci-
fications’ prestress loss estimate decreases, as demon-
strated by the line of best fit. Several other methods for
accounting for concrete release strength effects on both
creep and shrinkage were investigated. The concrete
release strength coefficient that was previously located
in the 2004 AASHTO LRFD specifications’ article
5.4.2.3, Concrete Materials, was found to reasonably
Figure 8. Concrete release strength versus estimated-to-measured prestress loss. Note: 1 ksi = 6.895 MPa.
Book_MJ16.indb 78 4/20/16 10:30 AM
7/25/2019 15-024 Garber WEB
http://slidepdf.com/reader/full/15-024-garber-web 12/18
79PCI Journal | M ay–June 2016
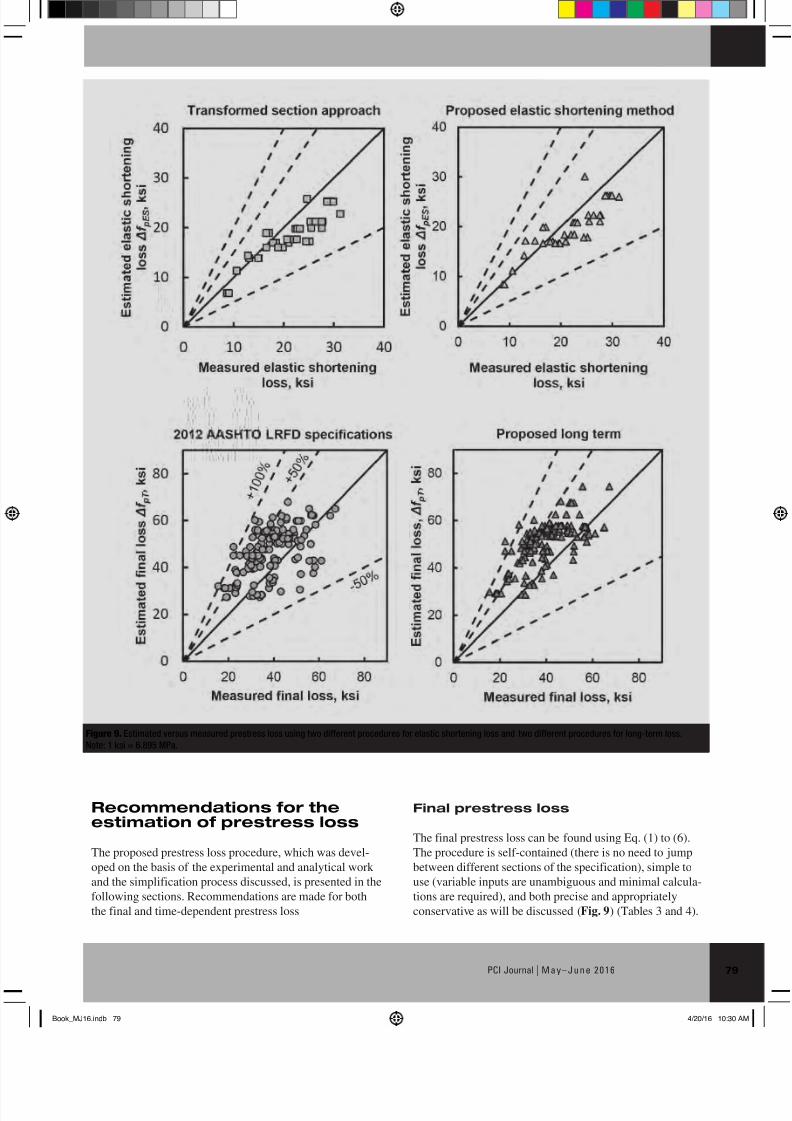
Final prestress loss
The final prestress loss can be found using Eq. (1) to (6).
The procedure is self-contained (there is no need to jump
between different sections of the specification), simple to
use (variable inputs are unambiguous and minimal calcula-
tions are required), and both precise and appropriately
conservative as will be discussed (Fig. 9) (Tables 3 and 4).
Recommendations for theestimation of prestress loss
The proposed prestress loss procedure, which was devel-
oped on the basis of the experimental and analytical work
and the simplification process discussed, is presented in the
following sections. Recommendations are made for both
the final and time-dependent prestress loss
Figure 9. Estimated versus measured prestress loss using two different procedures for elastic shortening loss and two different procedures for long-term loss.
Note: 1 ksi = 6.895 MPa.
Book_MJ16.indb 79 4/20/16 10:30 AM

7/25/2019 15-024 Garber WEB
http://slidepdf.com/reader/full/15-024-garber-web 13/18
May–June 2016 | PCI Journal80
where
M sd = moment at midspan of girder due to deck weight and
superimposed loads
Relaxation loss
f f
K
f
f pR
pt
L
pt
py
=
−
20 55. Δ (7)
where
f pt = stress in prestressing strands immediately after trans-
fer (proposed to be taken as 0.7 fpu)
f py = yield strength of prestressing strand
K L = strand type factor = 30 for low-relaxation strands and
7 for other prestressing steel
Figure 9 and Table 4 show the performance of the pro-
posed prestress loss estimation procedure. The proposed
procedure offers improved precision with the lowest coef-
ficient of ariation (0.20 for the proposed compared with
0.24 for 2012 AASHTO LRFD specifications and 0.23 for
PCI simplified procedures). The proposed procedure also
has the fewest specimens in which the prestress loss is
underestimated by greater than 20% (zero for the proposed
compared with seven for 2012 AASHTO LRFD specific -
tions and one for the PCI simplified procedures) while
retaining a similar average estimated-to-measured prestress
loss ratio (1.32 for the proposed, 1.25 for 2012 AASHTO
LRFD specifications, and 1.42 for PCI simplified pro -
dures). The other noticeable advantage of the proposed
procedure is its dramatic improvement in terms of simplic-ity. It requires about one-tenth the computational effort of
the 2012 AASHTO LRFD specifications procedure ( a-
ble 6). The additional complexity is further highlighted in
an example problem developed in Garber et al.3 in which
the proposed loss expression is compared directly with the
2012 AASHTO LRFD specifications’ procedure
The E/M value is plotted against the concrete release
strength for all of the specimens in the database in Fig. 8.
The use of the 2012 AASHTO LRFD specifications
resulted in specimens with higher release strengths having
lower levels of conservatism (slope of the line of best fit
in Fig. 8). The use of the proposed procedure decreased
this bias (slope of the line of best fit approaching zero in
Fig. 8). Therefore, the proposed method offers a more uni-
form level of conservatism over a broad range of concrete
compressive strengths.
All of these advantages point to the fact that the pro-
posed prestress loss procedure is well suited for everyday
designs. The increase in conservatism will ensure that
prestressed girders perform well, exhibiting good durabil-
ity and serviceability. The increased simplicity will allow
In the proposed procedure, the total prestress loss ∆f pT
(Eq. [1]) is composed of four dif ferent components:
• elastic shortening ∆f pES , Eq. (2)
• loss due to concrete shrinkage ∆f pSR, Eq. (4)
• loss due to concrete creep ∆f pCR, Eq. (5)
• strand relaxation ∆f pRE , Eq. (6)
The elastic shortening loss requires the calculation of the
stress in the concrete at the centroid of the prestressing
strands f cgp using the ultimate strength of the prestressing
strands f pu, the gross section properties of the section (area
Ag, moment of inertia I g, and eccentricity of the strands at
midspan e p), and the moment at midspan due to self-weight
M g.
Total prestress loss
∆f pT = ∆f pES + ∆f pSR + ∆f pCR + ∆f pR (1)
Elastic shortening
f E
E f pES
p
ci
cgp=˜ (2)
where
E ci = modulus of elasticity of concrete at time of release
E p = modulus of elasticity for prestressing strands
f f A A
e
I
M e
I cgp pu p s
g
p
g
g p
g= +
−0 7
1 2
. (3)
A ps = total area of prestressing strands
Shrinkage loss
f E H
f pSR p
ci
= −
+
× −140
4 8
4 4 10 5
.
.
' Δ (4)
H = ambient relative humidity, %
Creep loss
f H
f
E
E
f f pCR
ci
p
cicgp cd =
−
+
+
( )0 1
1495
4 8
0 6.
.
.
'
Δ Δ (5)
where
∆f cd = change in concrete stress at centroid of prestressing
strands due to long-term losses between transfer and deck
placement combined with deck weight and superimposed
loads
f M e
I cd
sd p
g
= Δ (6)
Book_MJ16.indb 80 4/20/16 10:30 AM
7/25/2019 15-024 Garber WEB
http://slidepdf.com/reader/full/15-024-garber-web 14/18
81PCI Journal | M ay–June 2016
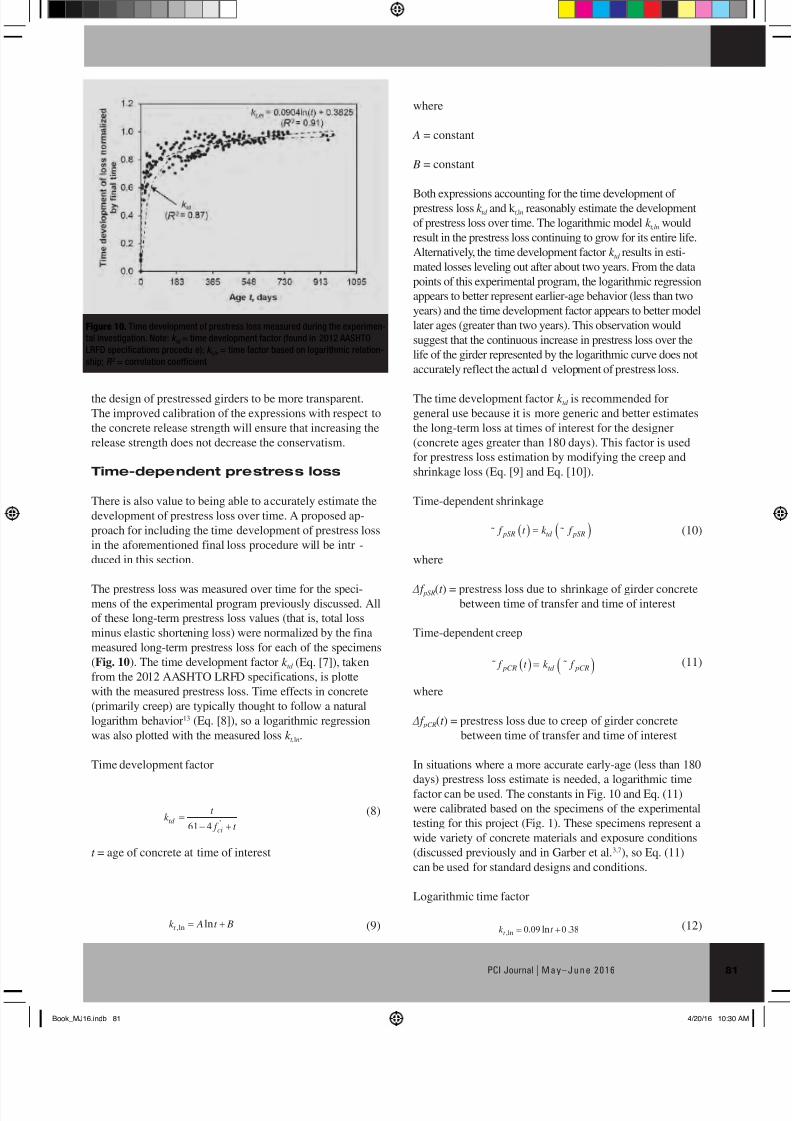
where
A = constant
B = constant
Both expressions accounting for the time development ofprestress loss k td and k t,ln reasonably estimate the development
of prestress loss over time. The logarithmic model k t,ln would
result in the prestress loss continuing to grow for its entire life.
Alternatively, the time development factor k td results in esti-
mated losses leveling out after about two years. From the data
points of this experimental program, the logarithmic regression
appears to better represent earlier-age behavior (less than two
years) and the time development factor appears to better model
later ages (greater than two years). This observation would
suggest that the continuous increase in prestress loss over the
life of the girder represented by the logarithmic curve does not
accurately reflect the actual d velopment of prestress loss.
The time development factor k td is recommended for
general use because it is more generic and better estimates
the long-term loss at times of interest for the designer
(concrete ages greater than 180 days). This factor is used
for prestress loss estimation by modifying the creep and
shrinkage loss (Eq. [9] and Eq. [10]).
Time-dependent shrinkage
f t k f pSR td pSR( ) = ( )˜ ˜ (10)
where
∆f pSR(t ) = prestress loss due to shrinkage of girder concretebetween time of transfer and time of interest
Time-dependent creep
f t k f pCR td pCR( ) = ( )˜ ˜ (11)
where
∆f pCR(t ) = prestress loss due to creep of girder concrete
between time of transfer and time of interest
In situations where a more accurate early-age (less than 180
days) prestress loss estimate is needed, a logarithmic time
factor can be used. The constants in Fig. 10 and Eq. (11)
were calibrated based on the specimens of the experimental
testing for this project (Fig. 1). These specimens represent a
wide variety of concrete materials and exposure conditions
(discussed previously and in Garber et al.3,7), so Eq. (11)
can be used for standard designs and conditions.
Logarithmic time factor
k t t ,ln . ln .= +0 09 0 38 (12)
the design of prestressed girders to be more transparent.
The improved calibration of the expressions with respect to
the concrete release strength will ensure that increasing the
release strength does not decrease the conservatism.
Time-dependent prestress loss
There is also value to being able to accurately estimate the
development of prestress loss over time. A proposed ap-
proach for including the time development of prestress loss
in the aforementioned final loss procedure will be intr -
duced in this section.
The prestress loss was measured over time for the speci-mens of the experimental program previously discussed. All
of these long-term prestress loss values (that is, total loss
minus elastic shortening loss) were normalized by the fina
measured long-term prestress loss for each of the specimens
(Fig. 10). The time development factor k td (Eq. [7]), tak en
from the 2012 AASHTO LRFD specifications, is plotte
with the measured prestress loss. Time effects in concrete
(primarily creep) are typically thought to follow a natural
logarithm behavior13 (Eq. [8]), so a logarithmic regression
was also plotted with the measured loss k t,ln.
Time development factor
k t
f t td
ci
=
− +61 4 '
(8)
t = age of concrete at time of interest
k A t Bt ,ln ln= +
(9)
Figure 10. Time development of prestress loss measured during the experimen-
tal investigation. Note: k td = time development factor (found in 2012 AASHTO
LRFD specifications procedu e); k t,ln = time factor based on logarithmic relation-
ship; R 2 = correlation coefficient
Book_MJ16.indb 81 4/20/16 10:30 AM

7/25/2019 15-024 Garber WEB
http://slidepdf.com/reader/full/15-024-garber-web 15/18
May–June 2016 | PCI Journal82
cial support and collaborative efforts for this project. The
authors would like to specifically thank the members of the
Project Advisory Committee who were key contributors
for several of the major decisions of the project. The au-
thors would also like to thank the members of the Precast
Concrete Manufacturers’ Association of Texas (specifi-
cally Bexar Concrete Works, Texas Concrete Works, andValley Prestress Products) for assisting with specimen
construction.
The authors would also like to thank Blake Stasney, An-
drew Valentine, Dennis Fillip, and David Braley and the
rest of the support staff at the Ferguson Structural Engi-
neering Laboratory (FSEL). Finally, the authors appreciate
the help of many other researchers at FSEL who helped
with instrumentation and testing, specifically Hossein
Yousefpour and Joel Blok.
The contents of this paper reflect the vi ws of the authors,
who are responsible for the facts and the accuracy of the
data presented herein. The contents do not necessarily
reflect the official v ws or policies of TxDOT.
References
1. Tadros, M. K. 2003. Prestress Losses in Pretensioned
High-Strength Concrete Bridge Girders. NCHRP
Report 496. Washington, DC: Transportation Research
Board.
2. AASHTO (American Association of State Highway
and Transportation Officials). 2005. AASHTO LRFD
Bridge Design Specifications, 3 d Edition—2005 In-
terim Revisions. 3rd ed. Washington, DC: AASHTO.
3. Garber, D., J. Gallardo, D. Deschenes, D. Dunkman,
and O. Bayrak. 2012. Effect of New Prestress Loss
Estimates on Pretensioned Concrete Bridge Girder De-
sign. Austin, TX: Texas Department of Transportation.
4. AASHTO. 2012. AASHTO LRFD Bridge Design
Specification . 6th ed. Washington, DC: AASHTO.
5. AASHTO. 2004. AASHTO LRFD Bridge Design
Specification . 3rd ed. Washington, DC: AASHTO.
6. PCI Industry Handbook Committee. 2010. PCI Design
Handbook: Precast and Prestressed Concrete. MNL-
120. 7th ed. Chicago, IL: PCI.
7. Garber, D., J. Gallardo, D. Deschenes, and O. Bayrak.
2015. “Experimental Investigation of Prestress Losses
in Full-Scale Bridge Girders.” ACI Structural Journal
112 (5): 553–564.
8. Garber, D., J. Gallardo, D. Deschenes, and O. Bayrak.
2016. “Prestress Loss Database for Pretensioned
Conclusion andrecommendations
The appropriate estimation of prestress loss is essential for
the proper design of prestressed concrete members. An un-
derestimated prestress loss may result in a prestressed girder
prone to service-load-level cracking and durability concerns.Overestimated prestress loss may result in excessive cam-
bers or the use of a greater amount of steel. A proper balance
must be struck with accuracy, precision, and conservatism—
a challenge because improved accuracy implies decreased
conservatism. In addition, excessive complexity may be
unnecessary (with the limited amount of knowledge at the
time of initial design) and detrimental to the designer having
a good understanding of the girder’s behavior.
In the authors’ opinion, additional complexity is warranted
if a benefit from it can be der ved in terms of accuracy and/
or precision. The 2012 AASHTO LRFD specifications do
not offer additional precision over the procedure pro-
posed in this paper and is 10 times more computationally
intensive. Approximately 600 mathematical operations are
required for the AASHTO LRFD specifications’ prestress
loss procedure compared with the 60 operations required
for the proposed procedure. This additional computational
expense does not improve the COV or the standard devia-
tion in relation to the proposed procedure when consider-
ing the behavior of the 140 specimens included in the
prestress loss database.
On the basis of improved accuracy, reduced scatter, and
increased computational efficien y, the proposed prestress
loss calculation procedure put forth in this paper is viewed to
be consistent with the spirit with which the AASHTO LRFDspecifications were originally calibrated. The 7% increased
bias for the proposed procedure (in other words, the aver-
age E/M value of 1.32 compared with 1.25) may be viewed
as a slight disadvantage in relation to the refinedAASHTO
LRFD specifications procedure. That said, this slight disad-
vantage can be put into context by recognizing that the pro-
posed procedure eliminates all of the grossly underpredicted
data points (those with E/M values between 0.6 and 0.8 and
those that are less than 0.6, as shown in Table 4).
Finally, for situations in which the development of pre-
stress loss over time is needed, a simple time development
factor can be used (supplementing the proposed loss proce-
dure), as illustrated in this paper.
Note to readers
Additional information is available online in an appendix.
Acknowledgments
The authors would like to express their gratitude to the
Texas Department of Transportation (TxDOT) for its fina -
Book_MJ16.indb 82 4/20/16 10:30 AM

7/25/2019 15-024 Garber WEB
http://slidepdf.com/reader/full/15-024-garber-web 16/18
83PCI Journal | M ay–June 2016
e p = eccentricity prestressing strands at girder mid-
span of gross concrete section
E ci = modulus of elasticity of concrete at time of
release
E p = modulus of elasticity for prestressing strands
E/M = estimated-to-measured loss ratio
'
c f = specified or measured ultimate strength of co -
crete
f c,bottom = initial bottom fiber stress of concrete membe
f cgp = stress in concrete at the centroid of the pre-
stressing strands
= concrete strength at release of prestress
f pi = initial stress in prestressing steel
f pj = stress in prestressing steel at jacking
f pt = stress in prestressing strands immediately after
transfer (proposed to be taken as 0.7 f pu)
f pu = ultimate strength of prestressing strands
f py = yield strength of prestressing strand
h = section or specimen height
H = ambient relative humidity, %
I g = moment of inertia of gross section
k f = factor for the effect of concrete strength
k s = shape factor (accounting for the effect of the
volume-to-surface ratio of the component)
k td = time development factor (found in 2012 AAS-
HTO LRFD specifications procedure
k t,ln = time factor based on logarithmic relationship
K 1 = correction factor for source aggregate (taken as
1.0 unless determined by physical tests)
K id = transformed section coefficient (accounting for
time-dependent interaction between concrete
and bonded steel)
K L = strand type factor = 30 for low relaxation
strands and 7 for other prestressing steel, unless
more accurate manufacturer’s data are available
Concrete Members.” ACI Structural Journal 113 (2):
313–324.
9. Garber, D. 2014. “Effect of New Prestress Loss Es-
timation Procedure on Precast, Pretensioned Bridge
Girders.” PhD diss., University of Texas at Austin.
10. Gallardo, J. 2014. “Model of Strain-Related Pre-
stress Losses in Pretensioned Simply Supported
Bridge Girders.” PhD diss., University of Texas at
Austin.
11. Texas Department of Transportation. Accessed [date].
“Bridge Standards.” http://www.txdot.gov/insdtdot
/orgchart/cmd/cserve/standard/bridge-e.htm.
12. Birrcher, D. B., O. Bayrak, and M. E. Kreger. 2010.
“Effects of Increasing Allowable Compressive Stress
at Prestress Transfer.” ACI Structural Journal 107 (1):
21–31.
13. Bazant, Z. P., and S. Baweja. 2000. “Creep and
Shrinkage Prediction Model for Analysis and Design
of Concrete Structures: Model B3.” In The Adam
Neville Symposium: Creep and Shrinkage—Structural
Design Effects, SP194, pp. 1–84. Farmington Hills,
MI: ACI (American Concrete Institute).
14. Wendner, R., M. Hubler, and Z. Bazant. 2013. “The
B4 Model for Multi-decade Creep and Shrinkage
Prediction.” Paper presented at CONCREEP-9,
Massachusetts Institute of Technology, Cambridge,
MA.
15. ACI Committee 209. 2008. Guide for Modeling and
Calculating Shrinkage and Creep in Hardened Con-
crete. ACI 209.2R-08. Farmington Hills, MI: ACI.
16. ACI–ASCE Joint Committee 323. 1958. Tentative
Recommendations for Prestressed Concrete. Chicago,
IL: Portland Cement Association.
17. Swartz, B. D., A. Scanlon, and A. J. Schokker. 2012.
“AASHTO LRFD Bridge Design Specifications
Provisions for Loss of Prestress.” PCI Journal 57 (4):
108–132.
18. ACI Committee 423. 2014. Guide to Estimating Pre-
stress Loss. Farmington Hills, MI: ACI.
Notation
Ag = area of gross concrete section
A ps = total area of prestressing strands
COV = coefficient of ariation
Book_MJ16.indb 83 4/20/16 10:30 AM
7/25/2019 15-024 Garber WEB
http://slidepdf.com/reader/full/15-024-garber-web 17/18
May–June 2016 | PCI Journal84
∆f pCR = prestress loss due to creep of girder concrete
(for 2012 AASHTO LRFD specifications ta en
as loss due to creep between time of transfer
and time of deck placement)
∆f pCR(t) = prestress loss due to creep of girder concrete
between time of transfer and time of interest
∆f pES = prestress loss due to elastic shortening
∆f pLT = long-term prestress loss
∆f pR = prestress loss due to relaxation of prestressing
strand
∆f pSR = prestress loss due to shrinkage of the girder
concrete
∆f pSR(t) = prestress loss due to shrinkage of girder con-
crete between time of transfer and time of inter-
est
∆f pSS = stress gain in prestressing strands due to shrink-
age of deck in composite section
∆f pT = total prestress loss
∆strands = difference in strands between two different
designs (compared with 2004 AASHTO LRFD
in most instances of this paper)
εbdf = shrinkage strain of girder concrete between
time of deck placement and final tim
εbid = shrinkage strain of girder concrete between
time of transfer and time of deck placement
εbif = shrinkage strain of girder concrete between
time of transfer and final tim
ψ bdf = girder creep coefficient at final time due t
loading at deck placement
ψ bid = girder creep coefficient at time of deck plac -
ment due to loading introduced at transfer
ψ bif
= girder creep coefficient at final time due t
loading introduced at transfer
Lbeam = total girder length
Lmax = maximum length achievable using a specific
section type and strand layout
Lspan = total distance from center to center of supports
M g = moment at midspan of girder due to self-weight
M sd = moment at midspan of girder due to deck weight
and superimposed loads
n = number of strands
N total = total number of specimens
R2 = correlation coefficien
RH = relative humidity
t = age of concrete at time of interest
t d = age of concrete at time of deck placement
t f = age of concrete at final time considere
t i = age of concrete at time of release for preten-
sioned construction or age of concrete at time of
load application
∆f cd = change in concrete stress at centroid of pre-
stressing strands due to long-term losses
between transfer and deck placement combined
with deck weight and superimposed loads
∆f cd,DL = change in concrete stress at centroid of pre-
stressing strands due to deck weight and super-
imposed loads
∆ fcd,∆P = change in concrete stress at centroid of pre-
stressing strands due to long-term losses
between transfer and deck placement
∆f p = prestress loss
∆f pCD = prestress loss due to creep of girder concrete
between time of deck placement and fina
time
Book_MJ16.indb 84 4/20/16 10:30 AM

7/25/2019 15-024 Garber WEB
http://slidepdf.com/reader/full/15-024-garber-web 18/18
85PCI Journal | M ay–June 2016
About the authors
David B. Garber, PhD, is an
assistant professor in the Depart-
ment of Civil and Environmental
Engineering at Florida Interna-
tional University in Miami, Fla.
He received his BS from Johns
Hopkins University and both his
MS and PhD from the University of Texas at Austin.
José M. Gallardo, PhD, is an
adjunct professor at the Techno-
logical University of Panama. He
received his BS and MS from the
Technological University of
Panama and his PhD at the
University of Texas at Austin.
Dean J. Deschenes is the labora-
tory manager at Simpson
Gumpertz and Heger’s Boston,
Mass., office. He rece ved his BS
from Lehigh University and MS
from the University of Texas at
Austin.
Oguzhan Bayrak, PhD, PE, is a
professor in the Department of
Civil, Environmental, and Archi-
tectural Engineering and holds the
Charles Elmer Rowe Fellowship
in Engineering at the University of
Texas at Austin.
Abstract
The estimation of prestress loss is required for design
and analysis of prestressed concrete bridges and build-
ings. A proper balance must be struck between accuracy,
precision, and conservatism for prestress loss estima-
tion in order to safely and efficiently design prestresse
concrete members. An extensive research project was
undertaken in which 30 full-scale bridge girders with a
variety of applicable design parameters were instrument-
ed, constructed, monitored, and tested; a comprehensive
experimental database containing data from 140 full-scale
bridge girders was assembled; and an extensive analytical
program was conducted to investigate the sensitivity of
current estimation methods and implications of loss esti-
mation on final designs.Through the work of this project,
a prestress loss estimation procedure was developed that
is simple to use, precise, and offers an appropriate level of
conservatism. This procedure can be used for both time-
dependent and final prestress loss estimation
Keywords
Bridge, experimental database, full-scale testing,
girder, prestress loss, prestress loss estimation.
Review policy
This paper was reviewed in accordance with the Precast/ Prestressed Concrete Institute’s peer-review process.
Reader comments
Please address reader comments to [email protected] or
Precast/Prestressed Concrete Institute, c/o PCI Journal,
200 W. Adams St., Suite 2100, Chicago, IL 60606. J


![024 024 024 024 024 024 024 024 024 024 024 024 024 024 ... · V 030f-~ 034y. \" _4:3 1 E E 030 3 I "'~-='\»¥_.;. 030-:"'* 7 030 E]uzmPLATE-CHARCOAL FINISH EEIZ PRECAST concnm-mwxmcuancousum](https://static.fdocuments.us/doc/165x107/5f5b5133881fc8234a1a6813/024-024-024-024-024-024-024-024-024-024-024-024-024-024-v-030f-034y-.jpg)