14756 GFB-MJG 2014 Effect of seat cushion on low frequency ... · PDF fileThe experiment...
35
Number of pages: 34 Number of tables: 1 Number of figures: 15 Number of references: 28 Discomfort of seated persons exposed to low frequency lateral and roll oscillation: Effect of seat cushion George F. Beard 1 and Michael J. Griffin Human Factors Research Unit Institute of Sound and Vibration Research University of Southampton United Kingdom 1 Now at: Transport Research Laboratory, Crowthorne, United Kingdom. Correspondence concerning this article should be addressed to: Michael J. Griffin, Human Factors Research Unit, University of Southampton, Highfield, Southampton, SO17 1BJ, United Kingdom. Email: [email protected] Running head: Effect of seat pan stiffness Published as: Discomfort of seated persons exposed to low frequency lateral and roll oscillation: effect of seat cushion Beard, G. F. & Griffin, M. J. Nov 2014 In : Applied Ergonomics. 45, 6, p. 1547-1557.
Transcript of 14756 GFB-MJG 2014 Effect of seat cushion on low frequency ... · PDF fileThe experiment...
Number of pages: 34
Number of tables: 1
Number of figures: 15
Number of references: 28
Discomfort of seated persons exposed to low frequency lateral and roll
oscillation: Effect of seat cushion
George F. Beard1 and Michael J. Griffin
Human Factors Research Unit
Institute of Sound and Vibration Research
University of Southampton
United Kingdom
1 Now at: Transport Research Laboratory, Crowthorne, United Kingdom.
Correspondence concerning this article should be addressed to:
Michael J. Griffin,
Human Factors Research Unit,
University of Southampton,
Highfield,
Southampton, SO17 1BJ,
United Kingdom.
Email: [email protected]
Running head: Effect of seat pan stiffness
Published as: Discomfort of seated persons exposed to low frequency lateral and roll oscillation: effect of seat cushion
Beard, G. F. & Griffin, M. J. Nov 2014 In : Applied Ergonomics. 45, 6, p. 1547-1557.

1
Abstract
The discomfort caused by lateral oscillation, roll oscillation, and fully roll-compensated lateral
oscillation has been investigated at frequencies between 0.25 and 1.0 Hz when sitting on a rigid seat
and when sitting on a compliant cushion, both without a backrest. Judgements of vibration discomfort
and the transmission of lateral and roll oscillation through the seat cushion were obtained with 20
subjects. Relative to the rigid seat, the cushion increased lateral acceleration and roll oscillation at the
lower frequencies and also increased discomfort during lateral oscillation (at frequencies less than
0.63 Hz), roll oscillation (at frequencies less than 0.4 Hz), and fully roll-compensated lateral oscillation
(at frequencies between 0.315 and 0.5 Hz). The root-sums-of-squares of the frequency-weighted
lateral and roll acceleration at the seat surface predicted the greater vibration discomfort when sitting
on the cushion. The frequency-dependence of the predicted discomfort may be improved by adjusting
the frequency weighting for roll acceleration at frequencies between 0.25 and 1.0 Hz.
Published as: Discomfort of seated persons exposed to low frequency lateral and roll oscillation: effect of seat cushion
Beard, G. F. & Griffin, M. J. Nov 2014 In : Applied Ergonomics. 45, 6, p. 1547-1557.
2
Highlights
A compliant cushion increased exposure to lateral and roll oscillation.
The compliant cushion increased discomfort caused by lateral and roll oscillation.
The study reveals frequency-dependence of vibration discomfort from 0.2 to 1 Hz
Published as: Discomfort of seated persons exposed to low frequency lateral and roll oscillation: effect of seat cushion
Beard, G. F. & Griffin, M. J. Nov 2014 In : Applied Ergonomics. 45, 6, p. 1547-1557.

3
1. Introduction
The sensitivity of the human body to different frequencies and directions of vibration, as determined in
laboratory experimental research, has been used to define standardised frequency weightings and
axis multiplying factors for predicting the discomfort caused by the multi-axis and multi-input vibration
of people seated in various forms of transport (e.g., BS 6841, 1987; ISO 2631-1, 1997; Griffin, 2007).
The standards suggest how vibration discomfort can be predicted from the acceleration measured at
the seat-body interfaces (i.e., between the buttocks and the seat pan, between the back and a
backrest, and between the feet and a footrest) for frequencies of vibration in the range 0.5 to 80 Hz.
Discomfort can also be caused by lateral and roll oscillations at frequencies lower than 0.5 Hz. Such
motions occur in many forms of transport including road vehicles (Griffin and Newman, 2004), trains
(Donohew and Griffin, 2007), and sea vessels (Lawther and Griffin, 1988). The paucity of facilities to
simulate such motions has impeded systematic research into how the discomfort caused by low
frequency motions depends on the characteristics of the motion (e.g., the frequency of motion, the
direction of motion, and combined lateral and roll motion). The absence of research has inhibited the
development of standardised methods of quantifying low frequency motions in transport and
predicting the discomfort caused by such motions. The scarcity of simulation facilities has also
impeded research into how the discomfort caused by low frequency motions depends on the
characteristics of seating.
The optimisation of the design of a seat should include consideration of many factors, including the
shape, the width, and the height of the seat pan and the backrest, and the seat cushioning, all of
which have the potential to influence both the static discomfort of the seat occupants and their
vibration discomfort. For example, increasing the height of a backrest from the level of the seat pan
(i.e., 0 mm, no backrest) to neck height (i.e., 700 mm), reduced the relative displacement between the
head and the seat during low frequency (0.5 to 3.15 Hz) lateral oscillation (Brett and Griffin, 1991),
showing that the backrest provided greater lateral support with increasing backrest height. During
either lateral oscillation or roll oscillation, support from a backrest might be beneficial (by assisting
postural stability) or detrimental (by increasing the transmission of motion to the upper body) (Paddan
and Griffin, 1988; 1994). With lateral oscillation at frequencies between 0.2 and 1.0 Hz, discomfort
was greater without a backrest than with a full-height backrest for both a rigid seat and a cushioned
seat (Beard and Griffin, 2012a). However, with lateral oscillation and roll oscillation at frequencies
between 0.5 and 1.6 Hz, discomfort was greater with a full-height backrest and a four-point harness
than when sitting with no backrest (Wyllie and Griffin, 2007).
Seats with firm cushions may be regarded as "sporty", especially those with high side lumbar support,
whereas seats with softer cushions may be viewed as more "luxurious" (Kamp, 2012). Soft cushions
tend to reduce the maximum pressure at the seat-buttock interface (Sprigle et al., 1990), which may
improve static comfort (e.g., Ebe and Griffin, 2000). The configuration of the seat pan may also affect
the ability of seated occupants to maintain postural stability during exposure to low frequency
oscillation. For example, the compliance of a soft cushion might be expected to impair lateral stability
Published as: Discomfort of seated persons exposed to low frequency lateral and roll oscillation: effect of seat cushion
Beard, G. F. & Griffin, M. J. Nov 2014 In : Applied Ergonomics. 45, 6, p. 1547-1557.

4
and increase dynamic discomfort. Understanding the trade-offs between the discomfort associated
with static and dynamic seat characteristics is therefore necessary to optimise the overall discomfort
of seated passengers (Ebe and Griffin, 2000), but there has been little systematic investigation with
non-vertical vibration.
The experiment reported here was designed to understand any differences in vibration discomfort
between sitting on a rigid seat and sitting on a foam cushion when exposed to lateral oscillation, roll
oscillation, and fully roll-compensated lateral oscillation at frequencies between 0.25 and 1.0 Hz. It
was hypothesised that reduced stability when sitting on the cushion would increase vibration
discomfort. If vibration discomfort can be predicted from the acceleration at the interface between the
body and the seat, differences in vibration discomfort between the rigid seat and the cushioned seat
should be explained by the transmission of vibration through the cushion.
2. Method
2.1. Apparatus
Motions were produced by a six-axis motion simulator in the Human Factors Research Unit of the
Institute of Sound and Vibration Research at the University of Southampton. The simulator is capable
of ±0.5 m vertical motion, ±0.25 m horizontal motion, and ±20° of rotational motion. Subjects sat on a
seat positioned so that the centre of the seat surface was at the centre of the motion platform
(approximately 2.5 m by 3.0 m) and at the centre-of-rotation.
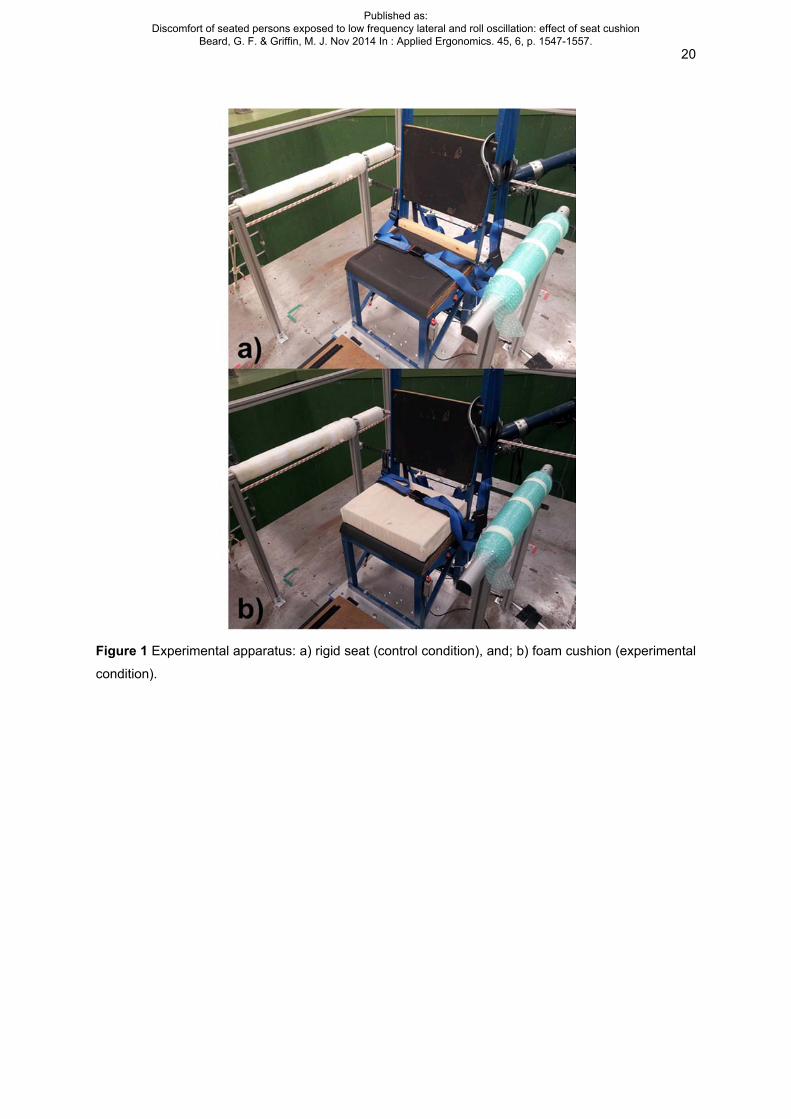
The seat was rigid and consisted of a flat horizontal seat pan (510 mm by 400 mm) located 480 mm
above the motion platform. For the control condition (i.e., a rigid seat), subjects sat on the surface of
the seat pan which was covered with rigid rubber (less than 2-mm thick) to increase surface friction
(Figure 1a). For the experimental condition, subjects sat on the same seat with a block of foam (400
mm by 400 mm by 100 mm, with a density of 62.5 kg/m3, and a stiffness of 7.73 N/mm) secured to the
rubber surface of the seat pan (Figure 1b).
Subjects were provided with an adjustable height footrest to allow the same sitting posture across
both seating conditions (i.e., with their thighs parallel to the floor). Subjects were asked to maintain
comfortable upright postures without contacting the backrest, with their hands on their laps and their
feet flat on the footrest. Subjects wore a loose lap belt for safety.
Subjects wore headphones producing white noise at 65 dB(A) to mask the sounds of the simulator.
The experimenter communicated with subjects through a microphone connected to the headphones
by interrupting the white noise.
FIGURE 1 ABOUT HERE
Lateral acceleration and rotational velocity were measured on the rigid seat (using a Silicon Designs
2260 capacitive translational accelerometer and a BAE Systems 299641-0100 Single-Axis VSG
Bipolar rotational gyro), and at the seat-body interface between the foam cushion and the ischial
tuberosities using a SIT-BAR (Seat Interface for Transducers indicating Body Acceleration Received;
Published as: Discomfort of seated persons exposed to low frequency lateral and roll oscillation: effect of seat cushion
Beard, G. F. & Griffin, M. J. Nov 2014 In : Applied Ergonomics. 45, 6, p. 1547-1557.
5
Whitham and Griffin, 1977) with a translational piezo-resistive accelerometer (Endevco 2265) and a
rotational gyro (BAE Systems 299641-0100 Single-Axis VSG Bipolar).
2.2. Design
The study investigated the vibration discomfort of seated subjects using a repeated measures (i.e.,
within-subjects) design. Subjects were exposed to a series of motion stimuli while seated in one of
two seating conditions (the rigid seat or the foam cushioned seat) in each of two experimental
sessions (conducted on separate days). Each session consisted of four parts.
In part 1 (‘equivalent comfort contours’) subjects used the method of magnitude estimation to rate the
discomfort produced by lateral, roll, and fully roll-compensated lateral motion at seven frequencies of
oscillation from 0.25 to 1.0 Hz (at magnitudes between 0.08 and 0.4 ms-2 r.m.s.), on either the rigid
seat or the foam cushion. Subjects rated their discomfort caused by each of the motions by assigning
appropriate numerical values. They were told their ratings must be proportional to the discomfort
experienced as a result of each stimulus. For example, if they felt one motion caused twice as much
discomfort as another, then their ratings should reflect this (e.g., the two motions may be rated using
values of 100 and 200).
In part 2 (body map) subjects used a labelled diagram of the body (Figure 2) to indicate where they
felt discomfort during exposure to lateral oscillation, roll oscillation, and fully roll-compensated lateral
oscillation at a single magnitude (0.2 ms-2 r.m.s.) of each frequency. Subjects were free to choose as
many locations as they felt appropriate.
In part 3 (relative discomfort) subjects used magnitude estimation to rate the discomfort caused by
0.5-Hz lateral oscillations between 0.08 and 0.4 ms-2 r.m.s. when sitting on both the rigid seat and the
foam cushion. In part 4 (objective test) subjects were exposed to three magnitudes of lateral
oscillation, roll oscillation, and fully roll-compensated lateral oscillation at the seven frequencies from
0.25 to 1.0 Hz whilst sitting on the foam cushion with the SIT-BAR.
The order of presentation of motion stimuli within each part of the experiment was fully randomised for
each subject. The order of the two seating conditions was alternated for each subject such that half
the subjects sat on the rigid seat (the control condition) first and half sat on the foam cushion (the
experimental condition) first.
FIGURE 2 ABOUT HERE
2.3. Motion stimuli
The motion stimuli consisted of seven frequencies at the preferred one-third octave centre
frequencies from 0.25 to 1.0 Hz. Each frequency was presented at, nominally, eight magnitudes in
logarithmic series from 0.08 to 0.40 ms-2 r.m.s.
For lateral oscillation, simulator limitations resulted in only five magnitudes (0.08 to 0.20 ms-2 r.m.s.) at
0.25 Hz and seven magnitudes (0.08 to 0.315 ms-2 r.m.s.) at 0.315 Hz.
Published as: Discomfort of seated persons exposed to low frequency lateral and roll oscillation: effect of seat cushion
Beard, G. F. & Griffin, M. J. Nov 2014 In : Applied Ergonomics. 45, 6, p. 1547-1557.

6
For roll oscillations, the magnitudes were defined by the acceleration in the plane of the seat (i.e., the
acceleration due to tilt through the gravitational vector). Due to simulator limitations, only seven
magnitudes of roll oscillation (equivalent to 0.08 to 0.315 ms-2 r.m.s.) were presented at 1.0 Hz.
For roll-compensated lateral oscillation, the lateral oscillation and the roll oscillation were combined in
phase such that the resultant acceleration in the plane of the seat was zero. The magnitude of the
uncompensated lateral acceleration is used to define the magnitudes of roll-compensated lateral
oscillation. Due to simulator limitations, only seven magnitudes of roll-compensated oscillation were
presented at 0.8 Hz (0.08 to 0.315 ms-2 r.m.s.) and six magnitudes (0.08 to 0.25 ms-2 r.m.s.) at 1.0 Hz.
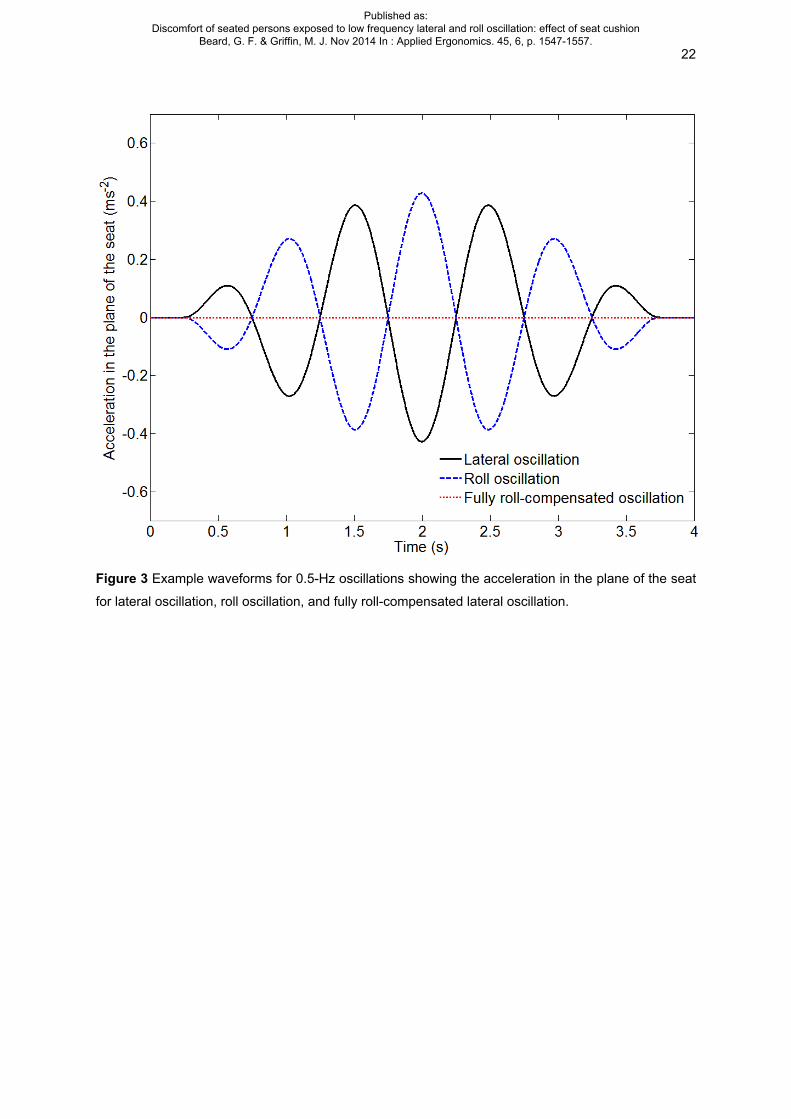
Figure 3 shows the acceleration waveform in the plane of the seat for lateral oscillation, roll oscillation,
and roll-compensated lateral oscillation at 0.5 Hz. All motion stimuli were transient waveforms with a
3.5 cycle duration (as shown in Figure 3) generated from the product of a sine wave of the desired
frequency and a half-sine of the same duration. The motions were generated within MATLAB (version
R2010a research) using the HVLab toolbox (version 1.0).
FIGURE 3 ABOUT HERE
2.4. Subjects
Twenty healthy male volunteers aged between 18 and 32 years participated in the experiment
(median age 26.0 years, inter-quartile range, IQR, 5.8 years; median weight 79.0 kg, IQR 17.6 kg;
median stature 1.79 m, IQR 0.10 m). Subjects were recruited from the staff and student population of
the University of Southampton.
2.5. Analysis
The physical magnitudes of the motion stimuli, φ, were related to normalised subjective magnitude
estimates, ψ, using Stevens’ power law (Stevens, 1975):
Eq. 1: ψ = k φ n
The exponent, n, (i.e., the rate of growth of discomfort) and the constant, k, were determined by
performing linear regression on the logarithmic transformation of Equation 1:
Eq. 2: log10 ψ = log10 k + n log10 φ
Lateral oscillation of the rigid seat at 0.5 Hz and 0.2 ms-2 r.m.s. was selected as a ‘common reference’
for constructing equivalent comfort contours. A ‘normalisation’ factor was determined in order to
normalise the data for all subjects such that the reference condition was assigned a value of 100.
Normalisation factors were calculated using Equation 3:
Eq. 3: Normalisation factor = (100 / ψReference )
where ψReference is the subjective magnitude corresponding to the reference condition, obtained
through linear regression of Equation 2. Normalisation factors were determined for each subject.
Values for n and k were determined for each individual subject for each frequency and direction of
oscillation using data from part 1 (equivalent comfort contours). Equivalent comfort contours for
Published as: Discomfort of seated persons exposed to low frequency lateral and roll oscillation: effect of seat cushion
Beard, G. F. & Griffin, M. J. Nov 2014 In : Applied Ergonomics. 45, 6, p. 1547-1557.
7
subjective magnitudes, Ψ, of 50, 63, 80, 100, 125, 160, and 200 were calculated for each subject and
direction using Equation 1.
The data from part 2 (body map) were used to assess the effect of seating and the frequency of
lateral oscillation, roll oscillation and fully roll-compensated lateral oscillation on the location of
discomfort.
The data from part 3 (relative discomfort) were used to calculate a ‘seat-pan factor’ to adjust the
equivalent comfort contours for the foam cushion (obtained in part 1) so that discomfort relative to the
rigid seat could be examined. The seat-pan factor was calculated using Equation 3:
Eq. 3: Seat-pan factor = (φRelative) / (φFoam)
where φFoam is the acceleration magnitude of a 0.5-Hz lateral test motion on the foam cushion in part 1
(equivalent comfort contours) that was given a subjective magnitude of 100, and φRelative is the
acceleration magnitude of a 0.5-Hz lateral test motion on the foam cushion in part 3 (relative
discomfort) that was given a subjective magnitude of 100. The acceleration magnitudes used to
define φFoam and φRelative were median values calculated from the 20 subjects. Relative equivalent
comfort contours for the rigid seat and the foam cushion were generated by applying the seat-pan
factors to the median equivalent comfort contours for the foam cushion calculated from part 1.
Individual equivalent comfort contours from part 1 were also adjusted using the same seat-pan factors
in order to allow for statistical comparisons across seating conditions.
The Friedman test was used to investigate the overall effect of frequency, direction, and seat pan
stiffness on the rates of growth of discomfort and the equivalent comfort contours. The Wilcoxon
matched-pairs signed ranks test was used to examine specific differences in rates of growth of
discomfort and equivalent comfort contours between seating conditions, frequencies, and directions.
The McNemar dichotomous test was used to test for significant trends in the body map data. Median
rates of growth of discomfort and median equivalent comfort contours were used to identify overall
trends in the data. The Bonferroni correction was used where there were multiple comparisons.
2.6. Objective measurements
The ‘lateral transmissibility’ (Ty) of the foam was calculated with three magnitudes of lateral oscillation,
roll oscillation, and fully roll-compensated lateral oscillation at each of the seven preferred one-third
octave centre frequencies from 0.25 to 1.0 Hz. The transmissibility was calculated by dividing the
lateral acceleration at the seat-body interface of the foam cushion (ay-foam) by the acceleration on the
rigid seat surface (ay-rigid):
Eq. 4: Ty = ay-foam / ay-rigid
If there was roll motion on either the foam cushion or on the rigid seat, the lateral acceleration
included the influence of gravity.
Published as: Discomfort of seated persons exposed to low frequency lateral and roll oscillation: effect of seat cushion
Beard, G. F. & Griffin, M. J. Nov 2014 In : Applied Ergonomics. 45, 6, p. 1547-1557.

8
For roll oscillation and fully roll-compensated lateral oscillation, the roll transmissibility (Troll) of the
foam cushion was calculated by dividing the rotational velocity at the seat-body interface with the
foam cushion (vroll-foam) by the rotational velocity on the rigid seat surface (vroll-rigid):
Eq. 5: Troll = vroll-foam / vroll-rigid
3. Results
3.1. Effect of seating on rate of growth of discomfort
Median rates of growth of discomfort for the three directions of oscillation (lateral, roll, and fully roll-
compensated lateral oscillation) on the two types of seat (rigid and foam) are shown as a function of
frequency in Figure 4. The seat pan type did not have a significant effect on the rate of growth of
discomfort for any direction or frequency of oscillation (p > 0.05; Wilcoxon), except for 0.63-Hz lateral
oscillation where the rate of growth of discomfort was greater on the rigid seat than the foam cushion
(p = 0.005; Wilcoxon).
FIGURE 4 ABOUT HERE
3.2. Effect of frequency and direction of oscillation on rate of growth of discomfort
Rates of growth discomfort varied with the frequency of oscillation for all directions (lateral, roll, and
fully roll-compensated lateral) of oscillation on both the rigid seat and the foam cushion (p < 0.001;
Friedman; see Figure 4). On both seats, rates of growth of discomfort were negatively correlated with
frequency for lateral oscillation (rigid seat: R = -0.287, p = 0.001, foam cushion: R = -0.276, p =0.001;
Spearman), roll oscillation (rigid seat: R = -0.354, p < 0.001, foam cushion: R = -0.361, p < 0.001;
Spearman) and fully roll-compensated lateral oscillation (rigid seat: R = -0.284, p = 0.001, foam
cushion: R = -0.304, p < 0.001; Spearman).
On the rigid seat, there was no significant effect of the direction of oscillation on the rates of growth of
discomfort at any frequency (p > 0.05; Friedman) except for 0.63 Hz (p = 0.019; Friedman) and 1.0 Hz
(p = 0.032; Friedman). However, further analysis with the Bonferroni correction revealed no specific
significant differences in the rates of growth of discomfort at these frequencies (p > 0.167; Wilcoxon).
On the foam cushion, there was no significant effect of the direction of oscillation on the rates of
growth of discomfort at any frequency (p > 0.05; Friedman).
3.3. Effect of seating on discomfort
The median equivalent comfort contours representing discomfort equivalent to that produced by 0.5-
Hz lateral oscillation at 0.2 ms-2 r.m.s. on a rigid seat without backrest (i.e., a subjective magnitude of
100) are shown in Figure 5. The corresponding median (and inter-quartile range, IQR) values are also
shown in Table 1. Equivalent comfort contours are expressed in terms of the lateral acceleration in
the plane of the seat, both with lateral oscillation (i.e., acceleration due to lateral displacement) and
with roll oscillation (i.e., acceleration due to roll displacement through the gravitational vector). For
roll-compensated lateral oscillation, the resultant acceleration in the plane of the seat was zero, but
the lateral component of the motion was used to enable the contours for all three directions to be
Published as: Discomfort of seated persons exposed to low frequency lateral and roll oscillation: effect of seat cushion
Beard, G. F. & Griffin, M. J. Nov 2014 In : Applied Ergonomics. 45, 6, p. 1547-1557.

9
compared (Section 2.3). With lateral oscillation, there was a significant effect of the foam on the
acceleration required to produce a subjective magnitude of 100 at 0.25, 0.315, 0.4 and 0.5 Hz (p <
0.01; Wilcoxon). Similarly, there was a significant effect of foam at 0.25 and 0.315 Hz for roll
oscillation (p < 0.015; Wilcoxon), and at 0.315, 0.4 and 0.5 Hz for fully roll-compensated lateral
oscillation (p < 0.019; Wilcoxon). With all three directions of oscillation, there was greater sensitivity to
acceleration with the foam cushion than with the rigid seat (at the frequencies specified above).
FIGURE 5 ABOUT HERE
3.4. Effect of frequency and direction of oscillation on discomfort
The level of the equivalent comfort contours corresponding to a subjective magnitude of 100 varied
with the frequency of oscillation for all three directions of oscillation on the rigid seat (p < 0.001;
Friedman), and for roll oscillation and fully roll-compensated lateral oscillation on the foam cushion (p
< 0.001; Friedman). The frequency of oscillation did not have a significant effect on the equivalent
comfort contour for lateral oscillation with the foam cushion (p = 0.211; Friedman). With the rigid seat,
the acceleration equivalent comfort contours were approximately constant between 0.25 and 0.4 Hz
and then declined between 0.4 and 1.0 Hz, by approximately 3 dB and 6 dB per octave for lateral
oscillation and roll oscillation, respectively. With fully roll-compensated oscillation of the rigid seat, the
acceleration contours were approximately constant between 0.25 and 0.5 Hz and declined by
approximately 8 dB per octave between 0.5 and 1.0 Hz. With the foam cushion, the acceleration
equivalent comfort contours were approximately constant between 0.25 and 0.5 Hz and declined
between 0.5 and 1.0 Hz by approximately 6 dB and 7 dB per octave for roll oscillation and fully roll-
compensated lateral oscillation, respectively.
The effects of the direction of oscillation on median equivalent comfort contours representing
discomfort equivalent to that produced by 0.5-Hz lateral oscillation at 0.2 ms-2 r.m.s. on a rigid seat
without backrest (i.e., a subjective magnitude of 100) are shown in Figure 6. The level of the
equivalent comfort contours was dependent on the direction of oscillation across all frequencies with
both the rigid seat and the foam cushion (p < 0.01; Friedman).
On the rigid seat, at 0.5 Hz and higher frequencies, the equivalent comfort contours were at greater
magnitudes with lateral oscillation than with roll oscillation (i.e., a greater magnitude of oscillation was
needed to produce the same discomfort) (p < 0.001; Wilcoxon). At 0.5 Hz and lower frequencies the
equivalent comfort contours were at lower magnitudes with lateral oscillation than with fully roll-
compensated lateral oscillation (p < 0.001; Wilcoxon). However, at frequencies greater than 0.5 Hz,
the equivalent comfort contours were at greater with lateral oscillation than with fully roll-compensated
lateral oscillation (p < 0.002; Wilcoxon). At all frequencies, the equivalent comfort contours were at
lower magnitudes with roll oscillation than with fully roll-compensated lateral oscillation (p < 0.016;
Wilcoxon).
On the foam cushion, at 0.8 and 1.0 Hz. the equivalent comfort contours were at greater magnitudes
with lateral oscillation than with roll oscillation (p < 0.001; Wilcoxon). At 0.5 Hz and lower frequencies,
the equivalent comfort contours were at lower magnitudes with lateral oscillation than with fully roll-
Published as: Discomfort of seated persons exposed to low frequency lateral and roll oscillation: effect of seat cushion
Beard, G. F. & Griffin, M. J. Nov 2014 In : Applied Ergonomics. 45, 6, p. 1547-1557.

10
compensated lateral oscillation (p < 0.002; Wilcoxon). However, at frequencies greater than 0.63 Hz,
the equivalent comfort contours were at greater magnitudes with lateral oscillation than with fully roll-
compensated lateral oscillation (p < 0.009; Wilcoxon). At 0.63 Hz and lower frequencies, the
equivalent comfort contours were at lower magnitudes with roll oscillation than with fully roll-
compensated lateral oscillation (p < 0.005; Wilcoxon).
FIGURE 6 ABOUT HERE
3.5. Effect of motion magnitude on the frequency-dependence of equivalent comfort
contours
Equivalent comfort contours were calculated for subjective magnitudes from 50 to 200 for the rigid
seat and the foam cushion (Figure 7). Consistent with the dependence of the rate of growth of
discomfort on the frequency of oscillation (as shown in Figure 4), the magnitude of oscillation had a
large influence on the frequency-dependence of the contours for all directions of oscillation with both
the rigid seat and the foam cushion.
FIGURE 7 ABOUT HERE
3.6. The location of discomfort
The location of discomfort during lateral oscillation and during roll oscillation was dependent on the
seating condition, with the greatest differences between the rigid seat and the foam cushion at the
ischial tuberosities (Figure 8) and at the legs (Figure 9). During lateral oscillation, there were fewer
reports of discomfort at the ischial tuberosities (significant at 0.4 Hz, p = 0.004; McNemar), but more
reports of discomfort in the legs (significant at 0.315 Hz, p = 0.021; McNemar) on the foam cushion
than on the rigid seat. During roll oscillation, there was a lower incidence of discomfort at the ischial
tuberosities on the foam cushion than on the rigid seat (significant at 0.4 and 1.0 Hz, p = 0.022 and
0.039, respectively; McNemar).
The direction of oscillation also influenced the location of discomfort. The incidence of discomfort at
the ischial tuberosities was greater with lateral oscillation and with roll oscillation than with fully roll-
compensated lateral oscillation (significant at 0.25 and 0.315 Hz on the foam cushion, p < 0.05, and at
0.315 and 0.4 Hz on the rigid seat, p < 0.01; McNemar). Discomfort at the legs was greater during
lateral oscillation than with fully roll-compensated lateral oscillation (significant at 0.25 Hz on the rigid
seat, p = 0.031, and at frequencies less than 0.5 Hz on the foam cushion, p < 0.05; McNemar), and
greater with roll oscillation than with fully roll-compensated lateral oscillation (significant at 0.25, 0.315
and 0.4 Hz on the foam cushion, p < 0.05; McNemar). The incidence of discomfort localised at the
head, the neck, or the shoulders was greater with roll oscillation than with lateral oscillation
(significant at 0.8 Hz on the foam cushion, p = 0.004; McNemar). The incidence of discomfort at the
lower back was greater with lateral oscillation and with roll oscillation than with fully roll-compensated
lateral oscillation (significant at 0.25 Hz, p < 0.05; McNemar). No other statistically significant
differences in the location of discomfort data were identified.
FIGURE 8 AND 9 ABOUT HERE
Published as: Discomfort of seated persons exposed to low frequency lateral and roll oscillation: effect of seat cushion
Beard, G. F. & Griffin, M. J. Nov 2014 In : Applied Ergonomics. 45, 6, p. 1547-1557.

11
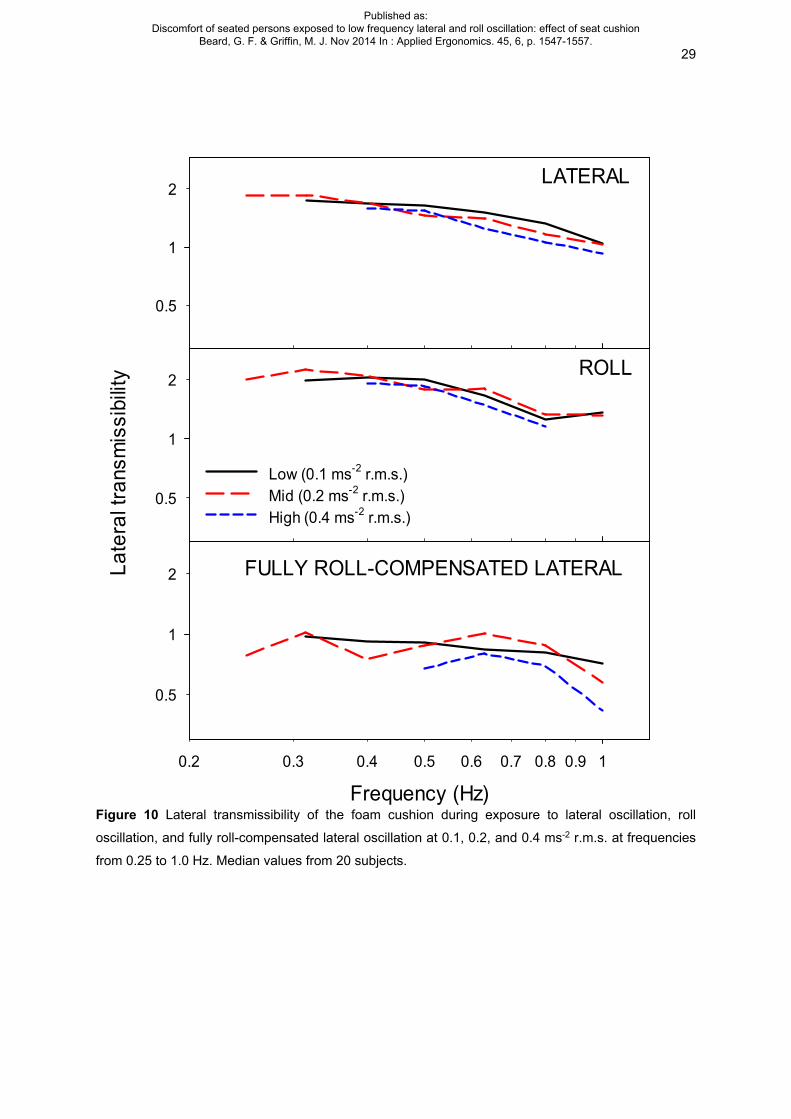
3.7. Lateral transmissibility and roll transmissibility of foam cushion
For all three directions, the lateral transmissibility was dependent on the frequency of oscillation
(Figure 9; p < 0.001; Friedman), decreasing with increasing frequency from 0.25 to 1.0 Hz by
approximately 2 dB per octave.
The direction of oscillation also affected lateral transmissibility at all frequencies (p < 0.001;
Friedman), being greater with roll oscillation than with lateral oscillation at all frequencies greater than
0.25 Hz (p < 0.01; Wilcoxon) and greater with roll oscillation than with fully roll-compensated lateral
oscillation at all frequencies (p < 0.01; Wilcoxon) except 0.5 Hz (p = 0.017; Wilcoxon).
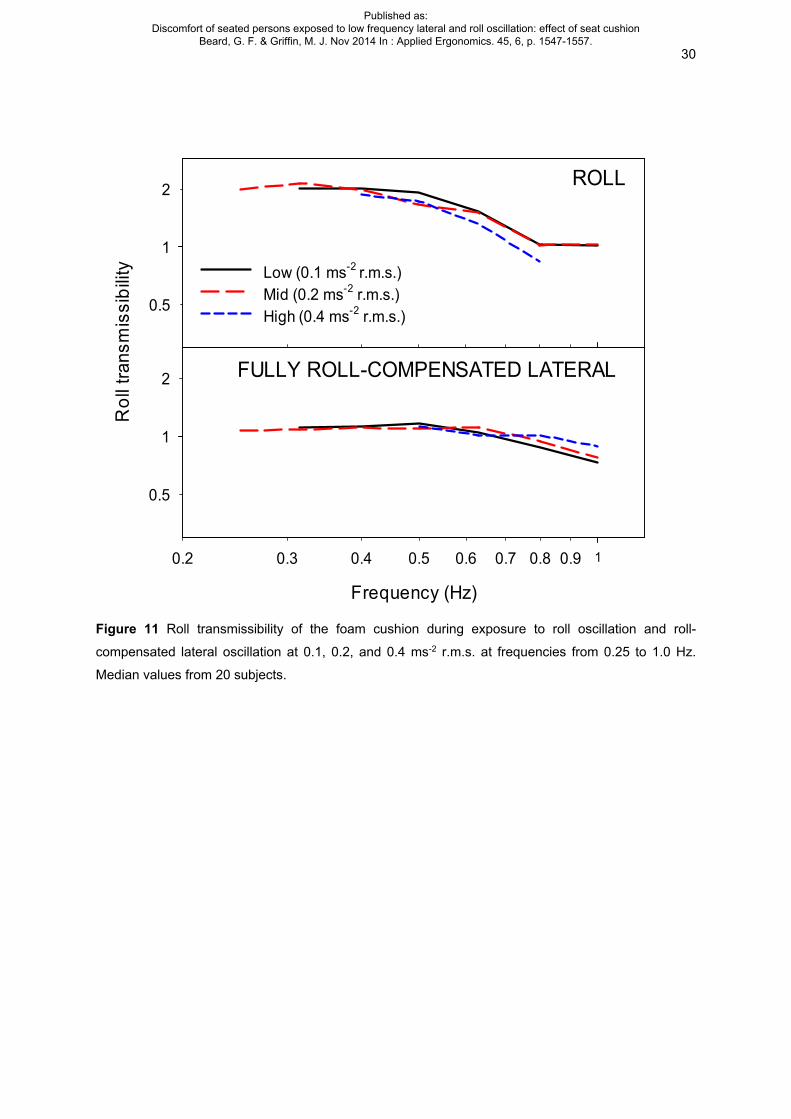
The roll transmissibility of the foam was highly dependent on the frequency of lateral oscillation
(Figure 11; p < 0.001; Friedman), decreasing from 0.25 to 1.0 Hz by approximately 3 dB per octave
with roll oscillation and by approximately 1 dB per octave with fully roll-compensated lateral
oscillation.
Roll transmissibility was greater during roll oscillation than during fully roll-compensated lateral
oscillation (p < 0.01 at all frequencies except at 0.8 Hz where p = 0.189; Wilcoxon).
FIGURE 10 AND 11 ABOUT HERE
3.8. Effect of magnitude of oscillation on lateral and roll transmissibility of foam cushion
The lateral transmissibility of the foam tended to decrease with increasing magnitude of oscillation,
with statistically significant reductions at 0.4, 0.8 and 1.0 Hz with lateral oscillation, at 0.4, 0.63 and
0.8 Hz with roll oscillation, and at 0.315 Hz and from 0.5 to 1.0 Hz with fully roll-compensated lateral
oscillation (p < 0.05; Friedman).
The roll transmissibility of the foam was dependent on the magnitude of roll oscillation at 0.4 and 0.8
Hz and the magnitude of fully roll-compensated lateral oscillation at 0.315 Hz and from 0.5 to 1.0 Hz
(p < 0.05; Friedman). The roll transmissibility tended to decrease with increasing magnitude of roll
oscillation, but increase with increasing magnitude of fully roll-compensated lateral oscillation.
The roll oscillations experienced at the seat-body interface during lateral oscillation and during roll
oscillation are compared for three magnitudes in Figure 12. It may be seen that roll oscillation on the
foam at the seat-body interface was approximately double during roll oscillation than during lateral
oscillation.
FIGURE 12 ABOUT HERE
4. Discussion
4.1. Implications of variations in the rate of growth of discomfort
The rate of growth of discomfort (i.e., the exponent in Stevens’ power law) describes the relation
between changes in the magnitude of the oscillation and changes in the magnitude of discomfort
(Stevens, 1975). In a previous study using a rigid seat with backrest, the median rates of growth of
discomfort varied over the range 0.54 to 1.23 with lateral oscillation, 0.48 to 1.38 with roll oscillation,
Published as: Discomfort of seated persons exposed to low frequency lateral and roll oscillation: effect of seat cushion
Beard, G. F. & Griffin, M. J. Nov 2014 In : Applied Ergonomics. 45, 6, p. 1547-1557.
12
and 0.39 to 1.07 with fully roll-compensated oscillation at frequencies between 0.25 and 1.0 Hz, with
greater rates of growth at lower frequencies (Beard and Griffin, 2012b). With the same motions,
similar rates of growth of discomfort were found in the current study with a rigid seat and a foam
cushion, both without backrest. During lateral oscillation and roll oscillation of a rigid seat without
backrest, and with both a backrest and a four-point harness, the rate of growth of discomfort was
independent of seating condition, but also decreased with increasing frequency of oscillation (Wyllie
and Griffin, 2007). The current and previous findings suggest the rate of growth is independent of
seating characteristics, but highly dependent on the frequency of oscillation. The large decrease in
the rate of growth of discomfort with increasing frequency means the shapes of low frequency
equivalent comfort contours change with the magnitude of oscillation (Figure 7). This has implications
for the characteristics of a suitable frequency weighting, because a frequency weighting appropriate
for low magnitudes will be inappropriate for high magnitudes (Wyllie and Griffin, 2007).
For a rigid seat with backrest, there were greater rates of growth of discomfort with lateral oscillation
than with roll oscillation at frequencies between 0.63 and 1.0 Hz, and greater rates of growth with roll
oscillation than fully roll-compensated lateral oscillation at 0.25 Hz (Beard and Griffin, 2012b). The
present study without a backrest found no statistically significant effects of the direction of oscillation
on rates of growth of discomfort for either the rigid seat or the foam cushion, but similar trends can be
seen in the median data (Figure 3). Differing rates of growth of discomfort for lateral oscillation and
roll oscillation imply that the relative importance of these axes (as shown in Figure 6) will vary with the
magnitude of the motion. Nevertheless, it seems reasonable to expect that at frequencies between
0.5 and 1.0 Hz, lateral acceleration in the plane of the seat due to roll oscillation will produce greater
discomfort than the same acceleration arising from lateral oscillation with: (i) a rigid seat without
backrest (Wyllie and Griffin, 2007; current study), (ii) a foam cushion without backrest (current study),
(iii) a rigid seat with backrest (Beard and Griffin, 2012b), and (iv) a rigid seat with backrest and four-
point harness (Wyllie and Griffin, 2007). At frequencies greater than about 0.5 Hz, sensitivity to roll
oscillation tends to be much greater than sensitivity to lateral oscillation having the same acceleration
in the plane of the seat (Beard and Griffin, 2012b).
4.2. Equivalent comfort contours
Compared to a flat rigid seat pan, a foam cushion might be expected to reduce the discomfort caused
by low frequency oscillation by distributing the pressure at the principal seat-body interface (i.e., the
ischial tuberosities) so that variations in pressure during oscillation do not reach values as great as
with a rigid seat. Alternatively, a foam cushion might be expected to increase discomfort by amplifying
the motion at the ischial tuberosities and reducing postural stability. During lateral oscillation at
frequencies less than 0.63 Hz, during roll oscillation at frequencies less than 0.4 Hz, and during fully
roll-compensated lateral oscillation at frequencies less than 0.63 Hz, sensitivity to lateral acceleration
in the plane of the seat was greater when sitting on the foam cushion than when sitting on the rigid
seat, consistent with the latter explanation (i.e., the cushion reduced postural stability). Nevertheless,
with lateral oscillation at frequencies less than 0.63 Hz, no statistically significant differences in
discomfort were found between a rigid seat and a cushioned train seat without backrest (Beard and
Published as: Discomfort of seated persons exposed to low frequency lateral and roll oscillation: effect of seat cushion
Beard, G. F. & Griffin, M. J. Nov 2014 In : Applied Ergonomics. 45, 6, p. 1547-1557.

13
Griffin, 2012a). Although softer cushions reduce the peak pressure at the ischial tuberosities and can
improve static comfort (e.g., Ebe and Griffin, 2000), some soft seats will reduce dynamic comfort. The
identification of the properties of seat cushions required to optimise pressure distributions without
detrimental effects on postural stability, and the complementary role of backrests in providing stability,
merits further research so as to assist the optimisation of seats for transport.
For both the rigid seat and the foam cushion, and with all three directions of oscillation, the
acceleration magnitude required to produce equivalent discomfort (i.e., a subjective magnitude of
100) was highly dependent on the frequency of oscillation, except for lateral oscillation on the foam
cushion which was independent of frequency (Figures 4 and 5). For the rigid seat, the equivalent
comfort contours from 0.4 to 1.0 Hz declined at approximately 3 dB, 6 dB, and 8 dB per octave for
lateral oscillation, roll oscillation, and fully roll-compensated lateral oscillation, respectively. For the
foam cushion, the equivalent comfort contours from 0.5 to 1.0 Hz declined at 6 dB and 7 dB per
octave for roll oscillation and fully roll-compensated lateral oscillation, respectively. Previous studies
have reported marginally steeper contours when sitting with a backrest (Beard and Griffin, 2012b) and
when sitting with both a backrest and a four-point harness (Wyllie and Griffin, 2007), consistent with:
(i) a full height backrest increasing sensitivity to lateral and roll oscillation at frequencies between 0.5
and 1.0 Hz relative to ‘no backrest’, and (ii) a four-point harness increasing sensitivity to lateral and
roll oscillation at frequencies between 0.5 and 1.0 Hz relative to sitting with a full height backrest
without a harness.
4.3. The location of discomfort
During static sitting there can be many reasons for discomfort, including inappropriate distributions of
pressure at the seat interfaces (e.g., Gyi and Porter, 1999), sheer forces at the seat interfaces
(Hobson, 1992), and extremes of posture or the need for muscle activity to maintain posture (Hobson,
1992; Vos et al., 2006). These sources of discomfort may also be present during oscillation but are
supplemented by the discomfort caused by motion-induced movements of the body, including
discomfort associated with voluntary and involuntary muscle activity used to control the movement of
the body (e.g. Donati et al., 1984; Robertson and Griffin, 1989; Blüthner et al., 2002; Farah et al.,
2006). The locations of the discomfort reported by subjects can help to identify the causes of motion-
induced discomfort (Whitham and Griffin, 1978).
In the present study, during lateral oscillation and during roll oscillation, there was a greater incidence
of discomfort at the ischial tuberosities on the rigid seat than on the foam cushion (statistically
significant at 0.4 and 1.0 Hz). Greater discomfort at the ischial tuberosities has also been found on a
rigid seat without backrest than on a cushioned train seat during 1-Hz lateral oscillation (Beard and
Griffin, 2012a). Pressure at the ischial tuberosities may be reduced by leaning back on a backrest
(e.g., Vos et al, 2006; Kyung and Nussbaum, 2008). During lateral and roll oscillation, each ischial
tuberosity is subjected to alternating downward forces. This is consistent with the lower incidence of
discomfort at the ischial tuberosities during fully roll-compensated lateral oscillation, where forces are
balanced at the seat surface (Beard and Griffin, 2012b; current study). Relative to sitting on the rigid
Published as: Discomfort of seated persons exposed to low frequency lateral and roll oscillation: effect of seat cushion
Beard, G. F. & Griffin, M. J. Nov 2014 In : Applied Ergonomics. 45, 6, p. 1547-1557.
14
seat, the soft foam cushion used in the current study will also have reduced the pressure at the ischial
tuberosities and thereby reduced discomfort in this region.
During lateral oscillation there was a greater incidence of discomfort in the legs (i.e., upper thighs,
lower thighs and lower legs – see Figure 2) on the foam cushion than on the rigid seat (statistically
significant at 0.315 Hz). This is consistent with the lateral and roll transmissibility of the cushion being
greater than unity (Figure 10), requiring subjects to exert greater muscular effort to maintain postural
stability on the foam cushion than on the rigid seat. The exertion of the leg muscles (e.g., the
quadriceps and hamstrings in the thighs, and/or the gastrocnemius and soleus muscles in the calves)
when seated on the foam cushion may account for the increased incidence of discomfort in this
region. This is also consistent with the reduced incidence of discomfort in the legs during fully roll-
compensated lateral oscillation.
When seated on a rigid seat with backrest (Beard and Griffin, 2012b) or a rigid seat with backrest and
harness (Wyllie and Griffin, 2007), greater incidence of discomfort has been reported at the head,
neck and shoulders than at other locations of the body during 1-Hz roll oscillation. In the current
study, there was greater discomfort at the head, neck, or shoulders during roll oscillation than during
lateral oscillation when seated on the foam cushion (significant at 0.8 Hz), but not when seated on the
rigid seat. The transmission of lateral acceleration to the upper body increases with increasing height
of a backrest (Brett and Griffin, 1991), but on a compliant seat without backrest, the displacement of
the head relative to the seat surface will depend on the capability of the seated occupant to maintain a
stable upright posture. Poor stability on the foam cushion may have led to an amplification of the
motion (indicated by a lateral and roll transmissibility greater than unity during 0.8-Hz roll oscillation –
Figure 10 and 11), and a subsequent increase in discomfort in the upper body.
4.4. Implications for vibration standards
British Standard 6841 (1987) and International Standard 2631-1 (1997) suggest asymptotic frequency
weighting Wd for lateral acceleration and frequency weighting We (with a multiplying factor of 0.63) for
roll acceleration. Although both weightings are intended for predicting discomfort caused by vibration
at frequencies in the range 0.5 to 80 Hz, realisable weightings are achieved with a high-pass filter (at
0.4 Hz) and a low-pass filter (at 100 Hz) and might therefore be applied to evaluate motions
containing energy outside this frequency range.
The standards suggest discomfort can be predicted from frequency-weighted measurements of
translational and rotational acceleration at the seat-body interfaces (i.e., at the floor beneath the feet,
between the seat-pan and the ischial tuberosities, and between the back and a backrest). Weighting
each component appropriately and calculating the root-sums-of-squares (i.e., r.s.s.) over all
components is assumed to allow for the effects of different frequencies, different directions, and
different input locations on vibration discomfort. Vibration is measured at the seat-body interfaces, so
differences in the transmission of vibration though different seats will be reflected in the predicted
vibration discomfort with different seats.
Published as: Discomfort of seated persons exposed to low frequency lateral and roll oscillation: effect of seat cushion
Beard, G. F. & Griffin, M. J. Nov 2014 In : Applied Ergonomics. 45, 6, p. 1547-1557.
15
With lateral and roll oscillation of a seat without backrest, five components may contribute to
discomfort: (i) lateral acceleration in the plane of the seat (ms-2), (ii) lateral acceleration in the plane of
the seat due to roll (i.e., g.sinθ, ms-2), (iii) roll acceleration at the seat surface (rads-2), (iv) lateral
acceleration at the feet (ms-2), and (v) lateral acceleration at the feet due to roll (i.e., g.sinθ, ms-2). The
frequency-weighted acceleration caused by low frequency oscillation at the feet has been shown to
be relatively small (Wyllie and Griffin, 2007; Beard and Griffin, 2012b) so the current analysis focuses
on lateral and roll acceleration at the seat surface. If the standardised methods are correct, the root-
sums-of-squares of the lateral and roll acceleration measured at the seat-body interface should yield
similar conclusions to the equivalent comfort contours in Figure 5. The root-sums-of-squares of the
frequency-weighted lateral and roll accelerations measured at the seat-buttock interface on the rigid
seat and the foam cushion during exposure to lateral oscillation, roll oscillation, and fully roll-
compensated lateral oscillation at 0.2 ms-2 r.m.s. are shown in Figure 13. The frequency weightings
used were the asymptotic forms of frequency weightings Wd and We extrapolated horizontally to
frequencies less than 0.5 Hz (i.e., the gains were the same for 0.5 Hz and all lower frequencies). The
standardised methods predict greater vibration discomfort on the foam cushion than on the rigid seat
with lateral oscillation at all frequencies, with roll oscillation at frequencies less than 0.8 Hz, and with
fully roll-compensated lateral oscillation at frequencies between 0.25 and 0.8 Hz. This is broadly
consistent with the equivalent comfort contours shown in Figure 5. However, the frequency-
dependence of the r.s.s. predictions (Figure 13) is not consistent with the frequency-dependence of
the equivalent comfort contours (Figure 5), and the predicted magnitude of the differences in
discomfort between the seats shown in Figure 13 is greater than implied by the equivalent comfort
contours in Figure 5. This suggests the extrapolated asymptotic frequency weightings with the
multiplying factors defined in the standards may not be wholly appropriate for predicting the
discomfort caused by lateral oscillation and roll oscillation at all frequencies in the range 0.2 to 1.0 Hz.
FIGURE 13 ABOUT HERE
When extrapolated to frequencies less than 0.5 Hz, the asymptotic forms of the frequency weightings
Wd and We (BS 6841, 1987) are unity at all frequencies between 0.25 and 1.0 Hz. Therefore, in Figure
13, the total vibration values predict no effect of the frequency of oscillation on the discomfort caused
by lateral oscillation at 0.2 ms-2 r.m.s. on a rigid seat, because the acceleration is constant across all
frequencies. A more accurate reflection of the effects of the frequency of lateral oscillation may be
obtained using the realisable form of the Wd weighting (i.e., with high-pass and low-pass filters at 0.4
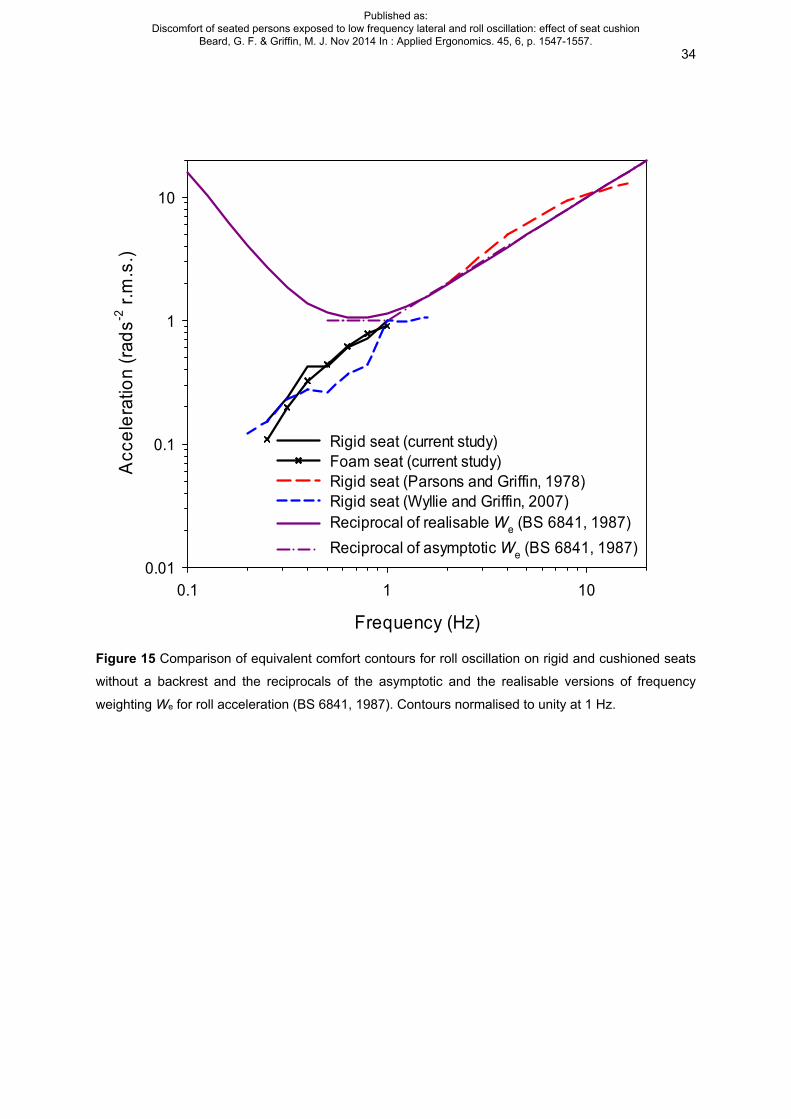
and 100 Hz, respectively; BS 6841, 1987), as demonstrated in Figure 14. However, it is clear that
neither the extrapolated asymptotic weighting nor the band-pass filtered realisable weighting We offers
an accurate prediction of the discomfort caused by roll acceleration at frequencies less than about 1
Hz (see Figure 15). Predictions of discomfort may be improved by adjusting the frequency weighting
for roll acceleration at frequencies between 0.25 and 1.0 Hz.
FIGURE 14 AND 15 ABOUT HERE
Published as: Discomfort of seated persons exposed to low frequency lateral and roll oscillation: effect of seat cushion
Beard, G. F. & Griffin, M. J. Nov 2014 In : Applied Ergonomics. 45, 6, p. 1547-1557.
16
5. Conclusion
A cushion can increase the transmission of low frequency lateral and roll oscillation to the body and
result in greater vibration discomfort than experienced when sitting on a rigid seat without the cushion.
In this study with oscillations in the frequency range 0.2 to 1.0 Hz, there was greater discomfort in the
legs and the lower back when sitting on a foam cushion, suggesting greater muscular exertion was
required to maintain postural stability. When sitting on a rigid seat, discomfort was mainly located at
the ischial tuberosities.
On both a rigid seat and on a cushioned seat, the frequency-weighted acceleration at the seat-body
interface can give useful predictions of the discomfort caused by lateral oscillation, roll oscillation, and
fully roll-compensated lateral oscillation in the frequency range 0.25 to 1.0 Hz. However, the
predictions could be improved at low frequencies by adjusting the standardised frequency weighting
for roll, which becomes increasingly inappropriate for predicting discomfort as the frequency of
oscillation reduces below about 1 Hz. Predictions of the discomfort caused by fully roll-compensated
lateral acceleration are highly dependent on the discomfort caused by the roll oscillation, so current
standards do not provide the best possible predictions of the effects of these motions on passenger
comfort.
References
Beard, G.F., Griffin, M.J. 2012a. Discomfort during lateral acceleration: Influence of seat cushion and
backrest. Applied Ergonomics. 44 (4), 588–594.
Beard, G.F., Griffin, M.J. 2012b. Discomfort caused by low frequency lateral oscillation, roll oscillation,
and fully roll-compensated lateral oscillation. Ergonomics. 56 (1), 103-114.
Brett, M.W., Griffin, M.J. 1991. Effect of height of backrest support on head motion during exposure
to low frequency lateral vibration. In, Proceedings of the Ergonomics Society’s 1991 Annual
Conference, Southampton, England, 16-19 April 1991.
British Standards Institution, 1987. Measurement and evaluation of human exposure to whole-body
mechanical vibration and repeated shock. BS 6841. British Standards Institution, London
Donati, P., Boldero, A.G., Whyte, R.T., Stayner, R.M. 1984. The postural support of seats: a study of
driver preferences during simulated tractor operation. Applied Ergonomics, 15, (1), 2-10.
Donohew, B.E., Griffin, M.J. 2007. Low frequency motions and motion sickness on a tilting train.
Proceedings of the Institution of Mechanical Engineers, Part F: Journal of Rail and Rapid Transport,
211, 125-133.
Ebe, K., Griffin, M.J., 2000. Quantitative prediction of overall seat discomfort. Ergonomics. 43 (6),
791-806.
Published as: Discomfort of seated persons exposed to low frequency lateral and roll oscillation: effect of seat cushion
Beard, G. F. & Griffin, M. J. Nov 2014 In : Applied Ergonomics. 45, 6, p. 1547-1557.

17
Farah, G., Petit-Boulanger, C., Hewson, D.J., Duchêne, J. (2006). Surface electromyography as a tool
to assess the responses of car passengers to lateral accelerations. Part II: Objective comparison of
vehicles. Journal of Electromyography and Kinesiology. 16 (6), 677-684.
Griffin, M.J., Newman, M.M., 2004. An experimental study of low-frequency motion in cars.
Proceedings of the Institution of Mechanical Engineers, volume 218, Part D: Journal of Automobile
Engineering 1231-1238.
Gyi, D.E., Porter, J.M. 1999. Interface pressure and the prediction of car seat discomfort. Applied
Ergonomics, 30, (2), 99-107.
Hobson, D.A. 1992. Comparative effects of posture on pressure and shear at the body-seat interface.
Journal of Rehabilitation Research and Development, 29, (4), 21-31.
International Organization for Standardization. 1997. Mechanical vibration and shock - evaluation of
human exposure to whole-body vibration - Part 1: General requirements. International Standard, ISO
2631-1.
Kamp, I. 2012. The influence of car-seat design on its character experience. Applied Ergonomics, 43,
329-335.
Kyung, G., Nussbaum, M.A. 2008. Driver sitting comfort and discomfort (part II): Relationships with
and prediction from interface pressure. International Journal of Industrial Ergonomics, 38, 526-538.
Lawther, A., Griffin, M.J. 1988. Motion sickness and motion characteristics of vessels at sea.
Ergonomics, 31, (10), 1373-1394.
Morioka, M., Griffin, M.J. 2006. Magnitude-dependence of equivalent comfort contours for fore-and-
aft, lateral and vertical whole-body vibration. Journal of Sound and Vibration, 298, 755-772.
Moxley, P.R., Morioka, M., Griffin, M.J., 2010. Discomfort during lateral whole-body vibration:
influence of seat pan form. Presented at the 46th United Kingdom Conference on Human Response
to Vibration, held at the Health and Safety Laboratory and the Health and Safety Executive, Buxton.
20 - 22 September 2011.
Paddan, G.S., Griffin, M.J. 1988. The transmission of translational seat vibration to the head – II.
Horizontal seat vibration. Journal of Biomechanics, 21 (3), 199-206.
Paddan, G.S., Griffin, M.J. 1994. Transmission of roll and pitch seat vibration to the head.
Ergonomics, 37, 1513-1531.
Parsons, K.C., Griffin, M.J. 1978. The effect of the position of the axis of rotation on the discomfort
caused by whole-body roll and pitch vibrations of seated persons. Journal of Sound and Vibration,
58,(1), 127-141.
Robertson, C.D., Griffin, M.J. 1989. Laboratory studies of the electromyographic response to whole-
body vibration. Technical Report No 184, Institute of Sound and Vibration Research, University of
Southampton, Southampton, UK.
Published as: Discomfort of seated persons exposed to low frequency lateral and roll oscillation: effect of seat cushion
Beard, G. F. & Griffin, M. J. Nov 2014 In : Applied Ergonomics. 45, 6, p. 1547-1557.

18
Blüthner, R., Seidel, H., Hinz, B. 2002. Myoelectric response of back muscles to vertical random
whole-body vibration with different magnitudes at different postures. Journal of Sound and Vibration,
253, (1), 37-56.
Sprigle, S., Chung, K.C., Brubaker, C.E. 1990. Reduction of sitting pressure with custom contoured
cushions. Journal of Rehabilitation Research and Development, 27 (2), 135-140.
Stevens, S.S., 1975. Psychophysics: introduction to its perceptual, neural, and social prospects.
Transaction Publishers, Oxford.
Vos, G.A., Congleton, J.J., Moore, J.S., Amendola, A.A., Ringer, L. 2006. Postural versus chair
design impacts upon interface pressure. Applied Ergonomics, 37 (6). 619-628.
Whitham, E.M., Griffin, M.J. 1977. Measuring vibration on soft seats. Society of Automotive
Engineers, SAE Paper 770253, International Automotive Engineering Congress and Exposition,
Detroit, 28 February - 4 March 1977.
Whitham, E.M., Griffin, M.J. 1978. The effects of vibration frequency and direction on the location of
areas of discomfort caused by whole-body vibration. Applied Ergonomics, 9, (4), 231-239.
Wyllie, I.H., Griffin, M.J. 2007. Discomfort from sinusoidal oscillation in the roll and lateral axes at
frequencies between 0.2 and 1.6 Hz. Journal of the Acoustical Society of America, 121, (5), 2644-
2654.
Published as: Discomfort of seated persons exposed to low frequency lateral and roll oscillation: effect of seat cushion
Beard, G. F. & Griffin, M. J. Nov 2014 In : Applied Ergonomics. 45, 6, p. 1547-1557.

19
Table 1. Equivalent comfort contours (with inter-quartile ranges) for each direction of vibration (lateral,
roll, and fully roll-compensated lateral oscillation). The values, expressed as the component of lateral
acceleration in the plane of seat, correspond to discomfort equivalent to that arising with 0.5-Hz lateral
oscillation at 0.2 ms-2 r.m.s. on the rigid seat. Median values from 20 subjects.
Vibration direction
Seating condition
Frequency (Hz)
0.250 0.315 0.400 0.500 0.630 0.800 1.000
Lateral oscillation
Rigid seat 0.175
(0.076) 0.202
(0.051) 0.204
(0.038) 0.200
(0.000) 0.186
(0.063) 0.164
(0.061) 0.142
(0.055)
Foam cushion
0.123 (0.038)
0.142 (0.054)
0.140 (0.047)
0.166 (0.048)
0.154 (0.068)
0.171 (0.097)
0.159 (0.062)
Roll oscillation
Rigid seat 0.193
(0.103) 0.189
(0.101) 0.208
(0.071) 0.135
(0.048) 0.120
(0.067) 0.087
(0.047) 0.079
(0.042)
Foam cushion
0.137 (0.059)
0.157 (0.058)
0.159 (0.061)
0.139 (0.073)
0.122 (0.043)
0.096 (0.047)
0.071 (0.043)
Fully roll-compensated
lateral oscillation
Rigid seat 0.265
(0.170) 0.301
(0.249) 0.302
(0.227) 0.266
(0.175) 0.165
(0.063) 0.139
(0.055) 0.105
(0.026)
Foam cushion
0.236 (0.157)
0.225 (0.120)
0.231 (0.146)
0.213 (0.112)
0.141 (0.067)
0.129 (0.048)
0.094 (0.046)
Published as: Discomfort of seated persons exposed to low frequency lateral and roll oscillation: effect of seat cushion
Beard, G. F. & Griffin, M. J. Nov 2014 In : Applied Ergonomics. 45, 6, p. 1547-1557.
20
Figure 1 Experimental apparatus: a) rigid seat (control condition), and; b) foam cushion (experimental
condition).
Published as: Discomfort of seated persons exposed to low frequency lateral and roll oscillation: effect of seat cushion
Beard, G. F. & Griffin, M. J. Nov 2014 In : Applied Ergonomics. 45, 6, p. 1547-1557.

21
Head (A)
Neck (B)
Upper back (C)
Lower back (D)
Ischial tuberosities (F) Lower thighs (L)
Shoulders (H)
Chest (I)
Stomach (K)
Lower legs (M)
Feet (N)
Vestibular sensation (G)
Upper thighs (E)
Arms (J)
BODY MAP
Figure 2 Body map used by subjects to indicate the location of discomfort caused by lateral oscillation,
roll oscillation, and fully roll-compensated lateral oscillation.
Published as: Discomfort of seated persons exposed to low frequency lateral and roll oscillation: effect of seat cushion
Beard, G. F. & Griffin, M. J. Nov 2014 In : Applied Ergonomics. 45, 6, p. 1547-1557.
22
Figure 3 Example waveforms for 0.5-Hz oscillations showing the acceleration in the plane of the seat
for lateral oscillation, roll oscillation, and fully roll-compensated lateral oscillation.
Published as: Discomfort of seated persons exposed to low frequency lateral and roll oscillation: effect of seat cushion
Beard, G. F. & Griffin, M. J. Nov 2014 In : Applied Ergonomics. 45, 6, p. 1547-1557.

23
Frequency (Hz)
0.2 0.3 0.4 0.5 0.6 0.7 0.8 0.9 10.0
0.5
1.0
1.5
2.0
2.5
Ra
te o
f gro
wth
of d
isco
mfo
rt
0.0
0.5
1.0
1.5
2.0
2.5
LateralRollFully roll-compensated lateral
RIGID SEAT
FOAM SEAT
Figure 4 Rates of growth of discomfort for lateral oscillation, roll oscillation, and fully roll-compensated
lateral oscillation on the rigid seat and the foam cushion. Median values from 20 subjects. Upper and
lower error bars show 75th and 25th percentiles, respectively.
Published as: Discomfort of seated persons exposed to low frequency lateral and roll oscillation: effect of seat cushion
Beard, G. F. & Griffin, M. J. Nov 2014 In : Applied Ergonomics. 45, 6, p. 1547-1557.

24
Figure 5 Effect of seating on adjusted equivalent comfort contours for lateral oscillation, roll oscillation,
and fully roll-compensated lateral oscillation. The contours, expressed as the component of lateral
acceleration in the plane of seat, correspond to discomfort equivalent to that arising with 0.5-Hz lateral
oscillation at 0.2 ms-2 r.m.s. on the rigid seat. Median values from 20 subjects.
0.1
1
Lateral (rigid)Lateral (foam)
Acc
ele
ratio
n (m
s-2 r
.m.s
.)
0.1
1
Roll (rigid)Roll (foam)
Frequency (Hz)
0.2 0.3 0.4 0.5 0.6 0.7 0.8 0.9 1
0.1
1
Fully roll-compensated lateral (rigid)Fully roll-compensated lateral (foam)
Published as: Discomfort of seated persons exposed to low frequency lateral and roll oscillation: effect of seat cushion
Beard, G. F. & Griffin, M. J. Nov 2014 In : Applied Ergonomics. 45, 6, p. 1547-1557.

25
Figure 6 Effect of direction of oscillation on equivalent comfort contours for the rigid seat and the foam
cushion. The contours, expressed as the component of lateral acceleration in the plane of seat,
correspond to discomfort equivalent to that arising with 0.5-Hz lateral oscillation at 0.2 ms-2 r.m.s. on
the rigid seat. Median values from 20 subjects.
0.2 0.3 0.4 0.5 0.6 0.7 0.8 0.9 1
0.1
1FOAM SEAT
Frequency (Hz)
Acc
eler
atio
n (m
s-2 r
.m.s
.)
0.1
1
LateralRollFully roll-compensated lateral
RIGID SEAT
Published as: Discomfort of seated persons exposed to low frequency lateral and roll oscillation: effect of seat cushion
Beard, G. F. & Griffin, M. J. Nov 2014 In : Applied Ergonomics. 45, 6, p. 1547-1557.

26
Figure 7 The effect of acceleration magnitude on equivalent comfort contours caused by lateral
oscillation, roll oscillation, and roll-compensated lateral oscillation on the rigid seat and the foam cushion.
The contours, expressed as the component of lateral acceleration in the plane of seat, correspond to
discomfort equivalent to subjective magnitudes of 50, 63, 80, 100, 125, 160 and 200. The levels of the
contours should not be compared across seats. Median values from 20 subjects.
0.01
0.1
1
Acc
eler
atio
n (m
s-2 r
ms)
0.01
0.1
1
Frequency (Hz)
0.2 0.3 0.4 0.5 0.6 0.7 0.80.9 10.01
0.1
1
0.2 0.3 0.4 0.5 0.6 0.7 0.80.9 1
ROLL
FULLY ROLL COMPENSATED LATERAL
RIGID SEAT FOAM SEAT
200 160 125 100 80 63 50
LATERAL
Published as: Discomfort of seated persons exposed to low frequency lateral and roll oscillation: effect of seat cushion
Beard, G. F. & Griffin, M. J. Nov 2014 In : Applied Ergonomics. 45, 6, p. 1547-1557.

27
Figure 8 Percentages of subjects reporting discomfort localised at the ischial tuberosities when sitting
on the rigid seat and on the foam cushion during exposure to lateral oscillation, roll oscillation, and fully
roll-compensated lateral oscillation across all frequencies.
20
40
60
80
100Rigid seatFoam cushion
Per
cent
age
subj
ects
rep
ortin
g lo
calis
ed d
isco
mfo
rt
20
40
60
80
100
Frequency (Hz)
0.2 0.3 0.4 0.5 0.6 0.7 0.8 0.9 10
20
40
60
80
100
LATERAL
ROLL
FULLY ROLL-COMPENSATED LATERAL
Published as: Discomfort of seated persons exposed to low frequency lateral and roll oscillation: effect of seat cushion
Beard, G. F. & Griffin, M. J. Nov 2014 In : Applied Ergonomics. 45, 6, p. 1547-1557.

28
Figure 9 Percentages of subjects reporting discomfort localised at the upper thighs, lower thighs, or
lower legs when sitting on the rigid seat and on the foam cushion during exposure to lateral oscillation,
roll oscillation, and fully roll-compensated lateral oscillation across all frequencies.
10
20
30
40
50Rigid seatFoam cushion
Per
cent
age
subj
ects
rep
ortin
g lo
calis
ed d
isco
mfo
rt
10
20
30
40
50
Frequency (Hz)
0.2 0.3 0.4 0.5 0.6 0.7 0.8 0.9 10
10
20
30
40
50
LATERAL
ROLL
FULLY ROLL-COMPENSATED LATERAL
Published as: Discomfort of seated persons exposed to low frequency lateral and roll oscillation: effect of seat cushion
Beard, G. F. & Griffin, M. J. Nov 2014 In : Applied Ergonomics. 45, 6, p. 1547-1557.
29
La
tera
l tra
nsm
issi
bilit
y
0.5
2
1
0.5
2
1
Low (0.1 ms-2 r.m.s.)Mid (0.2 ms-2 r.m.s.)High (0.4 ms-2 r.m.s.)
ROLL
LATERAL
Frequency (Hz)
0.2 0.3 0.4 0.5 0.6 0.7 0.8 0.9 1
0.5
2
1
FULLY ROLL-COMPENSATED LATERAL
Figure 10 Lateral transmissibility of the foam cushion during exposure to lateral oscillation, roll
oscillation, and fully roll-compensated lateral oscillation at 0.1, 0.2, and 0.4 ms-2 r.m.s. at frequencies
from 0.25 to 1.0 Hz. Median values from 20 subjects.
Published as: Discomfort of seated persons exposed to low frequency lateral and roll oscillation: effect of seat cushion
Beard, G. F. & Griffin, M. J. Nov 2014 In : Applied Ergonomics. 45, 6, p. 1547-1557.
30
0.5
2
1
Frequency (Hz)
0.2 0.3 0.4 0.5 0.6 0.7 0.8 0.9 1
Ro
ll tr
ansm
issi
bili
ty
0.5
2
1
Low (0.1 ms-2 r.m.s.)Mid (0.2 ms-2 r.m.s.)High (0.4 ms-2 r.m.s.)
FULLY ROLL-COMPENSATED LATERAL
ROLL
Figure 11 Roll transmissibility of the foam cushion during exposure to roll oscillation and roll-
compensated lateral oscillation at 0.1, 0.2, and 0.4 ms-2 r.m.s. at frequencies from 0.25 to 1.0 Hz.
Median values from 20 subjects.
Published as: Discomfort of seated persons exposed to low frequency lateral and roll oscillation: effect of seat cushion
Beard, G. F. & Griffin, M. J. Nov 2014 In : Applied Ergonomics. 45, 6, p. 1547-1557.

31
Frequency (Hz)
0.2 0.3 0.4 0.5 0.6 0.7 0.8 0.9 1
Ro
ll ve
loci
ty (
rad
s-1 r
.m.s
.)
0.1
1
10
Lateral (0.1 ms-2 r.m.s.)Roll (0.1 ms-2 r.m.s.)Lateral (0.2 ms-2 r.m.s.)Roll (0.2 ms-2 r.m.s.)
Lateral (0.4 ms-2 r.m.s.)Roll (0.4 ms-2 r.m.s.)
Figure 12 Effect of magnitude of oscillation on the roll velocity measured at the seat-body interface with
the foam cushion during exposure to lateral oscillation and roll oscillation at frequencies between 0.25
and 1.0 Hz. Median values from 20 subjects.
Published as: Discomfort of seated persons exposed to low frequency lateral and roll oscillation: effect of seat cushion
Beard, G. F. & Griffin, M. J. Nov 2014 In : Applied Ergonomics. 45, 6, p. 1547-1557.

32
0.01
0.1
1
Rid
e v
alue
(m
s-2 r
.m.s
.)
0.01
0.1
1
Frequency (Hz)
0.2 0.3 0.4 0.5 0.6 0.7 0.8 0.9 10.01
0.1
1
Rigid seatFoam seat
LATERAL
ROLL
FULLY ROLL-COMPENSATED LATERAL
Figure 13 Root-sums-of-squares of frequency-weighted measured components at the seat-body
interface during lateral oscillation, roll oscillation, and fully roll-compensated lateral oscillation on a rigid
seat and on a foam cushion. Components weighted using axis multiplying factors and asymptotic
weightings extrapolated horizontally at frequencies less than 0.5 Hz without band-pass filtering (BS
6841, 1987). Median values from 20 subjects.
Published as: Discomfort of seated persons exposed to low frequency lateral and roll oscillation: effect of seat cushion
Beard, G. F. & Griffin, M. J. Nov 2014 In : Applied Ergonomics. 45, 6, p. 1547-1557.

33
Figure 14 Comparison of equivalent comfort contours for lateral oscillation on rigid and cushioned seats
without a backrest and the reciprocals of the asymptotic and the realisable versions of frequency
weighting Wd for lateral acceleration (BS 6841, 1987). Contours for rigid seats normalised to unity at 1
Hz.
Published as: Discomfort of seated persons exposed to low frequency lateral and roll oscillation: effect of seat cushion
Beard, G. F. & Griffin, M. J. Nov 2014 In : Applied Ergonomics. 45, 6, p. 1547-1557.
34
Frequency (Hz)
0.1 1 10
Acc
ele
ratio
n (r
ads-2
r.m
.s.)
0.01
0.1
1
10
Rigid seat (current study)Foam seat (current study)Rigid seat (Parsons and Griffin, 1978)Rigid seat (Wyllie and Griffin, 2007)Reciprocal of realisable We (BS 6841, 1987)
Reciprocal of asymptotic We (BS 6841, 1987)
Figure 15 Comparison of equivalent comfort contours for roll oscillation on rigid and cushioned seats
without a backrest and the reciprocals of the asymptotic and the realisable versions of frequency
weighting We for roll acceleration (BS 6841, 1987). Contours normalised to unity at 1 Hz.
Published as: Discomfort of seated persons exposed to low frequency lateral and roll oscillation: effect of seat cushion
Beard, G. F. & Griffin, M. J. Nov 2014 In : Applied Ergonomics. 45, 6, p. 1547-1557.