
146293158
22
Scheduled Report - Public distribution Date: 12/4/2007 GAIN Report Number: RS7335 RS7335 Russian Federation Fresh Deciduous Fruit Annual 2007 Approved by: Allan Mustard American Embassy Prepared by: Ksenia Evdokimova, Svetlana Ilyina, Mikael Pyrtel Report Highlights: Russia is the largest importer of apples and pears in the world, and imports are growing 20 to 30 percent per year. Rising consumer incomes throughout Russia are increasing demand for U.S. fresh fruits, and the U.S. is the second largest supplier of apples and pears to the Russian Far East (RFE). U.S. fruit importers are diversifying their product lines with table grapes, cherries, and other fruits. Logistics issues in the Port of Greater St. Petersburg continue to impede the pace of U.S. fruit exports to the Russia. The report contains market insights into the Russian fruit market. Includes PSD Changes: No Includes Trade Matrix: No Annual Report Moscow ATO [RS4] [RS] USDA Foreign Agricultural Service GAIN Report Global Agriculture Information Network Template Version 2.09
Transcript of 146293158

Scheduled Report - Public distribution
Date: 12/4/2007
GAIN Report Number: RS7335
RS7335
Russian Federation
Fresh Deciduous Fruit
Annual
2007 Approved by: Allan Mustard American Embassy
Prepared by: Ksenia Evdokimova, Svetlana Ilyina, Mikael Pyrtel Report Highlights: Russia is the largest importer of apples and pears in the world, and imports are growing 20 to 30 percent per year. Rising consumer incomes throughout Russia are increasing demand for U.S. fresh fruits, and the U.S. is the second largest supplier of apples and pears to the Russian Far East (RFE). U.S. fruit importers are diversifying their product lines with table grapes, cherries, and other fruits. Logistics issues in the Port of Greater St. Petersburg continue to impede the pace of U.S. fruit exports to the Russia. The report contains market insights into the Russian fruit market.
Includes PSD Changes: No Includes Trade Matrix: No
Annual Report Moscow ATO [RS4]
[RS]
USDA Foreign Agricultural Service
GAIN ReportGlobal Agriculture Information Network
Template Version 2.09

GAIN Report - RS7335 Page 2 of 22
UNCLASSIFIED USDA Foreign Agricultural Service
Executive Summary ..................................................................................................3 Production ................................................................................................................3 Increasing Imports of Fruits and Nuts .....................................................................3 Apple Imports...........................................................................................................3
Table 1. Import Trade Matrix for Apples, MY 2005-2006, Metric Tons ............................4 Figure 1. Russia: Leading Apple Exporters to Russia, by month, MY 2006 ....................5 Figure 2. Russia: Total Volume of Pear Imports, by Month, MY2006.............................5 Table 2. PSD Table, Apples, Metric Tons...................................................................6 Table 3. Russia: Prices of Imported Apples, US Dollars per Metric Ton ..........................7
Pears ........................................................................................................................7 Table 4. Import Trade Matrix for Pears, MY 2005-2006, Metric Tons..............................8 Figure 3. Russia: Leading Pear Exporters to Russia, by Month, MY 2006 ......................8 Figure 4. Russia: Total Value of Pear Imports. by Month, MY2006 ...............................9 Table 5. PSD, Pears, Metric Tons............................................................................10 Table 6. Prices of Imported Pears, US Dollars per Metric Ton .....................................11
Other Fruit..............................................................................................................11 Table grapes .........................................................................................................11 Cherries ...............................................................................................................11 Berries .................................................................................................................12 Exotic fruits ..........................................................................................................12
Consumption ..........................................................................................................12 Policy......................................................................................................................12
Customs Duties and Fees on Fruit ............................................................................12 Logistics and Transportation: St. Petersburg Port Congestion ..............................13 Marketing ...............................................................................................................13 Pricing ....................................................................................................................14
Apples..................................................................................................................14 Table 7. Apples: Average apple prices in Moscow supermarkets. ................................14 Figure 5. Dollar/Ruble Exchange Rate ....................................................................16
Vladivostok Market Overview .................................................................................16 Vladivostok Executive Summary ..............................................................................16 RFE Fruit Trade with China and the United States .......................................................17
Figure 6. Russian Far East Imports: Imports of Fresh Fruit, $1000 dollars...................18 New Trends in Fruit Supply in the Russian Far East .....................................................18 Apples..................................................................................................................19
Figure 7. Russian Far East: Fruit Imports................................................................19 Table 8. Russian Far East: Apple Imports, MY 2004-2006 ........................................20
Apple Consumer Demographics ...............................................................................20 Pears ...................................................................................................................20
Table 9. Russian Far East: Pear Imports, MY 2004-2006 ...........................................21 Pear Consumer Demographics .................................................................................21
Other Relevant Reports ..........................................................................................21

GAIN Report - RS7335 Page 3 of 22
UNCLASSIFIED USDA Foreign Agricultural Service
Executive Summary
Russia is the largest importer of apples and pears in the world. U.S. apples and pears are gaining popularity in Western Russian and the Russian Far East (RFE) and fruit importers are diversifying their product lines with table grapes and cherries. Congestion in the Port of Greater St. Petersburg continues to impede faster growth of U.S. fruit imports.
Production
According to official statistics, Russians produce 88% of fruits domestically on household plots. These fruits are consumed fresh or canned for later consumption; surplus fruit is sold in local wet markets. Commercial fruit production in Russia is concentrated in three main growing regions: Krasnodar (44%), Voronezh (15%), and Lipetsk (8%) regions. Commercial producers supply supermarkets from June to January. Apple crops grown for commercial use consist of such varieties as Red Chief, Golden Delicious, Semerenka (a Russian light green sour variety), Granny Smith, Gala, and Fuji. Commercial pear producers grow local varieties as well as Conference, Anjou, and other varieties. Sad Gigant, a commercial producer in the Krasnodar region, provides most apples to local stores. In 2006 the apple fruit bearing area totaled 348 thousand hectares with a crop yield of 1.25 million metric tons. Pear orchards in 2006 totaled 38 thousand hectares with a crop yield of 130 thousand metric tons. At the time of this report, official statistics on the MY 20071 crop were not available; however, analysts expect MY 2007 production significantly to exceed MY 2006.
As reported previously, the harsh winter in MY 2006 significantly reduced fruit production in the Krasnodar region, as pear, grapes and stone fruit trees sustained serious damage. The St. Petersburg ATO traveled to the Krasnodar region in May 2007 and observed that producers are planting new trees. Producers expect domestic fruit supplies to reach pre-frost levels in a few years.
Apple orchards overwintered this year with less damage, making MY 2007 an “apple year” for most of the households of Central and South Russia, and domestic apples are still available on supermarket shelves. Early winter temperatures were above average, and the snowfall protected apple trees during the frost.
Increasing Imports of Fruits and Nuts According to official statistics, there is a growing market for fruit and nut exports to Russia. In CY 2006 Russia imported 4.7M metric tons of edible fruit and nuts worth $3 billion. In CY 2005, Russia imported 3.9M metric tons, worth $2.1 billion, and in CY 2004, Russia imported 3.8M metric tons worth $1.6 billion. Leading exporting countries include: Ecuador, Turkey, Uzbekistan, Argentina, China, Morocco, Poland, Azerbaijan, and South Africa. Leading European exporters are Spain, Italy and Belgium. Apple Imports In CY 2006, Russia was the world’s largest importer of apples; Russia imported a record 815 thousand metric tons worth $352 million, according to official customs statistics. Russian apple imports in CY 2005 and CY 2004, totaled 721 thousand metric tons and 705.4 thousand metric tons, respectively, worth $294 million and $237 million, respectively.
1 The marketing year (MY) is July-June. For example, MY 2005 is from July 2005 to June 2006.

GAIN Report - RS7335 Page 4 of 22
UNCLASSIFIED USDA Foreign Agricultural Service
Germany and the UK placed second and third, in terms of import volumes, with 699 thousand metric tons and 539 thousand metric tons respectively. Table 1. Import Trade Matrix for Apples, MY 2005-2006, Metric Tons
Country Russian Federation
Commodity Apples, Fresh Time Period Units: Metric tons Imports for: 2005 2006 U.S. 5,702 U.S. 9,457 Others Others Poland 143,428 Poland 251,018 China 129,019 China 177,078 Azerbaijan 69,360 Argentina 59,913 Ukraine 51,288 Italy 54,319 Argentina 51,145 Azerbaijan 53,531 Italy 49,871 France 47,585 France 42,031 Ukraine 38,085 Belgium 32,930 Belgium 30,377 Chile 23,641 Chile 29,458 Kazakhstan 18,214 Germany 23,177
Total for Others
610,927 764,541 Others not Listed 98,646 134,004 Grand Total 715,275 908,002 Source: World Trade Atlas, based on data from the Russian Customs Service.

GAIN Report - RS7335 Page 5 of 22
UNCLASSIFIED USDA Foreign Agricultural Service
Figure 1. Russia: Leading Apple Exporters to Russia, by month, MY 2006
Definitions Other EU Belgium, Spain, the Netherlands, Germany, Greece Other CIS Kazakhstan, Kyrgyzstan, Uzbekistan South America – Argentina, Chile Source: Data for Figure(s) 1 and 2 collected from World Trade Atlas, based on data from the Russian Customs Service
Figure 2. Russia: Total Volume of Pear Imports, by Month, MY2006
Competition among apple exporters to Russia by month, MY 2006.
0%
20%
40%
60%
80%
100%
07/2006
08/2006
09/2006
10/2006
11/2006
12/2006
01/2007
02/2007
03/2007
04/2007
05/2007
06/2007
month
% im
po
rt (
vo
lum
e)
UnitedStatesOther EU
Italy
France
Poland
Other CIS
Ukraine
Azerbaijan
SouthAmericaChina
I m p o r t o f a p p l e s b y m o n t h , M Y 2 0 0 6
8 7 , 9 9 9
1 0 3 , 5 6 2
8 5 , 9 1 1
1 1 9 , 2 6 8
9 2 , 2 8 0
9 0 , 0 5 7 8 1 , 0 5 68 0 , 4 2 9
5 9 , 6 7 94 4 , 1 1 7
2 2 , 5 6 5
4 1 , 0 7 9
0
2 0 0 0 0
4 0 0 0 0
6 0 0 0 0
8 0 0 0 0
1 0 0 0 0 0
1 2 0 0 0 0
1 4 0 0 0 0
07/2006
08/2006
09/2006
10/2006
11/2006
12/2006
01/2007
02/2007
03/2007
04/2007
05/2007
06/2007
m o n t h
imp
ort
, m
etr
ic t
on
s

GAIN Report - RS7335 Page 6 of 22
UNCLASSIFIED USDA Foreign Agricultural Service
Table 2. PSD Table, Apples, Metric Tons
Country Russian Federation
Commodity Apples, Fresh 2005 Revised 2006 Estimate 2007 Forecast UOM
USDA Official [Old]
Post Estimate[New]
USDA Official [Old]
Post Estimate [New]
USDA Official [Old]
Post Estimate [New]
Market Year Begin
07/2005 07/2006 07/2007 MM/YYYY
Area Planted 413,300 413,300 420,000 348,000 0 360,000 (HA) Area Harvested 350,300 350,300 350,000 290,000 0 305,000 (HA) Bearing Trees 135,000 135,000 120,000 100,000 0 110,000 (1000TREES) Non-Bearing Trees 26,000 26,000 38,000 31,500 0 30,000 (1000TREES) Total Trees 161,000 161,000 158,000 131,500 0 140,000 (1000TREES) Commercial Production 1,183,000 1,183,000 1,100,000 810,000 0 1,000,000 (MT) Non-Commercial Production 380,000 380,000 380,000 440,000 0 400,000 (MT) TOTAL Production 1,563,000 1,563,000 1,480,000 1,250,000 0 1,400,000 (MT) TOTAL Imports 750,000 750,000 890,000 908,000 0 1,000,000 (MT) TOTAL SUPPLY 2,313,000 2,313,000 2,370,000 2,158,000 0 2,400,000 (MT) Domestic Fresh Consumption 941,000 941,000 1,002,000 1,027,000 0 1,140,000 (MT) Exports, Fresh Only 2,000 2,000 3,000 2,000 0 3,500 (MT) For Processing 1,350,000 1,350,000 1,350,000 1129000 0 1,256,500 (MT) Withdrawal From Market 20,000 20,000 15,000 0 0 0 (MT) TOTAL UTILIZATION 2,313,000 2,313,000 2,370,000 2,158,000 0 2,400,000 (MT)

GAIN Report - RS7335 Page 7 of 22
UNCLASSIFIED USDA Foreign Agricultural Service
Table 3. Russia: Prices of Imported Apples, US Dollars per Metric Ton Country Russian Federation Commodity Apples, Fresh Prices in US Dollars per uom Metric ton Year 2005 2006 % Change
Jan 400 420 5% Feb 400 420 5% Mar 410 420 2% Apr 410 430 5% May 430 430 0% Jun 440 450 2% Jul 440 480 9% Aug 390 480 23% Sep 360 430 19% Oct 370 430 16% Nov 390 430 10% Dec 410 440 7%
Source: World Trade Atlas, based on data from the Russian Customs Service. Pears Per capita annual consumption of fruit in Russia is 34 kilos, which is substantially lower than European and U.S. levels; however, trade data indicate that Russians are closing the fruit consumption gap with Western consumers. According to official customs data, in CY 2006 Russia was the world’s largest importer of pears with a record 327 thousand tons worth $203 million. In CY 2005, Russia imported 313,430 tons of pears worth $156 million, and in CY 2004 Russia imported 260,210 tons worth $104 million. Germany and the Netherlands placed second and third place with 539 thousand tons and 187 thousand tons, respectively. Analysts expect the growth in fruit consumption to continue as Russian consumer incomes increase along with an orientation towards healthier lifestyles. Domestic fruit production is limited; therefore, fruit imports are necessary to satisfy market demand. Phytosanitary issues were not having a noticeable impact on the fruit market in 2007; however, in 2006 the Russian government did implement several temporary bans. Russian consumers are sensitive to prices for fruit. It is likely that demand for high-quality produce will continue to grow, but will stay a niche market, while most of the market will be taken by a low-priced product. Decrease in customs tariffs and activation of new container terminals will make imported produce more competitive against cheap CIS produce.

GAIN Report - RS7335 Page 8 of 22
UNCLASSIFIED USDA Foreign Agricultural Service
Table 4. Import Trade Matrix for Pears, MY 2005-2006, Metric Tons
Country Russian Federation
Commodity Pears, Fresh Time Period Units: Metric tons Imports for: 2005 2006 U.S. 3,781 U.S. 4,385 Others Others Argentina 80,819 Belgium 104,535 Belgium 75,895 Argentina 91,078 China 41,944 China 49,826 Netherlands 35,605 Netherlands 46,272 Spain 14,533 France 17,457 France 13,698 Spain 14,925 South Africa 8,926 South Africa 12,196 Portugal 8,263 Portugal 10,437 Chile 3,781 Uzbekistan 6,294 Kyrgyzstan 3,375 Italy 4,127 Total for Others 286,839 357,147 Others not Listed 18,953 19,092 Grand Total 306,458 380,624 Source: World Trade Atlas, based on data from the Russian Customs Service.
Figure 3. Russia: Leading Pear Exporters to Russia, by Month, MY 2006
Source: World Trade Atlas, based on data from the Russian Customs Service Definition: Other EU – Spain, Portugal, Italy, the Netherlands, France
Competition among pear exporters to Russia by month, MY2006.
0%
10%
20%
30%
40%
50%
60%
70%
80%
90%
100%
07/2006
08/2006
09/2006
10/2006
11/2006
12/2006
01/2007
02/2007
03/2007
04/2007
05/2007
06/2007
month
% im
port
(vol
ume) United States
South AfricaUzbekistanOther EUArgentinaBelgiumChina

GAIN Report - RS7335 Page 9 of 22
UNCLASSIFIED USDA Foreign Agricultural Service
Figure 4. Russia: Total Value of Pear Imports. by Month, MY2006
Source: World Trade Atlas, based on data from the Russian Customs Service
Im port of pears by m onth, M Y2006
37,22033,572
29,549
36,508
38,610
45,509
29,971
32,827
30,65027,419
18,860
15,544
6
5006
10006
15006
20006
25006
30006
35006
40006
45006
50006
07/2006
08/2006
09/2006
10/2006
11/2006
12/2006
01/2007
02/2007
03/2007
04/2007
05/2007
06/2007
m onth
impo
rt, m
illio
n $

GAIN Report - RS7335 Page 10 of 22
UNCLASSIFIED USDA Foreign Agricultural Service
Table 5. PSD, Pears, Metric Tons
Country Russian Federation
Commodity Pears, Fresh 2005 Revised 2006 Estimate 2007 Forecast UOM
USDA Official [Old]
Post Estimate [New]
USDA Official [Old]
Post Estimate [New]
USDA Official [Old]
Post Estimate [New]
Market Year Begin 07/2004 07/2005 07/2006 MM/YYYY Area Planted 64,700 64,700 53,140 38000 0 55,000 (HA) Area Harvested 50,800 50,800 35,600 25,800 0 36,000 (HA) Bearing Trees 16,100 16,100 11,300 8,200 0 9,500 (1000 TREES) Non-Bearing Trees 9,500 9,500 12,000 8,700 0 8,000 (1000 TREES) Total Trees 25,600 25,600 23,300 16,900 0 17,500 (1000 TREES) Commercial Production 114,100 114,100 71,000 52,000 0 65,000 (MT) Non-Commercial Production 178,300 178,300 110,000 78,000 0 90,000 (MT) TOTAL Production 292,400 292,400 181,000 130000 0 155,000 (MT) TOTAL Imports 330,000 330,000 388,000 376000 0 410,000 (MT) TOTAL SUPPLY 622,400 622,400 569,000 506000 0 565,000 (MT) Domestic Fresh Consumption 484,200 484,200 462,800 411600 0 460,000 (MT) Exports, Fresh Only 800 800 0 1400 0 1000 (MT) For Processing 130,000 130,000 100,000 93,000 0 104,000 (MT) Withdrawal From Market 7,400 7,400 6,200 0 0 0 (MT) TOTAL UTILIZATION 622,400 622,400 569,000 506,000 0 565,000 (MT)

GAIN Report - RS7335 Page 11 of 22
UNCLASSIFIED USDA Foreign Agricultural Service
Table 6. Prices of Imported Pears, US Dollars per Metric Ton
Country Russian Federation
Commodity Pears, Fresh Prices in US Dollars per uom Metric ton Year 2005 2006 % Change
Jan 440 530 20% Feb 470 530 13% Mar 470 520 11% Apr 480 590 23% May 480 580 21% Jun 500 550 10% Jul 530 670 26% Aug 530 730 38% Sep 520 710 37% Oct 530 700 32% Nov 530 690 30% Dec 520 690 33%
Source: World Trade Atlas, based on data from the Russian Customs Service.
Source of information
The above statistics and graphs were prepared based on the data of the World Trade Atlas, which uses data of the Russian Customs Service. Prices are based on CIF prices.
Other Fruit Table grapes Domestic grape producers in Russia lack sufficient marketing channels and thus access to retail markets in Central Russia, so producers concentrate on varieties for local consumption and wine production. As a result, demand for table grapes is outpacing supply and Russian retailers are relying on imports to satisfy consumer demand; and Russian consumers are paying premium prices for quality table grapes. In 2006 imports of fresh table grapes reached 321 thousand tons (25% growth in two years). Most of the imports arrived from Uzbekistan (140 thousand MT), Turkey (51 thousand MT), and Chile (24 thousand MT). Other suppliers include Italy, South Africa, Argentina, Tajikistan, China, and the U.S. (322 MT). Cherries Domestic cherry producers face similar logistics problems to those of table grape producers, and consequently, most cherries are consumed locally and do not reach supermarket shelves in Moscow or St. Petersburg. May through August is the peak import season for cherries in Russia. Cherry supplies from the Southern hemisphere are significantly smaller and arrive in November-January. In 2006, total cherry imports equaled 51K tons (65% growth in two years). Most of the imports arrived from Turkey (10 thousand MT), Uzbekistan (8.3 thousand MT), Kyrgyzstan (6.4 thousand MT) and Ukraine (2.4 thousand MT).

GAIN Report - RS7335 Page 12 of 22
UNCLASSIFIED USDA Foreign Agricultural Service
Berries Berries are a traditional food in Russia, and strawberries, raspberries, cranberries and red bilberries are very popular. Most berries are harvested in forests and in small private orchards. Due to the seasonal availability of these fruits, consumer demand is growing for berry imports; and in 2006 Russia imported close to 20 thousand tons of berries. Strawberry imports increased more than doubled in the last two years and reached 18.7 thousand tons. Turkey, Poland, Spain, Belgium and the Netherlands export strawberries to Russia. Most U.S. berries are re-exported through Europe, thus reported U.S. berry imports are close to zero. Exotic fruits Exotic fruits are gaining popularity in Russia. About one third of Russians have tried an exotic fruit, such as, pineapple, avocado, litchis, carambola, papaya, or rambutan. According to the World Trade Atlas, Russia imported 14 thousand metric tons of exotic fruits (pineapples, guavas, mangos) in 2006. According to importers, annual fruit sales are growing at 10%, while annual growth in exotic categories is close to 20-30%. Consumption According to research from the Fruit and Vegetable Alliance, some favorite fruits of Russian consumers include:
! Apples (40 percent of Russians prefer an apple to other fruits); ! Bananas (31 percent) and oranges (28 percent); ! Grapes (22 percent) and pears (21 percent); ! Apricots, peaches, watermelons, mandarins, grapefruits, lemons, plums, pineapples
and kiwifruits (7-18 percent); ! Pineapple, mango, avocado (less than 4 percent).
Out of the total of 34 kilos Russians consumed per capita in 2006, apples constituted 10.5 kilos (30%), and bananas (4.5 kilos) and citrus fruits (3 kilos) constituted 13% and 8%, respectively. Policy In November 2006, Office of The U.S. Trade Representative published the results of bilateral negotiations within the framework Russia's accession to the World Trade Organization (WTO) over Agricultural Goods Market Access. During WTO negotiations, Russia agreed to bind its tariffs on all agricultural products and lower its specific tariff rate on apples by 70-85% within five years after it joins the WTO. Multilateral negotiations are continuing with Russia expressing the intent to enter the WTO in summer 2008. U.S. producers and food processors, particularly of grains, dairy, fruits and nuts, wine, and livestock, will benefit from the market access provisions of the bilateral agreement when Russia joins the WTO. Customs Duties and Fees on Fruit Tariff rates on apples vary depending on the season to protect domestic producers. From January 1 to July 31 the tariff rate is Euro 100 per metric ton. From August 1 to December 31 it is Euro 200 per metric ton.

GAIN Report - RS7335 Page 13 of 22
UNCLASSIFIED USDA Foreign Agricultural Service
For other fruits, the tariff rate is a percentage of taxable value. For pears and grapes the tariff rate is 5% of taxable value. For grapefruit the tariff rate is also 5% of taxable value, but no less than EURO 20 per metric ton. Similar to nut imports, a sanitary-epidemiological inspection certificate from the Russian Federal Veterinary and Phytosanitary Surveillance Service (VPSS) must accompany all fruit imports into the Russian Federation. In addition to VPSS approval, importers must obtain a product certificate from an authorized Russian certification agency for customs clearance. To obtain a product certificate, importers must have the following documents:
! Signed contract and transportation documents ! Certificate of origin ! Phytosanitary certificate from the exporting country’s national phytosanitary
authority ! Quality certificate ! Importer’s license ! Certificate of Conformity
Logistics and Transportation: St. Petersburg Port Congestion The Port of Greater St. Petersburg is a bottleneck for U.S. container shipments; port delays can add an additional 30 days of freight time. According to experts, U.S. fruit imports could increase 30-50% in November-January absent severe congestion in St. Petersburg, and other Baltic Sea ports are cost-prohibitive for many importers. Some importers truck containers to Moscow directly from the Netherlands and Germany, but this pays off only for expensive products. The United States Department of Agriculture (USDA) and trade associations are constantly working to obtain as much information as possible on the developments of the St. Petersburg port. Please contact [email protected] with your questions on the issue. Marketing Russian retailers are developing strategies to promote more fruit to consumers; currently fruit and vegetable campaigns are relegated to traditional methods used in retail stores. Retailers’ in-store leaflets, or retail circulars delivered to customer’s homes or on the streets usually promote fruits and vegetables, but normally don’t include brand names or the logo of fruit and vegetable companies. Retail managers thus assume responsibility for developing ‘brand recognition’ among their customers. Merchandising displays (separate displays, power-zones, and shelf trays), seasonal sales, in-store announcements, and “SALE” or “BARGAIN” signs attract customers; however, these marketing tools are modest compared to other departments (alcohol, snacks, confectionery, and meat departments) in retail outlets. Store clerks may require additional training as well in promoting fruit to consumers and properly displaying fruit in retail markets. For example, fruits of one country are often sold under another country’s sign; shop assistants mislabel price information, or misinform customers about country of origin. Brand awareness can vary by region, and U.S. fruits have stronger brand recognition among consumers in Russia’s Far East. Consumers in Western Russia are becoming more accustomed to U.S. fruit, however, in part because of the active involvement of the Washington Apple Commission and the North West Pear Bureau. According to research by one Russian retailer, Russian consumers tend to buy unknown products when they see an advertisement (40 percent), or if the item is a new product (24 percent), or on sale (13 percent), or appears in interesting packaging (10 percent), or is recommended a friend (5 percent). Advertising in stores is uncommon in fruit departments,

GAIN Report - RS7335 Page 14 of 22
UNCLASSIFIED USDA Foreign Agricultural Service
even though there are great opportunities to increase the volume of sales. According to one fruit department manager, in-store announcements and advertisements in the department helped increase sales of fresh table grapes by 4-5 times in a week. One of the leading banana importers in Russia, JFC, launched an aggressive marketing campaign promoting Bonanza bananas. For more information, refer to www.bonanzaland.ru. Multinational corporations such as Dole, Chiquita, Del Monte occasionally post advertisements on the streets of large cities, public places, and other locations. Pricing Apples Table 7. Apples: Average apple prices in Moscow supermarkets.
Month, year Variety Countries of origin Price range, $ per kilo
June 2006 Red Delicious Argentina 3.00-6.00 Golden Delicious Italy, Chile 1.70-4.00 Granny Smith France 1.90 Other varieties $2-6 July 2006 Red Delicious Chile 2.00-4.50 Golden Delicious Chile, Europe 1.60-2.20 Local varieties Russia 1.40-1.60 Other varieties $1.5-4.5 August 2006 Red Delicious Chile 2.50 Golden Delicious Chile, France 1.60-3.20 Pink Lady N. Zealand 4.60-5.70 Other varieties 1.4-4.7 September 2006 Granny Smith Spain 2.20-2.40 Jonagold Netherlands 2.30-2.90 Fuji China 2.60-3.40 Other varieties 1.04-4.50 October 2006 Granny Smith France 2.50-3.00 Braebern USA 3.80 No variety CIS 1.30-1.70 Golden Delicious Holland 2.30-2.70 Other varieties 1.35-3.7 November 2006 Idared Poland 1.20-1.40 Golden Delicious France 2.40-3.50 RedDel
PinkLady Cameo
USA 8.20 8.40 8.90
Other varieties 1.3-6 December 2006 No variety Poland, Ukraine 1.30-1.80 RedDel,RedChief Italy 2.40 Golden Delicious France 2.40-3.40 RedDel
PinkLady Cameo
USA 2.70-8.90 8.40 8.90
continued on next page

GAIN Report - RS7335 Page 15 of 22
UNCLASSIFIED USDA Foreign Agricultural Service
Other varieties 1.3-5 January 2007 Gala Royal Italy 2.10-2.30 Red Del EU 2.00-3.20 Fuji China 1.90-2.30 Red Del
Braebern RedRome
USA 2.60-5.40 6.50 6.40
Other varieties 2-4.8 February 2007 Granny Smith Italy 2.00 Braebern France 2.50-3.80 RedDel
RedRome Cameo
USA 2.60-3.80 3.90-4.00 7.40
Local varieties Russia 1.20-1.50 Other varieties 1.3-3.4 March 2007 Red Delicious Argentina 1.80-2.50 Red Delicious USA 2.60-3.00 Gala Royal Italy 1.80-2.50 Other varieties 1.8-3.5 April 2007 Fuji China 2.00 Jonagold, Gloster Germany 2.20-2.90 RedChief, Reddel USA 2.70-4.30 Other varieties 1.7-3.5 May 2007 Red Delicious Argentina 1.70-3.70 GalaRoyal
GrannySmith France 2.50-3.50
2.40-3.00 Cripps Pink
GoldenDel Italy 2.30
2.90-3.50 Other varieties 1.7-3.7 June 2007 Braebern
Pink Lady Chile 2.80-3.30
3.70-4.00 GoldenDel France 2.10-3.40 Pink Lady
Red Chief USA 8.60
2.80 Other varieties 2.2-4 Source: Listed prices in Moscow supermarkets

GAIN Report - RS7335 Page 16 of 22
UNCLASSIFIED USDA Foreign Agricultural Service
Figure 5. Dollar/Ruble Exchange Rate Dollar-to-Ruble depreciation increases the competitiveness of U.S. food exports
U.S. Dollar - Russian Ruble Exchange Rate (2002-2007)
$1=31,74 rubles
29.8128.76 28.55
26.72
$1=24,67rubles
Novem
ber2002
No
vember
2003
Novem
ber2004
Novem
ber
2005
Novem
ber2006
No
vember
2007
Vladivostok Market Overview Vladivostok Executive Summary Climate conditions and the structure of fruit production in the Russian Far East (RFE) impede the development of a commercial fruit sector, thus consumers rely on fruit imports to satisfy demand. According to the Russian State Statistics Agency (Rosstat), in 2005 the RFE territory produced 7.78 thousand MT of apples (0.5% of domestic apple crop) and 420 tons of pears (0.14% of domestic pear crop). Typically, fruit crops in the RFE are cultivated on small plots for household consumption, with surpluses sold in the open markets during the crop season. The appreciation of the Ruble and the growing purchasing power of Russian consumers have increased the demand for high quality fruit products, and consumers recognize American fruits as quality products due to a 10-year promotional effort in the RFE by the U.S. Pear Bureau and Washington Apple Commission. The RFE receives fresh fruit via ocean transport or Tran-Siberian railway. The RFE imports 90% of its fruits from Pacific Rim countries and Chile, and since 2003 the RFE fruit market grew 15%-20% annually. In 2006 the RFE imported 134 thousand tones of fruit valued at $80 million. The main fruit exporters to the RFE include China ($53 million)2, Philippines ($18 million) USA ($3.2 million), Australia ($0.7 million), New Zealand ($0.5 million), and Chile ($0.4 million). U.S. fruit exports to the RFE increased 39% and totaled 4,600 metric tons. In September–October 2007 the RFE imported 170 containers of apples and pears,
2 China is the major supplier of apples, pears, citrus, and grapes to the RFE, and accounts for 67% of exports to the region.

GAIN Report - RS7335 Page 17 of 22
UNCLASSIFIED USDA Foreign Agricultural Service
70% of total exports in 2006. New companies are interested in importing U.S. fruits, and experienced importers are marketing new fruit products to consumers. Imports of apples from Belgium, France, South Africa, pears from Argentina, Belgium, South Africa, citrus from Spain and Turkey, fruits from Uzbekistan and the southern regions of the Russian Federation, travel to the Russian Far East by Tran Siberian railways. The shipments from St. Petersburg and those trucked from European and NIS countries are consolidated in Moscow. After the fruit shipment clears customs and the certification process, the distributor in Vladivostok ships the containers from Moscow to the RFE. The RFE customer pays the Moscow importer a commission, in addition to the 6,000 mile transportation costs. As a result, consumers in the RFE pay higher prices for these fruits than their counterparts in western Russia. Fruit imports from ocean transport are more competitive in terms of price, and thus fruits from Pacific Rim countries dominate the Russian Far East market. Importers estimate that fruits delivered from Moscow cover 2-3% of apple market, 10% of the pear market and 15% of the market for citrus in the Russian Far East. Figure 5 (shown below) shows only numbers of product cleared within the Russian Far East Customs District. RFE Fruit Trade with China and the United States China is the main supplier of apples, pears, tangerines, oranges, and some exotic fruits to the RFE market, and accounts for 67% of total export value to the region. According to RFE Customs data, in 2006 China exported 91 thousand tons of fruit worth $53 million. Chinese products have a logistical advantage in RFE markets, and Russian importers have established trade contacts and access to credit markets. As a result, total fruit imports form China doubled in 2005 and increased 30% in 2006. In spite of the trade growth, Russian consumers are concerned about the quality of Chinese fruits and some consumers switch from Chinese fruits, when they can afford fruits from other countries. To combat the image problem, China took measures to improve fruit variety, packaging, and announced a campaign to improve the image of Chinese products. The marketing campaign may increase retail prices for Chinese apples and erode China’s competitive edge in the RFE fruit market. The seasonal shortage of Chinese apples in August – September also increases the visibility of American fruits.

GAIN Report - RS7335 Page 18 of 22
UNCLASSIFIED USDA Foreign Agricultural Service
Figure 6. Russian Far East Imports: Imports of Fresh Fruit, $1000 dollars
Source: Russian Far East Customs data 2006
The U.S. is the second largest supplier of apples and pears to the Russian Far East. Since 2003 U.S. apple and pear exports increased 20% annually. In 2006 the RFE imported 4.4 thousand metric tones of American fruits- 36% of total US fruit exports to Russia. In September-October 2007 the RFE imported 170 containers of apples and pears from US West Coast and accounted for 70% of total sales in 2006. Apples and pears are available from October through June; and they compete mainly with Belgium, Argentina, South African, and sometimes with fruits New Zealand.
New Trends in Fruit Supply in the Russian Far East Market analysts believe the market for U.S. fresh fruit in the RFE will continue to grow. In addition to fresh fruit consumption increasing with household incomes, U.S. exporters may find the RFE market less competitive than Western Russia. As discussed earlier, the RFE lacks commercial fruit production due to environmental and structural constraints, and U.S. exporters would face less competition from Western Europe for the RFE fruit market. Finally, rising prices for Chinese fruit products and consumer preference for U.S. fruits are starting to erode China’s competitive position as the main fruit supplier in the RFE. For example, in 2004 Chinese apples were three times less expensive than U.S. apples; however now Chinese apples can sometimes reach 2/3 the price of U.S. apples. Since 2004 the average supermarket price for Chinese apples increased three times and now reaches $2.4 per kg. U.S. apple prices have increased as well, but not as dramatically as Chinese apple prices. Currently, the average price for U.S. apples in the supermarkets is $3.6 per kg. Analysts believe that as the price gap narrows between Chinese and U.S. apples, U.S. fruit producers could increase their market share in the RFE market.
0
10,000
20,000
30,000
40,000
50,000
60,000
2004 2005 2006
ChinaPhilippinesUSAAustraliaTotal for others
GAIN Report - RS7335 Page 19 of 22
UNCLASSIFIED USDA Foreign Agricultural Service
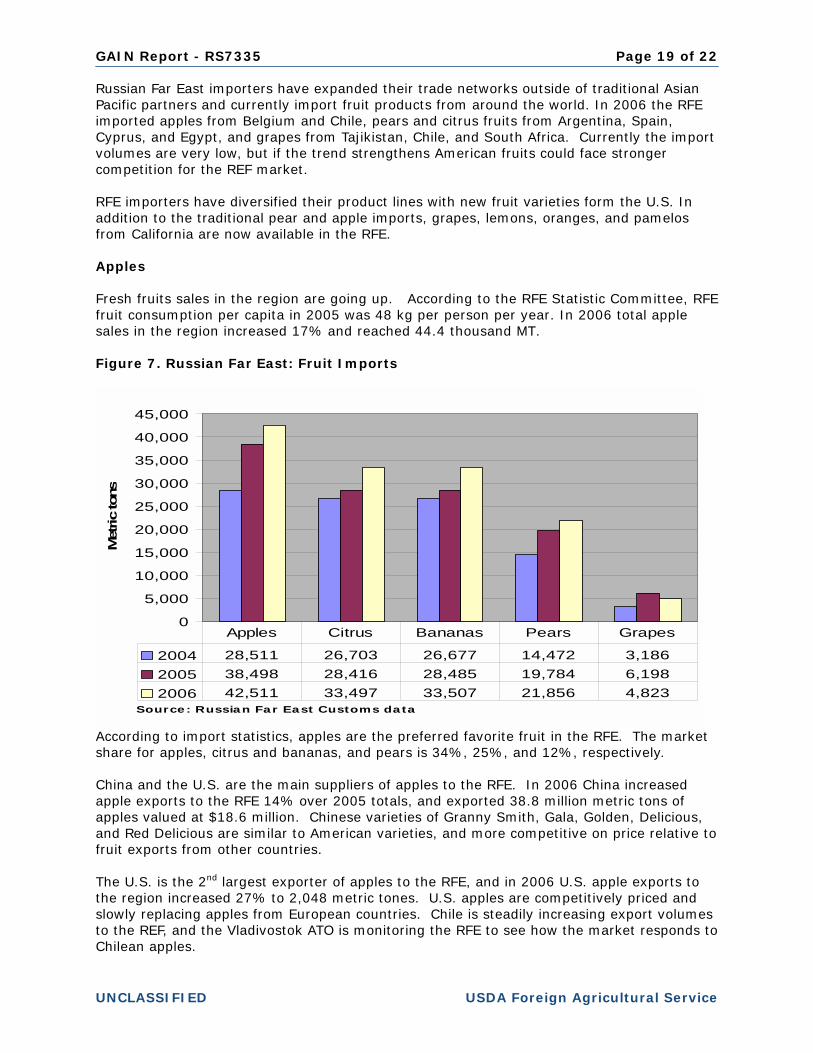
Russian Far East importers have expanded their trade networks outside of traditional Asian Pacific partners and currently import fruit products from around the world. In 2006 the RFE imported apples from Belgium and Chile, pears and citrus fruits from Argentina, Spain, Cyprus, and Egypt, and grapes from Tajikistan, Chile, and South Africa. Currently the import volumes are very low, but if the trend strengthens American fruits could face stronger competition for the REF market. RFE importers have diversified their product lines with new fruit varieties form the U.S. In addition to the traditional pear and apple imports, grapes, lemons, oranges, and pamelos from California are now available in the RFE. Apples Fresh fruits sales in the region are going up. According to the RFE Statistic Committee, RFE fruit consumption per capita in 2005 was 48 kg per person per year. In 2006 total apple sales in the region increased 17% and reached 44.4 thousand MT. Figure 7. Russian Far East: Fruit Imports
0
5,000
10,000
15,000
20,000
25,000
30,000
35,000
40,000
45,000
Source: Russian Far East Customs data
Met
ric to
ns
2004 28,511 26,703 26,677 14,472 3,1862005 38,498 28,416 28,485 19,784 6,1982006 42,511 33,497 33,507 21,856 4,823
Apples Citrus Bananas Pears Grapes
According to import statistics, apples are the preferred favorite fruit in the RFE. The market share for apples, citrus and bananas, and pears is 34%, 25%, and 12%, respectively. China and the U.S. are the main suppliers of apples to the RFE. In 2006 China increased apple exports to the RFE 14% over 2005 totals, and exported 38.8 million metric tons of apples valued at $18.6 million. Chinese varieties of Granny Smith, Gala, Golden, Delicious, and Red Delicious are similar to American varieties, and more competitive on price relative to fruit exports from other countries. The U.S. is the 2nd largest exporter of apples to the RFE, and in 2006 U.S. apple exports to the region increased 27% to 2,048 metric tones. U.S. apples are competitively priced and slowly replacing apples from European countries. Chile is steadily increasing export volumes to the REF, and the Vladivostok ATO is monitoring the RFE to see how the market responds to Chilean apples.
GAIN Report - RS7335 Page 20 of 22
UNCLASSIFIED USDA Foreign Agricultural Service
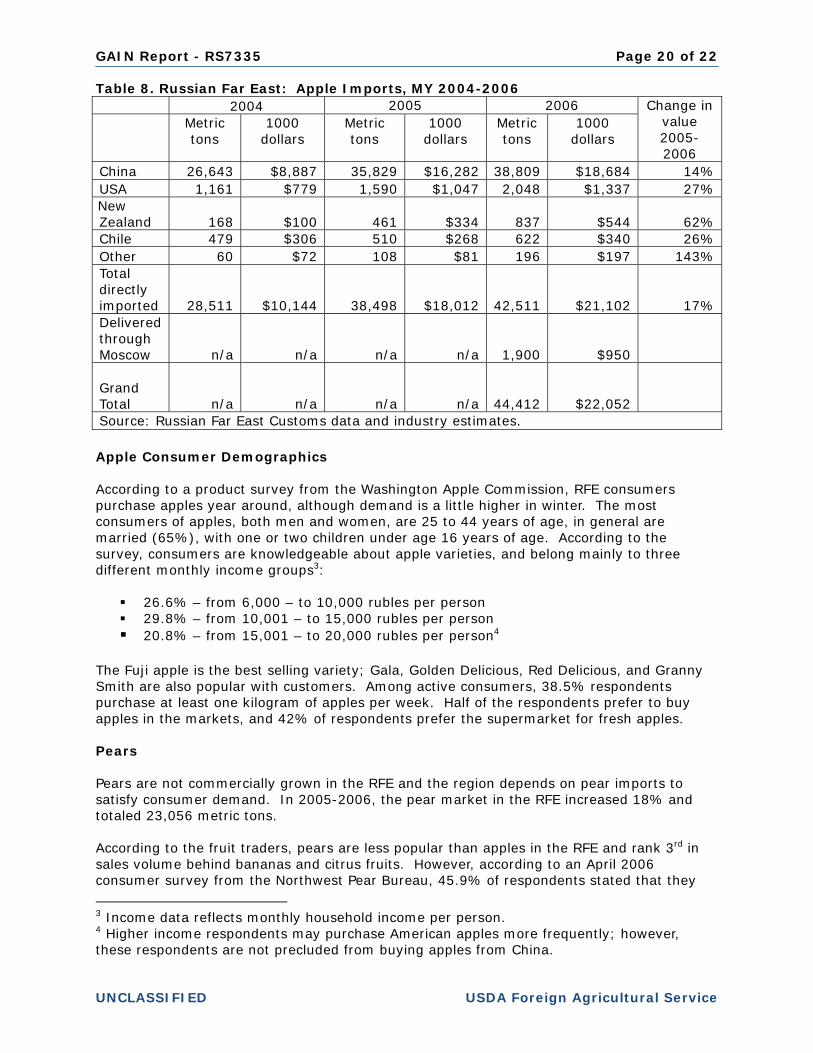
Table 8. Russian Far East: Apple Imports, MY 2004-2006 2004 2005 2006
Metric tons
1000 dollars
Metric tons
1000 dollars
Metric tons
1000 dollars
Change in value 2005-2006
China 26,643 $8,887 35,829 $16,282 38,809 $18,684 14% USA 1,161 $779 1,590 $1,047 2,048 $1,337 27%
New Zealand 168 $100 461 $334 837 $544 62% Chile 479 $306 510 $268 622 $340 26% Other 60 $72 108 $81 196 $197 143% Total directly imported 28,511 $10,144 38,498 $18,012 42,511 $21,102 17% Delivered through Moscow n/a
n/a
n/a
n/a 1,900 $950
Grand Total n/a
n/a
n/a
n/a 44,412 $22,052 Source: Russian Far East Customs data and industry estimates. Apple Consumer Demographics According to a product survey from the Washington Apple Commission, RFE consumers purchase apples year around, although demand is a little higher in winter. The most consumers of apples, both men and women, are 25 to 44 years of age, in general are married (65%), with one or two children under age 16 years of age. According to the survey, consumers are knowledgeable about apple varieties, and belong mainly to three different monthly income groups3:
! 26.6% – from 6,000 – to 10,000 rubles per person ! 29.8% – from 10,001 – to 15,000 rubles per person ! 20.8% – from 15,001 – to 20,000 rubles per person4
The Fuji apple is the best selling variety; Gala, Golden Delicious, Red Delicious, and Granny Smith are also popular with customers. Among active consumers, 38.5% respondents purchase at least one kilogram of apples per week. Half of the respondents prefer to buy apples in the markets, and 42% of respondents prefer the supermarket for fresh apples. Pears Pears are not commercially grown in the RFE and the region depends on pear imports to satisfy consumer demand. In 2005-2006, the pear market in the RFE increased 18% and totaled 23,056 metric tons. According to the fruit traders, pears are less popular than apples in the RFE and rank 3rd in sales volume behind bananas and citrus fruits. However, according to an April 2006 consumer survey from the Northwest Pear Bureau, 45.9% of respondents stated that they
3 Income data reflects monthly household income per person. 4 Higher income respondents may purchase American apples more frequently; however, these respondents are not precluded from buying apples from China.

GAIN Report - RS7335 Page 21 of 22
UNCLASSIFIED USDA Foreign Agricultural Service
purchase pears if apples are not available. China is the largest supplier of pears to the RFE with 84% of the market share; and China’s Bartlett variety is similar to U.S. variety. The U.S. market share of the pear market is smaller; however U.S. pears are growing in popularity. In 2006 the U.S. had 10% of the RFE pear market and exported 2,383 metric tons. In 2005-2006 the value of U.S. pear exports increased 39% as consumers demanded more pears from the U.S. at premium prices. Table 9. Russian Far East: Pear Imports, MY 2004-2006 2004 2005 2006
Metric tons
1000 dollars
Metric tons
1000 dollars
Metric tons
1000 dollars
Change in Value 2005-2006
China 13,320 $4,444 17,914 $8,141 19,404 $9,342 14% USA 1,584 $927 1,850 $1,062 2,382 $1,483 39%
Argentina 70 $77 Total directly imported 14,904 $5,371 19,764 $9,203 21,856 $10,902 18% Delivered through Moscow n/a
n/a
n/a
n/a 1,200 $1,050
Grand Total n/a
n/a
n/a
n/a 23,056 $11,952 Source: Russian Far East Customs data and industry estimates. Pear Consumer Demographics According to research from the U.S. North West Pear Bureau, 62.1% of respondents purchase pears at least once a week, yet less that 50% of respondents recognized different pear varieties; however among knowledgeable respondents, consumers mentioned Anjou, Abbat, and Conference pears 28.5%, 13%, and 9.8% respectfully. The survey also indicated that 49.7% respondents purchase pears in the market, while 43% purchase pears from the supermarket. Other Relevant Reports RS7334 2007 Exporter Guide (publication pending) RS7069 Annual FAIRS Export Certificate Report http//www.fas.usda.gov/gainfiles/200710/146292717.pdf RS7061 FAIRS Country Report http//www.fas.usda.gov/gainfiles/200709/146292471.pdf RS7011 List of Products that Require Quarantine and Phytosanitary Certificates http://www.fas.usda.gov/gainfiles/200707/146291722.pdf RS7311 Logistics and Transportation: St. Petersburg Port Congestion http://www.fas.usda.gov/gainfiles/200705/146280991.pdf

GAIN Report - RS7335 Page 22 of 22
UNCLASSIFIED USDA Foreign Agricultural Service
RS7302 Transportation and Logistics: St. Petersburg Port Overloaded http://www.fas.usda.gov/gainfiles/200702/146280217.pdf RS6314 2006 Fresh Deciduous Fruit – Six Years of Consistent Market Growth http://www.fas.usda.gov/gainfiles/200609/146228945.pdf RS5307 2005 Fresh Deciduous Fruit Annual Report – Russia Fruit Imports Soar http://www.fas.usda.gov/gainfiles/200510/146131221.pdf RS5026 2005 FAIRS Product Specific Selected Fruits and Vegetables http://www.fas.usda.gov/gainfiles/200504/146119318.pdf


