
146293117
19
Scheduled Report - Public distribution Date: 11/28/2007 GAIN Report Number: RS7334 RS7334 Russian Federation Exporter Guide Annual 2007 Approved by: Allan Mustard American Embassy Prepared by: Daniil Schultz and Mikael Pyrtel Report Highlights: Russian imports of major agricultural and food products (HS codes 01-24) grew 38% in the first half of 2007 over the same period in 2006. This phenomenal growth is due to Russia's rapid economic growth and rising consumer demand. Imports of fresh and dried fruits, nuts, fish, seafood, and animal genetics are growing rapidly; imports of meat continue to enjoy strong demand despite official efforts to curb them. Includes PSD Changes: No Includes Trade Matrix: No Annual Report Moscow ATO [RS4] [RS] USDA Foreign Agricultural Service GAIN Report Global Agriculture Information Network Template Version 2.09
Transcript of 146293117

Scheduled Report - Public distribution
Date: 11/28/2007
GAIN Report Number: RS7334
RS7334
Russian Federation
Exporter Guide
Annual
2007 Approved by: Allan Mustard American Embassy
Prepared by: Daniil Schultz and Mikael Pyrtel Report Highlights: Russian imports of major agricultural and food products (HS codes 01-24) grew 38% in the first half of 2007 over the same period in 2006. This phenomenal growth is due to Russia's rapid economic growth and rising consumer demand. Imports of fresh and dried fruits, nuts, fish, seafood, and animal genetics are growing rapidly; imports of meat continue to enjoy strong demand despite official efforts to curb them.
Includes PSD Changes: No Includes Trade Matrix: No
Annual Report Moscow ATO [RS4]
[RS]
USDA Foreign Agricultural Service
GAIN ReportGlobal Agriculture Information Network
Template Version 2.09

GAIN Report - RS7334 Page 2 of 19
UNCLASSIFIED USDA Foreign Agricultural Service
SECTION I. Market Overview...................................................................................3
Figure 1: Increasing value of U.S. agricultural exports to the Russian Federation ..........3 Table 1. Russia: Growth in Agricultural Imports ........................................................3 Table 2. Russia: Advantages and Challenges for U.S. Exporters ..................................4
SECTION II. Exporter Business Tips ........................................................................5 Trade Shows in Russia ..............................................................................................5 Distribution Channels ...............................................................................................6
Figure 2. Russia: Distribution channel for supermarkets, import of transatlantic products via the Port of Greater St. Petersburg ......................................................................6 Figure 3. Russia: Distribution channel for supermarkets, delivery from Europe ............7
Logistics and Transportation ......................................................................................7 Credit and Payment Terms ........................................................................................7 Food Standards and Regulations ................................................................................8 Pricing....................................................................................................................8
SECTION III. Market Sector Structure and Trends .................................................9 Retail Food Sector....................................................................................................9 Hotel, Restaurant, and Institutional (HRI) Sector .........................................................9 Food Processing Sector.............................................................................................9
SECTION IV. Best High-Value Product Prospects....................................................9 Table 3. Russia: Suggested best prospects for U.S. exporters, by sector ....................10
SECTION V. Key Contacts and Further Information ...............................................12 Other Useful Contacts: ...........................................................................................14
APPENDIX I. Statistics...........................................................................................16 Table A: Russia: Key Trade and Demographic Information........................................16 Table B: Consumer Food and Edible Fishery Product Imports....................................17 Table C. Russia: Top 15 Suppliers of Consumer Foods & Edible Fishery Products ..........18
Other Relevant Reports ..........................................................................................18

GAIN Report - RS7334 Page 3 of 19
UNCLASSIFIED USDA Foreign Agricultural Service
SECTION I. Market Overview Russian agricultural imports as of June 2007 were up approximately 38% over year-previous levels. This phenomenal growth is fueled by continued rapid economic growth. The Russian Federation is among the top export destinations for U.S. agricultural products. High world prices for oil and natural gas, and sustained investment spending, are contributing to average real GDP growth of 7% in 2007 and rising consumer incomes. According to analysts, from 2002 – 2006, Russia’s real GDP increased 30% from ($US) 286.8 billion to 373.2 billion1.The U.S. is Russia’s tenth largest trade partner. Total bilateral trade increased by 12.8% in 2007 to $7.7 billion. Rising incomes and a growing middle class are demanding higher-quality products, and U.S. food exports are more competitive as the ruble appreciates against the U.S. dollar. Figure 1: Increasing value of U.S. agricultural exports to the Russian Federation
Source: FAS BICO trade statistics. Note: These figures are based on U.S. Customs export data, and will differ from World Trade Atlas data on Russian imports from the U.S., which are based on Russian Customs import data. Year-on-year and average annual growth in Russian agricultural imports can be seen in the following table: Table 1. Russia: Growth in Agricultural Imports 2002 2003 2004 2005 2006 Agricultural Imports, billion dollars1 10.1 11.6 13.3 16.9 21.1 Growth Year on Year 14.5% 15.1% 26.4% 24.9% 5-Year Average Annual Growth Rate 15.8%
1 Total agricultural imports include HS codes 01-24 plus natural fibers, hides, skins, natural rubber, and forest products. Source: World Trade Atlas
The Russian chapter of the American Chamber of Commerce includes almost 800 member American companies successfully operating in Russia, including Mars, DuPont, Wrigley, John 1 Base year 2000

GAIN Report - RS7334 Page 4 of 19
UNCLASSIFIED USDA Foreign Agricultural Service
Deere, and many others. The Chamber also reports that:
• Half of American companies surveyed reported that sales increased 200% in Russia from 2001 to 2005;
• Two-thirds of American companies operating in Russia report that profitability is on or above target;
• American companies in Russia are helping to bridge the “values gap” between Russia and the U.S. by consistently and strongly communicating key business values, such as legal compliance, merit-based compensation, strong business ethics and corporate social responsibility;
• 92% of U.S. companies surveyed in Russia believe that continued commercial engagement with Russia is positive for American business, and 86% believe that Russia’s membership in the WTO will bring new opportunities.
Despite the success of U.S. businesses operating in Russia, competition is increasing for Russian consumers. In addition, economic vulnerabilities and existing trade barriers (particularly non-tariff measures) can affect trade flows. Exporters should review some of the advantages and challenges of the Russian market (see Table 1 below) when considering their marketing strategy. Table 2. Russia: Advantages and Challenges for U.S. Exporters
Advantages Challenges
Paying in dollars is advantageous for exporting to Russia compared to Europe due to the lower cost of the dollar relative to the Euro.
Government bureaucracy and corruption. Contradictory and overlapping regulations. Official government opposition to growth in food imports.
In 2008 Russia will become the largest consumer market in Europe, according to a recent Troika Dialogue Report.
Economic vulnerability, dependence on oil and mineral extraction for most wealth.
Russian trade and investment policy is converging with international standards.
Continuing debate over World Trade Organization (WTO) accession and adherence to non-tariff barriers such as unscientific sanitary and phytosanitary restrictions hold trade below potential.
New format store chains are rapidly expanding to meet consumer demand, thus creating a good venue for imported products.
Misperception among Russian consumers about imported goods, specifically Russian consumers lack knowledge about the quality and benefits of U.S. agricultural products.
Greater emphasis on value-added production in food processing creates opportunities for new products.
Limited acceptance of agricultural biotechnology.
Investors are building more efficient storage facilities, improve infrastructure and logistics.
Distance is a major barrier complicating logistics.
Fast food service and restaurants develop at incredible rate, demanding new products.
American products face stiff competition in Russia from European, Asian and Latin American suppliers.

GAIN Report - RS7334 Page 5 of 19
UNCLASSIFIED USDA Foreign Agricultural Service
SECTION II. Exporter Business Tips The best entry strategy for new exporters depends on several factors, including the target market, economic conditions, and regulatory environment of the host country. Exporters can request a brief market assessment for their products and/or a list of Russian importers from the ATO Moscow, St. Petersburg and Vladivostok. Additionally, ATO Moscow offers the following recommendations to help exporters select the best approach for their firm:
! Establish a Representative Office: One of the best ways exporters can conduct business in Russia is to open a representative office (RO) in Moscow; a city that hosts a large concentration of retailers and representative offices.
! Work with a Russian Importer: Selecting the right trade partner is one of the
most important decisions for exporters developing their business in Russia. Working with a local partner in Russia significantly expands business opportunities, and minimizes the need for exporters to establish direct contact with multiple retail chains. A local Russian partner familiar with market conditions and the regulatory environment can help exporters navigate the Russian retail market, resolve issues, and increase the likelihood of success. Exporters representing U.S. companies may contact the Moscow ATO for assistance in locating importers. Performing due diligence is important, such as verifying banking and supplier references of potential importers, and local and U.S.-based organizations in Russia can provide helpful information to exporters. However, credit reporting is a relatively new practice in Russia, and credit-reporting agencies may not have complete information on potential Russian business partners. Retail chains may be another valuable source for exporters collecting information on importers.
! Provide Sales Support: Exporters must help market the products they sell in Russia. Russian importers and wholesalers expect exporters to participate in the sales process, either by providing event marketing support, advertising assistance, training, packaging/handling advice, or point of sales materials.
! Attend Promotional Events: One of the main challenges to exporters entering the
Russian market is product promotion. A cost-effective way exporters can promote their products is to participate in the largest general food and beverage trade show in Russia, World Food Moscow, held annually in September. Virtually all large food and beverage producers and importers participate in this show. If exporters are targeting specific regions within Russia, the Moscow ATO recommends participating in regional exhibitions. Participation fees for regional exhibitions are lower, and are aimed at local consumers and retail food chains. The Russian retail market is competitive; exporters should allocate time to visit Russia and earmark funds in their sales plans for promotional support.
Trade Shows in Russia Participation in one of several established trade shows in Russia allows exporters to take a first-hand look at the local market, to meet potential importers, and to gauge the competitiveness of their products compared to similar products promoted at the show. World Food Moscow September www.world-food.ru/eng

GAIN Report - RS7334 Page 6 of 19
UNCLASSIFIED USDA Foreign Agricultural Service
This USDA-endorsed event offers an excellent opportunity to introduce U.S. food products in Russia. In 2007, this 4-day show drew 1,320 exhibitors from 53 countries and attracted more than 53,000 importers, wholesalers, retailers, and processors from all parts of Russia and from many neighboring countries. Golden Autumn Moscow, All-Russian Exhibition Center October www.goldenautumn.ru The Golden Autumn trade show is organized by the Russian Ministry of Agriculture, and is the largest Russian trade show for production agriculture. In 2007 Golden Autumn featured 1,377 exhibitors from 28 foreign countries as well as Russia, and drew 65,944 visitors, of whom 65% were agricultural specialists. At this annual trade show, the USDA pavilion displays animal and plant genetics, high-grade feeds, animal nutrients, and additives. Prodexpo Moscow February http://www-eng.expocentr.ru/site/95/default.asp?section=3 Prodexpo is Moscow’s largest international trade show highlighting foodstuffs in Russia and Eastern Europe. In 2007, Prodexpo hosted 2,183 exhibitors from 61 countries and attracted 113,070 visitors. Distribution Channels Traditionally Russian retailers offered consumers relatively few imported food products. However the entry of large supermarket and hypermarket chains is changing the product mix in stores and effecting food distribution networks in Russia. Increasingly, large retailers are buying in bulk directly from local manufacturers and importers, and in response distributors are consolidating to meet the growing demand of larger retail chains. Figure 2. Russia: Distribution channel for supermarkets, import of transatlantic products via the Port of Greater St. Petersburg
Ocean vessel arrives in Europe
(Hamburg/ Bremen/
Amsterdam/ Rotterdam/ Antwerp)
Transfer of
products on feeder
Feeder vessel arrives in the
Port of Greater St. Petersburg
Importer’s Warehouse
Importer’s packaging
facility
Intermediary's packing facility
Retailer

GAIN Report - RS7334 Page 7 of 19
UNCLASSIFIED USDA Foreign Agricultural Service
Figure 3. Russia: Distribution channel for supermarkets, delivery from Europe
Ocean vessel arrives in Europe
(Hamburg/ Bremen/
Amsrterdam/ Rotterdam/ Antwerp)
Transfer of
products on feeder
Importer’s Warehouse
Importer’s packaging
facility
Intermediary's packing facility
Retailer
Logistics and Transportation Imported products arrive in Russia via land, sea, or air freight into ports or customs warehouses for clearance before proceeding to the next destination. The transportation system for shipping U.S. high value food products into Russia via St. Petersburg and Moscow is well established. Most consumer-oriented food and beverage products enter through St. Petersburg or Moscow for customs clearance. Transit times range from 20 days to 27 days depending on the origin, with an additional four days shipping time for final delivery by rail or truck to Moscow. Outside of Russia, imports are also delivered to Baltic ports and then shipped by truck or rail to St. Petersburg or Moscow. Baltic and Finnish ports offered greater efficiency, fewer problems with loss or damage, and lower port fees. However, changes in Russian import requirements have largely redirected these shipments to Russian ports: St. Petersburg, Ust-Luga, Vysotsk, Kronshtadt, Novorossiysk and Vladivostok. From Moscow or St. Petersburg, products are shipped farther into the interior via truck or rail to cities in Siberia or the Russian Far East (RFE). However, most products destined for the RFE enter through the ports of Vladivostok, Vostochnyy, Vanino, Nakhodka and Magadan. Although Vostochnyy is the region’s largest port by volume, the majority of U.S. food exports to the Russian Far East enter through Vladivostok. Credit and Payment Terms The Russian banking system continues to make strides towards complying with international standards, and many banks that are authorized to open foreign currency accounts also have general licenses enabling them to undertake a full range of foreign currency transactions. Many of these banks have correspondent banks in the United States. Further, several American and foreign banks such as Citibank, J.P. Morgan, Raffeissenbank, Societe Generale, and Credit Suisse are licensed to operate in Russia.
Securing credit can be costly, however, and there can be obstacles to securing credit in Russia if the company is 100% foreign owned. Russian bank fees are often high, and it can take much longer to open letters of credit or transfer funds than is common in the United States.

GAIN Report - RS7334 Page 8 of 19
UNCLASSIFIED USDA Foreign Agricultural Service
Prospective borrowers should expect Russian banks to request a package of documents, including a balance sheet showing profits for the last three quarters and proof of assets to mitigate the bank’s risks.
Regarding payment terms, Russian importers may not be accustomed to making a 100% pre-payment prior to shipment. As the business relationship develops, Russian importers may eventually expect exporters to ship on credit, with payment due upon arrival in the Russian port. The importer may alternatively make a pre-payment and pay the balance when the product arrives to the importer’s storage facility.
In established business relationships bank transfers are sometimes made on the basis of payment–on-delivery, or payment after an agreed number of days. A letter of credit (LC) may be used when required by the foreign supplier, but Russian importers consider LCs expensive and difficult to arrange. Documentary Collections work very well at ports, and importers are accustomed to these procedures. Nevertheless, until exporters and importers build relationships and reach a level of trust, exporters may find letters of credit worthwhile.
Credit guarantee programs offered through the United States Department of Agriculture (USDA) can help overcome some financing problems. The credit guarantee program operates with a specific country program for Russia, and Russia is also included in a separate Eurasia program. For further information on these programs, please visit the FAS website (http://www.fas.usda.gov/excredits/ecgp.asp), the FAS Moscow website (http://eng.usda.ru) or contact ATO Moscow.
Food Standards and Regulations Russia has complex food import regulations. Exporters should carefully question importers regarding certification and documentation requirements, as well as procedures for clearance of shipments into the Russian Federation. Please see the “Other Relevant Reports” section at the end of this report, and visit the ATO Moscow website http://eng.usda.ru/ Market Access page. Pricing Retail prices in Russia can vary significantly; however pricing is becoming more competitive as large retail chains increase their aggregate market share. On the regulatory side, exporters should consider the effect of the Russian tax regime when making pricing and margin decisions. Some of the taxes assessed include:
! Import duties vary by product, but generally range from about 5-30% (for Russian speakers, current import tariffs are maintained in an online database at www.tks.ru);
! An 18% value-added tax (VAT) is levied on imports at the point of entry (note: the
VAT on some food products is only 10%);
! Customs clearance charges add about 1.25% The wholesale mark-up is typically 12-15%, while retail mark-up runs 35% or more, depending on the product and the retailer;
! A 39% profit tax is assessed on gross margin.

GAIN Report - RS7334 Page 9 of 19
UNCLASSIFIED USDA Foreign Agricultural Service
SECTION III. Market Sector Structure and Trends Retail Food Sector As incomes rise in Russia consumers are purchasing more fresh products and ready-to-eat prepared foods. Most large retail chains have special facilities that clean, prepare and package foods (e.g., vegetables) into ready-to-eat portions. Larger retail chains also have their own bakeries that produce fresh breads, pizzas, and lasagnas daily, and delis offer consumers marinated fresh cutlets, ravioli, and schnitzels.
Domestic and multinational chains dominate the retail market, with domestic chains accounting for a larger market share. According to some retailers, Moscow is approaching market saturation (particularly in terms of retail space) and forcing some retailers to consider alliances with competitors, or open new stores outside of Moscow. Russia’s largest supermarket chains, Perekryostok and Pyatyorochka, completed a merger on May 19, 2006, creating the largest food retailer in Russia. The new holding company, X5, comprises 1,013 company-managed stores, with a net selling space of 429,000 square meters and net sales of $2.3 billion in 2005. Hotel, Restaurant, and Institutional (HRI) Sector Please refer to GAIN Report RS7316 for further information on the HRI sector in Russia. Food Processing Sector Russia's food processing industry is growing rapidly and is one of the most dynamic sectors in the Russian economy. Food processing companies are investing in production facilities to keep pace with demand, and analysts expect the sector to grow 10-15% per year. The demand for higher-quality ingredients is also increasing as more local food processors strive to meet international quality standards. However some companies are reporting that domestic supplies of raw materials and specialized ingredients for meat, bakery, confectionary, juice, and dairy processing are not sufficient to meet future demand. SECTION IV. Best High-Value Product Prospects
Top performing U.S. exports to Russia in 2006 and January–September 2007 include poultry and red meats2, fresh fruit, fish and seafood, and tree nuts. U.S. poultry exports are the largest contributor to the total value of agricultural exports to Russia. On average, poultry meat accounted for over 60% of the total value of U.S. agricultural exports from 2002-20063. Russians are consuming more tree nuts and fresh fruit from America, particularly the larger sizes of apples and pears. The favorite American apples in Russia are Red and Golden Delicious, and Braeburn. However, the Granny Smith apple is not as popular because Russian consumers dislike the yellow sunburn scald that appears on some fruit4. Popular American pears include Green Anjou, Red Anjou and Bartlett.
2 Fresh/Chilled/ Frozen 3 BICO trade statistics, USDA, FAS. 4 Sunburn-scald is a fruit physiological disorder caused by heat and water stress, among other factors. Granny Smith apples are more susceptible to sunburn-scald due to their light skin.

GAIN Report - RS7334 Page 10 of 19
UNCLASSIFIED USDA Foreign Agricultural Service
In winter American apples and pears are in high demand because of their flavor and longer storage life relative to other fresh fruits. Exports of U.S. tree nut increased over 78% in January - September 2007 over the same period in 20065, and retailers report that consumers are demanding dried fruits and peanut butter.
Other top U.S. export products include: wine and spirits, processed fruits and vegetables, snack foods (excluding nuts), food ingredients, and hides and skins. Cheese exports are a new opportunity, and Russia plans to increase cheese imports as part of an overall strategy to reduce food price inflation of staple products. Russian government support for improving livestock through import of genetics could create opportunities for U.S. genetics. Table 2 (below) provides additional information on food and agricultural product prospects6.
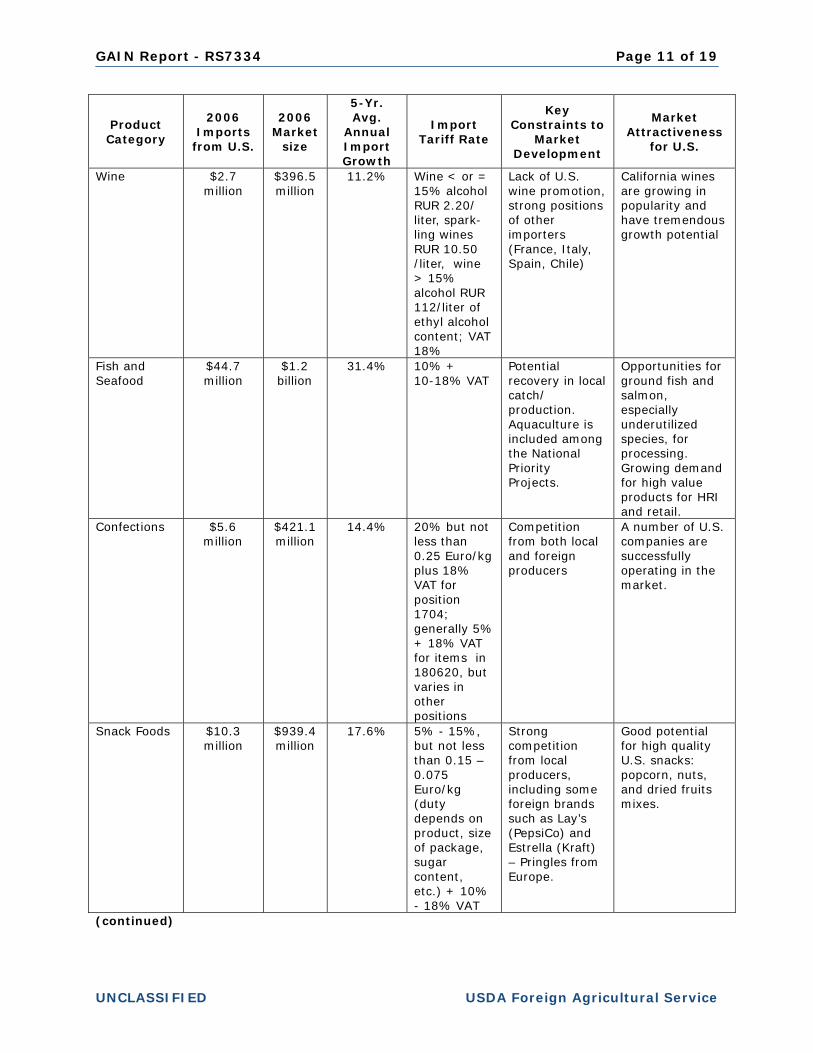
Table 3. Russia: Suggested best prospects for U.S. exporters, by sector
Product Category
2006 Imports
from U.S.
2006 Market
size
5-Yr. Avg.
Annual Import Growth
Import Tariff Rate
Key Constraints to
Market Development
Market Attractiveness
for U.S.
Fresh fruits $10.8 million
$2.7 billion
29.5% Apples: (Jan 1-Jul 31) 0.1 Euros per kg (Aug 1-Dec 31) 0.2 Euros per kg + 18% VAT
Pears: 10% + 18% VAT
See also GAIN RS6314 Strong competition from Poland, China, Chile, New Zealand, Moldova for apples; Argentina and China for pears.
Good potential as a niche market for U.S. apples, pears, grapes, citrus, especially during February- April period.
Dried fruits $1.5 million
$90.3 million
25.0% 10%, but not less than 0.02 Euros per kg + 18% VAT
Tough competition from Iran, Tajikistan, Afghanistan and Uzbekistan for bulk dried fruits.
U.S. raisins and prunes competitive for quality retail and processing market.
Tree nuts $31.6 million
174.0 million
50.0% Nuts – 29% 10% duty, 18% VAT
Iran biggest competitor for peanuts and pistachios; Tajikistan for walnuts.
U.S. almonds enjoying very strong growth. Good potential for U.S. pecans and other nuts.
(continued)
5 BICO trade statistics, USDA, FAS. 6 Food products listed in Table 3 are based on market intelligence, including discussions with retailers and data analysis efforts, and should not be considered an official endorsement by the United States Department of Agriculture or any affiliated agencies.
GAIN Report - RS7334 Page 11 of 19
UNCLASSIFIED USDA Foreign Agricultural Service
Product Category
2006 Imports
from U.S.
2006 Market
size
5-Yr. Avg.
Annual Import Growth
Import Tariff Rate
Key Constraints to
Market Development
Market Attractiveness
for U.S.
Wine $2.7 million
$396.5 million
11.2% Wine < or = 15% alcohol RUR 2.20/ liter, spark-ling wines RUR 10.50 /liter, wine > 15% alcohol RUR 112/liter of ethyl alcohol content; VAT 18%
Lack of U.S. wine promotion, strong positions of other importers (France, Italy, Spain, Chile)
California wines are growing in popularity and have tremendous growth potential
Fish and Seafood
$44.7 million
$1.2 billion
31.4% 10% + 10-18% VAT
Potential recovery in local catch/ production. Aquaculture is included among the National Priority Projects.
Opportunities for ground fish and salmon, especially underutilized species, for processing. Growing demand for high value products for HRI and retail.
Confections $5.6 million
$421.1 million
14.4% 20% but not less than 0.25 Euro/kg plus 18% VAT for position 1704; generally 5% + 18% VAT for items in 180620, but varies in other positions
Competition from both local and foreign producers
A number of U.S. companies are successfully operating in the market.
Snack Foods $10.3 million
$939.4 million
17.6% 5% - 15%, but not less than 0.15 – 0.075 Euro/kg (duty depends on product, size of package, sugar content, etc.) + 10% - 18% VAT
Strong competition from local producers, including some foreign brands such as Lay’s (PepsiCo) and Estrella (Kraft) – Pringles from Europe.
Good potential for high quality U.S. snacks: popcorn, nuts, and dried fruits mixes.
(continued)

GAIN Report - RS7334 Page 12 of 19
UNCLASSIFIED USDA Foreign Agricultural Service
Product Category
2006 Imports
from U.S.
2006 Market
size
5-Yr. Avg.
Annual Import Growth
Import Tariff Rate
Key Constraints to
Market Development
Market Attractiveness
for U.S.
Rice $3.1 million
$113.2 million
16.9% 10%, but not less than 0.03 Euros per kilo + 10% VAT
Ban on U.S. rice due to adventi-tious presence of LL601 biotech event. Local production and low-priced competition from China and Vietnam
Opportunity for high quality U.S. rice, wild rice in HRI and retail.
Pet food $7.8 million
$103.7 million
36.7% 20%, but not less than 0.16 Euros/kg + 18% VAT
Strong local production - Mars has two plants that produce Whis-kas, Kitekat, Pedigree; Nestle’s Purina produces Friskies and Darling locally; other imported and local brands.
Strong growth in demand.
Animal genetics (excluding embryos, data for which not available)
$219,000 $142.2 million
62.6% Zero tariff on live brood animals + 10% VAT. 5% tariff on bull semen + 18% VAT
Veterinary protocols for embryos and live animals are under negotiation.
Bovine semen market is open. Government support makes this a large opportunity. See GAIN RS7051.
Meat (includes pork, beef, and poultry meat, and edible offal)
$599.1 million
$4.5 billion
14.4% See GAIN RS5084, RS7008 and RS7041. Tariff-rate quotas apply to some positions. Tariffs change unpredict-ably.
Veterinary controls and demands transcend international standards. Official goal of “food security” calls for reduction of meat imports.
New health certificates are in place for U.S. origin beef and pork.
Source: World Trade Atlas, U.S. Trade Database, Russian Tariff Database (www.tks.ru) SECTION V. Key Contacts and Further Information Contact Information for FAS Offices in Russia and in the United States: Dana Johnson, Director, ATO Russia (ETA February 2008) Daniil Schultz, Marketing Specialist Natalia Merinova, Administrative Assistant http://eng.usda.ru

GAIN Report - RS7334 Page 13 of 19
UNCLASSIFIED USDA Foreign Agricultural Service
Street address (for express parcels): U.S. Agricultural Trade Office American Embassy Bolshoy Devyatinskiy pereulok 8 121099 Moscow, Russia Tel: +7 (495) 728-5560; Fax: +7 (495) 728-5069 E-mail: [email protected] For mail coming from the U.S. (American officers only): Agricultural Trade Office PSC 77 AGR APO, AE 09721 For international mail, especially from Europe: Agricultural Trade Office U.S. Embassy - Box M Itainen Puistotie 14 00140 Helsinki, Finland Covering Northwest Russia (St. Petersburg):
Ksenia Evdokimova, ATO Marketing Specialist American Consulate General Nevskiy Prospekt, 25 191186 St. Petersburg, Russia Tel: 7 (812) 326-2580; Fax: 7 (812) 326-2561 E-mail: [email protected]
Covering the Russian Far East (Vladivostok):
Svetlana Ilyina, ATO Marketing Specialist American Consulate General Ulitsa Pushkinskaya, 32 690001 Vladivostok, Russia Tel: 7 (4232) 300-089; Fax: 7 (4232) 300-089 E-mail: [email protected] For General Information on FAS/USDA Market Promotion Programs and Activities:
Office of Trade Programs U.S. Department of Agriculture Foreign Agricultural Service 1400 Independence Ave., S.W. Washington, DC 20250 http://www.fas.usda.gov/OTP_contacts.asp FAS Website: www.fas.usda.gov
For Trade Policy/Market Access Issues, General Information on the Russian Agricultural Sector, etc:
Allan Mustard, Agricultural Minister-Counselor Kimberly Svec, Senior Agricultural Attache Erik Hansen, Agricultural Attache

GAIN Report - RS7334 Page 14 of 19
UNCLASSIFIED USDA Foreign Agricultural Service
Office of Agricultural Affairs American Embassy (addresses as above for ATO Moscow) Tel: 7 (495) 728-5222; Fax: 7 (495) 728-5133 or 728 5102 E-mail: [email protected] To learn more about USDA/FAS and ATO services please visit http://eng.usda.ru. Other Useful Contacts: The Agricultural Trade Office works with a large number of U.S. industry organizations, some of which have local offices to assist U.S. exporters of these food and agricultural products. You may also find these contacts listed at http://eng.usda.ru. U.S.A. Poultry and Egg Export Council (USAPEEC) E-mail: [email protected] U.S. Meat Export Federation (USMEF) E-mail: [email protected] U.S. Wheat Associates E-mail: [email protected] U.S. Grains Council (USGC) E-mail: [email protected] Pear Bureau Northwest E-mail: [email protected] Washington Apple Commission Moscow office: E-mail: [email protected] Vladivostok office: E-mail: [email protected] Almond Board of California E-mail: [email protected] Pet Food Institute E-mail: [email protected] National Renderers Association E-mail: [email protected] The American Chamber of Commerce is another good source for information on doing business in Russia. The Chamber has offices in Moscow and St. Petersburg.
American Chamber of Commerce in Russia (AmCham) Ul. Dolgorukovskaya, Building 7, 14th floor 127006 Moscow, Russia Tel: 7 (495) 961-2141; Fax: 7 (495) 961-2142 http://amcham.ru/ Email: [email protected]

GAIN Report - RS7334 Page 15 of 19
UNCLASSIFIED USDA Foreign Agricultural Service
American Chamber of Commerce in St. Petersburg 25 Nevsky Prospect, 3rd Floor 191186 St. Petersburg, Russia Tel: 7 (812) 326-2590; Fax: 7 (812) 326-2591 or 326-2561 http://amcham.ru/spb/ Email: [email protected] For questions regarding agricultural machinery, food processing and packaging equipment or materials, refrigeration equipment, and other industrial products, please contact: U.S. and Foreign Commercial Service Bolshaya Molchanovka, 23/38, Bldg. 2 121069 Moscow, Russia Tel: +7 (495) 737-5030; Fax: +7 (495) 737-5033 E-mail: [email protected]

GAIN Report - RS7334 Page 16 of 19
UNCLASSIFIED USDA Foreign Agricultural Service
APPENDIX I. Statistics
Table A: Russia: Key Trade and Demographic Information Agricultural Imports From All Countries ($Billion) 1/ 21.1
Consumer Food Imports From All Countries ($Billion) 2/ 13.2
Edible Fishery Imports From All Countries ($Million) 2/ 486.4
Total Population (Millions)/Annual Growth Rate (%) 142.2 / -0.5
Urban Population (Millions)/Annual Growth Rate (%) 103.8 / -2.9
Number of Major Metropolitan Areas 3/ 13
Size of the Middle Class (Millions)/Growth Rate (%) 4/ 26.4 / 25
Per Capita Gross Domestic Product ($US) 5/ 7,170
Unemployment Rate (%) 5/ 5.7
Percent of Female Population Employed 6/ 93.4
Exchange Rate (US$1 = RUR) as of November 2007 24.48
Unless otherwise noted, 2007 data. Source: Unless otherwise noted, Russian Federal Statistics Service (Rosstat) 1/ Source: 2006, GTI World Trade Atlas. Total agricultural imports include HS Codes 01-24
plus natural rubber, raw hides, skins and furskins, round wood and wood products, unworked animal and vegetable fibers
2/ Source: 2006, GTI World Trade Atlas. 3/ Population in excess of 1,000,000
4/ Sources: Various - based on estimate of individuals earning US$500-$2,000 per month 5/ Source: Rosstat 6/ As percentage of economically-active female population (employed or actively seeking
employment). Female workers account for 41% of the total economically-active population.

GAIN Report - RS7334 Page 17 of 19
UNCLASSIFIED USDA Foreign Agricultural Service
Table B: Consumer Food and Edible Fishery Product Imports
Imports from the World
Imports from the U.S. U.S Market Share
(Million Dollars) (Million Dollars) (Percent) 2004 2005 2006 2004 2005 2006 2004 2005 2006 CONSUMER-ORIENTED AG TOTAL 7,774.5 10,252.0 13,273.0 532.0 650.7 850.3 6.84 6.35 6.41 Snack Foods (excl. Nuts) 384.6 450.3 510.5 9.3 1.6 1.4 2.41 0.35 0.27 Breakfast Cereals & Pancake Mix 9.7 13.3 15.2 0.5 0.5 0.7 5.56 3.83 0.45 Red Meats, Fresh/Chilled/Frozen 1,469.7 2,032.5 3,388.5 29.5 59.6 171.6 2.01 2.93 5.06 Red Meats, Prepared/Preserved 71.7 70.2 93.5 3.7 2.4 4.5 5.13 3.38 4.82 Poultry Meat 663.4 847.5 921.5 396.3 487.6 545.5 59.74 57.54 59.20 Dairy Products (excl. Cheese) 285.4 303.9 290.8 0.4 1.6 1.7 0.15 0.53 0.60 Eggs & Products 22.2 38.4 50.8 0.1 0.8 1.6 0.64 2.10 3.17 Fresh Fruit 1,465.7 1,979.5 2,669.1 2.9 7.2 6.8 0.19 0.36 0.26 Fresh Vegetables 416.4 649.5 842.1 1.6 1.7 1.5 0.37 0.26 0.17 Processed Fruit & Vegetables 537.9 715.0 897.4 4.5 3.8 6.3 0.83 0.54 0.70 Fruit & Vegetable Juices 173.3 219.8 299.1 3.0 2.3 6.5 1.72 1.03 2.19 Tree Nuts 31.5 55.6 174.0 4.9 10.4 31.5 15.70 18.68 18.09 Wine & Beer 577.4 739.8 746.6 2.4 2.6 2.4 0.42 0.36 0.32 Nursery Products & Cut Flowers 182.8 246.0 363.6 0.03 0.1 0.4 0.02 0.06 0.11 Pet Foods (Dog & Cat Food) 60.7 83.3 103.7 3.8 7.0 8.2 6.24 8.41 7.92 Other Consumer-Oriented Products 960.9 1, 146.6 1, 313.0 69.1 61.4 60.3 7.19 5.36 4.59
FISH & SEAFOOD PRODUCTS 718.4 1,071.9 1,333.5 23.1 45.0 45.3 3.21 4.20 3.40 Salmon 103.5 153.1 176.8 2.5 4.3 3.5 2.46 2.82 2.01 Surimi 33.9 54.8 51.0 5.9 10.0 7.4 17.31 18.32 14.57 Crustaceans 55.3 109.8 152.0 0.1 0.1 0.1 0.15 0.05 0.03 Ground fish & Flatfish 93.7 171.4 283.3 10.6 22.7 28.7 11.34 13.22 10.12 Mollusks 19.2 27.2 39.6 0.2 0.5 0.9 1.18 1.89 2.18 Other Fishery Products 412.9 555.6 630.7 3.7 7.4 4.8 0.90 1.34 0.76
AGRICULTURAL PRODUCTS TOTAL 12,492.6 15,650.3 19,502.8 718.3 834.3 1,026.5 5.75 5.33 5.26 AGRICULTURAL, FISH & FORESTRY 13,345.3 16,868.9 21,072.7 743.2 883.4 1,073.0 5.57 5.24 5.09
Source: World Trade Atlas

GAIN Report - RS7334 Page 18 of 19
UNCLASSIFIED USDA Foreign Agricultural Service
Table C. Russia: Top 15 Suppliers of Consumer Foods & Edible Fishery Products FISH & SEAFOOD PRODUCTS (U.S. Dollars) CONSUMER-ORIENTED AG TOTAL (U.S. Dollars) 2004 2005 2006 2004 2005 2006 World 718,392,141 1,071,944,399 1,333,454,785 World 7,774,460,417 10,252,324,214 13,273,325,639 Norway 306,251,081 448,436,153 437,305,900 Brazil 781,029,077 1,286,929,600 1,465,455,109 China 40,157,384 80,196,020 130,840,371 United States 532,045,985 650,661,979 850,265,329 Vietnam 5,947,200 23,182,013 107,065,927 Germany 518,179,183 638,808,964 844,553,017 Denmark 39,229,025 64,368,893 89,893,837 Denmark 39,229,025 64,368,893 89,893,837 United Kingdom 45,017,014 34,993,712 55,185,705 Netherlands 312,175,204 384,936,172 588,223,518 Chile 15,430,237 33,996,052 52,986,573 Ukraine 837,953,282 989,294,735 568,804,884 Iceland 18,464,908 23,430,194 45,990,555 Ecuador 361,699,510 463,258,871 528,132,062 United States 23,063,443 45,025,464 45,335,878 China 271,488,630 392,014,646 520,467,791 Canada 14,669,321 33,934,819 42,564,231 Poland 439,659,089 495,923,497 481,741,393 Mauritania 25,635,920 38,669,142 36,741,039 Uzbekistan 230,961,141 328,430,947 481,288,418 Thailand 9,000,481 21,775,981 34,167,408 Turkey 180,234,399 313,896,461 461,224,404 Latvia 30,064,337 35,621,627 32,294,015 France 285,852,927 321,357,869 456,269,302 Argentina 13,356,608 31,174,184 24,602,132 Denmark 105,924,296 140,195,893 400,998,465 Faroe Islands 2,367,233 3,061,437 24,432,088 Spain 210,061,839 228,202,304 380,612,393
Source: World Trade Atlas Other Relevant Reports Attaché reports on the Russian food and agricultural market are available on the FAS website; the search engine can be found at http://www.fas.usda.gov/scriptsw/AttacheRep/default.asp. RS7081 Products Subject to Border Veterinary Inspection http//www.fas.usda.gov/gainfiles/200711/146292933.pdf RS7073 Poultry and Products Annual http://www.fas.usda.gov/gainfiles/200710/146292768.pdf RS7069 Annual FAIRS Export Certificate Report http//www.fas.usda.gov/gainfiles/200710/146292717.pdf RS7067 Livestock and Products Annual http://www.fas.usda.gov/gainfiles/200710/146292718.pdf RS7066 Fishery Products Annual http://www.fas.usda.gov/gainfiles/200710/146292593.pdf RS7323 FAIRS Product Specific / Wine http://www.fas.usda.gov/gainfiles/200707/146291722.pdf RS7061 FAIRS Country Report http//www.fas.usda.gov/gainfiles/200709/146292471.pdf RS7054 July Rice Update http://www.fas.usda.gov/gainfiles/200707/146291832.pdf RS7051 Government Program for Agriculture and for Market Regulation 2008-2012 http://www.fas.usda.gov/gainfiles/200707/146291764.pdf RS7045 Rice Situation Update http://www.fas.usda.gov/gainfiles/200706/146291500.pdf

GAIN Report - RS7334 Page 19 of 19
UNCLASSIFIED USDA Foreign Agricultural Service
RS7041 Russia Increases Import Quota for Pork http://www.fas.usda.gov/gainfiles/200705/146281199.pdf RS7011 List of Products that Require Quarantine and Phytosanitary Certificates http://www.fas.usda.gov/gainfiles/200707/146291722.pdf RS7008 Russia Lowers Out-of-Quota Import Duties on Beef http://www.fas.usda.gov/gainfiles/200701/146280054.pdf RS6321 Growing Russian consumerism propels retail increases http//www.fas.usda.gov/gainfiles/200612/146269877.pdf RS6314 Fresh Deciduous Fruit / Six years of consistent market growth http://www.fas.usda.gov/gainfiles/200609/146228945.pdf RS6069 VPSS Eases Rice Import Ban for Shipments On the Water http://www.fas.usda.gov/gainfiles/200612/146269766.pdf RS6066 Russia Temporarily Bans Rice Imports http://www.fas.usda.gov/gainfiles/200612/146249713.pdf RS5084 Meat Tariff Rate Quota Decree Issued http://www.fas.usda.gov/gainfiles/200512/146131752.pdf RS5026 FAIRS Product Specific / Selected Fruits and Vegetables http//www.fas.usda.gov/gainfiles/200504/146119318.pdf RS5025 FAIRS Product Specific / Quarantine Regulations for Plant Products http//www.fas.usda.gov/gainfiles/200504/146119321.pdf RS5009 FAIRS Product Specific / Beer and Wine http//www.fas.usda.gov/gainfiles/200502/146118765.pdf RS5008 FAIRS Product Specific / Fish and Seafood Products http//www.fas.usda.gov/gainfiles/200502/146118935.pdf


