146 IEEE TRANSACTIONS ON MEDICAL IMAGING,...
13
146 IEEE TRANSACTIONS ON MEDICAL IMAGING, VOL. 30, NO. 1, JANUARY 2011 A New Supervised Method for Blood Vessel Segmentation in Retinal Images by Using Gray-Level and Moment Invariants-Based Features Diego Marín, Arturo Aquino*, Manuel Emilio Gegúndez-Arias, and José Manuel Bravo Abstract—This paper presents a new supervised method for blood vessel detection in digital retinal images. This method uses a neural network (NN) scheme for pixel classification and computes a 7-D vector composed of gray-level and moment invariants-based features for pixel representation. The method was evaluated on the publicly available DRIVE and STARE databases, widely used for this purpose, since they contain retinal images where the vascular structure has been precisely marked by experts. Method performance on both sets of test images is better than other existing solutions in literature. The method proves especially accurate for vessel detection in STARE images. Its application to this database (even when the NN was trained on the DRIVE database) outperforms all analyzed segmentation approaches. Its effectiveness and robustness with different image conditions, together with its simplicity and fast implementation, make this blood vessel segmentation proposal suitable for retinal image computer analyses such as automated screening for early diabetic retinopathy detection. Index Terms—Diabetic retinopathy, moment invariants, retinal imaging, telemedicine, vessels segmentation. I. INTRODUCTION D IABETIC retinopathy (DR) is the leading ophthalmic pathological cause of blindness among people of working age in developed countries [1]. It is provoked by diabetes-mel- litus complications and, although diabetes affection does not necessarily involve vision impairment, about 2% of the patients affected by this disorder are blind and 10% undergo vision degradation after 15 years of diabetes [2], [3] as a consequence of DR complications. The estimated prevalence of diabetes for all age groups worldwide was 2.8% in 2000 and 4.4% in 2030, meaning that the total number of diabetes patients is forecasted to rise from 171 million in 2000 to 366 million in 2030 [4]. The main cause of DR is abnormal blood glucose level elevation, which damages vessel endothelium, thus increasing Manuscript received July 02, 2010; accepted July 28, 2010. Date of publi- cation August 09, 2010; date of current version December 30, 2010. Asterisk indicates corresponding author. D. Marín and J. M. Bravo are with the Department of Electronic, Computer Science and Automatic Engineering, ”La Rábida” Polytechnic School, Univer- sity of Huelva, 21819 Palos de la Frontera, Spain (e-mail: diego.marin@diesia. uhu.es; [email protected]). *A. Aquino iswith the Department of Electronic, Computer Science and Au- tomatic Engineering, ”La Rábida” Polytechnic School, University of Huelva, 21819 Palos de la Frontera, Spain (e-mail: [email protected]). M. E. Gegúndez-Arias is with the Department of Mathematics, ”La Rábida” Polytechnic School, University of Huelva, 21819 Palos de la Frontera, Spain (e-mail: [email protected]). Digital Object Identifier 10.1109/TMI.2010.2064333 vessel permeability. The first manifestations of DR are tiny capillary dilations known as microaneurysms. DR progression also causes neovascularization, hemorrhages, macular edema and, in later stages, retinal detachment. Although DR is not a curable disease, laser photocoagulation can prevent major vision loss if detected in early stages [1], [5]. However, DR patients perceive no symptoms until visual loss develops, usually in the later disease stages, when the treatment is less effective. So, to ensure the treatment is received in time, diabetic patients need annual eye-fundus examination [6]. How- ever, this preventive action involves a huge challenge for Health Systems due to the huge number of patients needing ophthal- mologic revision, thus preventing many patients from receiving adequate treatment. Therefore, DR also becomes a great eco- nomic problem for Administrations since, only in U.S., cost of ophthalmic chronic complications caused by diabetes exceeded 1 billion dollars in 2007 [7]. The employment of digital images for eye diseases diagnosis could be exploited for computerized early detection of DR. A system that could be used by nonexperts to filtrate cases of pa- tients not affected by the disease, would reduce the specialists’ workload, and increase the effectiveness of preventive proto- cols and early therapeutic treatments. Furthermore, it would also result in economic benefits for public Health Systems, since cost-effective treatments associated to early illness detection lead to remarkable cost savings [8]. Since vascular anomalies are one of DR manifestations, automatic assessment of eye-fundus blood vessels is necessary for automated detection of DR. As a previous step, vessel assessment demands vascular tree segmentation from the background for further processing. Knowledge on blood vessel location can be used to reduce the number of false positives in microaneurysm and hemorrhage detection [9]–[12]. Besides these applications motivated by automated early detection of DR, vascular tree segmentation proves useful for other clinical purposes: evaluation of the retinopathy of prematurity [15], arteriolar narrowing [16], [17], vessel tortuosity to characterize hypertensive retinopathy [18], vessel diameter measurement to diagnose hypertension and cardiovascular diseases [19]–[21], and computer-assisted laser surgery [22], [23], among others. On the other hand, the vascular tree can also be useful as valuable information to locate other fundus features such as the optic disc [24]–[26] and the fovea [27]. Moreover, it may serve as a mean for the registration of multimodal images [13], [14]. In this paper, a new methodology for blood vessel detec- tion is presented. It is based on pixel classification using a 7-D 0278-0062/$26.00 © 2010 IEEE
Transcript of 146 IEEE TRANSACTIONS ON MEDICAL IMAGING,...
146 IEEE TRANSACTIONS ON MEDICAL IMAGING, VOL. 30, NO. 1, JANUARY 2011
A New Supervised Method for Blood VesselSegmentation in Retinal Images by Using Gray-Level
and Moment Invariants-Based FeaturesDiego Marín, Arturo Aquino*, Manuel Emilio Gegúndez-Arias, and José Manuel Bravo
Abstract—This paper presents a new supervised method forblood vessel detection in digital retinal images. This method uses aneural network (NN) scheme for pixel classification and computesa 7-D vector composed of gray-level and moment invariants-basedfeatures for pixel representation. The method was evaluated onthe publicly available DRIVE and STARE databases, widelyused for this purpose, since they contain retinal images wherethe vascular structure has been precisely marked by experts.Method performance on both sets of test images is better thanother existing solutions in literature. The method proves especiallyaccurate for vessel detection in STARE images. Its applicationto this database (even when the NN was trained on the DRIVEdatabase) outperforms all analyzed segmentation approaches.Its effectiveness and robustness with different image conditions,together with its simplicity and fast implementation, make thisblood vessel segmentation proposal suitable for retinal imagecomputer analyses such as automated screening for early diabeticretinopathy detection.
Index Terms—Diabetic retinopathy, moment invariants, retinalimaging, telemedicine, vessels segmentation.
I. INTRODUCTION
D IABETIC retinopathy (DR) is the leading ophthalmicpathological cause of blindness among people of working
age in developed countries [1]. It is provoked by diabetes-mel-litus complications and, although diabetes affection does notnecessarily involve vision impairment, about 2% of the patientsaffected by this disorder are blind and 10% undergo visiondegradation after 15 years of diabetes [2], [3] as a consequenceof DR complications. The estimated prevalence of diabetes forall age groups worldwide was 2.8% in 2000 and 4.4% in 2030,meaning that the total number of diabetes patients is forecastedto rise from 171 million in 2000 to 366 million in 2030 [4].
The main cause of DR is abnormal blood glucose levelelevation, which damages vessel endothelium, thus increasing
Manuscript received July 02, 2010; accepted July 28, 2010. Date of publi-cation August 09, 2010; date of current version December 30, 2010. Asteriskindicates corresponding author.
D. Marín and J. M. Bravo are with the Department of Electronic, ComputerScience and Automatic Engineering, ”La Rábida” Polytechnic School, Univer-sity of Huelva, 21819 Palos de la Frontera, Spain (e-mail: [email protected]; [email protected]).
*A. Aquino iswith the Department of Electronic, Computer Science and Au-tomatic Engineering, ”La Rábida” Polytechnic School, University of Huelva,21819 Palos de la Frontera, Spain (e-mail: [email protected]).
M. E. Gegúndez-Arias is with the Department of Mathematics, ”La Rábida”Polytechnic School, University of Huelva, 21819 Palos de la Frontera, Spain(e-mail: [email protected]).
Digital Object Identifier 10.1109/TMI.2010.2064333
vessel permeability. The first manifestations of DR are tinycapillary dilations known as microaneurysms. DR progressionalso causes neovascularization, hemorrhages, macular edemaand, in later stages, retinal detachment.
Although DR is not a curable disease, laser photocoagulationcan prevent major vision loss if detected in early stages [1], [5].However, DR patients perceive no symptoms until visual lossdevelops, usually in the later disease stages, when the treatmentis less effective. So, to ensure the treatment is received in time,diabetic patients need annual eye-fundus examination [6]. How-ever, this preventive action involves a huge challenge for HealthSystems due to the huge number of patients needing ophthal-mologic revision, thus preventing many patients from receivingadequate treatment. Therefore, DR also becomes a great eco-nomic problem for Administrations since, only in U.S., cost ofophthalmic chronic complications caused by diabetes exceeded1 billion dollars in 2007 [7].
The employment of digital images for eye diseases diagnosiscould be exploited for computerized early detection of DR. Asystem that could be used by nonexperts to filtrate cases of pa-tients not affected by the disease, would reduce the specialists’workload, and increase the effectiveness of preventive proto-cols and early therapeutic treatments. Furthermore, it would alsoresult in economic benefits for public Health Systems, sincecost-effective treatments associated to early illness detectionlead to remarkable cost savings [8].
Since vascular anomalies are one of DR manifestations,automatic assessment of eye-fundus blood vessels is necessaryfor automated detection of DR. As a previous step, vesselassessment demands vascular tree segmentation from thebackground for further processing. Knowledge on blood vessellocation can be used to reduce the number of false positives inmicroaneurysm and hemorrhage detection [9]–[12]. Besidesthese applications motivated by automated early detection ofDR, vascular tree segmentation proves useful for other clinicalpurposes: evaluation of the retinopathy of prematurity [15],arteriolar narrowing [16], [17], vessel tortuosity to characterizehypertensive retinopathy [18], vessel diameter measurement todiagnose hypertension and cardiovascular diseases [19]–[21],and computer-assisted laser surgery [22], [23], among others.On the other hand, the vascular tree can also be useful asvaluable information to locate other fundus features such as theoptic disc [24]–[26] and the fovea [27]. Moreover, it may serveas a mean for the registration of multimodal images [13], [14].
In this paper, a new methodology for blood vessel detec-tion is presented. It is based on pixel classification using a 7-D
0278-0062/$26.00 © 2010 IEEE
MARÍN et al.: A NEW SUPERVISED METHOD FOR BLOOD VESSEL SEGMENTATION IN RETINAL IMAGES 147
feature vector extracted from preprocessed retinal images andgiven as input to a neural network. Classification results (realvalues between 0 and 1) are thresholded to classify each pixelinto two classes: vessel and nonvessel. Finally, a postprocessingfills pixel gaps in detected blood vessels and removes falsely-de-tected isolated vessel pixels.
Despite its simplicity, the high accuracy achieved by thismethod in blood vessel detection is comparable to that reportedby the most accurate methods in literature. Moreover, it offers abetter behavior against images of different conditions. This factis especially relevant if we keep in mind that the main aim ofimplementing a vessel segmentation algorithm is its integrationin systems for automated detection of eye diseases. This kindof systems should require no user interaction and, therefore, berobust enough to analyze different kinds of images. Within thefield of retinal imaging, this involves a huge challenge, sincelarge variability is observed in the image acquisition processand a natural variation is reported in the appearance of theretina.
The rest of the paper is organized as follows. Next section re-views other published vessel segmentation solutions. Section IIIdescribes the material used in this study. Section IV explains andillustrates the proposed method for retinal vessel segmentation,while Section V presents its results and compares them to thoseobtained with other existing methods. Finally, the authors’ con-clusions and discussion conclude this paper.
II. STATE OF ART
Many methods for retinal vessel segmentation have beenreported. These can be divided into two groups: rule-basedmethods and supervised methods. In the first group, we high-light methods using vessel tracking, mathematical morphology,matched filtering, model-based locally adaptive thresholding ordeformable models. On the other hand, supervised methods arethose based on pixel classification (implementing some kind ofclassifier).
Regarding rule-based methods, vessel tracking methods[28]–[33] attempt to obtain the vasculature structure by fol-lowing vessel center lines. Starting from an initial set of pointsestablished automatically or by manual labeling, vessels aretraced by deciding from local information the most appro-priate candidate pixel from those close to that currently underevaluation. Other methods use mathematical morphology [15],[34]–[36] to benefit from a priori-known vasculature shapefeatures, such as being piecewise linear and connected. Then,by applying morphological operators, the vasculature is filteredfrom the background for final segmentation. Matched filteringtechniques [37]–[42] usually use a 2-D linear structural elementwith a Gaussian cross-profile section, extruded or rotated intothree dimensions for blood vessel cross-profile identification(typically a Gaussian or Gaussian-derivative profile). Thekernel is rotated into many different orientations (usually 8or 12) to fit into vessels of different configuration. The imageis then thresholded to extract the vessel silhouette from thebackground. Regarding model-based locally adaptive thresh-olding, a general framework based on a verification-basedmultithreshold probing scheme was presented by Jiang et al.in [43]. These authors enriched this generic methodology by
incorporating relevant information related to retinal vessels intothe verification process with the aim of enabling its applicationto retinal images. On the other hand, deformable or snakemodels have been also used in [44] and [45]. A snake is anactive contour model that, once placed on the image near thecontour of interest, can evolve to fit the shape of the desiredstructure by an iterative adaption. Other rule-based methodsfor retinal blood vessel segmentation were reported in [46]and [47]. Martinez et al. [46] proposed a method based uponmultiscale feature extraction. The local maxima over scales ofthe gradient magnitude and the maximum principal curvature ofthe Hessian tensor were used in a multiple pass region growingprocedure. Growth progressively segmented the blood vesselsby using both feature and spatial information. In the methodpresented in [47], blood vessel-like objects were extracted byusing the Laplacian operator and noisy objects were prunedaccording to centerlines, detected by means of the normalizedgradient vector field.
On the other hand, supervised methods are based on pixelclassification, which consists on classifying each pixel intotwo classes, vessel and non-vessel. Classifiers are trained bysupervised learning with data from manually-labeled images.Gardner et al. [48] proposed a back propagation multilayerneural network (NN) for vascular tree segmentation. After his-togram equalization, smoothing and edge detection, the imagewas divided into 20 20 pixel squares (400 input neurons).The NN was then fed with the values of these pixel windowsfor classifying each pixel into vessel or not. Sinthanayothin etal. [49] also used a multilayer perceptron NN. Each pixel inthe image was classified by using the first principal component,and the edge strength values from a 10 10 pixel subimagecentered on the pixel under evaluation, as input data. Niemeijeret al. [50] implemented a K-nearest neighbor (kNN) classifier.A 31-component pixel feature vector was constructed with theGaussian and its derivatives up to order 2 at 5 different scales,augmented with the gray-level from the green channel of theoriginal image. The assumption that vessels are elongated struc-tures is the basis for the supervised ridge-based vessel detectionmethod presented by Staal et al. [51]. Ridges were extractedfrom the image and used as primitives to form line elements.Each pixel was then assigned to its nearest line element, theimage thus being partitioned into patches. For every pixel, 27features were firstly computed and those obtaining the bestclass separability were finally selected. Feature vectors wereclassified by using a kNN-classifier and sequential forward fea-ture selection. Soares et al. [52] used a Gaussian mixture modelBayesian classifier. Multiscale analysis was performed on theimage by using the Gabor wavelet transform. The gray-level ofthe inverted green channel and the maximum Gabor transformresponse over angles at four different scales were consideredas pixel features. Finally, Ricci and Pefetti [53] used a supportvector machine (SVM) for pixel classification as vessel ornonvessel. They used two orthogonal line detectors along withthe gray-level of the target pixel to construct the feature vector.
III. MATERIALS
To evaluate the vessel segmentation methodology describedin the next section, two publicly available databases containing
148 IEEE TRANSACTIONS ON MEDICAL IMAGING, VOL. 30, NO. 1, JANUARY 2011
retinal images, the DRIVE [54] and STARE [55] databases,were used. These databases have been widely used by other re-searchers to test their vessel segmentation methodologies since,apart from being public, they provide manual segmentations forperformance evaluation.
The DRIVE database comprises 40 eye-fundus color images(seven of which present pathology) taken with a Canon CR5nonmydriatic 3CCD camera with a 45 field-of-view (FOV).Each image was captured at 768 584 pixels, 8 bits per colorplane and, in spite of being offered in LZW compressed TIFFformat, they were originally saved in JPEG format. The databaseis divided into two sets: a test set and a training set, each of themcontaining 20 images. The test set provides the correspondingFOV masks for the images, which are circular (approximateddiameter of 540 pixels) and two manual segmentations gener-ated by two different specialists for each image. The selectionof the first observer is accepted as ground truth and used for al-gorithm performance evaluation in literature. The training setalso includes the FOV masks for the images and a set of manualsegmentations made by the first observer.
The STARE database, originally collected by Hoover et al.[38], comprises 20 eye-fundus color images (ten of them con-tain pathology) captured with a TopCon TRV-50 fundus cameraat 35 FOV. The images were digitalized to 700 605 pixels,8 bits per color channel and are available in PPM format. Thedatabase contains two sets of manual segmentations made bytwo different observers. Performance is computed with the seg-mentations of the first observer as ground truth.
IV. PROPOSED VESSEL SEGMENTATION METHOD
This paper proposes a new supervised approach for bloodvessel detection based on a NN for pixel classification. The nec-essary feature vector is computed from preprocessed retinal im-ages in the neighborhood of the pixel under consideration. Thefollowing process stages may be identified: 1) original fundusimage preprocessing for gray-level homogenization and bloodvessel enhancement, 2) feature extraction for pixel numericalrepresentation, 3) application of a classifier to label the pixel asvessel or nonvessel, and 4) postprocessing for filling pixel gapsin detected blood vessels and removing falsely-detected isolatedvessel pixels.
Input images are monochrome and obtained by extractingthe green band from original RGB retinal images. The greenchannel provides the best vessel-background contrast of theRGB-representation, while the red channel is the brightestcolor channel and has low contrast, and the blue one offers poordynamic range. Thus, blood containing elements in the retinallayer (such as vessels) are best represented and reach highercontrast in the green channel [56].
All parameters described below were set by experiments car-ried out on DRIVE images with the aim of contributing the bestsegmentation performance on this database (performance wasevaluated in terms of average accuracy—a detailed descriptionis provided in Sections V-A and V-B). Therefore, they refer toretinas of approximately 540 pixels in diameter. The applica-tion of the methodology to retinas of different size (i.e., the di-ameter in pixels of STARE database retinas is approximately650 pixels) demands either resizing input images to fulfil this
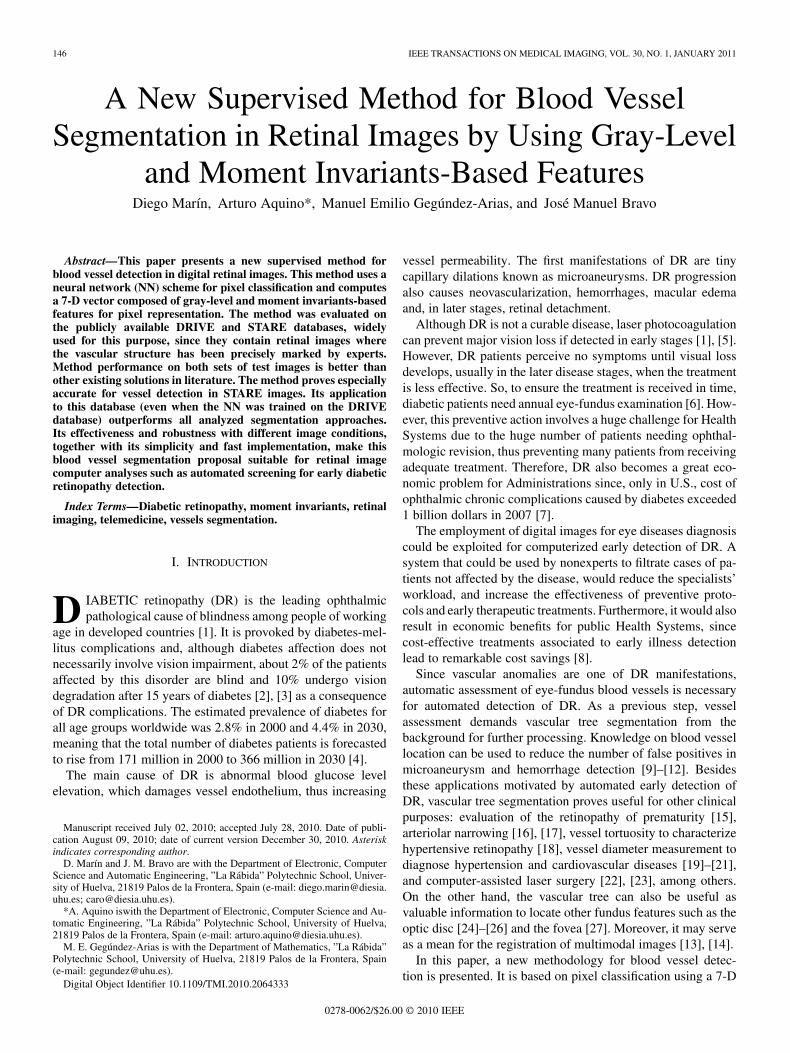
Fig. 1. Illustration of the preprocessing process: (a) Green channel of the orig-inal image. (b) The upper image is a fragment of the original image containing avessel with central light reflex, while the bottom image shows the effect of reflexremoval. (c) Background image. (d) Shade-corrected image. (e) Homogenizedimage. (f) Vessel-enhanced image.
condition or adapting proportionately the whole set of used pa-rameters to this new retina size.
A. Preprocessing
Color fundus images often show important lighting vari-ations, poor contrast and noise. In order to reduce theseimperfections and generate images more suitable for extractingthe pixel features demanded in the classification step, a pre-processing comprising the following steps is applied: 1) vesselcentral light reflex removal, 2) background homogenization,and 3) vessel enhancement. Next, a description of the proce-dure, illustrated through its application to a STARE databasefundus image (Fig. 1), is detailed.
1) Vessel Central Light Reflex Removal: Since retinal bloodvessels have lower reflectance when compared to other retinalsurfaces, they appear darker than the background. Although thetypical vessel cross-sectional gray-level profile can be approxi-mated by a Gaussian shaped curve (inner vessel pixels are darkerthan the outermost ones), some blood vessels include a lightstreak (known as a light reflex) which runs down the centrallength of the blood vessel.
To remove this brighter strip, the green plane of the image isfiltered by applying a morphological opening using a three-pixeldiameter disc, defined in a square grid by using eight-connexity,as structuring element. Disc diameter was fixed to the possibleminimum value to reduce the risk of merging close vessels.denotes the resultant image for future references.
An example of vessel central light reflex and its removal froma fundus image by means of opening filtering operation is shownin Fig. 1(a) and (b).
2) Background Homogenization: Fundus images often con-tain background intensity variation due to nonuniform illumi-nation. Consequently, background pixels may have different in-tensity for the same image and, although their gray-levels areusually higher than those of vessel pixels (in relation to greenchannel images), the intensity values of some background pixelsis comparable to that of brighter vessel pixels. Since the fea-ture vector used to represent a pixel in the classification stage is

MARÍN et al.: A NEW SUPERVISED METHOD FOR BLOOD VESSEL SEGMENTATION IN RETINAL IMAGES 149
formed by gray-scale values, this effect may worsen the per-formance of the vessel segmentation methodology. With thepurpose of removing these background lightening variations, ashade-corrected image is accomplished from a background es-timate. This image is the result of a filtering operation with alarge arithmetic mean kernel, as described below.
Firstly, a 3 3 mean filter is applied to smooth occasionalsalt-and-pepper noise. Further noise smoothing is performed byconvolving the resultant image with a Gaussian kernel of dimen-sions , mean and variance ,
. Secondly, a background image , is pro-duced by applying a 69 69 mean filter [Fig. 1(c)]. When thisfilter is applied to the pixels in the FOV near the border, theresults are strongly biased by the external dark region. To over-come this problem, out-of-the FOV gray-levels are replaced byaverage gray-levels in the remaining pixels in the square. Then,the difference between and is calculated for every pixel
(1)
To this respect, literature reports shade-correction methodsbased on the subtraction of the background image from theoriginal image [10], [12], [57] or the division of the latter bythe former [58], [59]. Both procedures rendered similar resultsupon testing. Moreover, none of them showed to contributeany appreciable advantage relative to the other. The subtractiveapproach in (1) was used in the present work.
Finally, a shade-corrected image is obtained by trans-forming linearly values into integers covering the wholerange of possible gray-levels ( – , referred to 8-bit images).Fig. 1(d) shows the corresponding to a nonuniformly illu-minated image. The proposed shade-correction algorithm is ob-served to reduce background intensity variations and enhancecontrast in relation to the original green channel image.
Besides the background intensity variations in images, in-tensities can reveal significant variations between images dueto different illumination conditions in the acquisition process.In order to reduce this influence, a homogenized image[Fig. 1(a)] is produced as follows: the histogram of isdisplaced toward the middle of the gray-scale by modifyingpixel intensities according to the following gray-level globaltransformation function:
ififotherwise
(2)
where
(3)
and and are the gray-level variables of input andoutput images ( and , respectively). The variable denotedby defines the gray-level presenting the highestnumber of pixels in . By means of this operation, pixelswith gray-level , which are observed to correspondto the background of the retina, are set to 128 for 8-bit images.Thus, background pixels in images with different illuminationconditions will standardize their intensity around this value.
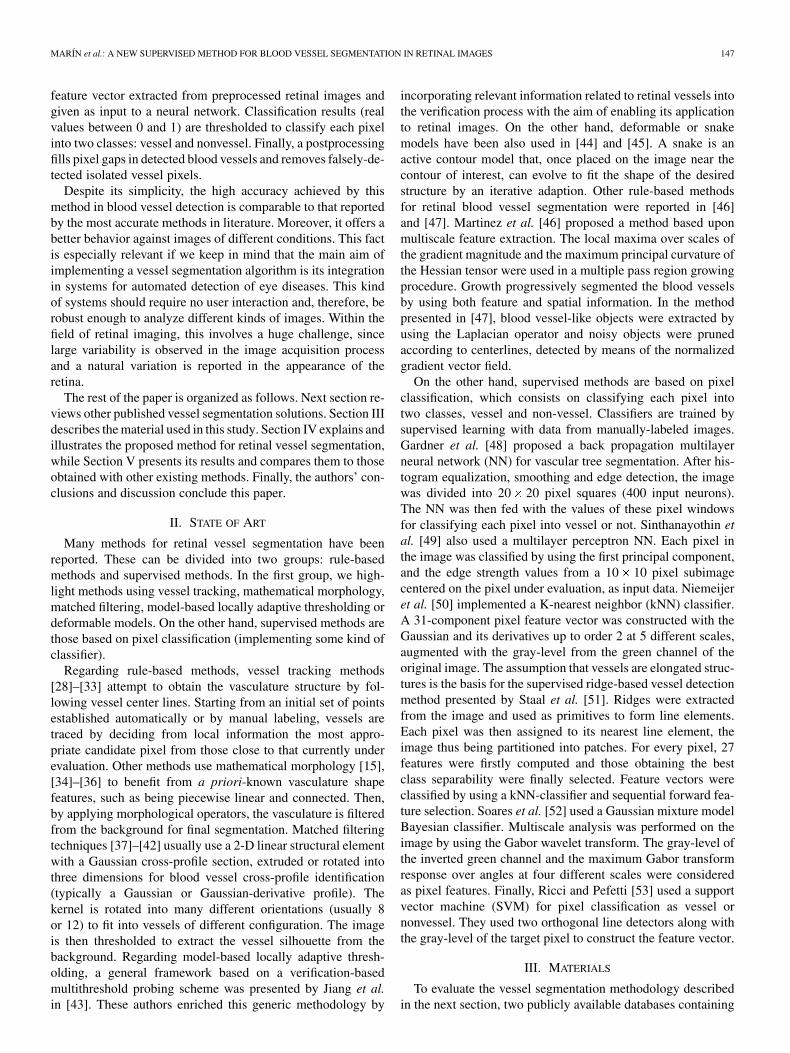
Fig. 2. Two examples of application of the preprocessing on two images withdifferent illumination conditions. (a), (d) Green channel of the original images.(b), (e) Homogenized images. (c), (f) Vessel-enhanced images.
Fig. 2 (a), (b) and (d), (e), shows this effect for two fundusimages in the STARE database.
3) Vessel Enhancement: The final preprocessing step con-sists on generating a new vessel-enhanced image , whichproves more suitable for further extraction of moment invari-ants-based features (see Section IV-B).
Vessel enhancement is performed by estimating the comple-mentary image of the homogenized image , , and sub-sequently applying the morphological Top-Hat transformation[Fig. 1(f)]
(4)
where is a morphological opening operation using a discof eight pixels in radius. Thus, while bright retinal structuresare removed (i.e., optic disc, possible presence of exudatesor reflection artifacts), the darker structures remaining afterthe opening operation become enhanced (i.e., blood vessels,fovea, possible presence of microaneurysms or hemorrhages).Samples of vessel enhancement operation results are shown inFig. 2(c) and (f) for two fundus images with variable illumina-tion conditions.
B. Feature Extraction
The aim of the feature extraction stage is pixel characteriza-tion by means of a feature vector, a pixel representation in termsof some quantifiable measurements which may be easily used inthe classification stage to decide whether pixels belong to a realblood vessel or not. In this paper, the following sets of featureswere selected.
• Gray-level-based features: features based on the differ-ences between the gray-level in the candidate pixel and astatistical value representative of its surroundings.
• Moment invariants-based features: features based on mo-ment invariants for describing small image regions formedby the gray-scale values of a window centered on the rep-resented pixels.
1) Gray-Level-Based Features: Since blood vessels arealways darker than their surroundings, features based on de-scribing gray-level variation in the surroundings of candidate
150 IEEE TRANSACTIONS ON MEDICAL IMAGING, VOL. 30, NO. 1, JANUARY 2011
pixels seem a good choice. A set of gray-level-based descrip-tors taking this information into account were derived fromhomogenized images considering only a small pixel regioncentered on the described pixel . stands for the set ofcoordinates in a sized square window centered on point
. Then, these descriptors can be expressed as
(5)
(6)
(7)
(8)
(9)
2) Moment Invariants-Based Features: The vasculature inretinal images is known to be piecewise linear and can be ap-proximated by many connected line segments. For detectingthese quasi-linear shapes, which are not all equally wide andmay be oriented at any angle, shape descriptors invariant totranslation, rotation and scale change may play an importantrole. Within this context, moment invariants proposed by Hu[60] provide an attractive solution and are included in the fea-ture vector. In this paper, they are computed as follows.
Given a pixel of the vessel-enhanced image , asubimage is generated by taking the region defined by . Thesize of this region was fixed to 17 17 so that, considering thatthe region is centered on the middle of a “wide” vessel (8-9-pixelwide and referred to retinas of approximately 540 pixels in di-ameter), the subimage includes an approximately equal numberof vessel and nonvessel pixels. For this subimage, denoted by
, the 2-D moment of order is defined as
(10)
where summations are over the values of the spatial coordinates
and spanning the subimage, and is the gray-levelat point .
The corresponding central moment is defined as
(11)
where
(12)
are the coordinates of the center of gravity of the subimage.The normalized central moment of order is defined as
(13)
where
(14)
A set of seven moment invariants under size, translation, androtation, known as Hu moment invariants, can be derived fromcombinations of regular moments. Among them, our tests haverevealed that only those defined by
(15)
(16)
constitute the combination providing optimal performance interms of average accuracy (see Section V-B). The inclusion ofthe remainder moments result in decreasing classification per-formance and increasing computation needed for classification.Moreover, the module of the logarithm was used instead of itsvalues themselves. Using the logarithm reduces the dynamicrange and the module prevents from having to deal with thecomplex numbers resulting from computing the logarithm ofnegative moment invariants.
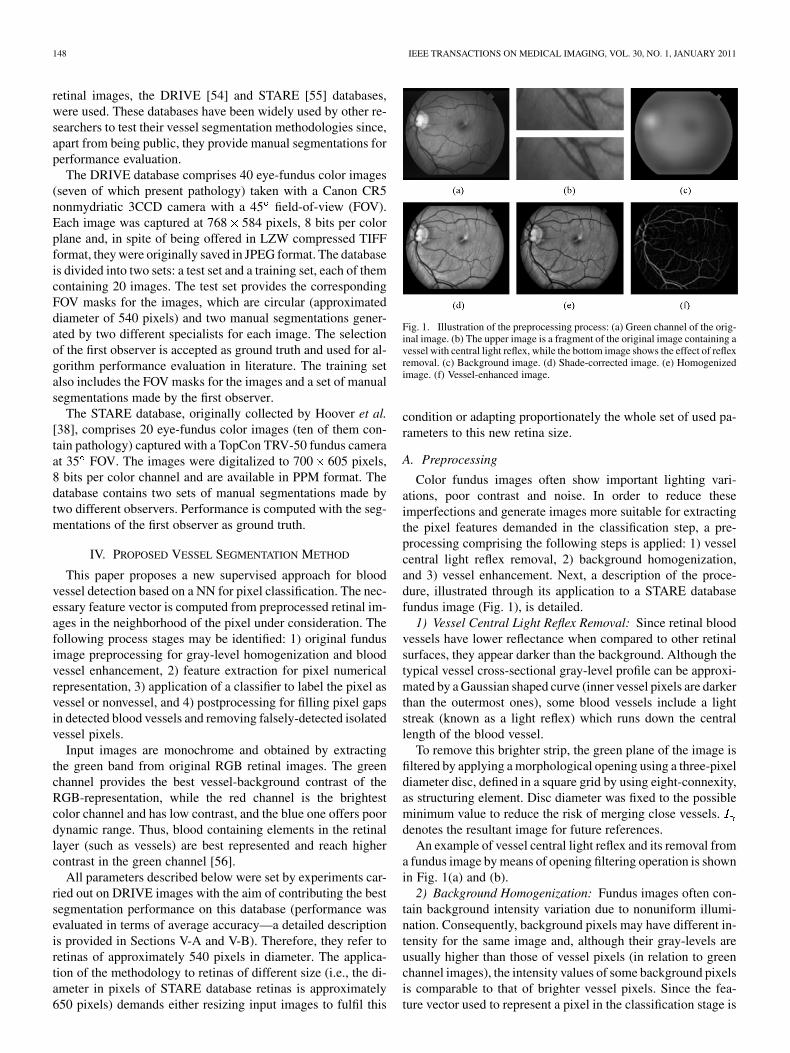
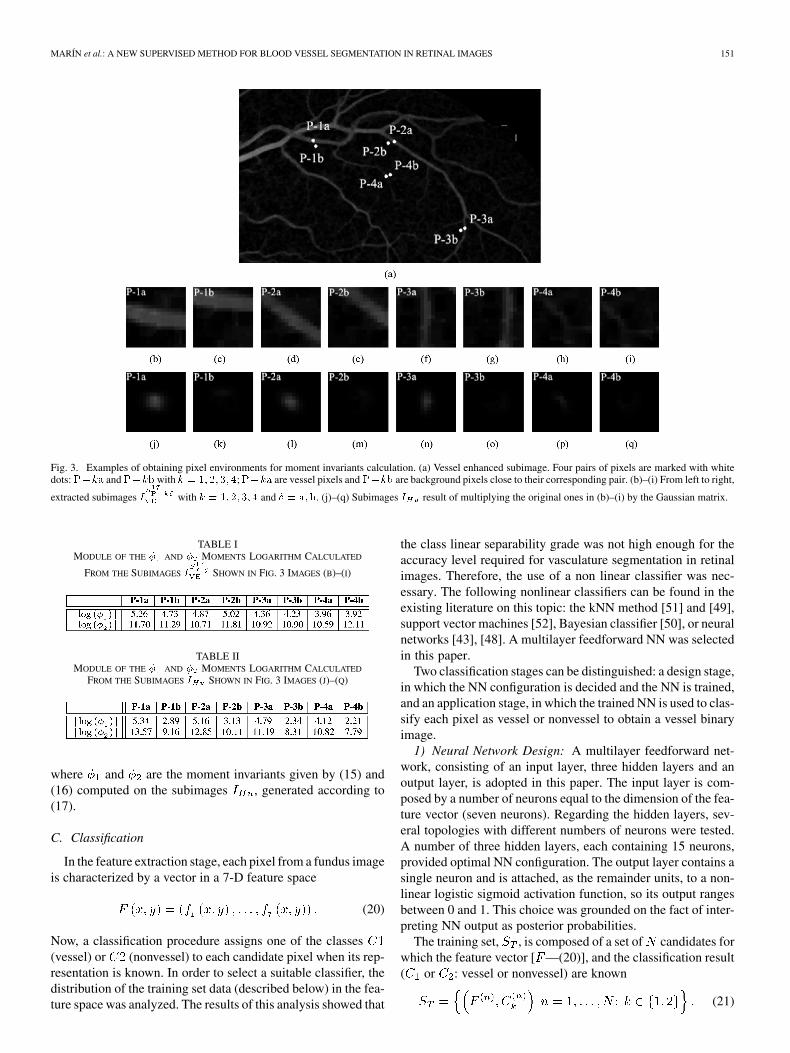
Fig. 3 shows several samples of pixels, marked with solid
white dots on an image [Fig. 3(a)], and the subimagesgenerated around them [Fig. 3(b)–(i)]. Pairs of pixels were se-lected for different vessels: one inside and the other outsidethe vessel but near enough so that both subimages contain thevessel. Table I shows the moment values corresponding to eachsubimage. It can be checked that numbers are close, thus indi-cating a high degree of invariance to size, rotation and transla-tion. Moments computed as mentioned above characterize nu-merically a vessel independently of its width, orientation andlocation in the subimage. However, they are not useful to de-scribe the central pixel of the subimage in terms of vessel ornonvessel, as their values do not distinguish between these twosituations.
To overcome this problem, moments are computed on newsubimages produced by multiplying the original ones,
, by an equal-dimension matrix (17 17) of Gaussianvalues, whose mean is 0 and variance is , . That is,for every point of coordinates
(17)
With this choice of parameters, the central values incontain the 97% of the area of the represented Gaussian distri-bution, the remainder values being close to 0 (supposing that the
central pixel of is located on the middle of a “wide” vessel,these 9 9 central values in correspond to vessel pixels
in ). This operation is illustrated in Fig. 3(b)–(i) and (j)–(q).The effect of this multiplication is clearly observed in thesenew subimages and their associated moment values (Table II).These values become sensitive for describing vessel and non-vessel central pixels, as they now reflect significant differencesbetween them. Both and values, in comparison with theiroriginal ones, increase if they describe vessel pixels and de-crease otherwise.
In conclusion, the following descriptors were considered tobe part of the feature vector of a pixel located at
(18)
(19)
MARÍN et al.: A NEW SUPERVISED METHOD FOR BLOOD VESSEL SEGMENTATION IN RETINAL IMAGES 151
Fig. 3. Examples of obtaining pixel environments for moment invariants calculation. (a) Vessel enhanced subimage. Four pairs of pixels are marked with whitedots:���� and���� with � � �� �� �� �;���� are vessel pixels and���� are background pixels close to their corresponding pair. (b)–(i) From left to right,
extracted subimages � with � � �� �� �� � and � � ���. (j)–(q) Subimages � result of multiplying the original ones in (b)–(i) by the Gaussian matrix.
TABLE IMODULE OF THE � AND � MOMENTS LOGARITHM CALCULATED
FROM THE SUBIMAGES � SHOWN IN FIG. 3 IMAGES (B)–(I)
TABLE IIMODULE OF THE � AND � MOMENTS LOGARITHM CALCULATED
FROM THE SUBIMAGES � SHOWN IN FIG. 3 IMAGES (J)–(Q)
where and are the moment invariants given by (15) and(16) computed on the subimages , generated according to(17).
C. Classification
In the feature extraction stage, each pixel from a fundus imageis characterized by a vector in a 7-D feature space
(20)
Now, a classification procedure assigns one of the classes(vessel) or (nonvessel) to each candidate pixel when its rep-resentation is known. In order to select a suitable classifier, thedistribution of the training set data (described below) in the fea-ture space was analyzed. The results of this analysis showed that
the class linear separability grade was not high enough for theaccuracy level required for vasculature segmentation in retinalimages. Therefore, the use of a non linear classifier was nec-essary. The following nonlinear classifiers can be found in theexisting literature on this topic: the kNN method [51] and [49],support vector machines [52], Bayesian classifier [50], or neuralnetworks [43], [48]. A multilayer feedforward NN was selectedin this paper.
Two classification stages can be distinguished: a design stage,in which the NN configuration is decided and the NN is trained,and an application stage, in which the trained NN is used to clas-sify each pixel as vessel or nonvessel to obtain a vessel binaryimage.
1) Neural Network Design: A multilayer feedforward net-work, consisting of an input layer, three hidden layers and anoutput layer, is adopted in this paper. The input layer is com-posed by a number of neurons equal to the dimension of the fea-ture vector (seven neurons). Regarding the hidden layers, sev-eral topologies with different numbers of neurons were tested.A number of three hidden layers, each containing 15 neurons,provided optimal NN configuration. The output layer contains asingle neuron and is attached, as the remainder units, to a non-linear logistic sigmoid activation function, so its output rangesbetween 0 and 1. This choice was grounded on the fact of inter-preting NN output as posterior probabilities.
The training set, , is composed of a set of candidates forwhich the feature vector [ —(20)], and the classification result( or : vessel or nonvessel) are known
(21)
152 IEEE TRANSACTIONS ON MEDICAL IMAGING, VOL. 30, NO. 1, JANUARY 2011
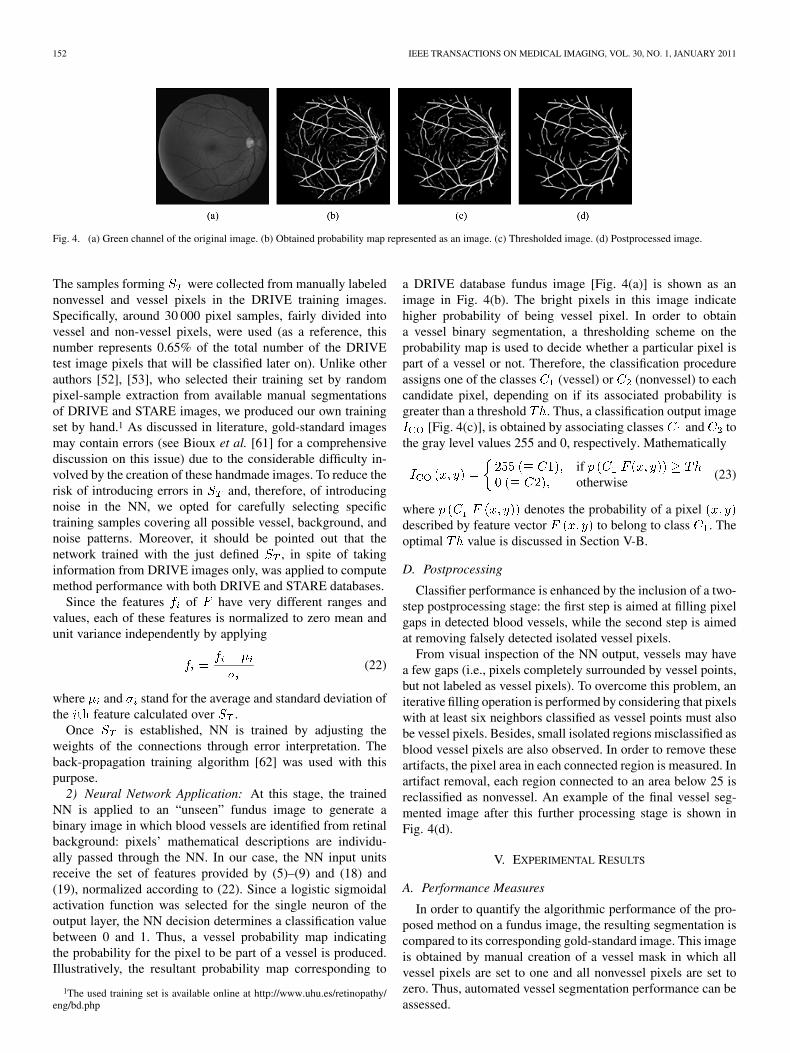
Fig. 4. (a) Green channel of the original image. (b) Obtained probability map represented as an image. (c) Thresholded image. (d) Postprocessed image.
The samples forming were collected from manually labelednonvessel and vessel pixels in the DRIVE training images.Specifically, around 30 000 pixel samples, fairly divided intovessel and non-vessel pixels, were used (as a reference, thisnumber represents 0.65% of the total number of the DRIVEtest image pixels that will be classified later on). Unlike otherauthors [52], [53], who selected their training set by randompixel-sample extraction from available manual segmentationsof DRIVE and STARE images, we produced our own trainingset by hand.1 As discussed in literature, gold-standard imagesmay contain errors (see Bioux et al. [61] for a comprehensivediscussion on this issue) due to the considerable difficulty in-volved by the creation of these handmade images. To reduce therisk of introducing errors in and, therefore, of introducingnoise in the NN, we opted for carefully selecting specifictraining samples covering all possible vessel, background, andnoise patterns. Moreover, it should be pointed out that thenetwork trained with the just defined , in spite of takinginformation from DRIVE images only, was applied to computemethod performance with both DRIVE and STARE databases.
Since the features of have very different ranges andvalues, each of these features is normalized to zero mean andunit variance independently by applying
(22)
where and stand for the average and standard deviation ofthe feature calculated over .
Once is established, NN is trained by adjusting theweights of the connections through error interpretation. Theback-propagation training algorithm [62] was used with thispurpose.
2) Neural Network Application: At this stage, the trainedNN is applied to an “unseen” fundus image to generate abinary image in which blood vessels are identified from retinalbackground: pixels’ mathematical descriptions are individu-ally passed through the NN. In our case, the NN input unitsreceive the set of features provided by (5)–(9) and (18) and(19), normalized according to (22). Since a logistic sigmoidalactivation function was selected for the single neuron of theoutput layer, the NN decision determines a classification valuebetween 0 and 1. Thus, a vessel probability map indicatingthe probability for the pixel to be part of a vessel is produced.Illustratively, the resultant probability map corresponding to
1The used training set is available online at http://www.uhu.es/retinopathy/eng/bd.php
a DRIVE database fundus image [Fig. 4(a)] is shown as animage in Fig. 4(b). The bright pixels in this image indicatehigher probability of being vessel pixel. In order to obtaina vessel binary segmentation, a thresholding scheme on theprobability map is used to decide whether a particular pixel ispart of a vessel or not. Therefore, the classification procedureassigns one of the classes (vessel) or (nonvessel) to eachcandidate pixel, depending on if its associated probability isgreater than a threshold . Thus, a classification output image
[Fig. 4(c)], is obtained by associating classes and tothe gray level values 255 and 0, respectively. Mathematically
ifotherwise
(23)
where denotes the probability of a pixeldescribed by feature vector to belong to class . Theoptimal value is discussed in Section V-B.
D. Postprocessing
Classifier performance is enhanced by the inclusion of a two-step postprocessing stage: the first step is aimed at filling pixelgaps in detected blood vessels, while the second step is aimedat removing falsely detected isolated vessel pixels.
From visual inspection of the NN output, vessels may havea few gaps (i.e., pixels completely surrounded by vessel points,but not labeled as vessel pixels). To overcome this problem, aniterative filling operation is performed by considering that pixelswith at least six neighbors classified as vessel points must alsobe vessel pixels. Besides, small isolated regions misclassified asblood vessel pixels are also observed. In order to remove theseartifacts, the pixel area in each connected region is measured. Inartifact removal, each region connected to an area below 25 isreclassified as nonvessel. An example of the final vessel seg-mented image after this further processing stage is shown inFig. 4(d).
V. EXPERIMENTAL RESULTS
A. Performance Measures
In order to quantify the algorithmic performance of the pro-posed method on a fundus image, the resulting segmentation iscompared to its corresponding gold-standard image. This imageis obtained by manual creation of a vessel mask in which allvessel pixels are set to one and all nonvessel pixels are set tozero. Thus, automated vessel segmentation performance can beassessed.

MARÍN et al.: A NEW SUPERVISED METHOD FOR BLOOD VESSEL SEGMENTATION IN RETINAL IMAGES 153
TABLE IIICONTINGENCY VESSEL CLASSIFICATION
TABLE IVPERFORMANCE RESULTS ON DRIVE DATABASE IMAGES
In this paper, our algorithm was evaluated in terms of sen-sitivity , specificity , positive predictive value ,negative predictive value , and accuracy . TakingTable III into account, these metrics are defined as
(24)
(25)
(26)
(27)
(28)
and metrics are the ratio of well-classified vessel andnonvessel pixels, respectively. is the ratio of pixels classi-fied as vessel pixel that are correctly classified. is the ratioof pixels classified as background pixel that are correctly classi-fied. Finally, is a global measure providing the ratio of totalwell-classified pixels.
In addition, algorithm performance was also measured withreceiver operating characteristic (ROC) curves. A ROC curve isa plot of true positive fractions versus false positive frac-tions by varying the threshold on the probability map.The closer a curve approaches the top left corner, the better theperformance of the system. The area under the curve ,which is 1 for a perfect system, is a single measure to quantifythis behavior.
B. Proposed Method Evaluation
This method was evaluated on DRIVE and STARE databaseimages with available gold-standard images. Since the images’
TABLE VPERFORMANCE RESULTS ON STARE DATABASE IMAGES
dark background outside the FOV is easily detected, , ,, and values were computed for each image con-
sidering FOV pixels only. Since FOV masks are not providedfor STARE images, they were generated with an approximatediameter of 650 550. The results are listed in Tables IV andV2. The last row of the tables shows average , , , ,and values (denoted as for future references), for the20 images in each database.
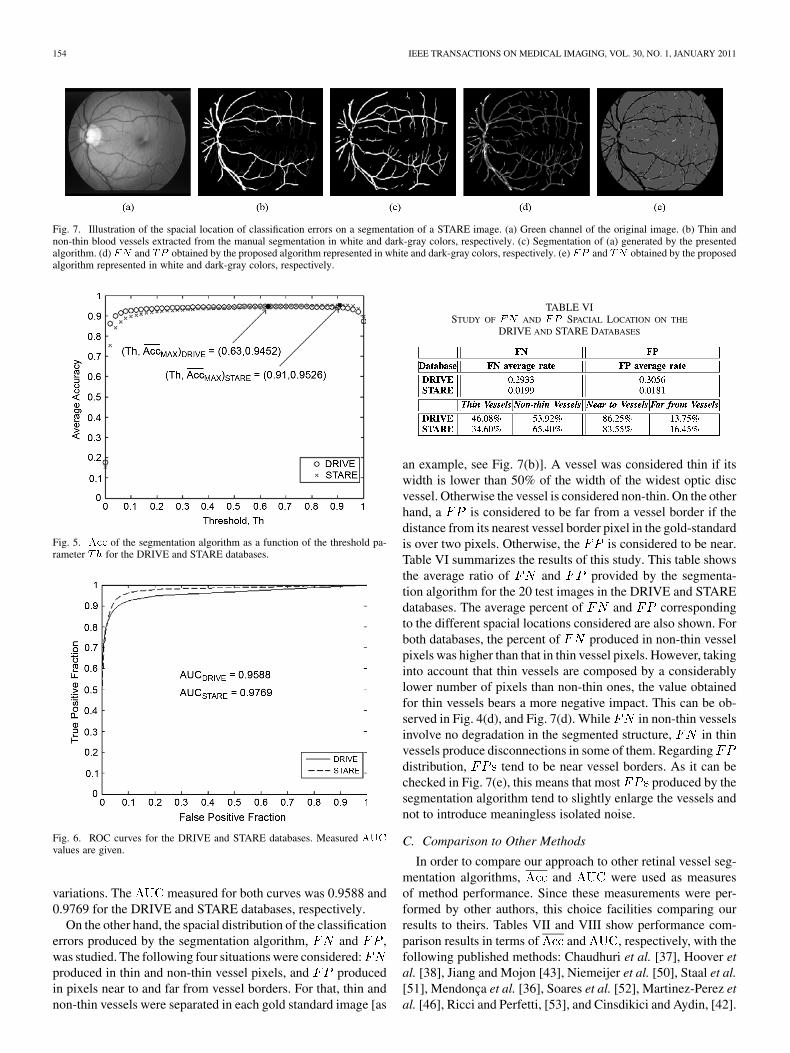
The performance results shown in Tables IV and V were ob-tained considering the same threshold value for all the im-ages in the same database (0.63 and 0.91 for DRIVE and STAREimages, respectively). These values were set to provide max-imum average accuracy in each database in the fol-lowing way. For a given value, one value is obtained foreach of the 20 images selected for testing on a given database.These 20 values are then averaged to obtain a single perfor-mance measure, , linked to the selected value. Several
values are obtained at certain thresholds applying these op-erations for different values. The final threshold valueselected for a given database is that providing the maximumvalue, . Fig. 5 shows the values calculated forvalues from 0 to 1 (step of 0.02). The results for both DRIVEand STARE databases are shown. The values and theircorresponding values are marked for every database in thisfigure. It is worth mentioning that variation shows no sig-nificant dependence on . As it can be observed in Fig. 5, al-though different optimum values are reached depending onthe database on which performance is computed, a wide range of
values provides values very close to . There-fore, values can be concluded not to be a critical methodto assess performance in terms of , since it slowly varies ac-cording to it. This influence of on system performance is alsovisible in the ROC curves for the two databases shown in Fig. 6.These curves were produced by calculating the true and thefalse positive fraction on all test images through -threshold
2The final vessel segmented images are available online at http://www.uhu.es/retinopathy/eng/bd.php
154 IEEE TRANSACTIONS ON MEDICAL IMAGING, VOL. 30, NO. 1, JANUARY 2011
Fig. 7. Illustration of the spacial location of classification errors on a segmentation of a STARE image. (a) Green channel of the original image. (b) Thin andnon-thin blood vessels extracted from the manual segmentation in white and dark-gray colors, respectively. (c) Segmentation of (a) generated by the presentedalgorithm. (d) �� and �� obtained by the proposed algorithm represented in white and dark-gray colors, respectively. (e) �� and �� obtained by the proposedalgorithm represented in white and dark-gray colors, respectively.
Fig. 5. ��� of the segmentation algorithm as a function of the threshold pa-rameter �� for the DRIVE and STARE databases.
Fig. 6. ROC curves for the DRIVE and STARE databases. Measured ���values are given.
variations. The measured for both curves was 0.9588 and0.9769 for the DRIVE and STARE databases, respectively.
On the other hand, the spacial distribution of the classificationerrors produced by the segmentation algorithm, and ,was studied. The following four situations were considered:produced in thin and non-thin vessel pixels, and producedin pixels near to and far from vessel borders. For that, thin andnon-thin vessels were separated in each gold standard image [as
TABLE VISTUDY OF �� AND �� SPACIAL LOCATION ON THE
DRIVE AND STARE DATABASES
an example, see Fig. 7(b)]. A vessel was considered thin if itswidth is lower than 50% of the width of the widest optic discvessel. Otherwise the vessel is considered non-thin. On the otherhand, a is considered to be far from a vessel border if thedistance from its nearest vessel border pixel in the gold-standardis over two pixels. Otherwise, the is considered to be near.Table VI summarizes the results of this study. This table showsthe average ratio of and provided by the segmenta-tion algorithm for the 20 test images in the DRIVE and STAREdatabases. The average percent of and correspondingto the different spacial locations considered are also shown. Forboth databases, the percent of produced in non-thin vesselpixels was higher than that in thin vessel pixels. However, takinginto account that thin vessels are composed by a considerablylower number of pixels than non-thin ones, the value obtainedfor thin vessels bears a more negative impact. This can be ob-served in Fig. 4(d), and Fig. 7(d). While in non-thin vesselsinvolve no degradation in the segmented structure, in thinvessels produce disconnections in some of them. Regardingdistribution, tend to be near vessel borders. As it can bechecked in Fig. 7(e), this means that most produced by thesegmentation algorithm tend to slightly enlarge the vessels andnot to introduce meaningless isolated noise.
C. Comparison to Other Methods
In order to compare our approach to other retinal vessel seg-mentation algorithms, and were used as measuresof method performance. Since these measurements were per-formed by other authors, this choice facilities comparing ourresults to theirs. Tables VII and VIII show performance com-parison results in terms of and , respectively, with thefollowing published methods: Chaudhuri et al. [37], Hoover etal. [38], Jiang and Mojon [43], Niemeijer et al. [50], Staal et al.[51], Mendonça et al. [36], Soares et al. [52], Martinez-Perez etal. [46], Ricci and Perfetti, [53], and Cinsdikici and Aydin, [42].

MARÍN et al.: A NEW SUPERVISED METHOD FOR BLOOD VESSEL SEGMENTATION IN RETINAL IMAGES 155
TABLE VIIPERFORMANCE RESULTS COMPARED TO OTHER METHODS ON THE STARE
AND DRIVE DATABASES IN TERMS OF AVERAGE ACCURACY
TABLE VIIIPERFORMANCE RESULTS COMPARED TO OTHER METHODS ON THE STARE
AND DRIVE DATABASES IN TERMS OF AREA UNDER ROC CURVE
All these supervised or rule-based methods have been brieflycommented in Section II. The values shown in both tables arepresented for each database as reported by their authors. If theyare not available for a specific database or were not calculatedfor the 20 images selected for testing, they were not includedin the tables, thus appearing as gaps. The values in the lastcolumn of each table indicate the overall and whenboth databases are taken into account.
An overview of the segmentation results on DRIVE imagesshows our proposed method reaches better performance thanmost of the other methods, being comparable to or approx-imating the performance of other detection techniques. The
value achieved with our algorithm is outperformed onlyby Soares et al. [52], Mendonça et al. [36], and Ricci andPerfetti [53]. Regarding the approaches by Soares et al. [52]and Mendonça et al. [36], it is important to point out that ourmethod clearly outperforms the these authors reported onSTARE images. Therefore, our approach renders better overall
for both databases than theirs. The same conclusions aredrawn when these methods are compared in terms of .On DRIVE database images, the value provided by ourproposal is only lower than those reported by Soares et al. [52]and Ricci and Perfetti [53] (Mendonça et al. [36] did not report
values). However, due to the excellent result onthe STARE database, our approach reaches the highest average
when both databases are considered.The proposed method proves especially useful for vessel de-
tection in STARE images. Its application to this database re-sulted in the second highest accuracy score among all experi-ments (only behind Ricci and Perfetti’s approach [53]) and the
TABLE IXPERFORMANCE RESULTS COMPARED TO RICCI AND PERFETTI’S METHOD
WITH CROSS TRAINNING IN TERMS OF AVERAGE ACCURACY
first when is the reference measurement. This result gainsmore importance by the fact that our classifier was trained onlyon DRIVE images, unlike the other supervised approaches pre-sented in Tables VII and VIII. For instance, since there are noavailable labeled training images for STARE images, Soareset al. [52] performed leave-one-out tests on this database (i.e.,every image is classified by using samples from the other 19 im-ages), while Ricci and Perfetti [53] built its classifier by usinga training set comprising samples randomly extracted from testimages. In our case, with the purpose of using one and the sametrained classifier for testing the method on the 20 STARE imagesand including no sample belonging to the test set in the training,we opted for forming the training set by collecting pixels fromDRIVE training images. Thus, the method’s suitability for beingapplied on any fundus image can be checked in a more realisticway. We should also mention that these good results with re-spect to other existing approaches were obtained on images con-taining pathological artifacts. The STARE database contains tenimages with pathologies, while the test of DRIVE only containsfour. Moreover, abnormal regions are wider in STARE.
Regarding performance comparison in terms of whenresults are jointly analyzed for DRIVE and STARE images(Table VII, last column), our algorithm renders greater accuracythan others authors’ algorithms, being outperformed only byRicci and Perfetti’s proposal [53]. However, this method provedvery dependent on the training set. Ricci and Pefetti [53], toresearch the dependence of their classification method on thedataset, carried out an experiment based on, firstly, training theclassifier on each of the DRIVE and STARE databases, andthen, testing it on the other. Their maximum accuracy valuesare shown in Table IX. It can be observed that performanceis worse now, since strongly decreases from 0.9595 to0.9266 on DRIVE and 0.9646 to 0.9452 on STARE databaseimages. Therefore, as assumed by these authors, classifierretraining is necessary before applying their methodology on anew database. To verify our method dependence on the trainingset, the same experiment was completed. Thus, performancewas computed on the DRIVE database, training the classifierwith STARE images (as previously mentioned, our accuracy onSTARE was already obtained by training on DRIVE images).The resulting values are shown in Table IX to facilitatecomparisons between both methods under identical conditions.In this case, it is clearly observed that our estimated perfor-mance in terms of method accuracy is higher, thus provinghigher training set robustness.
VI. DISCUSSION AND CONCLUSION
Previous methods for blood vessel detection in retinal imagescan be classified into rule-based and supervised methods. Thisstudy proposes a method within the latter category. This method

156 IEEE TRANSACTIONS ON MEDICAL IMAGING, VOL. 30, NO. 1, JANUARY 2011
TABLE XAVERAGE ACCURACY ON THE DRIVE AND STARE DATABASES USING ONE
TYPE OF FEATURE: GRAY-LEVEL (G-L) OR MOMENT INVARIANTS-BASED
FEATURES (M-I)
TABLE XIAVERAGE ACCURACY ON THE DRIVE AND STARE DATABASES OF THE
PROPOSED METHOD WHEN NN, KNN, AND SVM CLASSIFIERS ARE USED
is based on a NN scheme for pixel classification, being the fea-ture vector representing each pixel composed of gray-level andmoment invariants-based features. To the best of our knowledge,although moment invariants have been widely used over theyears as features for pattern recognition in many areas of imageanalysis (typical examples include optical character recognitionand shape identification), they have never been applied withinthis framework.
The experiments aimed at evaluating the efficiency of the ap-plied descriptors prove this method is capable of rendering ac-curate results, even when these types of features are used in-dependently. Table X shows its accuracy performance when afeature vector composed of the five gray-level-based features,on one hand, and the two moment invariants-based features, onthe other hand, is considered. According to these results, bothsets of descriptors are suitable for pixel classification as vesselor nonvessel. Even when the feature vector is built as mentionedabove, our algorithm outperforms other segmentation proposals(e.g., Jiang and Mojon [43] or Martinez-Perez et al. [46]). How-ever, these pixel representations are not optimal by themselves.Discriminative power increases when both sets of different fea-ture types are jointly considered. Thus, accuracy improves upto 0.9452 and 0.9526 for the 20 test images in the DRIVE andSTARE databases, respectively. Therefore, the method finallyadopts a 7-D feature vector composed by the five gray-level andthe two moment invariants-based features.
The proposed method uses a NN for pixel classification asvessel or non-vessel. This classifier was selected after methodaccuracy assessment by means of a kNN and a SVM (usedas in [51] and [53], respectively), instead of a NN. Table XIshows this performance comparison in terms of measuredon DRIVE and STARE test images. Results before and afterthe postprocessing stage application are presented. NN showedbetter accuracy than kNN and SVM for all cases.
Tables VII and VIII show a performance overview on previ-ously-published vessel segmentation methods in terms ofand , respectively, for test DRIVE and STARE images.Among them, those providing best performance results includethe rule-based proposal by Mendonça et al. [36] ( is notavailable for this method), and the supervised methods bySoares et al. [52] and Ricci and Perfetti [53].
When the results on both databases are jointly analysed, theapproach proposed in this paper provides the highest average
. Regarding , the value reached in this work is slightlyhigher than that obtained by Mendonça et al. [36] and Soareset al. [52]. Although Ricci and Perfetti’s approach [53] seemsto offer more accurate behavior, the results in Table IX indi-cate that their method shows strong performance loss when con-fronted to an “unseen” database. These authors obtain excellentresults when both training and testing are performed on the samedatabase but accuracy significantly worsens when the method istrained and tested on a different database. A possible explana-tion to this fact is that authors avoid image preprocessing to pre-serve vessel structure at most. However, since the different im-ages are not homogenized, the method proves very sensitive tothe training set. This is an important disadvantage for practicalapplication, since a blood vessel detection tool must work onretinal images from multiple origins and be used by different op-erators working with different equipment. On the contrary, ourproposal proves robust regarding the dataset used: even whentrained on the DRIVE database, its application to the STAREdatabase results in the second highest accuracy score among allexperiments, and the first if the Ricci and Pefetti’s [53] resultsare recorded under the same conditions. Therefore, the trainingset robustness shown by our method allows its automated appli-cation to images taken under different conditions. To this re-spect, it should be pointed out that the proposed method, inits different stages (preprocessing, feature extraction, classifica-tion, and postprocessing), uses a set of parameters fixed to pro-vide the best accuracy on DRIVE test images. That is, parametervalues were optimized to retinas of 540 pixels in diameter. It isimportant to point out that, since the features used for pixel rep-resentation are invariant to scale change, the method is also ap-plicable for processing images with different resolution withoutretraining. To make the method applicable for processing im-ages of any resolution, its implementation should include eitherresampling the image to fulfil the mentioned size condition, oradapting all parameter to the new retina size.
In addition, method simplicity should also be highlighted.Its pixel classification procedure is based on computing onlyseven features for each pixel, thus needing shorter computa-tional time. The total time required to process a single imageis less than approximately one minute and thirty seconds, run-ning on a PC with an Intel Core2Duo CPU at 2.13 GHz and2 GB of RAM. Since our implementation is experimental, thisperformance might still be improved.
The demonstrated effectiveness and robustness, together withits simplicity and fast implementation, make this proposed au-tomated blood vessel segmentation method a suitable tool forbeing integrated into a complete prescreening system for earlyDR detection.
ACKNOWLEDGMENT
The authors would like to thank J. J. Staal and his colleaguesand A. Hoover for making their databases publicly available.This work was carried out as part of the Expert System for EarlyAutomated Detection of DR by Analysis of Digital Retinal Im-ages Project, supported and funded by the Health Ministry ofthe Andalusian Regional Government (Spain).
MARÍN et al.: A NEW SUPERVISED METHOD FOR BLOOD VESSEL SEGMENTATION IN RETINAL IMAGES 157
REFERENCES
[1] H. R. Taylor and J. E. Keeffe, “World blindness: A 21st century per-spective,” Br. J. Ophthalmol., vol. 85, pp. 261–266, 2001.
[2] R. Klein, S. M. Meuer, S. E. Moss, and B. E. Klein, “Retinal microa-neurysm counts and 10-year progression of diabetic retinopathy,” Arch.Ophthalmol., vol. 113, pp. 1386–1391, 1995.
[3] P. Massin, A. Erginay, and A. Gaudric, Rétinopathie Diabétique.New York: Elsevier, 2000.
[4] S. Wild, G. Roglic, A. Green, R. Sicree, and H. King, “Global preva-lence of diabetes: Estimates for the year 2000 and projections for2030,” Diabetes Care, vol. 27, pp. 1047–1053, 2004.
[5] S. J. Lee, C. A. McCarty, H. R. Taylor, and J. E. Keeffe, “Costs ofmobile screening for diabetic retinopathy: A practical framework forrural populations,” Aust. J. Rural Health, vol. 8, pp. 186–192, 2001.
[6] D. S. Fong, L. Aiello, T. W. Gardner, G. L. King, G. Blankenship,J. D. Cavallerano, F. L. Ferris, and R. Klein, “Diabetic retinopathy,”Diabetes Care, vol. 26, pp. 226–229, 2003.
[7] “Economic costs of diabetes in the U.S. in 2007,” in Diabetes Care. :American Diabetes Association, 2008, vol. 31, pp. 596–615.
[8] American Academy of Ophthalmology Retina Panel, PreferredPractice Pattern Guidelines. Diabetic Retinopathy. San Fran-cisco, CA, Am. Acad. Ophthalmo., 2008 [Online]. Available:http://www.aao.org/ppp
[9] T. Spencer, J. A. Olson, K. C. McHardy, P. F. Sharp, and J.V. Forrester, “An image-processing strategy for the segmentationand quantification of microaneurysms in fluorescein angiogramsof the ocular fundus,” Comput. Biomed. Res., vol. 29, no. 4,pp. 284–302, 1996.
[10] A. J. Frame, P. E. Undrill, M. J. Cree, J. A. Olson, K. C. McHardy,P. F. Sharp, and J. V. Forrester, “A comparison of computer basedclassification methods applied to the detection of microaneurysms inophthalmic fluorescein angiograms,” Comput. Biol. Med., vol. 28, no.3, pp. 225–238, 1998.
[11] M. Larsen, J. Godt, N. Larsen, H. Lund-Andersen, A. K. Sjølie, E.Agardh, H. Kalm, M. Grunkin, and D. R. Owens, “Automated detectionof fundus photographic red lesions in diabetic retinopathy,” Investigat.Opht. Vis. Sci., vol. 44, no. 2, pp. 761–766, 2003.
[12] M. Niemeijer, B. van Ginneken, J. J. Staal, M. S. A. Suttorp-Schulten,and M. D. Abramoff, “Automatic detection of red lesions in digitalcolor fundus photographs,” IEEE Trans. Med. Imag., vol. 24, no. 5, pp.584–592, May 2005.
[13] F. Zana and J. C. Klein, “A multimodal registration algorithm of eyefundus images using vessels detection and Hough transform,” IEEETrans. Med. Imag., vol. 18, no. 5, pp. 419–428, May 1999.
[14] G. K. Matsopoulos, P. A. Asvestas, N. A. Mouravliansky, and K. K.Delibasis, “Multimodal registration of retinal images using self orga-nizing maps,” IEEE Trans. Med. Imag., vol. 23, no. 12, pp. 1557–1563,Dec. 2004.
[15] C. Heneghan, J. Flynn, M. O’Keefe, and M. Cahill, “Characterizationof changes in blood vessel width and tortuosity in retinopathy of pre-maturity using image analysis,” Med. Image Anal., vol. 6, pp. 407–429,2002.
[16] E. Grisan and A. Ruggeri, “A divide and impera strategy forthe automatic classification of retinal vessels into arteries andveins,” in Proc. 25th Int. Conf. IEEE Eng. Med. Biol. Soc.,2003, pp. 890–893.
[17] Y. Hatanaka, H. Fujita, M. Aoyama, H. Uchida, and T. Yamamoto,“Automated analysis of the distribuitions and geometries of blood ves-sels on retinal fundus images,” Proc. SPIE Med. Imag. 2004: ImageProcess., vol. 5370, pp. 1621–1628, 2004.
[18] M. Foracchia, E. Grisan, and A. Ruggeri, “Extraction and quantita-tive description of vessel features in hypertensive retinopathy fundusimages,” in Book Abstracts 2nd Int. Workshop Comput. Asst. FundusImage Anal., 2001, p. 6.
[19] X. Goa, A. Bharath, A. Stanton, A. Hughes, N. Chapman, and S.Thom, “A method of vessel tracking for vessel diameter measurementon retinal images,” Proc. ICIP, pp. 881–884, 2001.
[20] M. E. Martinez-Perez, A. D. Hughes, A. V. Stanton, S. A. Thom, N.Chapman, A. A. Bharath, and K. H. Parker, “Retinal vascular tree mor-phology: A semiautomatic quantification,” IEEE Trans. Biomed. Eng.,vol. 49, no. 8, pp. 912–917, Aug. 2002.
[21] J. Lowell, A. Hunter, D. Steel, A. Basu, R. Ryder, and R. L. Kennedy,“Measurement of retinal vessel widths from fundus images basedon 2-D modeling,” IEEE Trans. Med. Imag., vol. 23, no. 10, pp.1196–1204, Oct. 2004.
[22] D. E. Becker, A. Can, J. N. Turner, H. L. Tanenbaum, and B. Roysam,“Image processing algorithms for retinal montage, synthesis, mappingand real-time location determination,” IEEE Trans. Biomed. Eng., vol.45, no. 1, pp. 115–118, Jan. 1998.
[23] H. Shen, B. Roysam, C. V. Stewart, J. N. Turner, and H. L. Tanen-baum, “Optimal scheduling of tracing computations for real-time vas-cular landmark extraction from retinal fundus images,” IEEE Trans.Inf. Technol. Biomed., vol. 5, pp. 77–91, Mar. 2001.
[24] A. Hoover and M. Goldbaum, “Locating the optic nerve in a retinalimage using the fuzzy convergence of the blood vessels,” IEEE Trans.Med. Imag., vol. 22, no. 8, pp. 951–958, Aug. 2003.
[25] M. Foracchia, E. Grisan, and A. Ruggeri, “Detection of opticdisc in retinal images by means of a geometrical model ofvessel structure,” IEEE Trans. Med. Imag., vol. 23, no. 10,pp. 1189–1195, Oct. 2004.
[26] A. A. H. A. R. Youssif, A. Z. Ghalwash, and A. R. Ghoneim, “Opticdisc detection from normalized digital fundus images by means of avessels’ direction matched filter,” IEEE Trans. Med. Imag., vol. 27, no.1, pp. 11–18, Jan. 2008.
[27] H. Li and O. Chutatape, “Automated feature extraction in color retinalimages by a model based approach,” IEEE Trans. Biomed. Eng., vol.51, no. 2, pp. 246–254, Feb. 2004.
[28] O. Chutatape, L. Zheng, and S. Krishman, “Retinal blood vessel detec-tion and tracking by matched Gaussian and Kalman filters,” in Proc.IEEE Int. Conf. Eng. Biol. Soc., 1998, vol. 20, pp. 3144–3149.
[29] Y. A. Tolias and S. M. Panas, “A fuzzy vessel tracking algorithm forretinal images based on fuzzy clustering,” IEEE Trans. Med. Imag., vol.17, no. 2, pp. 263–273, Apr. 1998.
[30] A. Can, H. Shen, J. N. Turner, H. L. Tanenbaum, and B. Roysam,“Rapid automated tracing and feature extraction from retinal fundusimages using direct exploratory algorithms,” IEEE Trans. Inform.Technol. Biomed., vol. 3, no. 2, pp. 125–138, Jun. 1999.
[31] L. Gagnon, M. Lalonde, M. Beaulieu, and M.-C. Boucher, “Procedureto detect anatomical structures in optical fundus images,” Proc. SPIEMed. Imag.: Image Process., vol. 4322, pp. 1218–1225, 2001.
[32] I. Liu and Y. Sun, “Recursive tracking of vascular networks in an-giograms based on the detection-deletion scheme,” IEEE Trans. Med.Imag., vol. 12, no. 2, pp. 334–341, Jun. 1993.
[33] L. Zhou, M. S. Rzeszotarski, L. J. Singerman, and J. M. Chokreff, “Thedetection and quantification of retinopathy using digital angiograms,”IEEE Trans. Med. Imag., vol. 13, no. 4, pp. 619–626, Dec. 1994.
[34] T. Walter and J. C. Klein, “Segmentation of color fundus imagesof the human retina: Detection of the optic disc and the vasculartree using morphological techniques,” in Medical Data Analysis,ser. Lecture Notes in Computer Science, J. Crespo, V. Maojo,and F. Martin, Eds. Berlin, Germany: Springer-Verlag, 2001,pp. 282–287.
[35] F. Zana and J. C. Klein, “Segmentation of vessel-like patterns usingmathematical morphology and curvature evaluation,” IEEE Trans.Image Process., vol. 10, no. 7, pp. 1010–1019, Jul. 2001.
[36] A. M. Mendonça and A. Campilho, “Segmentation of retinal blood ves-sels by combining the detection of centerlines and morphological re-construction,” IEEE Trans. Med. Imag., vol. 25, no. 9, pp. 1200–1213,Sep. 2006.
[37] S. Chaudhuri, S. Chatterjee, N. Katz, M. Nelson, and M. Goldbaum,“Detection of blood vessels in retinal images using two-dimensionalmatched filters,” IEEE Trans. Med. Imag., vol. 8, no. 3, pp. 263–269,Sep. 1989.
[38] A. Hoover, V. Kouznetsova, and M. Goldbaum, “Locating blood ves-sels in retinal images by piecewise threshold probing of a matched filterresponse,” IEEE Trans. Med. Imag., vol. 19, no. 3, pp. 203–210, Mar.2000.
[39] L. Gang, O. Chutatape, and S. M. Krishnan, “Detection and measure-ment of retinal vessels in fundus images using amplitude modifiedsecond-order Gaussian filter,” IEEE Trans. Biomed. Eng., vol. 49, pp.168–172, Feb. 2002.
[40] M. Al-Rawi and H. Karajeh, “Genetic algorithm matched filter opti-mization for automated detection of blood vessels from digital retinalimages,” Comput. Methods Programs Biomed., vol. 87, pp. 248–253,2007.
[41] M. Al-Rawi, M. Qutaishat, and M. Arrar, “An improved matched filterfor blood vessel detection of digital retinal images,” Comput. Biol.Med., vol. 37, pp. 262–267, 2007.
[42] M. G. Cinsdikici and D. Aydin, “Detection of blood vessels in ophthal-moscope images using MF/ant (matched filter/ant colony) algorithm,”Comput. Methods Programs Biomed., vol. 96, pp. 85–95, 2009.

158 IEEE TRANSACTIONS ON MEDICAL IMAGING, VOL. 30, NO. 1, JANUARY 2011
[43] X. Jiang and D. Mojon, “Adaptive local thresholding by verification-based multithreshold probing with application to vessel detection inretinal images,” IEEE Trans. Pattern Anal. Mach. Intell., vol. 25, no. 1,pp. 131–137, Jan. 2003.
[44] T. McInerney and D. Terzopoulos, “T-snakes: Topology adaptivesnakes,” Med. Imag. Anal., vol. 4, pp. 73–91, 2000.
[45] L. Espona, M. J. Carreira, M. Ortega, and M. G. Penedo, “A snake forretinal vessel segmentation,” Pattern Recognition and Image Analysis,vol. 4478, Lecture Notes Comput. Sci., pp. 178–185, 2007.
[46] M. E. Martinez-Perez, A. D. Hughes, S. A. Thom, A. A. Bharath, andK. H. Parker, “Segmentation of blood vessels from red-free and fluo-rescein retinal images,” Med. Imag. Anal., vol. 11, pp. 47–61, 2007.
[47] B. S. Y. Lam and H. Yan, “A novel vessel segmentation algorithm forpathological retina images based on the divergence of vector fields,”IEEE Trans. Med. Imag., vol. 27, no. 2, pp. 237–246, Feb. 2008.
[48] G. G. Gardner, D. Keating, T. H. Williamson, and A. T. Elliott, “Auto-matic detection of diabetic retinopathy using an artificial neural net-work: A screening tool,” Br. J. Ophthalmol., vol. 80, pp. 940–944,1996.
[49] C. Sinthanayothin, J. F. Boyce, H. L. Cook, and T. H. Williamson,“Automated localisation of the optic disc, fovea and retinal blood ves-sels from digital colour fundus images,” Br. J. Ophtalmol., vol. 83, pp.902–910, 1999.
[50] M. Niemeijer, J. Staal, B. v. Ginneken, M. Loog, and M. D. Abramoff,J. Fitzpatrick and M. Sonka, Eds., “Comparative study of retinal vesselsegmentation methods on a new publicly available database,” in SPIEMed. Imag., 2004, vol. 5370, pp. 648–656.
[51] J. Staal, M. D. Abràmoff, M. Niemeijer, M. A. Viergever, and B. v.Ginneken, “Ridge based vessel segmentation in color images of theretina,” IEEE Trans. Med. Imag., vol. 23, no. 4, pp. 501–509, Apr. 2004.
[52] J. V. B. Soares, J. J. G. Leandro, R. M. Cesar, Jr., H. F. Jelinek, and M.J. Cree, “Retinal vessel segmentation using the 2D Gabor wavelet andsupervised classification,” IEEE Trans. Med. Imag., vol. 25, no. 9, pp.1214–1222, Sep. 2006.
[53] E. Ricci and R. Perfetti, “Retinal blood vessel segmentation using lineoperators and support vector classification,” IEEE Trans. Med. Imag.,vol. 26, no. 10, pp. 1357–1365, Oct. 2007.
[54] Research Section, Digital Retinal Image for Vessel Extrac-tion (DRIVE) Database. Utrecht, The Netherlands, Univ.Med. Center Utrecht, Image Sci. Inst. [Online]. Available:http://www.isi.uu.nl/Re-search/Databases/DRIVE
[55] STARE ProjectWebsite. Clemson, SC, Clemson Univ. [Online].Available: http://www.ces.clemson.edu/
[56] T. Walter, P. Massin, A. Erginay, R. Ordonez, C. Jeulin, and J. C.Klein, “Automatic detection of microaneurysms in color fundus im-ages,” Med. Image Anal., vol. 11, pp. 555–566, 2007.
[57] B. Zhang, X. Wu, J. You, Q. Li, and F. Karray, “Detection of microa-neurysms using multi-scale correlation coefficients,” Pattern Recognit.,vol. 43, pp. 2237–2248, 2010.
[58] L. Streeter and M. J. Cree, “Microaneurysm detection in colour fundusimages,” in Image Vision Comput., Nov. 2003, pp. 280–284.
[59] R. Jagoe, J. Arnold, C. Blauth, P. L. C. Smith, K. M. Taylor, andR. Wootton, “Measurement of capillary dropout in retinal angiogramsby computerised image analysis,” Pattern Recognit. Lett, vol. 13, pp.143–151, 1992.
[60] M. K. Hu, “Visual pattern recognition by moment invariants,” IRETrans. Inform. Theory, vol. IT-8, pp. 179–187, 1962.
[61] S. Bioux, M. Martin-Fernandez, L. Ungar, M. Nakamura, M. -. Koo,R. W. McCarley, and M. E. Shenton, “On evaluating brain tissueclassifiers without a ground truth,” NeuroImage, vol. 36, no. 4, pp.1207–1224, 2007.
[62] D. E. Rumelhart and J. L. McClellandthe, Parallel Distributed Pro-cessing, Explanations in the Micro Structure of Cognition, 1: Founda-tions. A Bradford Book. Cambridge, MA: MIT Press, 1988.