14 May 2009 - National Grid/media/Files/N... · Operating profit 39% down at constant currency 2008...
55
National Grid full year results 14 May 2009
Transcript of 14 May 2009 - National Grid/media/Files/N... · Operating profit 39% down at constant currency 2008...

National Grid full year results
14 May 2009

Cautionary statement
Unless otherwise stated, all financial data of National Grid contained in this presentation is as reported under IFRS.This presentation contains certain statements that are neither reported financial results nor other historical information. These statements are forward-looking statements within the meaning of Section 27A of the Securities Act of 1933, as amended, and Section 21E of the Securities Exchange Act of 1934, as amended. These statements include information with respect to National Grid’s financial condition, National Grid’s results of operations and businesses, strategy, plans and objectives. Words such as “anticipates”, “expects”, “intends”, “plans”, “believes”, “seeks”, “estimates”, “may”, “will”, “continue”, “project” and similar expressions, as well as statements in the future tense, identify forward-looking statements. These forward-looking statements are not guarantees of National Grid’s future performance and are subject to assumptions, risks and uncertainties that could cause actual future results to differ materially from those expressed in or implied by such forward-looking statements. Many of these assumptions, risks and uncertainties relate to factors that are beyond National Grid’s ability to control or estimate precisely, such as delays in obtaining, or adverse conditions contained in, regulatory approvals and contractual consents, unseasonable weather affecting the demand for electricity and gas, competition and industry restructuring, changes in economic conditions, currency fluctuations, changes in interest and tax rates, changes in energy market prices, changes in historical weather patterns, changes in laws, regulations or regulatory policies, developments in legal or public policy doctrines, the impact of changes to accounting standards, technological developments and the ability to access capital markets and other sources of credit in a timely manner on acceptable terms, especially considering the recent deterioration of market conditions in the global economy and financial markets. Other factors that could cause actual results to differ materially from those described in this presentation include the ability to integrate the businesses relating to announced or recently completed acquisitions with National Grid’s existing business to realise the expected synergies from such integration, the availability of new acquisition opportunities and the timing and success of future acquisition opportunities, the timing and success or other impact of the sales of National Grid’s non-core businesses, the failure for any reason to achieve reductions in costs or to achieve operational efficiencies, the failure to retain key management, the behaviour of UK electricity market participants on system balancing, the timing of amendments in prices to shippers in the UK gas market, the performance of National Grid’s pension schemes and the regulatory treatment of pension costs, and any adverse consequences arising from outages on or otherwise affecting energy networks, including gas pipelines owned or operated by National Grid. For a more detailed description of some of these assumptions, risks and uncertainties, together with any other risk factors, please see National Grid’s filings with and submissions to the US Securities and Exchange Commission (the “SEC”) (and in particular the "Risk Factors" and "Operating and Financial Review" sections in its most recent Annual Report on Form 20-F). Except as may be required by law or regulation, National Grid undertakes no obligation to update any of its forward-looking statements. The effects of these factors are difficult to predict. New factors emerge from time to time and National Grid cannot assess the potential impact of any such factor on its activities or the extent to which any factor, or combination of factors, may cause results to differ materially from those contained in any forward-looking statement. The contents of any website referenced herein do not form part of this document.

Steve Holliday
Chief Executive
Strong financial performance
8% annual dividend increases to 2011/12
8% up
Dividend per share *
in line with policy
20
30
40
FY
2007
FY
2008
FY
2009
FY
2010
FY
2011
FY
2012
(pen
ce)
Historical Actual Target
+8% per annum
* Recommended by the Board.
� Business performance, excluding exceptional items, remeasurements, and stranded cost recoveries for continuing operations.
14% up
Earnings per share
pro forma basis

Delivering our plans
� Invested £3.2 bn – in line with plan
� Asset base growth – UK 3%, US 4%
� KeySpan savings run rate $129m
� Procurement savings ahead of plan –
run rate exceeds £100m
� Good incentive performance
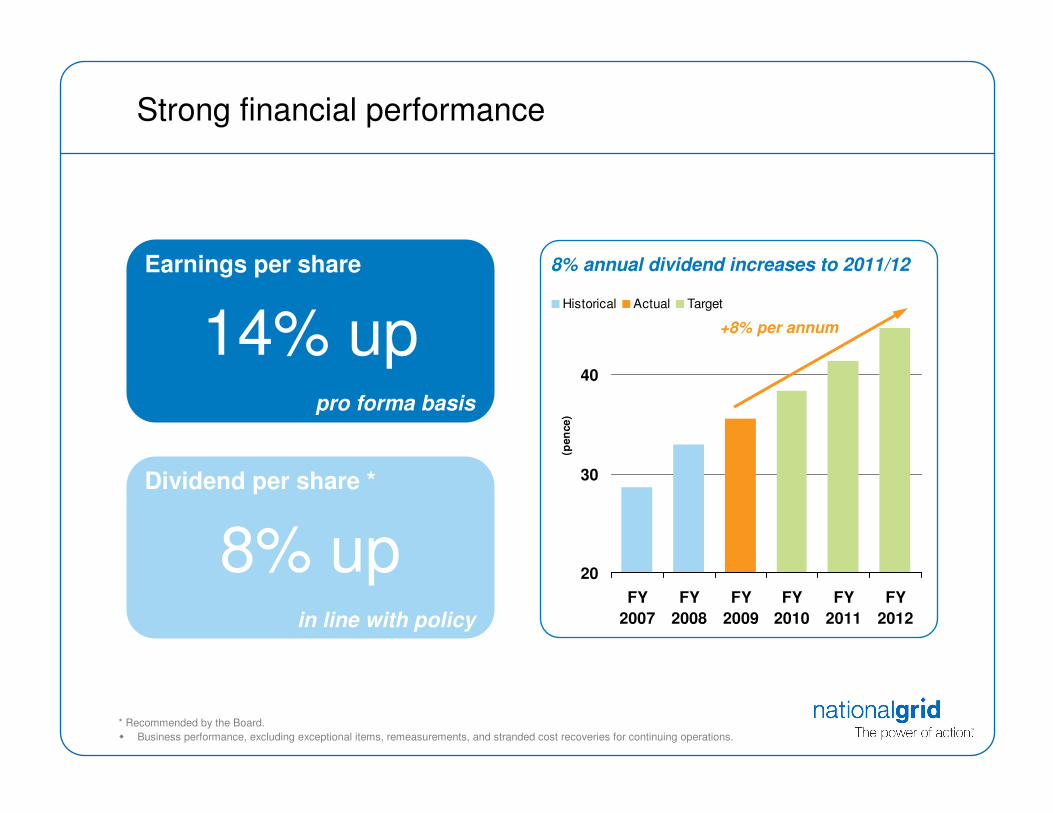
Filings
FilingsReliability targets
� UK transmission world class
� UK & US gas distribution targets exceeded
� US met targets – 99.6% of customer base
� Best performance since acquisition
� Niagara Mohawk (gas), Rhode Island (gas) and
New Hampshire (gas)
Real progress
Networks ofthe future
� Smart grid pilots in New York & Massachusetts
� Strategic UK transmission investment
�
�
�

Successful funding programme
� £4.9bn debt raised 2008/09
� Effective interest rate reduced 1.6
1.6
0.30.6
3.3
2008/09 2009/10
Funding Pre Funding 2009/10
Agreed To fund
£4.9bn


Steve Lucas
Finance Director

Financial headlines
Strong results
� Operating profit and EPS up
� Dividend cover improved* at 1.43 times
Strong financial position
� Funding programme well advanced
� Credit metrics in line with rating commitment
Well positioned for 2009/10
� Investment driving growth
� RPI indexation benefits UK revenues
� Lower effective interest rates
* On a pro forma basis.
� Business performance, excluding exceptional items, remeasurements, and stranded cost recoveries for continuing operations.
� 2008 constant currency figures calculated by applying the average 2009 rate ($1.54 to £1.00) to 2008 results (when the average rate was $2.01 to £1.00).

Transmission
Operating profit
10% upat constant currency
2008 2009FX adjustment
Operating profit mainly driven by
increases in regulated revenue
� UK regulated net revenues +£111m
� US regulated net revenues +£29m
� Other items net £(27)m
Returns
� Overall UK vanilla return above base allowance
� New England RoEs above base allowance
Transmissionoperating profit
Rest of National Grid
£1,149m£1,301m
£39m
� Business performance, excluding exceptional items, remeasurements, and stranded cost recoveries for continuing operations.
� Constant currency figures calculated by applying the average 2009 rate ($1.54 to £1.00) to 2008 results (when the average rate was $2.01 to £1.00).
45%

Gas Distribution
Operating profit
16% upat constant currency
2008 2009FX adjustment
Operating profit mainly driven by
increases in regulated revenue
� UK regulated net revenues +£63m
� US regulated net revenues +£140m
� Other items net £(26)m
Returns
� UK vanilla return above allowed return
� Downstate New York & Long Island RoEs
above base allowances
� Remaining gas RoEs below base allowances –
addressed by new rate cases
£987m
£1,284m
£120m
� Business performance, excluding exceptional items, remeasurements, and stranded cost recoveries for continuing operations.
� Constant currency figures calculated by applying the average 2009 rate ($1.54 to £1.00) to 2008 results (when the average rate was $2.01 to £1.00).
Gas Distributionoperating profit
Rest of National Grid44%

Electricity Distribution & Generation
Operating profit
39% downat constant currency
2008 2009FX adjustment
Operating profit significantly impacted by
storms and one-offs
� Storm recovery costs £(74)m
� One-off items £(45)m
� Other items net £(47)m
Returns
� New England RoEs below base allowances –
new rate case filings in May and June
� New York RoE below base allowance – new
rate case filing in early 2010
£330m£265m
£101m
� Business performance, excluding exceptional items, remeasurements, and stranded cost recoveries for continuing operations.
� Constant currency figures calculated by applying the average 2009 rate ($1.54 to £1.00) to 2008 results (when the average rate was $2.01 to £1.00).
Electricity Distribution & Generation operating profit
Rest of National Grid
9%
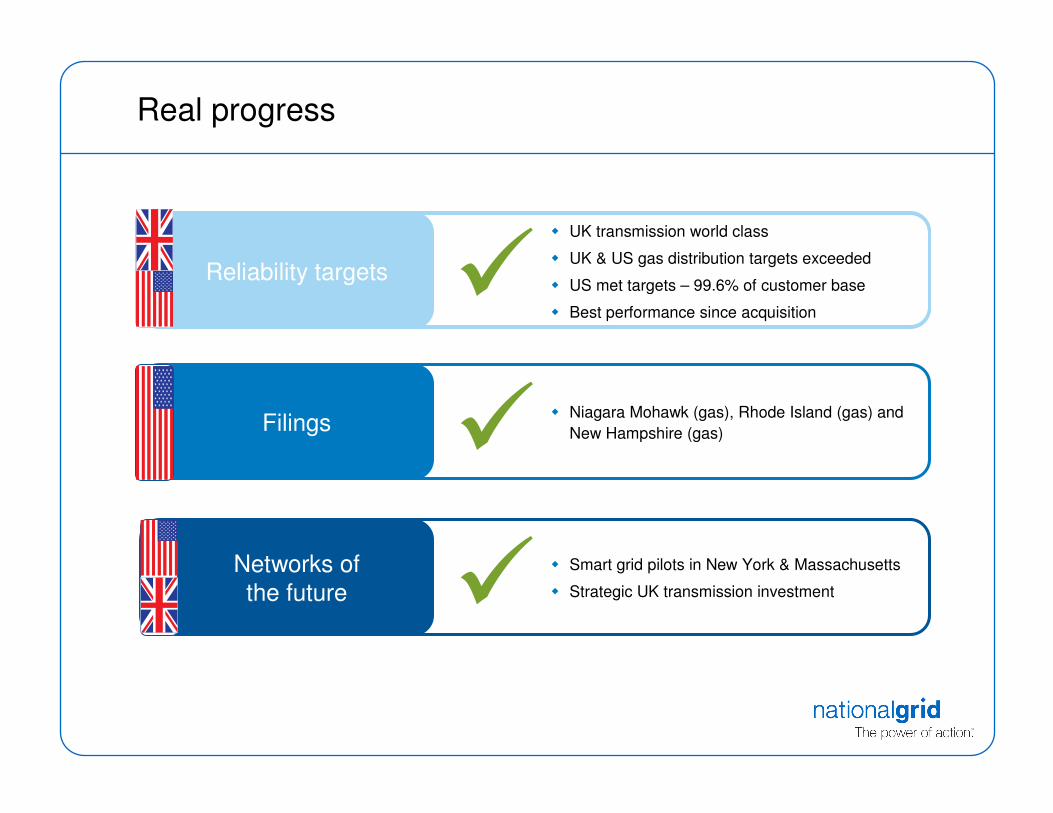
Bad debt mitigation
$212m of bad debt write-offs
� 1.51% of billed revenue
� Up from 1.44% in 2007/08
Targeted, proactive customer strategy
� Already delivering benefits
Increasing regulatory allowances
� Recoverable at ~1% of revenue
� Increases in new gas rate settlements
1.51%Bad debt write off as % of billed revenue
� Bad debts reported for continuing operations.
2008 2009Net provision increase
$190m
$73m
$212m
$17m

Non-regulated & other
� Business performance, excluding exceptional items, remeasurements, and stranded cost recoveries for continuing operations.
� Constant currency figures calculated by applying the average 2009 rate ($1.54 to £1.00) to 2008 results (when the average rate was $2.01 to £1.00).
Operating profit
50% downat constant currency
2008 2009
Property Metering, Grain & other
Operating profit significantly impacted by
planned suspension of property sales
� Property £(92)m
� Suspension of sales in current property market
� Site clean-up work continuing
� Other items net +£28m:
� Metering: mainly price increases and lower
controllable costs
� Grain LNG: Phase 2 operations commissioned
December 2008
£129m
£65m
£(92)m
+£28m
Non-regulated & otheroperating profit
Rest of National Grid
2%

29.2%
Effective tax rate
(down 250 bps on prior year)
Interest, tax, and exchange rates
5.7%
Effective interest rate
(down 60bps on prior year)
� Business performance, excluding exceptional items, remeasurements, and stranded cost recoveries for continuing operations.
+3.9%
Net currency benefit
on earnings
(770)(930)(1,150)Net finance cost, actual FX (£m)
2008actual
2008pro forma200912 months ended 31 March
(579)(537)(517)Tax (£m)
2008actual
2008pro forma200912 months ended 31 March
1.981.44Closing $ / £ rate
2.011.54Average $ / £ rate for the period
2008200912 months ended 31 March

� UK RAV indexation adjustment causes annual RoE to track inflation
� At FY2008 constant inflation(a) 3-year average RoE of 12.8%
Group return on equity
10.8%3-year average
� Strong underlying growth
� Mid-year acquisition of KeySpan impacted finance charge14% up
Earnings per share
on a pro forma basis
Earnings, return on equity and dividend
� Full year dividend of 35.64p
� Dividend cover up(b), at 1.43 times8% up
Dividend per share
in line with policy
� Business performance, excluding exceptional items, remeasurements, and stranded cost recoveries for continuing operations.
(a) Constant inflation refers only to the FY2009 UK RAV indexation adjustment added to net income, calculated using 3.8% FY2008 RPI inflation.
(b) 2007/08 dividend cover was 1.35 times on a pro forma basis.

2008 2009
Operating cash flow
Net operating cash flow
7% upat actual FX
Pensions – regulatory recovery principles
� Majority of UK on-going pension costs and
deficits are recoverable
� US on-going pensions / benefits costs and
deficits fully recoverable*
£3,119m
£3,336m
* US on-going pensions / OPEB costs & deficits are typically fully recoverable either through existing rate plans, or new rate filings. Actual pension costs for this purpose are as measured on a US GAAP basis, which includes the amortisation of deficits or surpluses
� Business performance, excluding exceptional items, remeasurements and stranded cost recoveries for continuing operations.
� Further details on pensions including IAS19 data and regulatory recovery principles available in the appendix.
3,336Net operating cash flow
(23)Working capital & other
(678)Pensions
1,122Depreciation & amortisation
2,915Operating profit
£mFor the year ended 31 March 2009
Transmission Gas Distribution
Elec. Dist. & Gen. Non-reg.
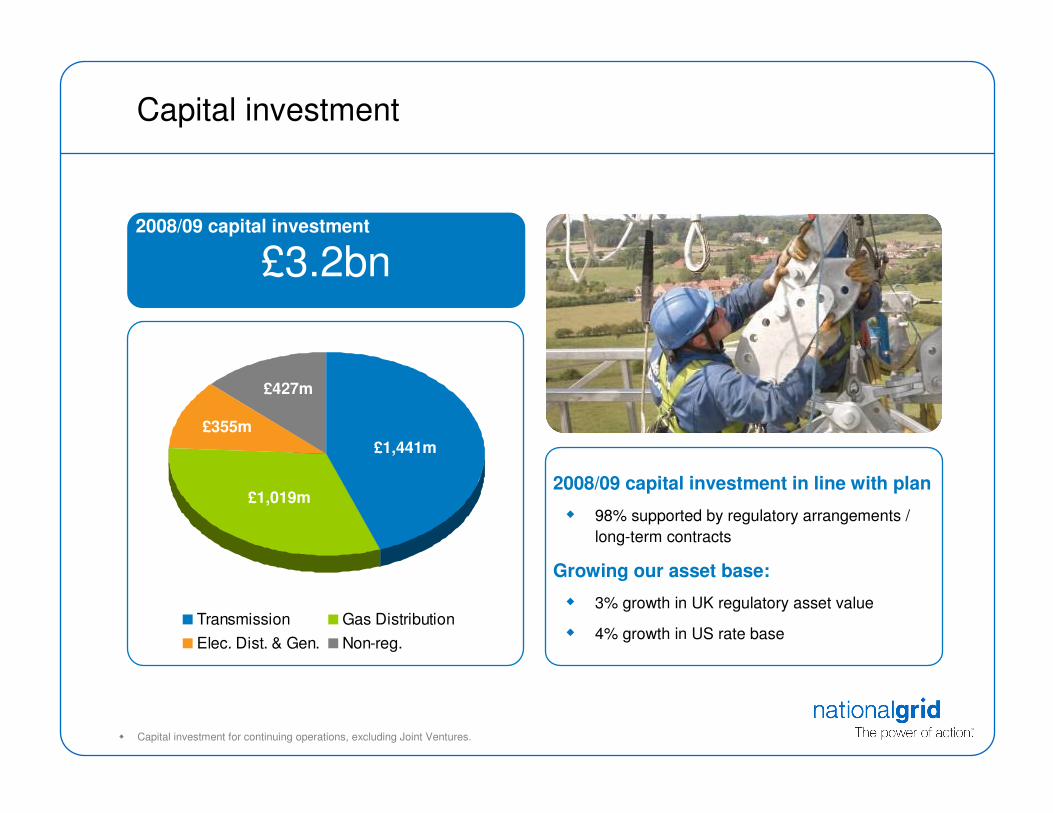
2008/09 capital investment in line with plan
� 98% supported by regulatory arrangements /
long-term contracts
Growing our asset base:
� 3% growth in UK regulatory asset value
� 4% growth in US rate base
Capital investment
£3.2bn2008/09 capital investment
� Capital investment for continuing operations, excluding Joint Ventures.
£427m
£355m
£1,019m
£1,441m

Net debt
Closing net debt
£(22.7)bn
2008 2009FX movements
£(17.6)bn£(18.7)bn
(a) Business performance, excluding exceptional items, remeasurements and stranded cost recoveries for continuing operations.
(b) Includes cash flows relating to exceptional items, stranded cost recoveries, and other non cash items.
£(4.0)bn
(22,673)Net debt at 31 March 2009
(3,951)FX movements
(1,081)Net change in net debt
345Other (b)
(1,465)Dividends & share repurchase
1,617Disposals
(3,231)Investment
(1,683)Interest & tax
3,336Operating cash flow (a)
(17,641)Net debt at 1 April 2008
£m

Planned further long-term issuance
activity
� ~£0.6m long term debt for 2009/10
� Pre-funding for 2010/11
~£3bn of committed banking facilities
Multiple funding opportunities maximise
flexibility and speed of execution
� 16 credit rated entities
� 4 debt shelves
Successfully funding 2009/10
~75%2009/10 funding
funding requirement Issued to date
Refinancing New funding Issued / agreed
~£1.1bn
~£1.4bn£1.9bn
complete
2009/10 long term funding requirement
~£0.6bn to go
� 2009/10 funding requirements are based on current exchange rates, and assume no commercial paper or short term debt issuance.

Strong financial position
Interest cover
� Aim to manage within a 3.0 – 3.5x range
� Consistent with single ‘A’ range credit rating
commitment at UK OpCo level
Credit rating metrics strengthen in 2009/10
� 2009/10 revenues ‘locked in’
� Interest costs fall with lower RPI
� Share buy-back suspended
3.1 timesInterest cover
2.50x
2.75x
3.00x
3.25x
3.50x
3.75x
4.00x
2007 2008 2009
Target range Interest cover

Financial summary
Strong results
Strong financial position
Well positioned for 2009/10


Steve Holliday
Chief Executive

Disciplined capital investment
Invested £3.2 bn – in line with plan
Successfully managing the challenges of
material price inflation
� Innovative asset management
� Maintaining safety and reliability
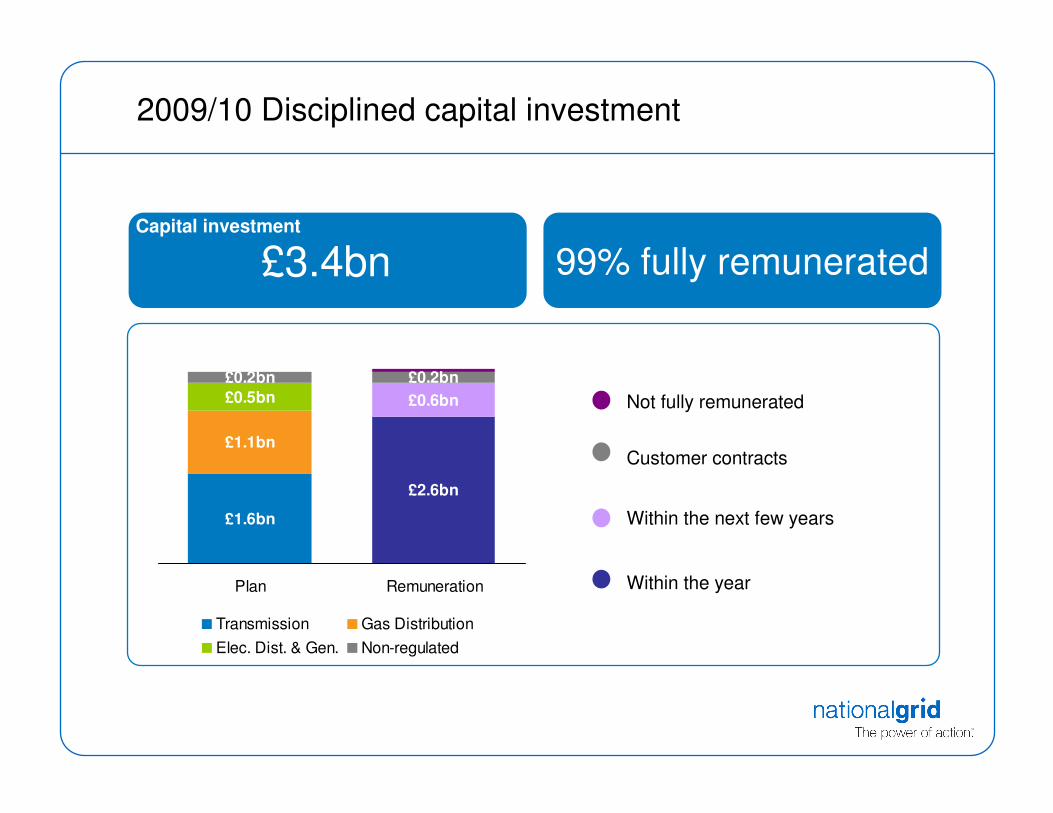
99% fully remunerated
£0.5bn £0.6bn
£0.2bn
£1.6bn
£1.1bn
£0.2bn
£2.6bn
£0.1bn
Plan Remuneration
Transmission Gas Distribution
Elec. Dist. & Gen. Non-regulated
� Not fully remunerated
� Customer contracts
� Within the next few years
� Within the year
2009/10 Disciplined capital investment
£3.4bnCapital investment
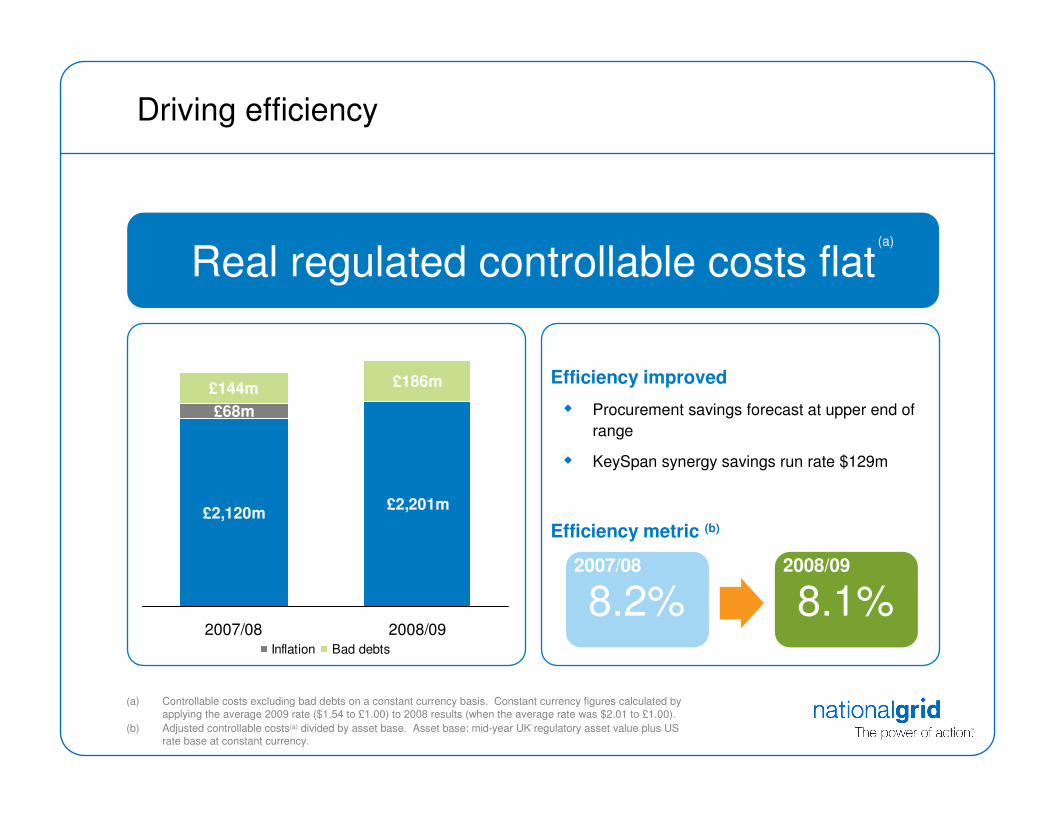
Driving efficiency
Efficiency improved
� Procurement savings forecast at upper end of
range
� KeySpan synergy savings run rate $129m
Efficiency metric (b)
Real regulated controllable costs flat
£2,120m£2,201m
£68m
£144m £186m
2007/08 2008/09Inflation Bad debts
(a) Controllable costs excluding bad debts on a constant currency basis. Constant currency figures calculated by applying the average 2009 rate ($1.54 to £1.00) to 2008 results (when the average rate was $2.01 to £1.00).
(b) Adjusted controllable costs(a) divided by asset base. Asset base: mid-year UK regulatory asset value plus US rate base at constant currency.
8.2%2007/08
8.1%2008/09
(a)

Current US regulatory position
Regulatory entity Base allowed return Achieved return
New England Power
Narragansett (electricity transmission)
Canadian interconnector
KEDNY
KEDLI
11.14% 11.7%
11.14% 11.6%
13.0% 13.5%
9.8% 11.9%
9.8% 11.1%
Previously agreed
33%
(a) Includes Long Island generation rate base of $574m.
(b) Includes Granite State and Nantucket electric rate bases, totalling $131m.
Settlement reached / pending (a)
Rhode Island (gas)Double digit basereturns expected
7.6%
NiMo (gas) 4.8%
New Hampshire (gas) 4.4%
14%47%
To be filed in the next 15 months (b)
Massachusetts Electric Company 7.0%
Rhode Island (electric) 2.3%
NiMo (electric) 6.7%
Boston gas
Colonial gas 8.3%
Essex gas
Massachusetts gas
53%
100%
% of US rate base

Our US regulatory agenda
� Timely recovery of costs
� Pension & benefit true ups
� Bad debt recovery
� Decoupling
� Investment
� Competitive returns
Jan 2010 Mass Electric Company
Jan 2010 Narragansett (electric)
Nov 2010 Boston gas
Nov 2010 Colonial gas
Nov 2010 Essex gas
Jan 2011 NiMo (electric)
What we are asking for Anticipated new rates effective

Outlook for 2009/10 strong
Focus for 2009/10
� Regulation
� Disciplined investment
� Deliver opex savings and drive efficiency


Appendix

Business performance results
8%33.00p35.64pDividend per share
6%47.8p50.9pEarnings per share
(3)%1,8291,770Profit before tax (actual FX)
2%2,8552,915Operating profit (constant FX)
12%2,5952,915Operating profit (actual FX)
change20082009For the year ended 31 March (£m)
� Business performance, excluding exceptional items, remeasurements and stranded cost recoveries for continuing operations.
� 2008 constant currency figures calculated by applying the average 2009 rate ($1.54 to £1.00) to 2008 results (when the average rate was $2.01 to £1.00).
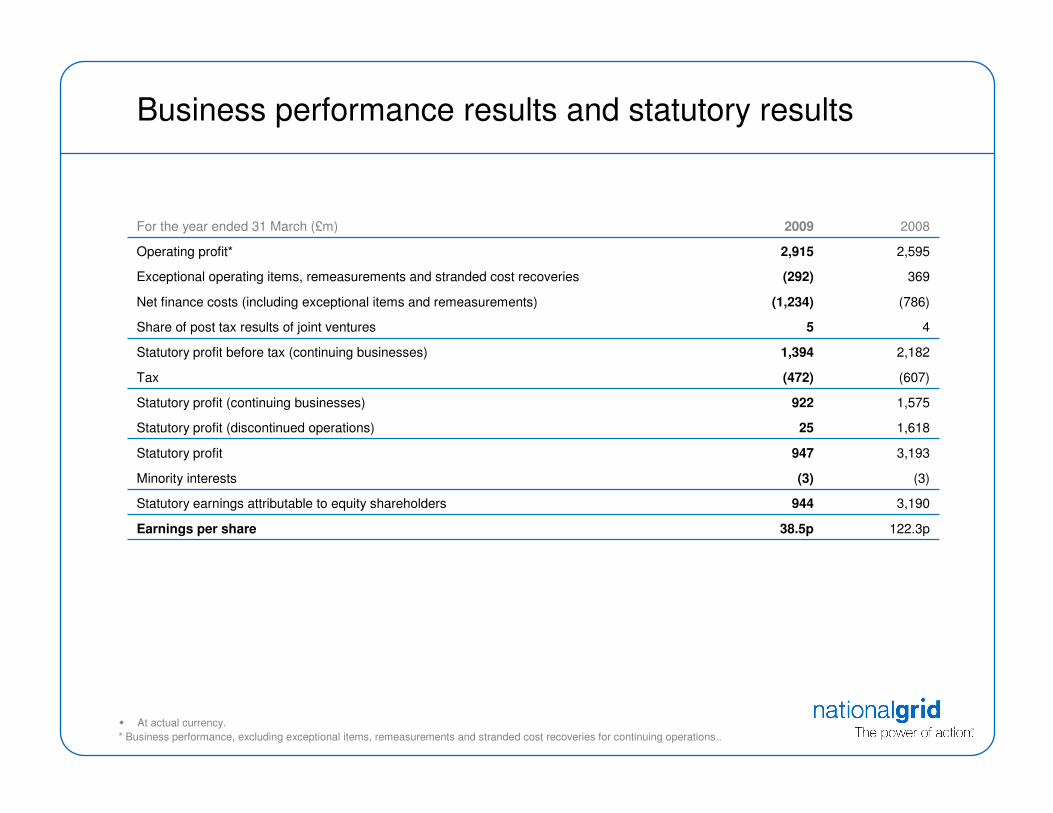
Business performance results and statutory results
122.3p38.5pEarnings per share
3,190944Statutory earnings attributable to equity shareholders
(3)(3)Minority interests
3,193947Statutory profit
1,61825Statutory profit (discontinued operations)
1,575922Statutory profit (continuing businesses)
(607)(472)Tax
2,1821,394Statutory profit before tax (continuing businesses)
45Share of post tax results of joint ventures
(786)(1,234)Net finance costs (including exceptional items and remeasurements)
369(292)Exceptional operating items, remeasurements and stranded cost recoveries
2,5952,915Operating profit*
20082009For the year ended 31 March (£m)
� At actual currency.
* Business performance, excluding exceptional items, remeasurements and stranded cost recoveries for continuing operations..

Revenue
11,42315,624Total revenue
(210)(226)(Sales eliminations)
382435Stranded cost recoveries
642719Non-regulated businesses and other
3,1264,537Electricity distribution (excluding stranded cost recoveries)
2,8454,786Gas distribution - US
1,3831,466Gas distribution - UK
299420Transmission - US
2,9563,487Transmission - UK
20082009For the year ended 31 March (£m)
� At actual currency.
� Business performance, excluding exceptional items, remeasurements and stranded cost recoveries for continuing operations.
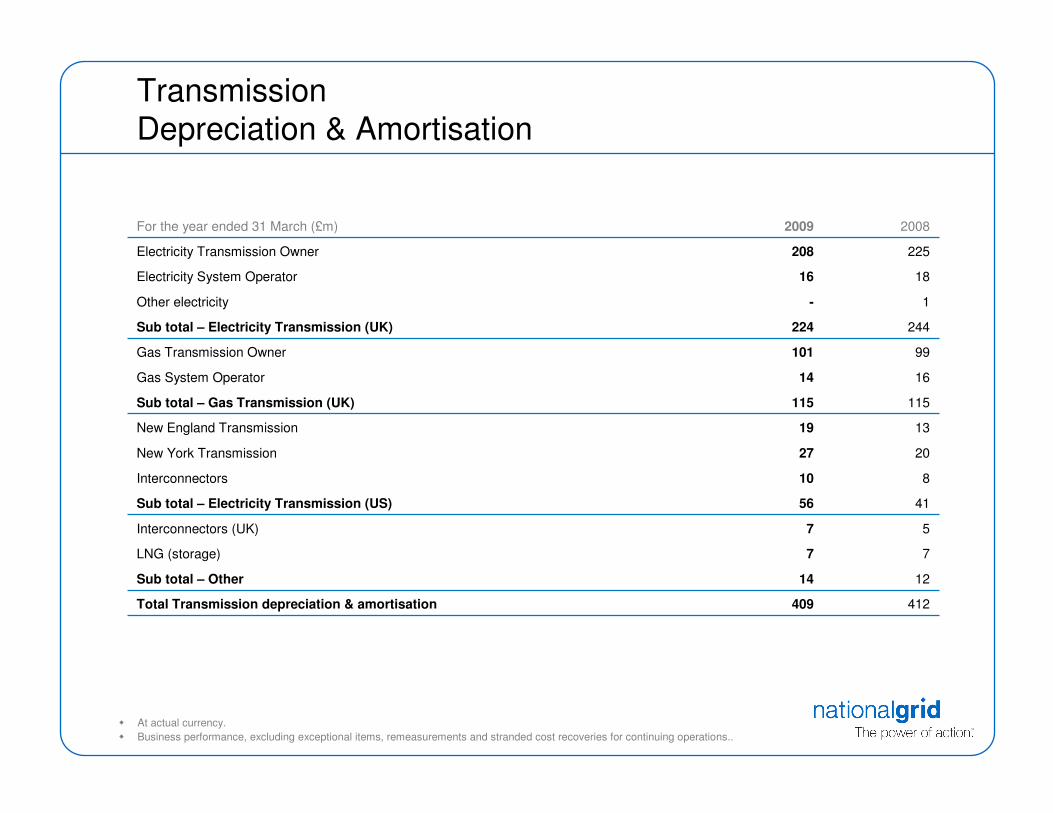
TransmissionDepreciation & Amortisation
412409Total Transmission depreciation & amortisation
1214Sub total – Other
77LNG (storage)
57Interconnectors (UK)
4156Sub total – Electricity Transmission (US)
810Interconnectors
2027New York Transmission
1319New England Transmission
115115Sub total – Gas Transmission (UK)
1614Gas System Operator
99101Gas Transmission Owner
244224Sub total – Electricity Transmission (UK)
1-Other electricity
1816Electricity System Operator
225208Electricity Transmission Owner
20082009For the year ended 31 March (£m)
� At actual currency.
� Business performance, excluding exceptional items, remeasurements and stranded cost recoveries for continuing operations..

TransmissionOperating costs (excluding depreciation & amortisation)
1,6942,227Total Transmission operating costs (excluding depreciation & amortisation)
3224Sub total – Other
--Internal eliminations
2925LNG (storage)
3(1)Interconnectors (UK)
131190Sub total – Electricity Transmission (US)
1013Interconnectors
6896New York Transmission
5381New England Transmission
301369Sub total – Gas Transmission (UK)
88Other gas
128189Gas System Operator
165172Gas Transmission Owner
1,2301,644Sub total – Electricity Transmission (UK)
3141Other electricity
9011,255Electricity System Operator
298348Electricity Transmission Owner
20082009For the year ended 31 March (£m)
� At actual currency.
� Business performance, excluding exceptional items, remeasurements and stranded cost recoveries for continuing operations..

TransmissionOperating profit
1,1491,301Total Transmission operating profit
4572Sub total – Other
12-LNG (storage)
3372Interconnectors (UK)
128175Sub total – Electricity Transmission (US)
78Interconnectors
4861New York Transmission
73106New England Transmission
305321Sub total – Gas Transmission (UK)
--Other gas
100117Gas System Operator
205204Gas Transmission Owner
671733Sub total – Electricity Transmission (UK)
71Other electricity
419Electricity System Operator
623723Electricity Transmission Owner
20082009For the year ended 31 March (£m)
� At actual currency.
� Business performance, excluding exceptional items, remeasurements and stranded cost recoveries for continuing operations..
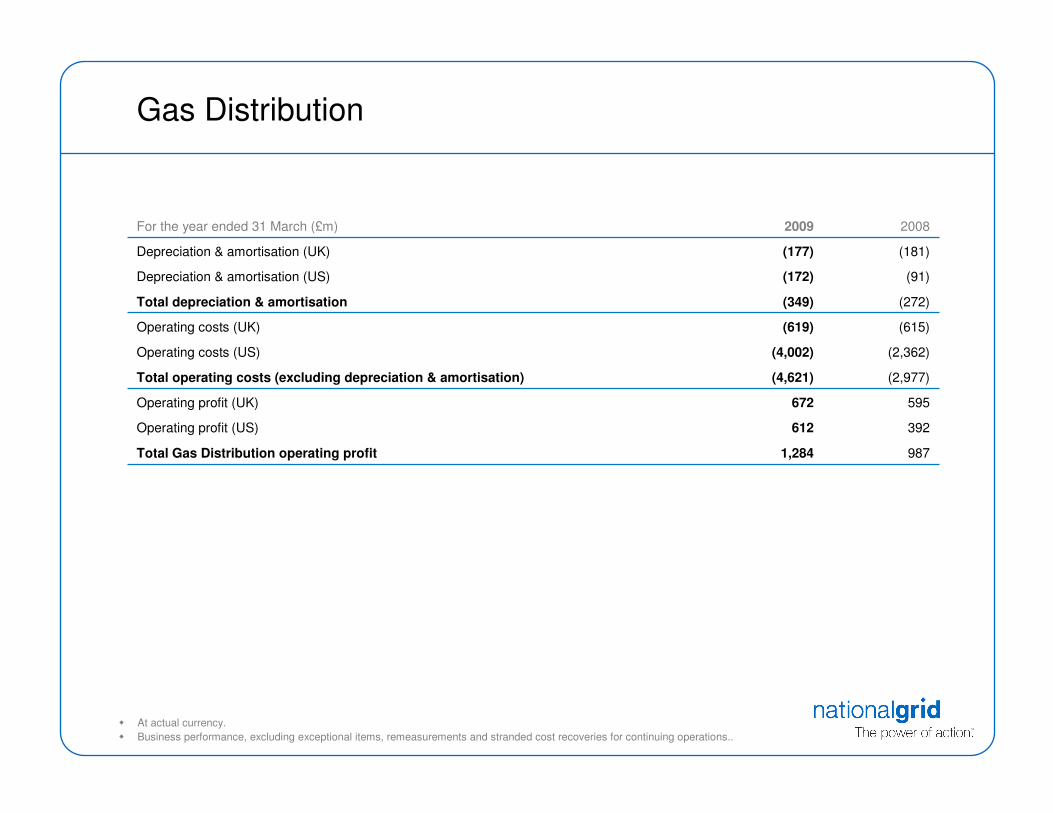
Gas Distribution
9871,284Total Gas Distribution operating profit
392612Operating profit (US)
595672Operating profit (UK)
(2,977)(4,621)Total operating costs (excluding depreciation & amortisation)
(2,362)(4,002)Operating costs (US)
(615)(619)Operating costs (UK)
(272)(349)Total depreciation & amortisation
(91)(172)Depreciation & amortisation (US)
(181)(177)Depreciation & amortisation (UK)
20082009For the year ended 31 March (£m)
� At actual currency.
� Business performance, excluding exceptional items, remeasurements and stranded cost recoveries for continuing operations..

Electricity Distribution & Generation
330265Total Electricity Distribution & Generation operating profit
(2,650)(4,054)Operating costs (excluding depreciation & amortisation)
(146)(223)Depreciation & amortisation
20082009For the year ended 31 March (£m)
� At actual currency.
� Business performance, excluding exceptional items, remeasurements and stranded cost recoveries for continuing operations..
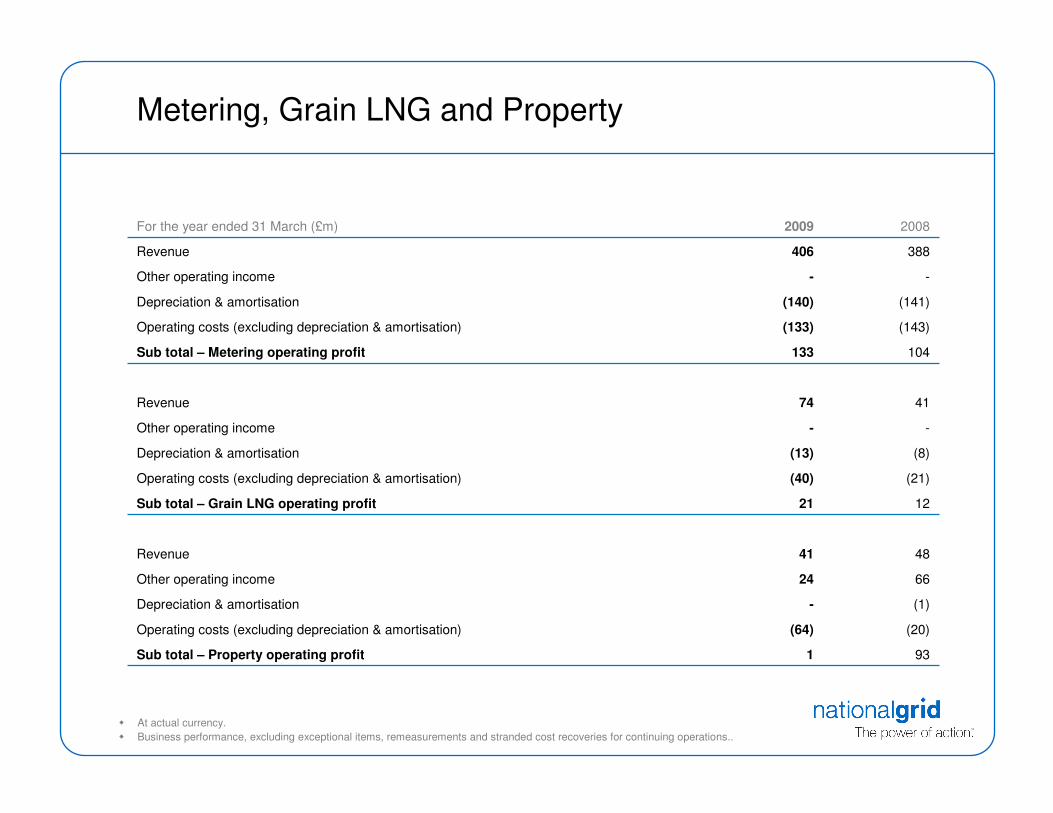
Metering, Grain LNG and Property
931Sub total – Property operating profit
(20)(64)Operating costs (excluding depreciation & amortisation)
(1)-Depreciation & amortisation
6624Other operating income
4841Revenue
1221Sub total – Grain LNG operating profit
(21)(40)Operating costs (excluding depreciation & amortisation)
(8)(13)Depreciation & amortisation
--Other operating income
4174Revenue
104133Sub total – Metering operating profit
(143)(133)Operating costs (excluding depreciation & amortisation)
(141)(140)Depreciation & amortisation
--Other operating income
388406Revenue
20082009For the year ended 31 March (£m)
� At actual currency.
� Business performance, excluding exceptional items, remeasurements and stranded cost recoveries for continuing operations..
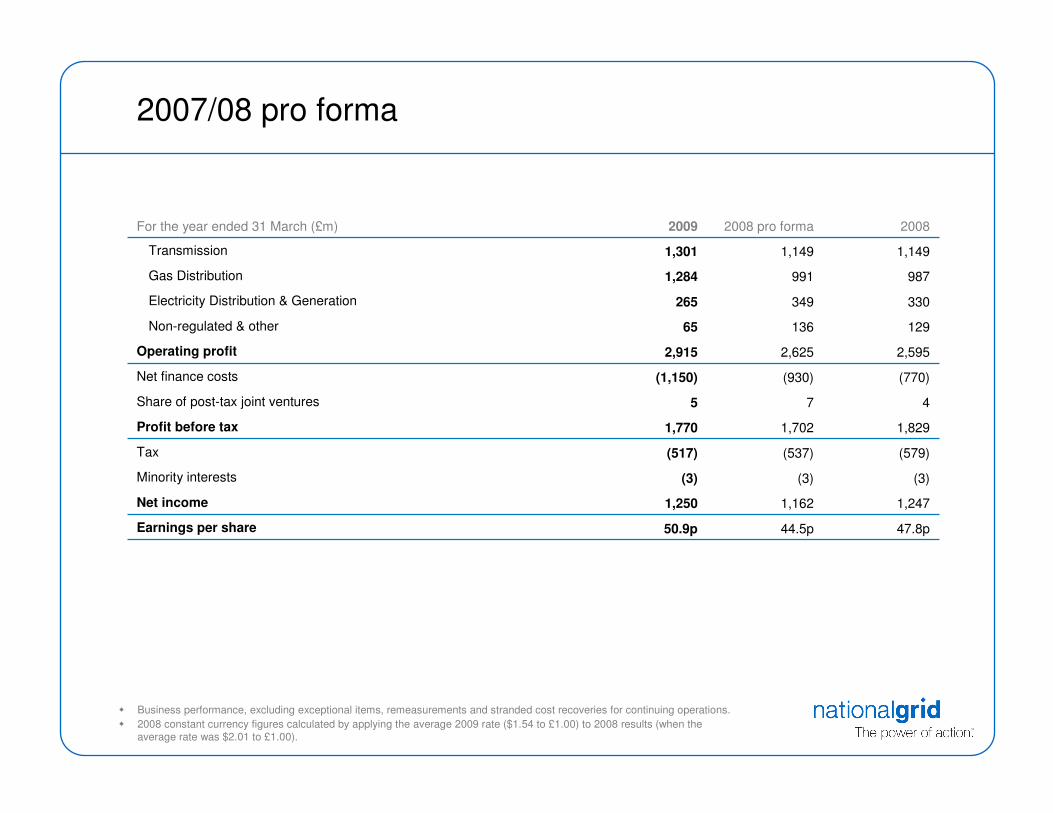
2007/08 pro forma
47.8p44.5p50.9pEarnings per share
1,2471,1621,250Net income
(3)(3)(3)Minority interests
(579)(537)(517)Tax
1,8291,7021,770Profit before tax
475Share of post-tax joint ventures
(770)(930)(1,150)Net finance costs
2,5952,6252,915Operating profit
12913665Non-regulated & other
330349265Electricity Distribution & Generation
9879911,284Gas Distribution
1,1491,1491,301Transmission
20082008 pro forma2009For the year ended 31 March (£m)
� Business performance, excluding exceptional items, remeasurements and stranded cost recoveries for continuing operations.
� 2008 constant currency figures calculated by applying the average 2009 rate ($1.54 to £1.00) to 2008 results (when the average rate was $2.01 to £1.00).
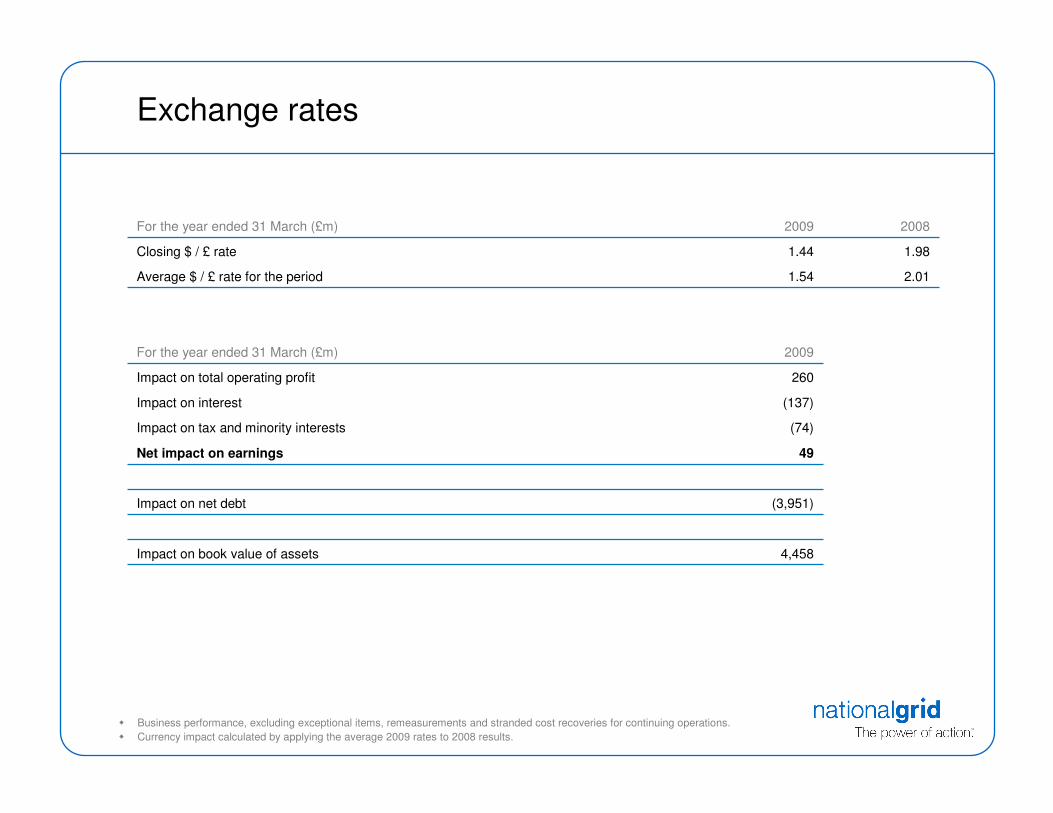
Exchange rates
4,458Impact on book value of assets
(3,951)Impact on net debt
49Net impact on earnings
(74)Impact on tax and minority interests
(137)Impact on interest
260Impact on total operating profit
2009For the year ended 31 March (£m)
2.011.54Average $ / £ rate for the period
1.981.44Closing $ / £ rate
20082009For the year ended 31 March (£m)
� Business performance, excluding exceptional items, remeasurements and stranded cost recoveries for continuing operations.
� Currency impact calculated by applying the average 2009 rates to 2008 results.
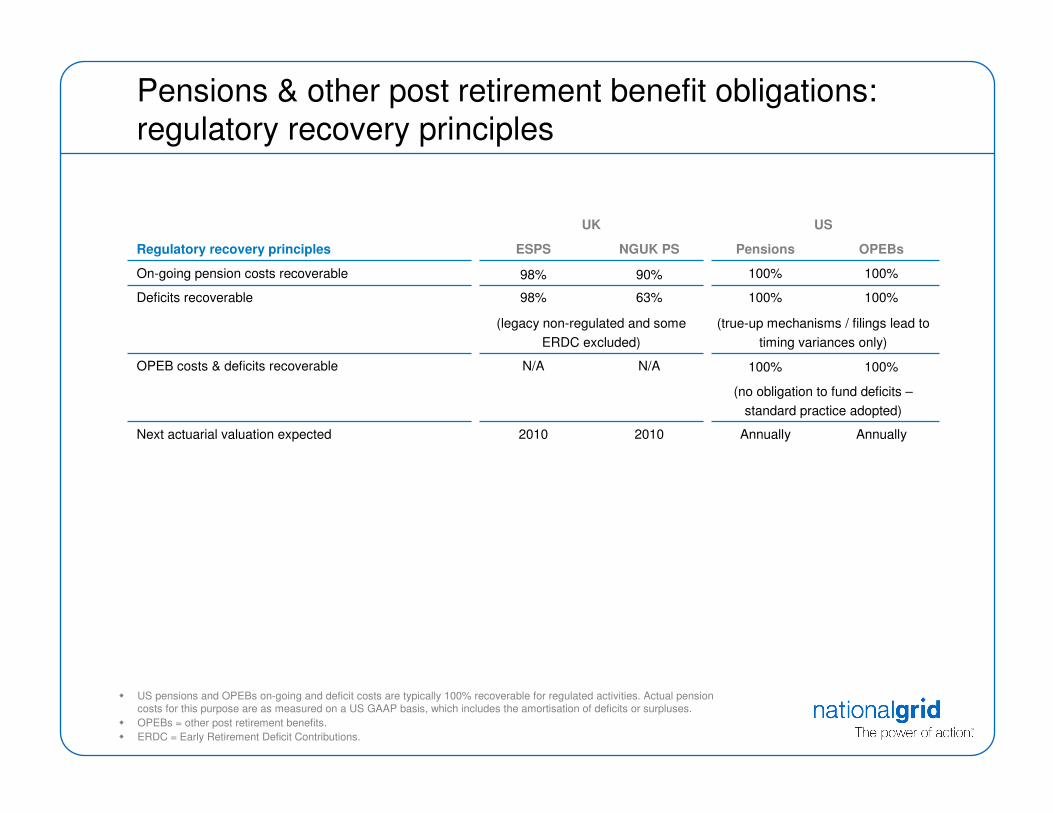
Pensions & other post retirement benefit obligations: regulatory recovery principles
AnnuallyAnnually20102010Next actuarial valuation expected
(no obligation to fund deficits –
standard practice adopted)
100%100%N/AN/AOPEB costs & deficits recoverable
(true-up mechanisms / filings lead to
timing variances only)
(legacy non-regulated and some
ERDC excluded)
100%100%63%98%Deficits recoverable
100%100%90%98%On-going pension costs recoverable
OPEBsPensionsNGUK PSESPSRegulatory recovery principles
USUK
� US pensions and OPEBs on-going and deficit costs are typically 100% recoverable for regulated activities. Actual pension costs for this purpose are as measured on a US GAAP basis, which includes the amortisation of deficits or surpluses.
� OPEBs = other post retirement benefits.
� ERDC = Early Retirement Deficit Contributions.

US pensions & other post retirement benefit obligations: regulatory treatment by rate plan
PUC Staff generally oppose reconciliationNew Hampshire
Propose reconciliation mechanism in rate case filing in 2009Rhode Island (electric)
Propose reconciliation mechanism in rate case filing in 2009 (MECO) and next gas filings (TBD)Massachusetts(MECO, Colonial gas, Essex gas)
MechanismJurisdiction
Approach 2:Pension / OPEBs are a component of cost of service used to set rates. Level remains in effect until next rate case with no true-up.
Base rates with no true up at FERC but true-up at end of LIPA contractLIPA Generation
Formula Rate – monthly reconciliation of actual expensesFERC
Annual reconciliation agreed in recent rate caseRhode Island (gas)
Reconciliation with deferred amounts collected/ credited over 3 yearsMassachusetts (Boston gas)
Reconciliation with deferred amounts collected / credited in CTC (deferral account) resetNew York
MechanismJurisdiction
Approach 1:Periodic reconciliation of revenues to reconcile to actual pension / OPEB costs.
Each of our five US regulatory commissions regulate the level of costs related to pensions and other post-retirement employee benefits (OPEBs) that are charged to customers.

Pensions & other post retirement benefit obligations: (IAS19 data)
USUK
NG totalOPEBsPensionsNGUK PSESPSAt 31 March 2009 (£m)
7.3%7.3%6.8%6.8%Discount rates
(1,423)(794)(518)183(294)(Deficit) / surplus net of deferred tax
1,388814531(71)114Deferred tax*
(2,811)(1,608)(1,049)254(408)(Deficit) / surplus
(18,330)(2,330)(3,661)(10,786)(1,553)Present value of liabilities
15,5197222,61211,0401,145Market value of assets
* Deferred tax is calculated using the UK statutory tax rate and the US tax rate attributable to the combined pension and OPEBsbalance at 31 March 2009.
� OPEBs = other post retirement benefits.

Timing impacts
3(8)42(15)4(20)Year on year variance
(18)1021(10)3(42)Over/(under) recoveries carried forward to 2009/10
26-46107(37)Impact on 2008/09 collected income
(44)10(25)(20)(4)(5)Over/(under) recoveries b/fwd from 2007/08
TotalUSUKUSUK
Elec.
Dist. &
Gen
Gas DistributionTransmission

Regulated asset base and returnsTransmission
Base allowed return
Rate base / RAV
Achieved return
Sharing factors(shareholder retention at RoE)
Last / next rate case filing
UK electricity transmission (a)
New England Power (c)
Equity / debt(assumed)
UK gas transmission (b)
Narragansett electric (d)
(Transmission)
CanadianInterconnector (e)
Regulator Ofgem
£6,720m
5.05%(‘vanilla’ return)
4.7%
40 / 60
100%plus incentive
schemes
New price control from April 2012
FERC
$790m
11.14%(RoE)
11.7%
65 / 35
100%
Monthly formula rates
FERC
$73m
13.0%(RoE)
13.5%
40 / 60
100%
-
Ofgem
£4,281m
5.05%(‘vanilla’ return)
6.9%
40 / 60
100%plus incentive
schemes
New price control from April 2012
FERC
$169m
11.14%(RoE)
11.6%
50 / 50
100%
Monthly formula rates
(a) Includes electricity system operator regulatory asset base of £55m. The system operator is subject to annual price controls.
(b) Includes gas system operator regulatory asset base of £42m. The system operator is subject to annual price controls.
(c) New England Power rate base as at 31 March 2009. Excludes $13m of US stranded assets rate base.
(d) Narragansett electric (Transmission) rate base was reported within the distribution rate base in 2007/08.
(e) National Grid retains 100% of the return it earns on its stake of ~54% in the Canadian Interconnector.
Asset base and returns reported by regulatory entity as at 31 March 2009 and 31 December 2008 for UK and US entities respectively.

Regulated asset base and returnsGas Distribution
Base allowed return
Rate base / RAV
Achieved return
Sharing factors(shareholder retention at RoE)
Last / next rate case filing
UK gas distribution
Down-state New York(KEDNY)
Equity / debt(assumed)
Long Island(KEDLI)
Up-stateNew York (a)
(NiMo gas)
Massachusetts gas (b)
Narragansett gas (c) Energy North (d)
Regulator Ofgem
£6,550m
4.94%(‘vanilla’ return)
5.8%
37.5 / 62.5
100%plus incentive
schemes
New price control from April 2013
New York PSC
$1,795m
9.8%(RoE)
11.1%
45 / 55
100% to 10.5%50% to 12.5%35% to 13.5%
Effective from January 2008
New York PSC
$2,294m
9.8%(RoE)
11.9%
45 / 55
100% to 10.5%50% to 12.5%35% to 13.5%
Effective from January 2008
New York PSC
$1,067m
10.2%(RoE)
4.8%
44 / 56
100% to 11.35%50% to 13.6%25% to 15.6%
10% above 15.6%
New rate agreement
pending
Massachusetts DPU
$2,425m
10.6%(RoE)
8.2%
~50 / ~50
100% to 14.2%75% above 14.2%
New rate filing planned for 2010
Rhode Island PUC
$337m
10.5%(RoE)
7.6%
48 / 52
100% to 10.5%50% to 11.5%
25% above 11.5%
Effective from December 2008
New Hampshire PUC
$191m
TBC
4.4%
50 / 50
TBC
New rate agreement
pending
(a) Settlement agreement reached on new rate plan, decision pending. Previously part of the 2001 combined NiMo electric & gas rate plan.
(b) Massachusetts gas currently comprises three separate entities: Boston gas, Colonial gas and Essex gas. A combined gas rate plan will be filed in 2010. Base allowed and achieved RoEs are weighted averages (using rate base). Rate base includes $937m of embedded goodwill that will be reflected in the 2010 rate case filing. Earnings sharing factors apply to Boston gas only.
(c) Narragansett gas rate plan agreed February 2008, rates effective from December 2008.
(d) Energy North temporary rate increase effective August 2008, settlement agreed January 2009, NH PUC decision pending.
Asset base and returns reported by regulatory entity as at 31 March 2009 and 31 December 2008 for UK and US entities respectively.
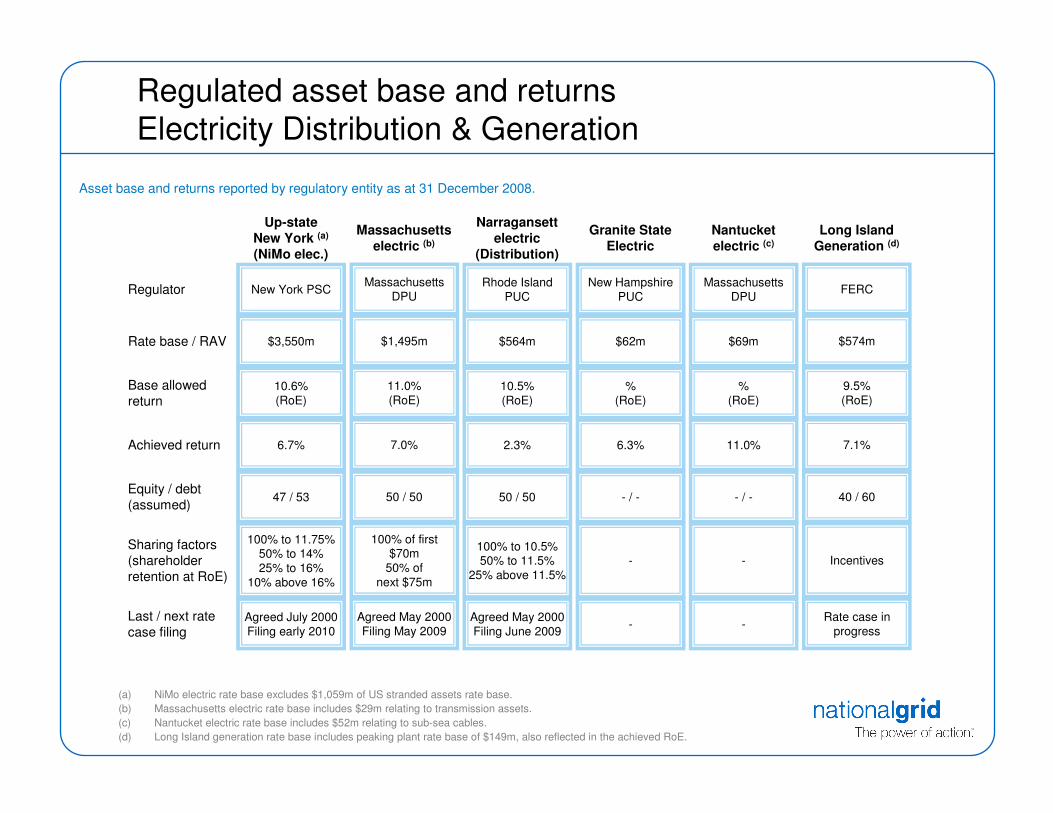
Regulated asset base and returnsElectricity Distribution & Generation
Base allowed return
Rate base / RAV
Achieved return
Sharing factors(shareholder retention at RoE)
Last / next rate case filing
Up-stateNew York (a)
(NiMo elec.)
Narragansett electric
(Distribution)
Equity / debt(assumed)
Massachusetts electric (b)
Granite State Electric
Nantucket electric (c)
Long Island Generation (d)
RegulatorMassachusetts
DPU
$1,495m
11.0%(RoE)
7.0%
50 / 50
100% of first $70m
50% ofnext $75m
Agreed May 2000Filing May 2009
$62m
%(RoE)
6.3%
- / -
-
-
Massachusetts DPU
$69m
%(RoE)
11.0%
- / -
-
-
FERC
$574m
9.5%(RoE)
7.1%
40 / 60
Incentives
Rate case in progress
New York PSC
$3,550m
10.6%(RoE)
6.7%
47 / 53
100% to 11.75%50% to 14%25% to 16%
10% above 16%
Agreed July 2000Filing early 2010
Rhode Island PUC
$564m
10.5%(RoE)
2.3%
50 / 50
100% to 10.5%50% to 11.5%
25% above 11.5%
Agreed May 2000Filing June 2009
New Hampshire PUC
Asset base and returns reported by regulatory entity as at 31 December 2008.
(a) NiMo electric rate base excludes $1,059m of US stranded assets rate base.
(b) Massachusetts electric rate base includes $29m relating to transmission assets.
(c) Nantucket electric rate base includes $52m relating to sub-sea cables.
(d) Long Island generation rate base includes peaking plant rate base of $149m, also reflected in the achieved RoE.
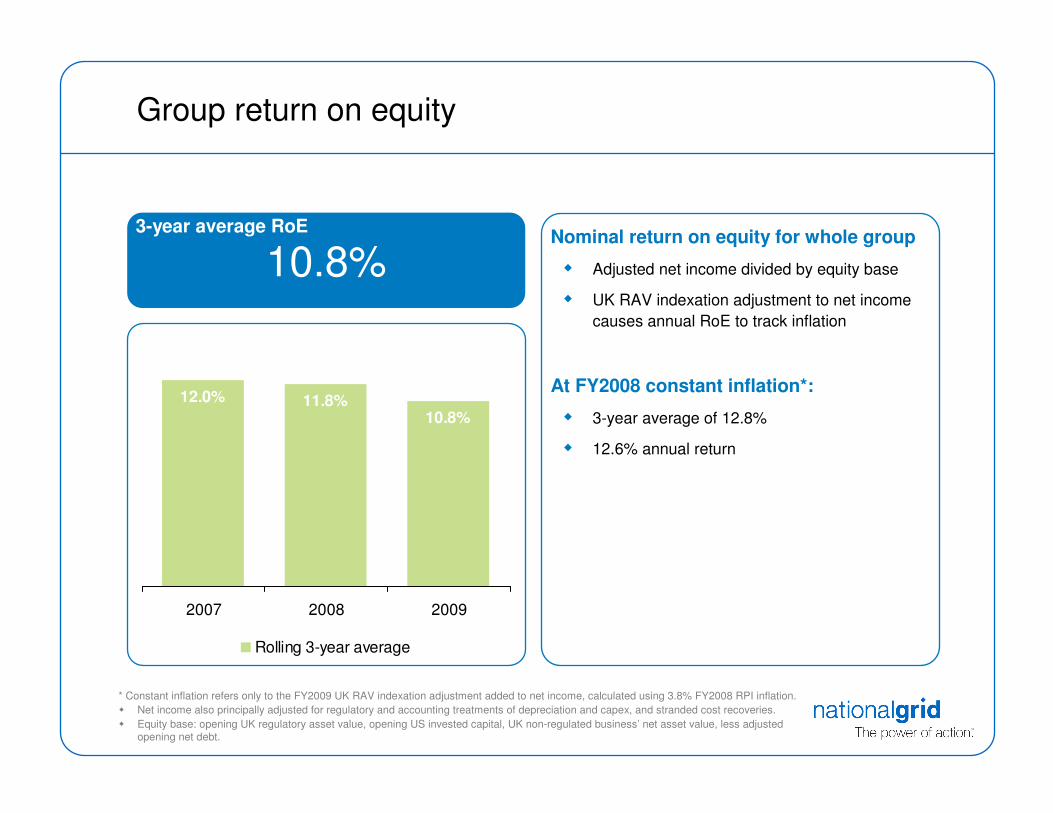
Group return on equity
Nominal return on equity for whole group
� Adjusted net income divided by equity base
� UK RAV indexation adjustment to net income
causes annual RoE to track inflation
At FY2008 constant inflation*:
� 3-year average of 12.8%
� 12.6% annual return
10.8%3-year average RoE
12.0% 11.8%10.8%
2007 2008 2009
Rolling 3-year average
* Constant inflation refers only to the FY2009 UK RAV indexation adjustment added to net income, calculated using 3.8% FY2008 RPI inflation.
� Net income also principally adjusted for regulatory and accounting treatments of depreciation and capex, and stranded cost recoveries.
� Equity base: opening UK regulatory asset value, opening US invested capital, UK non-regulated business’ net asset value, less adjusted opening net debt.
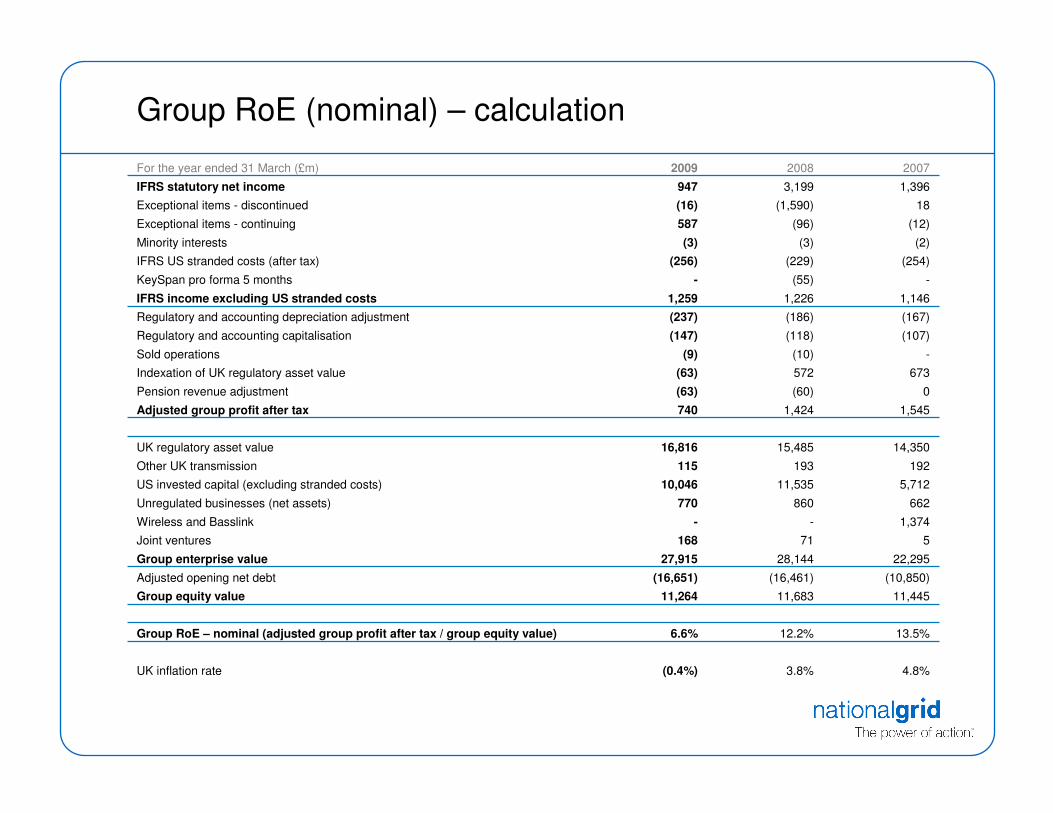
Group RoE (nominal) – calculation
1,3963,199947IFRS statutory net income
18(1,590)(16)Exceptional items - discontinued
(12)(96)587Exceptional items - continuing
(2)(3)(3)Minority interests
4.8%3.8%(0.4%)UK inflation rate
13.5%12.2%6.6%Group RoE – nominal (adjusted group profit after tax / group equity value)
11,44511,68311,264Group equity value
(10,850)(16,461)(16,651)Adjusted opening net debt
22,29528,14427,915Group enterprise value
571168Joint ventures
1,374--Wireless and Basslink
662860770Unregulated businesses (net assets)
5,71211,53510,046US invested capital (excluding stranded costs)
192193115Other UK transmission
14,35015,48516,816UK regulatory asset value
1,5451,424740Adjusted group profit after tax
0(60)(63)Pension revenue adjustment
673572(63)Indexation of UK regulatory asset value
-(10)(9)Sold operations
(107)(118)(147)Regulatory and accounting capitalisation
(167)(186)(237)Regulatory and accounting depreciation adjustment
1,1461,2261,259IFRS income excluding US stranded costs
-(55)-KeySpan pro forma 5 months
(254)(229)(256)IFRS US stranded costs (after tax)
200720082009For the year ended 31 March (£m)
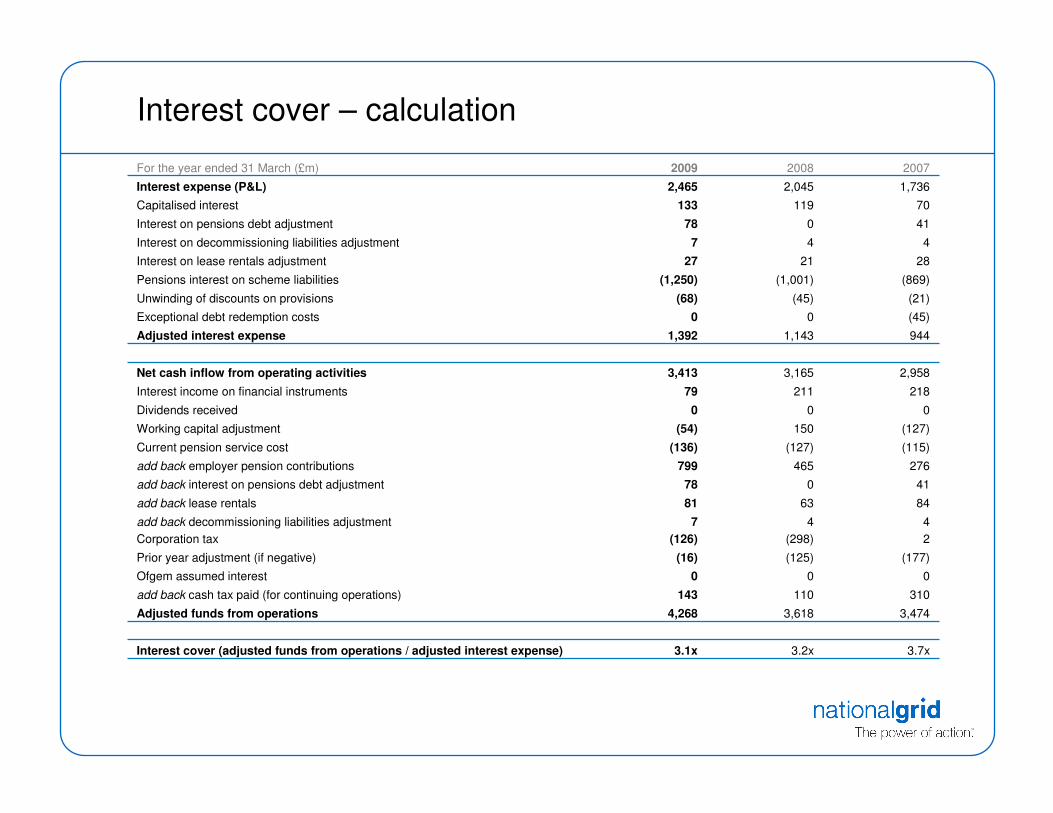
Interest cover – calculation
1,7362,0452,465Interest expense (P&L)
70119133Capitalised interest
41078Interest on pensions debt adjustment
447Interest on decommissioning liabilities adjustment
3.7x3.2x3.1xInterest cover (adjusted funds from operations / adjusted interest expense)
3,4743,6184,268Adjusted funds from operations
310110143add back cash tax paid (for continuing operations)
000Ofgem assumed interest
(177)(125)(16)Prior year adjustment (if negative)
4
2
4
(298)
7
(126)
add back decommissioning liabilities adjustment
Corporation tax
846381add back lease rentals
41078add back interest on pensions debt adjustment
276465799add back employer pension contributions
(115)(127)(136)Current pension service cost
(127)150(54)Working capital adjustment
000Dividends received
21821179Interest income on financial instruments
2,9583,1653,413Net cash inflow from operating activities
9441,1431,392Adjusted interest expense
(45)00Exceptional debt redemption costs
(21)(45)(68)Unwinding of discounts on provisions
(869)(1,001)(1,250)Pensions interest on scheme liabilities
282127Interest on lease rentals adjustment
200720082009For the year ended 31 March (£m)
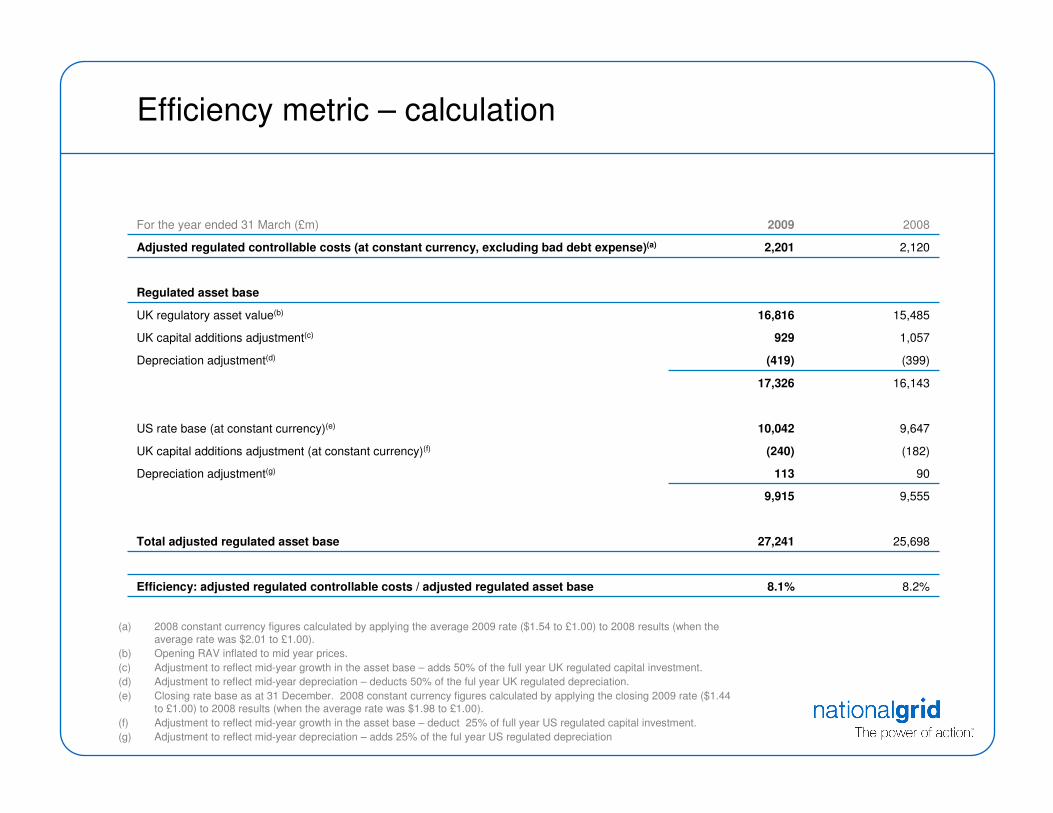
Efficiency metric – calculation
8.2%8.1%Efficiency: adjusted regulated controllable costs / adjusted regulated asset base
90113Depreciation adjustment(g)
(399)(419)Depreciation adjustment(d)
25,69827,241Total adjusted regulated asset base
9,5559,915
(182)(240)UK capital additions adjustment (at constant currency)(f)
9,64710,042US rate base (at constant currency)(e)
16,14317,326
1,057929UK capital additions adjustment(c)
15,48516,816UK regulatory asset value(b)
Regulated asset base
2,1202,201Adjusted regulated controllable costs (at constant currency, excluding bad debt expense)(a)
20082009For the year ended 31 March (£m)
(a) 2008 constant currency figures calculated by applying the average 2009 rate ($1.54 to £1.00) to 2008 results (when the average rate was $2.01 to £1.00).
(b) Opening RAV inflated to mid year prices.
(c) Adjustment to reflect mid-year growth in the asset base – adds 50% of the full year UK regulated capital investment.
(d) Adjustment to reflect mid-year depreciation – deducts 50% of the ful year UK regulated depreciation.
(e) Closing rate base as at 31 December. 2008 constant currency figures calculated by applying the closing 2009 rate ($1.44 to £1.00) to 2008 results (when the average rate was $1.98 to £1.00).
(f) Adjustment to reflect mid-year growth in the asset base – deduct 25% of full year US regulated capital investment.
(g) Adjustment to reflect mid-year depreciation – adds 25% of the ful year US regulated depreciation