14. Hyperspectral RS - UPRM
16
1 HYPERSPECTRAL HYPERSPECTRAL HYPERSPECTRAL HYPERSPECTRAL REMOTE SENSING REMOTE SENSING By Samuel Rosario By Samuel Rosario Overview ¾The Electromagnetic Spectrum ¾Radiation Types ¾MSI vs HIS ¾Sensors ¾Applications ¾Image Analysis Software ¾Feature Extraction ¾Information Extraction
Transcript of 14. Hyperspectral RS - UPRM

1
HYPERSPECTRALHYPERSPECTRALHYPERSPECTRALHYPERSPECTRALREMOTE SENSINGREMOTE SENSINGBy Samuel RosarioBy Samuel Rosario
Overview
The Electromagnetic Spectrum
Radiation Types
MSI vs HIS
Sensors
Applicationspp
Image Analysis Software
Feature Extraction
Information Extraction

2
Mini Quiz?
Some use for ultraviolet spectrum?Which type of radiation have the shortest wavelength?Why we are not damage by x-ray from the sun?Name a Multispectral Sensor?Name a Multispectral Sensor? Hyperspectral?Remote Sensing Applications?Types of Classification?
Electromagnetic Spectrum
Electromagnetic radiation has an electric andmagnetic field component which oscillate inmagnetic field component which oscillate inphase perpendicular to each other and to thedirection of energy propagation.

3
Atmospheric Electromagnetic Transmittance
Light Iteration

4
Example
Types of Radiations
Radio frequencyMicrowavesTerahertz radiationInfrared radiationVisible radiationUltraviolet lightUltraviolet lightX-raysGamma rays

5
ApplicationsGamma rays: nuclear medicine.
Ultraviolet: security, sterilization, disinfecting water.
Green: 515..520-590..600 nm, used for imaging of vegetation and deep water structures.
Near infrared: 750-900 nm, primarily for imaging of vegetation.
Mid-infrared: 2080-2350 nm, for imaging soil, moisture, geological features and fires.
Radar: related technologies, useful for mapping terrain and for detecting various objects.
Spatial Resolution
Multispectral Image
IKONOS 1m
Hyperspectral Image
Hyperion 30mHyperspectral Image
Hyperion 30mHyperspectral Image
Hyperion 30mHyperspectral Image
Hyperion 30mHyperspectral ImageHyperspectral ImageHyperspectral ImageypHyperion 30mHyperion 30m
yp p g
Hyperion 30mHyperspectral Image
Hyperion 30mHyperspectral Image
Hyperion 30m
6
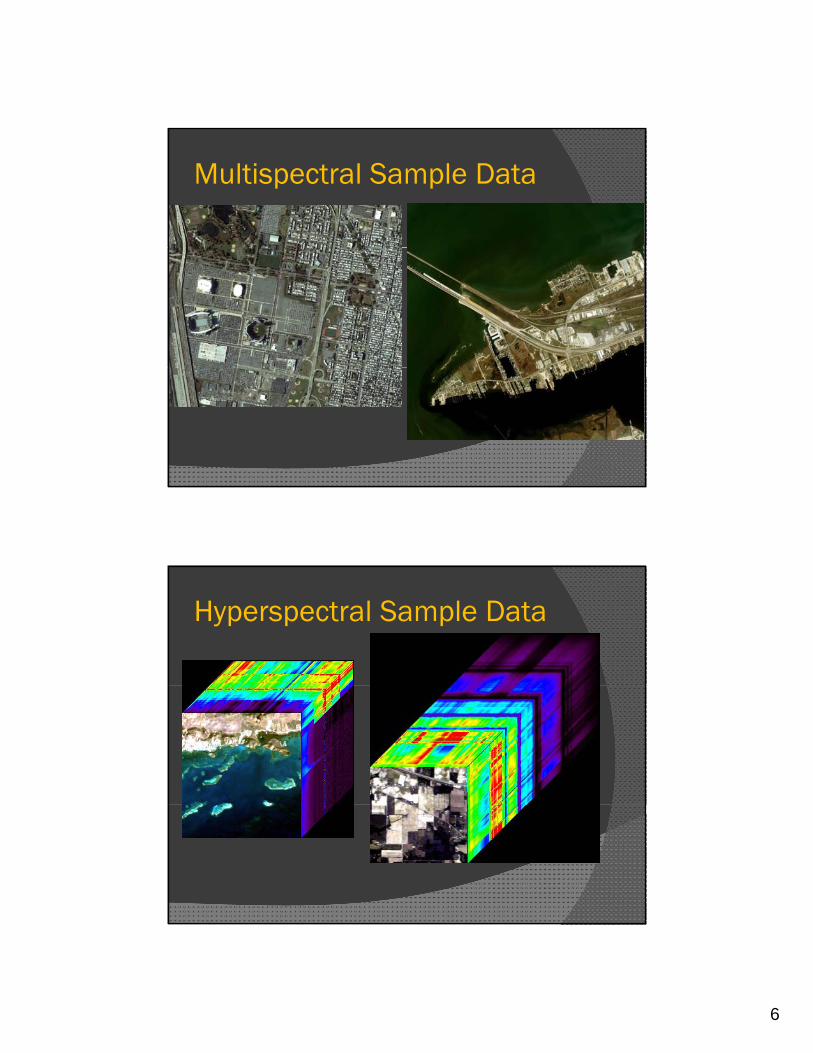
Multispectral Sample Data
Hyperspectral Sample Data

7
Spectral Resolution
Spectral and Spatial Trade of
sensor aperture
sensor altitude
observed area

8
Multispectral vs Hyperspectral
HSI images High spectral resolutionHigh spectral resolutionThe measured spectra is the contribution of the spectral signatures of the objects in the field of view of the sensor.
MSI High spatial resolutiong pLow spectral profileSpecific derive applications
Sensor
Multispectral L d tLandsatQuickBirdIKONOSSpot
HyperspectralAVIRISHyperionAISA

9
Sensor ApplicationsMultispectral
MappingMappingForestryResource managementOceanography
HyperspectralGeologyMiningMappingEcology Surveillance
Data Reduction
HSI contains hundreds of bands.
High Dimensionality in HSI.Curse of dimensionality.
High Computational time.

10
Data Projection
Feature Extraction
Principal Component Analysis
Discriminant Analysis
Projection Pursuit

11
PCA Definition PCA is mathematically defined as an orthogonal lineartransformation that transforms the data to a new coordinatesystem such that the greatest variance by any projection ofthe data comes to lie on the first coordinate (called the firstprincipal component), the second greatest variance on thesecond coordinate, and so on.
VUXWY ==Where VUW is the singular value decomposition of X
PCA Example
HSI Data HSI data using PCA

12
Information Extraction
ClassificationSupervisedSupervisedUnsupervised
UnmixingAbundance EstimationFull Unmixing
Supervised ClassificationAnalyst identifies in the imagery homogeneous representativesamples of the different surface cover types or classes of interest.
These samples data are referred to as training areas. The analystis "supervising" the categorization of a sets of specific classes.
The numerical information in all spectral bands for the pixelscomprising these areas are used to "train" the algorithms torecognize spectrally similar areas for each class.
Once the algorithms has determined the statistics for each class,each pixel in the image is compared each class statistics andlabeled as the class it most closely "resembles” to create a ClassMap.

13
Unsupervised ClassificationClusters (similar as classes), group similar pixels based on the natural data statistics.
Different measurement create different clusters.
The analyst specifies how many groups or clusters are to be looked for in the data.
Analyst also specify parameters related to the separationAnalyst also specify parameters related to the separation distance among the clusters and the variation within each cluster.
The final result is a Cluster Map or Class Map.
Classified Image

14
Unmixing
Spectral unmixing is the processing isto decompose the mixed pixels into theto decompose the mixed pixels into thematerials that contribute to the pixel,endmember and a set of correspondingfractions of the spectral signature in thepixel, abundances.
Mixed pixels are an important problem in information extraction from remote sensed imagery
Low spatial resolution sensors
Mixed Pixel constituent by three
PSF effectsobject spectra
Boundaries among classes

15
Unmixed Image
mbe
rs
Map
s
Endm
em
Abu
ndan
ce M
State of the Art in HSI Software Tools
ENVIof Research Systems Inc., a ITT subsidiary.
MultiSpec developed at Purdue University by Dr. David Landgrebe and the Remote Sensing research group in Purdue’s LARS

16
Hyperspectral Image Analysis
Supervised Classification Module
MATLAB Toolbox
Unsupervised Classification Module
Hardware Implementation in FPGA/DSP and GPUs
What is the Hyperspectral Image Analysis Toolbox?
C ll i f l i h f l i f h l iCollection of algorithms for analysis of hyperspectral images.Collection of functions that extend the capability of the MATLAB® numeric computing environment.Designed in Macintosh and PC-Windows Systems.
Based on research done in Laboratory of Applied Remote
A tool for analysis of hyperspectral images.
Sensing and Image Processing (LARSIP) and Gordon CenSSIS.
HIAT project started in 1998.