14. ATTRIBUTION OF WINTERTIME ANTICYCLONIC …
6
S70 JANUARY 2018 | 14. ATTRIBUTION OF WINTERTIME ANTICYCLONIC STAGNATION CONTRIBUTING TO AIR POLLUTION IN WESTERN EUROPE ROBERT V AUTARD, AUGUSTIN COLETTE, ERIK VAN MEIJGAARD, FREDERIK MELEUX, GEERT JAN VAN OLDENBORGH, FRIEDERIKE OTTO, ISABELLE T OBIN, AND P ASCAL Y IOU Climate simulations suggest a potential increase in frequency of stagnant wintertime conditions that prevailed over northwestern Europe in December 2016: it is significant in one multimodel ensemble but not in two single-model ensembles. Introduction. In December 2016, western European weather was dominated by persistent anticyclonic conditions (Fig. 14.1a) leading to dry and calm weather. At this time of year, solar radiation does not bring enough energy to develop a well-mixed bound- ary layer under such calm conditions. The resulting lack of dispersion led to several air pollution episodes in western Europe, as pollutants such as particulate matter (PM10) accumulated. PM10 concentrations reached very high values over the main European air pollution hotspots: the Po-Valley, eastern Europe, and the northern France, Benelux, southern United Kingdom region, which is the primary focus of the present study (marked as a rectangle in Fig. 14.1b). December 2016 was also among the least windy winter months of the last three decades (Fig. 14.1c), as measured from observed wind speeds over 53 measurement stations in the high-emission area. The mean observed concentrations of PM10 in that area were 25.4 µg m −3 that is 55% above expected average of 16.4 µg m −3 accounting for the decadal decreasing trend (Fig. 14.1d). Traffic bans took place in several places such as in Paris (six ban days). The question as to whether climate change had a role in such an event was raised by the media. Detecting a climate change signal in air pollution is difficult as other factors than climatic ones such as emission reduction policies that took place over the last two decades are important. However, several modeling studies showed potential effects of future climate change on particulate matter levels from indi- vidual (Carvalho et al. 2010; Colette et al. 2013; Hede- gaard et al. 2008, 2013; Manders et al. 2012; Markakis et al. 2014) or ensemble simulations (Lacressonnière et al. 2016, 2017; Lemaire 2016). These studies char- acterized mean pollutant concentration changes, but potential changes in air pollution episode frequency did not receive much attention. Air pollution results from emissions and several potential meteorological factors: lack of dispersion, lack of precipitation scavenging, and chemical reac- tions. We focus on one of the main weather factors, the lack of dispersion by horizontal wind. We hy- pothesize that December monthly winds (as shown among points in Fig. 14.1d) are strong drivers of air pollution as they are more anticorrelated with PM10 concentrations of Fig. 14.1d ( r = −0.75) than monthly precipitations ( r = −0.51) over the area and over the 2001–16 period. Shallow planetary boundary layers are also important, but long-term measurements and model assessments are lacking for attribution studies. Near-surface wind speeds are determined by the large-scale circulation, which forces the wind in the free atmosphere, and by surface roughness and stability, which modulate near-surface momentum fluxes. We examine whether human influence could have affected stagnation episodes at monthly time scales. This issue is of particular relevance as previ- ous studies showed that more stagnant conditions are expected (Horton et al. 2014), as well as a decrease in mean wind speeds and wind power production (Tobin et al. 2016) in future decades in some areas of Europe, however not over the area under consideration. AFFILIATIONS: VAUTARD, TOBIN, AND YIOU—LSCE/IPSL CEA/ CNRS/UVSQ, Université de Paris-Saclay, Paris, France; COLETTE AND MELEUX—Institut National de l’Environnement Industriel et des Risques, Verneuil en Halatte, France; VAN MEIJGAARD AND VAN OLDENBORGH—Royal Netherlands Meteorological Institute (KNMI), De Bilt, Netherlands; OTTO—Environmental Change Institute and Oxford e-Research Center, University of Oxford, Oxford, United Kingdom DOI:10.1175/BAMS-D-17-0113.1 A supplement to this article is available online (10.1175 /BAMS-D-17-0113.2)
Transcript of 14. ATTRIBUTION OF WINTERTIME ANTICYCLONIC …

S70 JANUARY 2018|
14. ATTRIBUTION OF WINTERTIME ANTICYCLONIC STAGNATION CONTRIBUTING TO AIR POLLUTION
IN WESTERN EUROPE
RobeRt VautaRd, augustin Colette, eRik Van MeijgaaRd, FRedeRik Meleux, geeRt jan Van oldenboRgh, FRiedeRike otto, isabelle tobin, and PasCal Yiou
Climate simulations suggest a potential increase in frequency of stagnant wintertime conditions that prevailed over northwestern Europe in December 2016: it is significant in one multimodel ensemble but not
in two single-model ensembles.
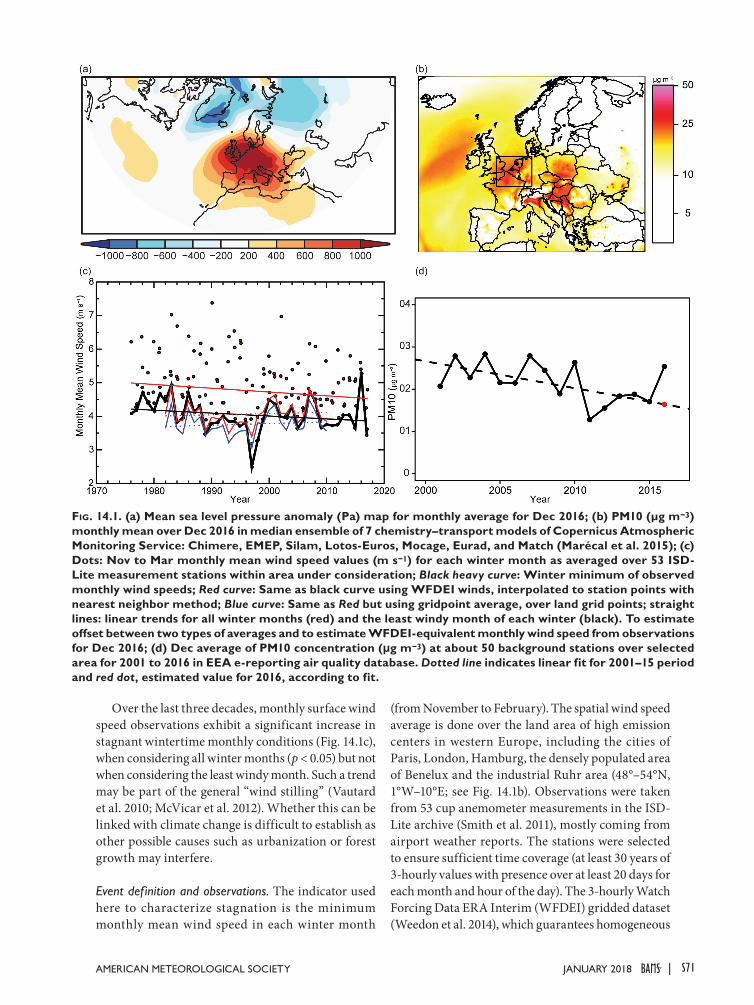
Introduction. In December 2016, western European weather was dominated by persistent anticyclonic conditions (Fig. 14.1a) leading to dry and calm weather. At this time of year, solar radiation does not bring enough energy to develop a well-mixed bound-ary layer under such calm conditions. The resulting lack of dispersion led to several air pollution episodes in western Europe, as pollutants such as particulate matter (PM10) accumulated. PM10 concentrations reached very high values over the main European air pollution hotspots: the Po-Valley, eastern Europe, and the northern France, Benelux, southern United Kingdom region, which is the primary focus of the present study (marked as a rectangle in Fig. 14.1b).
December 2016 was also among the least windy winter months of the last three decades (Fig. 14.1c), as measured from observed wind speeds over 53 measurement stations in the high-emission area. The mean observed concentrations of PM10 in that area were 25.4 µg m−3 that is 55% above expected average of 16.4 µg m−3 accounting for the decadal decreasing trend (Fig. 14.1d). Traffic bans took place in several places such as in Paris (six ban days). The question as to whether climate change had a role in such an event was raised by the media.
Detecting a climate change signal in air pollution is difficult as other factors than climatic ones such
as emission reduction policies that took place over the last two decades are important. However, several modeling studies showed potential effects of future climate change on particulate matter levels from indi-vidual (Carvalho et al. 2010; Colette et al. 2013; Hede-gaard et al. 2008, 2013; Manders et al. 2012; Markakis et al. 2014) or ensemble simulations (Lacressonnière et al. 2016, 2017; Lemaire 2016). These studies char-acterized mean pollutant concentration changes, but potential changes in air pollution episode frequency did not receive much attention.
Air pollution results from emissions and several potential meteorological factors: lack of dispersion, lack of precipitation scavenging, and chemical reac-tions. We focus on one of the main weather factors, the lack of dispersion by horizontal wind. We hy-pothesize that December monthly winds (as shown among points in Fig. 14.1d) are strong drivers of air pollution as they are more anticorrelated with PM10 concentrations of Fig. 14.1d (r = −0.75) than monthly precipitations (r = −0.51) over the area and over the 2001–16 period. Shallow planetary boundary layers are also important, but long-term measurements and model assessments are lacking for attribution studies. Near-surface wind speeds are determined by the large-scale circulation, which forces the wind in the free atmosphere, and by surface roughness and stability, which modulate near-surface momentum fluxes. We examine whether human influence could have affected stagnation episodes at monthly time scales. This issue is of particular relevance as previ-ous studies showed that more stagnant conditions are expected (Horton et al. 2014), as well as a decrease in mean wind speeds and wind power production (Tobin et al. 2016) in future decades in some areas of Europe, however not over the area under consideration.
AFFILIATIONS: VautaRd, tobin, and Yiou—LSCE/IPSL CEA/CNRS/UVSQ, Université de Paris-Saclay, Paris, France; Colette and Meleux—Institut National de l’Environnement Industriel et des Risques, Verneuil en Halatte, France; Van MeijgaaRd and Van oldenboRgh—Royal Netherlands Meteorological Institute (KNMI), De Bilt, Netherlands; otto—Environmental Change Institute and Oxford e-Research Center, University of Oxford, Oxford, United Kingdom
DOI:10.1175/BAMS-D-17-0113.1
A supplement to this article is available online (10.1175 /BAMS-D-17-0113.2)
S71JANUARY 2018AMERICAN METEOROLOGICAL SOCIETY |
Over the last three decades, monthly surface wind speed observations exhibit a significant increase in stagnant wintertime monthly conditions (Fig. 14.1c), when considering all winter months (p < 0.05) but not when considering the least windy month. Such a trend may be part of the general “wind stilling” (Vautard et al. 2010; McVicar et al. 2012). Whether this can be linked with climate change is difficult to establish as other possible causes such as urbanization or forest growth may interfere.
Event definition and observations. The indicator used here to characterize stagnation is the minimum monthly mean wind speed in each winter month
(from November to February). The spatial wind speed average is done over the land area of high emission centers in western Europe, including the cities of Paris, London, Hamburg, the densely populated area of Benelux and the industrial Ruhr area (48°–54°N, 1°W–10°E; see Fig. 14.1b). Observations were taken from 53 cup anemometer measurements in the ISD-Lite archive (Smith et al. 2011), mostly coming from airport weather reports. The stations were selected to ensure sufficient time coverage (at least 30 years of 3-hourly values with presence over at least 20 days for each month and hour of the day). The 3-hourly Watch Forcing Data ERA Interim (WFDEI) gridded dataset (Weedon et al. 2014), which guarantees homogeneous
Fig. 14.1. (a) Mean sea level pressure anomaly (Pa) map for monthly average for Dec 2016; (b) PM10 (µg m−3)
monthly mean over Dec 2016 in median ensemble of 7 chemistry–transport models of Copernicus Atmospheric Monitoring Service: Chimere, EMEP, Silam, Lotos-Euros, Mocage, Eurad, and Match (Marécal et al. 2015); (c) Dots: Nov to Mar monthly mean wind speed values (m s−1) for each winter month as averaged over 53 ISD-Lite measurement stations within area under consideration; Black heavy curve: Winter minimum of observed monthly wind speeds; Red curve: Same as black curve using WFDEI winds, interpolated to station points with nearest neighbor method; Blue curve: Same as Red but using gridpoint average, over land grid points; straight lines: linear trends for all winter months (red) and the least windy month of each winter (black). To estimate offset between two types of averages and to estimate WFDEI-equivalent monthly wind speed from observations for Dec 2016; (d) Dec average of PM10 concentration (µg m−3) at about 50 background stations over selected area for 2001 to 2016 in EEA e-reporting air quality database. Dotted line indicates linear fit for 2001–15 period and red dot, estimated value for 2016, according to fit.

S72 JANUARY 2018|
coverage, was also used to calibrate model simulations over the reference period 1981–2010. WFDEI consists in reinterpolated ERA-Interim reanalyses (Dee et al. 2011), with a higher resolution (0.5° × 0.5°) than native. There is a systematic difference of 0.3 m s−1 between the average wind speed interpolated over the stations and the land gridpoint average for WFDEI (Fig. 14.1c). We will therefore assume that the actual value of the December 2016 mean wind speed over land grid points is 3.15 m s−1, instead of the ISD-Lite observed value of 3.45 m s−1.
Simulation ensembles. We use several ensembles of model simulations. First, the actual (observed SST forcing) and natural simulations (only natural forc-ings and anthropogenic signal removed from SSTs, sea–ice) of the HadGEM3-A model (Christidis et al. 2013; Vautard et al. 2017, manuscript submitted to Climate Dyn.) covering the period (1960–2013) with 15 members per ensemble are used. In order to focus on the latter part of the data, analyses were only made over the last 30 years (1984–2013). Second, we use 11 high-resolution (0.11°) climate projections from the EURO-CORDEX ensemble (Jacob et al. 2014), with 5 Global Climate Models (GCMs) downscaled by 6 Regional Climate Models (RCMs), that were available and downloaded at the time of the study. GCMs and RCMs are listed in the online supplement. For these ensembles, natural simulations were not available, but the anthropogenic forcing was assumed dominant in explaining the difference between two available climate periods (1971–2000 and 2001–30). We then compare the extreme value distributions from these time periods and a third future one (2031–60) in order to analyze the effect of forcing changes on low wind speeds. We also used a 16-member ensemble of KNMI-RACMO simulations (Royal Netherlands Meteorological Institute Regional Atmospheric Climate Model; Lenderink et al. 2014; de Vries et al. 2014; van den Hurk et al. 2015) downscaling differ-ent realizations of EC-EARTH simulations, with the same periods as for EURO-CORDEX for consistency.
Model evaluation. For each set of simulations, we first compared the distribution of the simulation with the indicator calculated from WFDEI. The comparison was made over the 1981–2010 reference period for EURO-CORDEX and HadGEM3-A (29 winters). In Fig. ES14.1, quantile–quantile plots of the distributions of the stagnation indicator calculated from model ensembles are shown. HadGEM3-A slightly underestimates wind speed, especially in
the lower tail of the distribution. In the EURO-CORDEX ensemble, the stagnation indicator is either underestimated or overestimated depending on the model used. The RACMO ensemble slightly overestimates the indicator values. In all cases, a simple multiplicative bias adjustment was applied using a single coefficient for the whole ensembles for HadGEM3-A and RACMO and a model-dependent coefficient for EURO-CORDEX. The bias-adjusted simulations distributions are in closer agreement with WFDEI (Fig. ES14.1).
Attribution. We use each model ensemble separately to estimate how human influence has altered the risk of winter monthly wind speed lower than observed in December 2016 (3.15 m s−1). December 2016 is found to be a ~10‐year event. For HadGEM3-A, actual and natural simulations do not show much difference in the extreme low wind speeds, despite a systematically higher probability in the natural than in the actual simulations for less extreme months (see Fig. 14.2a). In the EURO-CORDEX ensemble, wind speeds lower than Dec 2016 become more than twice as probable in the current climate than in the 1971–2000 climate [risk ratio = 2.4 (1.7–3.7); see Table ES14.1 and details of calculation of confidence intervals]. For the RACMO ensemble, there is a nonsignificant increase in frequency of low mean monthly wind speed [risk ratio = 1.3 (0.9–2.0)]. When combining the last two ensembles, using therefore 27 simulations, the risk ratio becomes 1.7 (1.3–2.3). The risk ratio [1.2 (1.0–1.5)] is lower but remains significant when taking all ensembles together, but this combined estimate requires prudence in interpretation as time periods differ and ensembles are of different nature. For RACMO and EURO-CORDEX, changes are also found for future periods (2031–60; see Figs. 14.2b,c and Table ES14.1). This is in agreement with the widening of the distribution as revealed by the change in variance of the indicator (Fig. ES14.2), more pronounced in future than current periods. Discussion. An immediate potential candidate to explain changes in low winds speeds is the atmospheric flow and its potential changes. The high pressures of December 2016 are among the strongest as indicated by monthly mean sea level pressure (SLP) measured in De Bilt (Fig. 14.2d). However, no trend could be found in wintertime extreme monthly SLP or its variance, and only a weak correlation was found between monthly SLP and monthly winds (e.g., r = −.39 in December), excluding SLP as driving

S73JANUARY 2018AMERICAN METEOROLOGICAL SOCIETY |
the wind changes. However, a large-scale pattern of moderate anticyclonic conditions may be more conductive to low winds than strong SLP values because geostrophic winds are due to pressure gradients and not pressure itself. To test whether changes in atmospheric weather patterns could be
linked to increases in low wind speeds, we used the method of f low analogues (Yiou et al. 2013). We computed the 20 best analogues of daily SLP anomalies of winter 2016/17 from the NCEP reanalysis (Kalnay et al. 1996) by minimizing a Euclidean distance between daily SLP patterns over the North Atlantic
Fig. 14.2. Changes in return values (m s−1) of stagnation indicator vs. return periods for different model ensembles: (a) HadGEM3-A, (b) EURO-CORDEX ensemble, (c) RACMO–EC-EARTH ensemble. Dots represent median of binned running 11 consecutive sorted return period/values model values from 10 000 bootstrap estimations, together with 5%–95% confidence intervals (dashed lines). (d) Winter monthly SLP average (hPa) in De Bilt since 1900, together with average, average +1 standard deviation, average +2 std. dev.; Dec 2016 is shown as red square symbol. (e) Thick lines of plot show mean frequency of SLP analogues of 2016–17 winter in 1948–82 and 1983–2016 (until Mar 2016, not including current winter). Sampling distribution of probabilities is assessed with bootstrap test over winter days. Boxes are bootstrap confidence intervals [p − (p95 − p), p − (p5 − p)].
S74 JANUARY 2018|
region (30°–70°N, 80°W–30°E). The empirical probability that analogues of winter 2016/17 are found in 1948–82 vs. 1983–2016 (excluding November and December 2016) has significantly increased by about 10% in the recent decades (Fig. 14.2e). Although such trend could contribute to the stagnation trend, we could not establish a clear causal link between these phenomena.
Other mechanisms than more frequent favorable atmospheric flows may be involved in explaining the increase in stagnant conditions in both observations and the EURO-CORDEX climate projections, such as changes in atmospheric stability or in the vertical wind profile. Surface roughness or aerosols could contribute to observed but not to simulated changes as in general they were kept fixed in most simula-tions. Changes in stability can also explain changes in turbulent fluxes. While calling for investigation, resolving these issues is clearly beyond the scope of this article. These results therefore call for prudence in interpretation and for further analyses.
ACKNOWLEDGMENTS. The chemistry–trans-port simulation was provided by the Copernicus Atmospheric Monitoring Service, which is funded by the European Union’s Copernicus Programme. The in situ PM10 observations were provided by the European Environmental Agency Air Quality e-Reporting database. P. Yiou is supported by ERC grant No. 338965 - A2C2.
REFERENCES
Carvalho, A., A. Monteiro, S. Solman, A. I. Miranda, and C. Borrego, 2010: Climate-driven changes in air qual-ity over Europe by the end of the 21st century, with special reference to Portugal. Environ. Sci. Policy, 13, 445–558, doi:10.1016/j.envsci.2010.05.001.
Christidis, N., P. A. Stott, A. A. Scaife, A. Arribas, G. S. Jones, D. Copsey, J. R. Knight, and W. J. Ten-nant, 2013: A new HadGEM3-A-based system for attribution of weather- and climate-related extreme events. J. Climate, 26, 2756–2783, doi:10.1175/JCLI-D -12-00169.1.
Colette, A., and Coauthors, 2013: European atmosphere in 2050, a regional air quality and climate perspec-tive under CMIP5 scenarios. Atmos. Chem. Phys., 13, 7451–7471, doi:10.5194/acp-13-7451-2013.
Dee, D. P., and Coauthors, 2011: The ERA-Interim re-analysis: Configuration and performance of the data assimilation system. Quart. J. Roy. Meteor. Soc., 137, 553–597, doi:10.1002/qj.828.
de Vries, H., G. Lenderink, and E. van Meijgaard, 2014: Future snowfall in western and central Europe projected with a high-resolution regional climate model ensemble. Geophys. Res. Lett., 41, 4294–4299, doi:10.1002/2014GL059724.
Hedegaard, G. B., J. Brandt, J. H. Christensen, L. M. Frohn, K. M. Hansen, and M. Stendel, 2008: Im-pacts of climate change on air pollution levels in the Northern Hemisphere with special focus on Europe and the Arctic Atmos. Chem. Phys., 8, 3337–3367, doi:10.5194/acp-8-3337-2008.
—, J. H. Christensen, and J. Brandt, 2013: The relative importance of impacts from climate change vs. emis-sions change on air pollution levels in the 21st cen-tury. Atmos. Chem. Phys., 13, 3569–3585, doi:10.5194 /acp-13-3569-2013..
Horton, D. E., C. B. Skinner, D. Singh, and N. S. Dif-fenbaugh, 2014: Occurrence and persistence of future atmospheric stagnation events. Nat. Climate Change, 4, 698–703, doi:10.1038/nclimate2272.
Jacob, D., and Coauthors, 2014: EURO-CORDEX: New high-resolution climate change projections for Eu-ropean impact research. Reg. Environ. Change, 14, 563–578, doi:10.1007/s10113-013-0499-2.
Kalnay, E., and Coauthors, 1996: The NCEP/NCAR 40-year reanalysis project. Bull. Amer. Meteor. Soc., 77, 437–471, doi:10.1175/1520-0477(1996)077<0437 :TNYRP>2.0.CO;2.
Lacressonnière, G., and Coauthors, 2016: Impacts of regional climate change on air quality projections and associated uncertainties. Climatic Change, 136, 309–324, doi:10.1007/s10584-016-1619-z.
—, and Coauthors, 2017: Particulate matter air pollu-tion in a +2°C warming world. Atmos. Environ., 154, 129–140, doi:10.1016/j.atmosenv.2017.01.037.
Lenderink, G., B. J. J. M. van den Hurk, A. M. G. Klein Tank, G. J. van Oldenborgh, E. van Meijgaard, H. de Vries, and J. J. Beersma, 2014: Preparing local climate change scenarios for the Netherlands using resampling of climate model output. Environ. Res. Lett., 9, 115008, doi:10.1088/1748-9326/9/11/115008.
Lemaire, V. E. P., A. Colette, and L. Menut, 2016: Using statistical models to explore ensemble uncertainty in climate impact studies: The example of air pollu-tion in Europe. Atmos. Chem. Phys., 16, 2559–2574, doi:10.5194/acp-16-2559-2016.
S75JANUARY 2018AMERICAN METEOROLOGICAL SOCIETY |
Manders, A. M. M., E. van Meijgaard, A. C. Mues, R. Kranenburg, L. H. van Ulft, and M. Schaap, 2012: The impact of differences in large-scale circulation output from climate models on the regional mod-eling of ozone and PM. Atmos. Chem. Phys., 12, 9441–9458, doi:10.5194/acp-12-9441-2012.
Marécal, V., and Coauthors, 2015: A regional air qual-ity forecasting system over Europe: The MACC-II daily ensemble production. Geosci. Model Dev., 8, 2777–2813, doi:10.5194/gmd-8-2777-2015.
Markakis, K., and Coauthors, 2014: Air quality in the mid-21st century for the city of Paris under two climate scenarios; from the regional to local scale. Atmos. Chem. Phys., 14, 7323–7340, doi:10.5194 /acp-14-7323-2014.
McVicar, T. R., and Coauthors, 2012: Global review and synthesis of trends in observed terrestrial near-surface wind speeds: Implications for evapo-ration. J. of Hydrol., 416, 182–205, doi:10.1016 /j.jhydrol.2011.10.024.
Smith, A., N. Lott, and R. Vose, 2011: The integrated surface database: Recent developments and part-nerships. Bull. Amer. Meteor. Soc., 92, 704-708, doi:10.1175/2011BAMS3015.1.
Tobin, I., and Coauthors, 2016: Climate change impacts on the power generation potential of a European mid-century wind farms scenario. Environ. Res. Lett., 11, 034013, doi:10.1088/1748-9326/11/3/034013.
Van den Hurk, B. J. J. M., E. van Meijgaard, P. de Valk, K. J. van Heringen and J. Gooijer, 2015: Analysis of a compounding surge and precipitation event in the Netherlands. Environ. Res. Lett., 10, 35001, doi:10.1088/1748-9326/10/3/035001.
Vautard, R., J. Cattiaux, P. Yiou, J.-N Thepaut, and P. Ci-ais, 2010: Northern Hemisphere atmospheric stilling partly attributed to an increase in surface roughness. Nat. Geosci., 3, 756–761, doi:10.1038/ngeo979.
Weedon, G. P., G. Balsamo, N. Bellouin, S. Gomes, M. J. Best, and P. Viterbo, 2014: The WFDEI meteorological forcing data set: WATCH Forc-ing Data methodology applied to ERA‐Interim reanalysis data. Water Resour. Res., 50, 7505–7514, doi.10.1002/2014WR015638.
Yiou, P., T. Salameh, P. Drobinski, L. Menut, R. Vautard, and M. Vrac, 2013: Ensemble reconstruction of the atmospheric column from surface pressure using analogues. Climate Dyn., 41, 1333–1344, doi:10.1007 /s00382-012-1626-3.