14-2280 Aug 73 - Education Resources Information Center · in Social Science. SPONS AGENCY Bureau...
48
DOCUMENT RESUME ED 084 871 EM 011 695 AUTHOR Fletcher, J. D.; Suppes, Patrick TITLE Computer-Assisted Instruction in Mathematics and Language Arts for the Deaf. Final Report. INSTITUTION Stanford Univ., Calif. Inst. for Mathematical Studies in Social Science. SPONS AGENCY Bureau of Education for the Handicapped (DHEW /OE) , Washington, D.C. Div. of Research. BUREAU NO 14-2280 PUB DATE Aug 73 GRANT OEG-0-70-4797-607 NOTE 45p. EDRS PRICE MF-$0.65 HC-$3.29 DESCRIPTORS Algebra; Aurally Handicapped; *Computer Assisted Instruction; Deaf Children; *Deaf Education; *Deaf Research; EduCational Research; *Elementary School mathematics; English InstructioA; *Language Arts; Logic ABSTRACT A three-year project supported research, development and evaluation of computer-assisted instruction (CAI) for hearing impaired, or deaf, children. Over 4,000 students from 15 schools for the deaf in five states participated in the effort. Although students _eceived CAI in algebra, logic, computer programing and basic English, the skill subjects of elementary school mathematics and language arts were emphasized. Experimentation supported by the project ranged from practical evaluation studies of the specific curriculums presented to general, theoretical studies of the use of language by deaf students. The project demonstrated that CAI can significantly benefit deaf students, that CAI can support serious research in deaf education, and that CAI is economically practicable. A general aim of the project was to initiate large-scale use of CAI in schools for the deaf, and the available evidence indicateS that this objective was successfully achieved. (Author)
Transcript of 14-2280 Aug 73 - Education Resources Information Center · in Social Science. SPONS AGENCY Bureau...
DOCUMENT RESUME
ED 084 871 EM 011 695
AUTHOR Fletcher, J. D.; Suppes, PatrickTITLE Computer-Assisted Instruction in Mathematics and
Language Arts for the Deaf. Final Report.INSTITUTION Stanford Univ., Calif. Inst. for Mathematical Studies
in Social Science.SPONS AGENCY Bureau of Education for the Handicapped (DHEW /OE) ,
Washington, D.C. Div. of Research.BUREAU NO 14-2280PUB DATE Aug 73GRANT OEG-0-70-4797-607NOTE 45p.
EDRS PRICE MF-$0.65 HC-$3.29DESCRIPTORS Algebra; Aurally Handicapped; *Computer Assisted
Instruction; Deaf Children; *Deaf Education; *DeafResearch; EduCational Research; *Elementary Schoolmathematics; English InstructioA; *Language Arts;Logic
ABSTRACTA three-year project supported research, development
and evaluation of computer-assisted instruction (CAI) for hearingimpaired, or deaf, children. Over 4,000 students from 15 schools forthe deaf in five states participated in the effort. Although students_eceived CAI in algebra, logic, computer programing and basicEnglish, the skill subjects of elementary school mathematics andlanguage arts were emphasized. Experimentation supported by theproject ranged from practical evaluation studies of the specificcurriculums presented to general, theoretical studies of the use oflanguage by deaf students. The project demonstrated that CAI cansignificantly benefit deaf students, that CAI can support seriousresearch in deaf education, and that CAI is economically practicable.A general aim of the project was to initiate large-scale use of CAIin schools for the deaf, and the available evidence indicateS thatthis objective was successfully achieved. (Author)

N-CO-71-CoCD
C=1ta.41
0
Final Report
Project No. 14-2280Grant No. 0EG-0-70-4797-607
J. D. Fletcher and Patrick SuppesInstitute for Mathematical Studies in the Social Sciences
Stanford UniversityStanford, California 94305
COMPUTER-ASSISTED INSTRUCTION IN MATHEMATICS ANDLANGUAGE ARTS FOR THE DEAF
August 1973 U.S. DEPARTMENT OF HVALTH,EDUCATION & WELFARENATIONAL INSTITUTE OF
EDUCATIONTHIS DOCUMENT HAS BEEN REPRODUCED EXACTLY AS RECEIVED FROMTHE PERSON OR ORGANIZATION ORIGINATING IT. POINTS OF VIEW OR OPINIONSSTATED DO NOT NECESSARILY REPRESENT OFFICIAL NATIONAL INSTITUTE OFEDUCATION POSITION OR POLICY
U.S. DEPARTMENT OF HEALTH, EDUCATION, AND WELFARE
Office of Education
Bureau of Education for the Handicapped(Division of Research)
FILMED FROM BEST AVAILABLE COPY

COMPUTER-ASSISTED INSTRUCTION IN MATHEMATICS AND
LANGUAGE ARTS FOR THE DEAF
jr. D. Fletcher and..P. Suppes
ABSTRACT
This project supported development, evaluation, and research ofcomputer-assisted instruction (CAI) for bearThg-impaired, or 'deaf',students. More than 4,000 students from 15 schools for the deaf in fivedifferent states participated during the three-year term of the project.Although students received CAI in algebra, logic, computer programming,and basic English, the skill subjects of elementary-school mathematicsand language arts were emphasized by the project. Experimentation sup-ported by the project ranged from practical evaluation studies of thespecific curriculums presented to general, theoretical studies of theuse of language by deaf students.
The project demonstrated that CAT can significantly benefit deafstudents, that it can support serious research in deaf education, andthat it is economically practicable. A general aim of the project wasto initiate large-scale use of CAI in schools for the deaf, and availableevidence indicates that this aim was successfully met.

Final Report
Project No. 14-2280Grant No 0EG-0-70-4797-607
Computer-assisted Instruction in Mathematics and
Language Arts for the Deaf'
J. D. Fletcher and Patrick SuppesStanford University
Stanford, California-94305
August 1973
The research reported herein was performed pursuant to a grant with theOffice of Education, U.S. Department of Health, Education, and Welfare.Contractors undertaking such projects under Government sponsorship areencouraged to express freely their professional judgment in the conductof the project. Points of view or opinions stated do not, therefore,necessarily represent official Office of Education position or policy.
U.S. DEPARTMENT OFHEALTH, EDUCATION, AND WELFARE
Office of EducationBureau of Education for the Handicapped
(Division of Research)

PREFACE
We acknowledge the essential work performed by Jamesine Friend in
the initial stages of this project. Much of what was accomplished by
the project depended directly on the foundation she created.
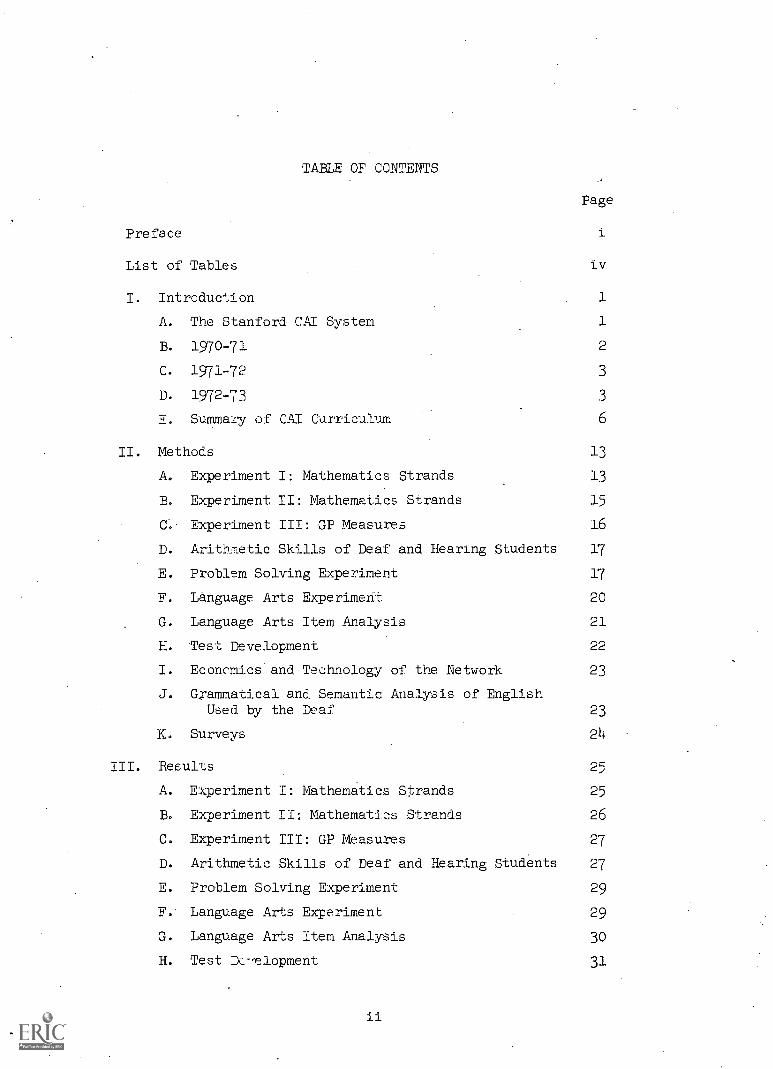
TABLE OF CONTENTS
Page
Preface i.
List of Tables iv
I. Introduction 1
A. The Stanford CAI System 1
B. 1970-71 2
C. 1971-72 3
D. 1972-73 3
E. Summary of CAI Curriculum 6
II. Methods 13
A. Experiment I: Mathematics Strands 13
B. Experiment II: Mathematics Strands 15
C. Experiment III: GP Measures 16
D. Arithmetic Skills of Deaf and Hearing Students 17
E. Problem Solving Experiment 17
F. Language Arts Experiment 20
G. Language Arts Item Analysis 21
H. Test Development 22
I. Econcmicsand Technology of the Network 23
J. Grammatical and Semantic Analysis of EnglishUsed by the Leaf 23
K. Surveys 24
III. Results 25
A. Experiment I: Mathematics Strands 25
B. Experiment II: Mathematics Strands 26
C. Experiment III: GP Measures 27
D. Arithmetic Skills of Deaf and Hearing Students 27
E. Problem Solving Experiment 29
F. Language Arts Experiment 29
G. Language Arts Item Analysis 30
H. Test Dcelopment 31
ii

nuT
I. Economics and Technology of the Network .
J. Grammatical and Cemantic Ana3y14s of English
Used by the 32
K. Surveys 33
IV. Publications 34
V. Conclusions 36
VI. Recommendations 37
VII. Bibliography
iii
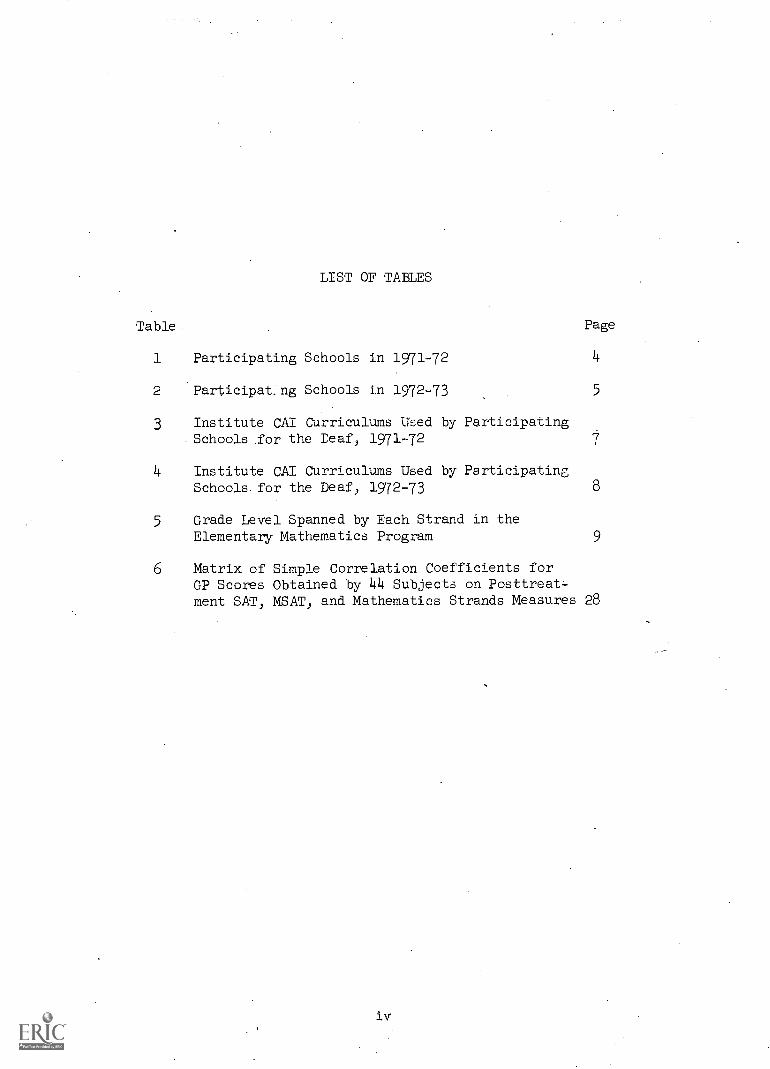
LIST OF TABLES
Table Page
1 Participating Schools in 1971-72 4
2 Participat.ng Schools in 1972-73 5
3 Institute CAI Curriculums Used by Participating.Schools for the Deaf, 197172
4 Institute CAI Curriculums Used by ParticipatingSchools. for the Deaf, 1972-73 8
5 Grade Level Spanned by Each Strand in theElementary Mathematics Program 9
Matrix of Simple Correlation Coefficients forGP Scores Obtained by 44 Subjects on Posttreat-ment SAT, MSAT, and Mathematics Strands Measures 28
iv

7FTRODUCTION
This project supported research and d,elopment of computer-assistedinstruction (CAT) for hearing-impaired, or 'deaf', students. The termof the project was July.1, 1970 to June 30, 1973. CAI curriculums devel-oped by the Institute for Mathematical Studies in the Social Sciences(IMSSS) at Stanford. University were used by more than 1,000 deaf studentsduring the 1970-71 school year and by more than 2,000 deaf students duringthe 1971-72 and 1972-73 school years. The project generated significantinterest and support among educators of the deaf throughout the country;and served as a major impetus for the installation cf CAI in schools forthe deaf across the country. General descriptions of the project wereprovided'by Fletche7:.9 Jamison, Searle, and Smith '(1973) and by Suppes(1971,.1972a, 1972b).
A. The Stanford CAI System
The central processor for the Ins itute's computer' system is aDigital Equipment Corporation PDP-10. In addition to 256K of core mem-ory, short-term storage of programs and student information is providedby sixteen 180,000,000-bit disk modules. Long-term storage of studentresponse data is provided. by magnetic tape. About 280,000,000 bits _ofinformation can be stored by the system on one magnetic tape. Communi-cation with remote student terminals in participating schools is providedby private telephone lines. High-speed data transmission (generally2400 or 4800 baud) and time-division multiplexing are used to communicatewith.clusters of 16 or more student terminals. :n 197273 more than 180terminals were connected to the Institute system, About 125 of theseterminals could be used simultaneously with no appreciable detriment inthe system's speed. of response, Any curric:uldm or other program couldbe run at any time on any student terminal,
The student terminals are 'KSE. Model 33' teletypewriters. These.
teletypewriters communicate with the central computer system at a rateof about 10 characters per second (110 baud)., They provide no audio,visual, or graphic capability, b,,,t their cost is about one-tenth ofterminals that do. Despite their limitations, tj,ese inexpensive ter-.minals permitted development CAZ that has produced dramatic gainsin pedagogical achievement for hearing students as Suppes and Morningstar(1970, 1972), Fletcher and. Atkinson (1972), and others have reported.For that matter, Jamison) Fletcher, Suppes, and AtkinSon (1972) haveargued that for costeffectiveness, CAE, using :satellite communicationand teletypewriters, is a superior method for providing compensatoryeducation.
In a typical school, there is one room containing 8 to 15 studentterminals. One person, who is chosen by the school to be the CAI ter-
.urinal proctor, is in charge of the equipment and-of supervising studentsin the terminal room. Usually accompanied. by their classroom teacher,the students enter and sit at any free terminal. The student starts
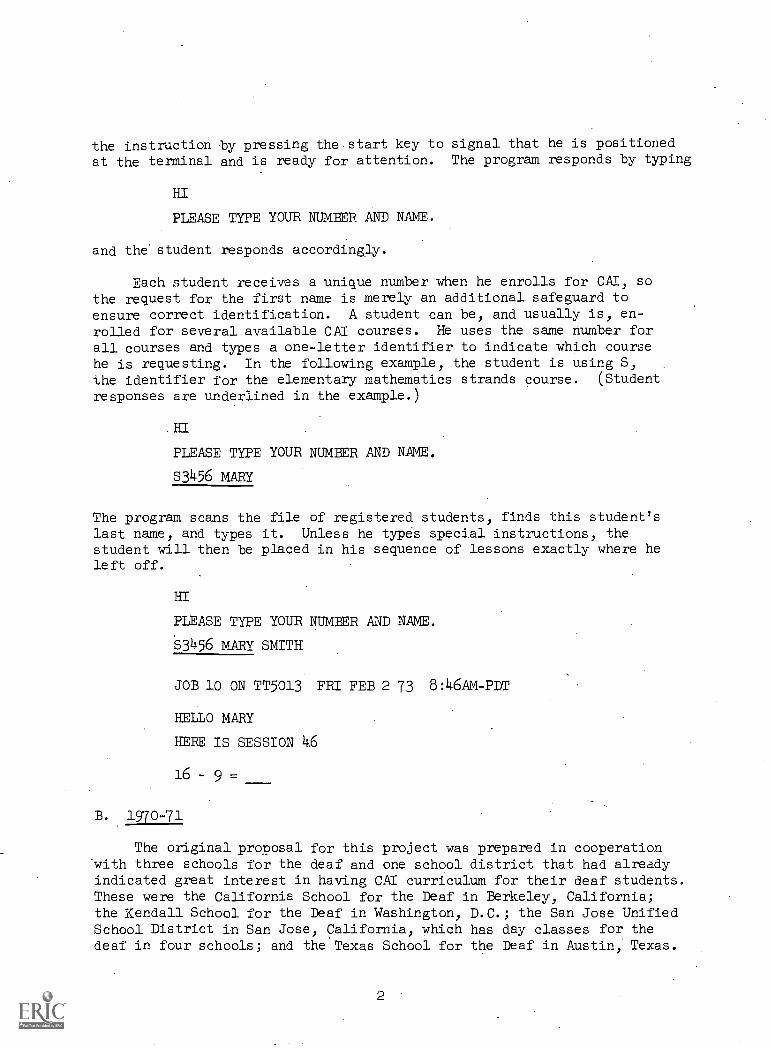
the instruction by pressing the.start key to signal that he is positionedat the terminal and is ready for attention. The program responds by typing
HI
PLEASE TYPE YOUR NUMBER AND NAME.
and the student responds accordingly.
Each student receives a unique number when he enrolls for CAI, sothe request for the first name is merely an additional safeguard toensure correct identification. A student can be, and usually is, en-rolled for several available CAI courses. He uses the same number forall courses and types a one-letter identifier to indicate which coursehe is requesting. In the following example, the student is using S,the identifier for the elementary mathematics strands course. (Student
responses are underlined in the example.)
HI
PLEASE TYPE YOUR NUMBER AND NAME.
S3456 MARY
The program scans the file of registered students, finds this student'slast name, and types it. Unless he types special instructions, thestudent will then be placed in his sequence of lessons exactly where heleft off.
HI
PLEASE TYPE YOUR NUMBER AND NAME.
53456 MARY SMITH
JOB 10 ON TT5013 FRI FEB 2 73 8:46AM-PDT
HELLO MARY
HERE IS SESSION 1i6
16-9.
B. 1970-71
The original proposal for this project was prepared in cooperationwith three schools for the deaf and one school district that had alreadyindicated great interest in having CAI curriculum for their deaf students.These were the California School for the Deaf in Berkeley, California;the Kendall School for the Deaf in Washington, D.C.; the San Jose UnifiedSchool District in San Jose, California, which has day classes for thedeaf in four schools; and the Texas School for the Deaf in Austin, Texas.

Students at all of these schools regularly used Stanford CAI coursesduring the 1970-71 school year. In addition, the Model Secondary Schoolfor the Deaf, Washington, D.C., and the Palo Alto Unified School District,Palo Alto, California, used funding from other sources to participate inthe project during 1970 -71. The Palo Alto School District included theStanford terminals as part of a larger experiment using CAI for deafstudents. This project was documented by JackSon (1972).
During 1970-71 there were 60 terminals in operation at the partici-pating schools. Over 1,000 deaf students used one or more of the StanfordCAI courses.
C. 1971-72
All of the schools that participated in the project duri'lz the1970-71 school year continued during the 1971-72 school year, and sev-eral new schools joined the project. The schedule orisinally proposedthat one new school with 15 terminals would be added during the 1971 72school year. However, so many schools for the d;:af expressed interestin CAI that it was offered on a 50-50 cost-saring basis, therebyallowing more schools to join the network. Two residential schools,..theFlorida State School for the Deaf and cite Blind, St. Augustine, Florida,and the Oklahoma School for the Deaf, Sulphur, Oklahoma, were added.Also, five new locations were added in Texas under the state's day schoolprogram. Houston Independent County-Wide Day School, Houston, BexarCounty Day School for the Deaf, San Antonio, Dallas County Day Schoolfor the Deaf, Dallas, Tarrant County Day School for the Deaf, Fort Worth,and Beaumont Bi-County Wide Day School for the Deaf, 2eaumont, alljoined the network. The telephone line costs for the Texas county-wideday schools, the Texas School for the Deaf, and the Oklahoma School forthe Deaf were reduced by creating a circuit that combined both time-
division and frequency-division multiplexing in a single network.
All schools for the hearing impaired that participated in the pro-ject during the 1971-72 school year, including number of CAI terminalsinstalled and percentage of financial support provided by the project,are listed in Table 1.
D. 1972-73
Despite a number of requests from schools across the country, nonew project-supported schools were added during 1972-73. The emphasisduring the year was on consolidating and evaluating the existing programand on studying the economics and technology of the CAI network. Par-ticipating schools, including number of CAI terminals installed andpercentage of financial support provided by this project, are listed inTable 2. .
3

Table 1
Participating Schools in 1971-72
School Terminals Support*
California School for the Deafat Berkeley
15 100
Florida State School for the Deafand the Blind
8 50
Kendall School for the Deaf 12 100
Model Secondary School for the Deaf 8 0
Oklahoma School for the Deaf 10 50.
Palo Alto Unified School District 2 0
(February 10, 1972-June 10, 1972)
San Jose Unified School District
Bachrodt Elementary School 2 100
Hester Elementary School 2 100
Hoover Junior High School 1 100
San Jose High School 1 100
Texas County-Wide Day Schools
Houston Independent County-Wide 4 50
Day School
Bexar County Day School for the Deaf 2 50
(San Antonio)
Dallas County Day School for the Deaf 3 50
Tarrant County Day School for the Deaf 2 50
(Fort Worth)
Beaumont Bi-County Wide Day School forthe Deaf
1 50
Texas School for the Deaf 15 100
Total 88
*Percentage of financial support of CAI terminals provided by OE fundsto IMSSS.

Table 2
Participating Schools in 1972-73
School Terminals L1222111
California School for the Deafat Berkeley
16 100
Florida State School for the Deafand the Blind
8 5o
Kendall School for the Deaf 12 100
Model Secondary School for the Deaf 5
Oklahoma School for the Deaf 10 50
San Jose Unified School District
Hester Elementary School 3 100
San Jose High School 100
Texas County-Wide Day Schools
Montrose School (Houston, Texas) 4 50
Bexas County Day School for the Deaf 2 50
(San Antonio)
John B. Hood Junior High School 1 50
(Dallas, Texas)
Skyline High School (Dallas, Texas) 2 50
Tarrant County Day School for the Deaf 2 50
(Fort Worth)
Beaumont Bi-County Wide Day School forthe Deaf
1 50
Texas School for the Deaf 16 100
Total 85
*Percentage of financial support of CAI terminals provided by OE fundsto IMSSS.
5

E. Summary of CAI Curriculums
All CAI curriculums developed by IMSSS were available to studentsin the participating schools for the deaf. Some of these curriculums,such as reading. (grades K-3), French, and Russian, were inappropriatebecause they require audio. However, most IMSSS curriculums, even thoughnot specifically designed for hearing-impaired students, were used suc-cessfully by the participating schools. Table 3 and Table L list allIMSSS curriculums used in this project with the numbers of hearing-impairedstudents enrolled for them in 1971-72 and in 1972-73, respectively.Brief descriptions of these curriculums follow. Those most relevant tothis project were mathematics strands, arithmetic word problem solving,and language arts.
1. Elementary mathematics strands. The objectives of the curriculumwere (1) to provide supplementary individualized instruction in elementarymathematics at a level of difficulty appropriate to each student's levelof achievement, (2) to allow acceleration in any concept area in which astudent demonstrates proficiency and repeated drill in areas of deficiency,and (3) to provide a daily profile report of each student's progressthrough the curriculum.
A strand is a series of problems of the same operational type (e.g.,number concepts, addition, subtraction, fractions) arranged sequen-tially in equivalence classes according to their relative difficulty.The l4 strands in the program and the grade levels spanned by each strandare presented in Table 5.
A student in the strands program works on fewer than l4 strands;the actual number depends on his grade level and performance. The strandsapproach provides a high degree of individualization because each student'slesson is prepared for him daily by the computer, the lessons are pre-sented as mixed drills at a level of difficulty in each strand determinedby the student's prior performance, and the student moves up each strandat his on pace.
Details of the curriculum were documented by Suppes (1971), Suppes,Goldberg, Kanz, Searle, and Stauffer (1971), and by Suppes, Searle, andLorton (1973).
2. Arithmetic word problem solving. This course gives studentsexperience in solving arithmetic word problems. The course emphasizesmethods of solution; the student constructs a well-formed algebraic ex-pression, and the computer carries out the actual computation. Theessential learning experience in solving arithmetic word problems istranslating the English text into an algebraic expression. When suchproblems are presented in textbooks the student is often bogged down incomputation and the correctness of his solution may be masked by carelesserrors in arithmetic. Having the computer do the computations allows thestudent to concentrate on the more fundamental aspect of expressing theproblem as a well-formed algebraic expression.
6

Table 3
Institute CAI Curriculums Used by Participating
Schools for the Deaf, 1971-72
Curriculum Number of students
Elementary Mathematics (Strands)
Arithmetic Word Problem Solving
Language Arts
Algebra
Basic English
Computer Programmir4 in AID
Computer Programming in BASIC
Logic and Algebra
Total Students 2279
2146
107
1071
83
165
93
124
216
7

Table I
Institute CAI Curriculums Used by Participating
Schools for the Deaf, 1972-73
Curriculum Number of students
Elementary Mathematics (Strands) 1793
Arithmetic Word Problem Solving 520
Language Arts 1058
Basic English
Computer Programming in AID 31'
Logic and Algebra 77
Total Students 2113
8
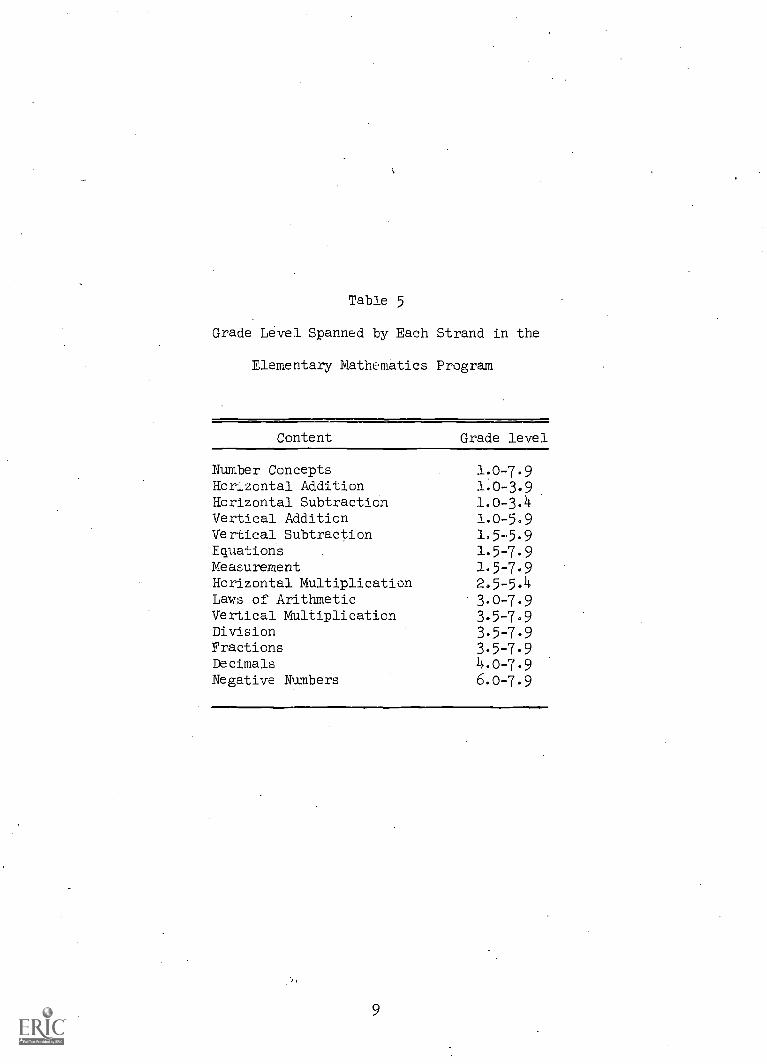
Table 5
Grade Level Spanned by Each Strand in the
Elementary Mathematics Program
Content Grade level
Number Concepts 1.0-7.9Horizontal Addition 1.0-3.9Horizontal Subtraction 1.0-3.4Vertical Addition 1.0-5.9Vertical Subtraction 1.55.9Equations 1.5-7.9Measurement 1.5-7.9Horizontal Multiplication 2.5-5.4Laws of Arithmetic 3.0-7.9Vertical Multiplication 3.5-7.9Division 3.5-7.9Fractions 3.5-7.9Decimals 4.0-'7.9
Negative Numbers 6.0-7.9
9

The student learns a few simple commands and uses thez in a respon-sive dialogue with the instructional program to specify whici_ computationsare to be carried out. The student is free to experiment with the com-puter calculator made available to him, and he may choose any-Combinationof steps to produce an answer. The program permits this freedom bystoring a solution string for each problem and calculating the correctanswer from the variables generated for the problem presentation byapplying them to. the solution string. The student's answer is evaluatedonly when he.instructs the computer to do so. The text of the wordproblems is stored by the computer, and the numbers used in each problemare randomly generated for each presentation. Although all students seethe same problem statement, each student receives a unique set of numbersfrom which he must construct an answer. Thus, dimensions of problem dif-ficulty can be investigated independently of the numbers used in computingsolutions.
The curriculum was described in more detail by Fletcher, Jamison,Searle, and Smith (1973), and by Searle, Lorton, and Suppes (1973).
3. Language arts. The language difficulties of hearing-impairedstudents were carefully considered in developing the Language Arts cur-riculum. The curriculum was designed to stress the structure of English,with particular emphasis on the roles of syntax and inflection and onthe meaning of function words. An inductive-rather than a dedlictivestrategy is used. The course does not explicitly state 'rules' ofEnglish usage; it presents items illustrating aspects of standard Eng-lish usage singly and in combination. Incidental learning of basicsentence patterns. is enhanced by presenting curriculum items in completesentences. Fewer than one-tenth of the exercises present the studentwith single words or isolated phrases. Incidental learning is also en-hanced by requiring many constructed rather than multiple-choice responses.
There are four general course objectives. Students are to
(1) Recognize specified grammatical categories;
(2) Recognize and supply various forms of given grammaticalstructures;
(3) Select appropriate grammatical units to complete a specifiedstructure; and
(4) Perform specified transformations on grammatical structures.
The curriculum Ls divided into 218 lessons of 20-30 exercises.Separate topics are presented in separate lessons and often there is asequence of lessons on a single topic. The lessons are ordered to pro-vide a cumulative basis of concepts building upon one another. Severallessons are intended to review topics presented in preceding lessons.
The course was described in more detail by Fletcher and Eeard (1973),by Fletcher, Jamison, Searle, and Smith (1973), and by Fletcher andStauffer (1973).
10

1. Algebra. Algebra is a self-contained tutorial course. for secon-dary school students. It teaches the basic properties of arithmeticoperations, simplifying and solving equations, and the properties ofinequalities.- Each lesson contains instruction, printed homewor, cor-rections of homework problems on the computer and a quiz.
5. Basic English. This course provides secondary school studentswith practice in problem areas of standard English usage. The objectiveof the course is to diagnose and correct the- twelve most common usageerrors: run-on sentences-, sentence fragments, incorrect principal partsof the verb, confusion of adjectives and adverbs, lack of agreementbetween subject and verb, lack of agreement between pronoun and antecedent,incorrect case of pronouns) vague or indefinite pronomial reference,dangling elements, misplaced. modifiers, errors in comparative forms ofadjectives and adverbs, and double negatives. Further documentation wasprovided by Suppes, Goldberg, Kanz) Searle, and Stauffer (1971).
6. Computer Programming in AID. This is a self-contained, tutorialprogram. that teaches the use of Algebraic Interpretive Dialogue (AID),a high-level algebraic language. The course was designed for juniorcollege students and requires at least one year of algebra background.The course consists of 50 lessons, about one hour in length, plus sum-merles, reviews, tests, and. extra-credit problems. Further documentationwas provided by Friend (1973), Friend and Atkinson (1971), and by Suppes,Goldberg, Kanz, Searle, and Stauffer (1971).
7. Computer prammlng in BAZIC. This i6 a self-contained coursefor secondary students. It provides an introduction to programming'forstudents without a knowledge of algebra. The course consists of 50lessons, about one hour .in. length, plus summaries) reviews, and self-tests. Further documentation was provided by Supped, Goldberg, Kanz,Searle, and StE.Tfe (1971).
8. Logic 'and Algebra. This course is- designed. for secondary schoolstudents. The first year introduces numerical and sentential variables,formation of a1g-,1:braic terms and.. sentences, and truth. conditions ofsimple sentences.. The second year of the course is concerned. with thefoundations of algebra. From a small set of axioms and. rules of inferencethe properties of the field of rational numbers are developed. Furtherdocumentation was provided by Goldberg. (1971) , Goldberg and Suppes (1972),Suppes (1971) , and by Suppes, Goldberg., Kanz, Searle, and Stauffer (1971) .
9. Games. Additionally, there are several 'games' currently beingused by all the participating schools for the deaf. Although. they arecalled games and are entertaining to use, they have redeeming pedagogicalvalue.
Bagels. This game is properly called Pico-Fermi-Eagels. The pro-gram creates a 3-digit number at random, and the student-player is toguess it. If one of the digits he guesses is correct but in the wrong
11

position, he is told PICO. If one of the digits is correct and in thecorrect place, he is told FERMI. If none of the digits is correct, heis told BAGELS. He has 20 chances to guess the number.
Hangman. Hangman is the familiar garle that most American childrenplay in elementary school. In the IMSSS version, a definition or hintfor a word is given, and the student-player is given six chances to guessthe word by giving the letters that belong in it. The figure being hangedis 'drawn' by the teletypewriter. Three vocabulary lists are availablefor the game. Before beginning, the student-player must select the easy,medium, or hard list. Hangman is also available in a Spanish version.
Poster. Poster creates a poster by taking in any number of lines oftext and enlarging the characters in each line to fill up the (8-inch)width of the teletypewriter paper.
Spell. In Spell, a word is typed and the student-player must indi-cate if it is spelled correctly or incorrectly. If the word is incorrect,the student-player must supply the correct spelling.
Spanish. In Spanish, a word is given in Spanish or English, and thestudent-player must translate it to English or Spanish, respectively. All-instructions and hints are given in Spanish.
12

II. METHODS
A. Experiment I: Mathematics Strands
The purpose of the experiment was to measure the effect of varyingnumbers of math strands sessions on arithmetic computation grade place-ment (GP) measured by the strands curriculum and by an on-line, computeradministered version of the Stanford Achievement Test (SAT),ArithmeticComputation subscale. This on-line version of the SAT was called theModified SAT or MSAT. Construction and administration of the MSAT wasdetailed by Suppes, Fletcher, Zanotti, Lorton, and Searle (1973). Eachstudent was allowed to take only a specified number of math sessions atthe terminal. All other sign-ons were spent working language arts lessons.
Three hundred eighty-five students from among those who were takingboth CAI math strands and CAI language arts, whose average GP or! strandswas betWeen 2.4 and 5.9, and who had taken at least. 15 math strands ses-sions, began the experiment. The students selected were assigned atrandom to five experimental groups that differed in the maximum number ofmath strands sessions they permitted during the experimental period ofapproximately 70 school days. Treatment groups 1, 2, 3; 4, 5 wereassigned 10,:30, 70, 100, and 130 sessions, respectively.
Session.limits were imposed on a calendar basis so that studentswith low numbers of sessions received them distributed throughout theexperimental period. A participating student had no control over thetype of lesson, math strands or language arts, he received. Whether hesigned on for math strands or language arts a student was given a mathstrands lesson if he was eligible for one. Otherwise, he received alanguage arts lesson.
The number of math sessions a student received was monitored daily.The assistance of teachers and proctors was sought to help studentsachieve the number of math sessions they were assigned. Teachers wereurged not to give compensatory off-line work to students assigned to low.numbers of on-line sessions, and, in general, not to alter the classroomwork of any student because of his participation in the experiment.
The MSAT was administered in January at the beginning of the experi-mental period and again'in May immediately after the experiment ended.
One-way, fixed-effects analysis of variance was used to test foroverall effect of the treatment groups. Additionally, it was importantto investigate the relationship of posttreatment scores to pretreatmentscores and the number of math strands sessions given. Five models ofthis relationship were tested. In all five models, T.1 denotes thepretreatment score of student i, T.2 denotes the posttreatment score ofstudenti,andli.denotes number oi math strands sessions taken by studenti.
13

Model I, Linear
E(Ti2) = a0 + alTil + a2Ni .
In this model, 'the effect of pretreatment score an5 number o2 ses-sions on posttreatment performance was assumed to be linear.
Model II, Linear with interaction.
E(Ti2) = a0+ a
1T. + a
2 iN + a
3Til
N.
In Model II, a linear effect of pretreatment score and number ofsessions was assumed, but a linear effect from the interaction of pre-treatment score and sessions was also postulated.
Model III, Cobb-Douglas.
E(in Tit) = a0 + al 13n Til + a2 in Ni .
Model III was based on a formulation of the Cobb-Douglas type (fromeconometrics), namely,
a1
a2
T. = a0T N .
This model was multiplicative and assumed 'weighted interaction' in thata1
and a2indicate the relative importance of pretreatment score and
number of sessions, respectively, in accounting for change in posttreatmentscores.
Model IV, Log quadratic.
E(Ti2) = a0+ a lTit + a2 in Ni + a3(in Ni)2 + 8.4 (in Ni )3
In Model IV, the effect of the pretreatment score was assumed to belinear. The effect of number of sessions was assumed to be logarithmic,rather than linear. In order to explore this logarithmic assumptionftilly,second-andthird-ordertermsin.BrIN.were included.
Model V, Exponential.
E(2n Ti2) = ao + aiNiTil .
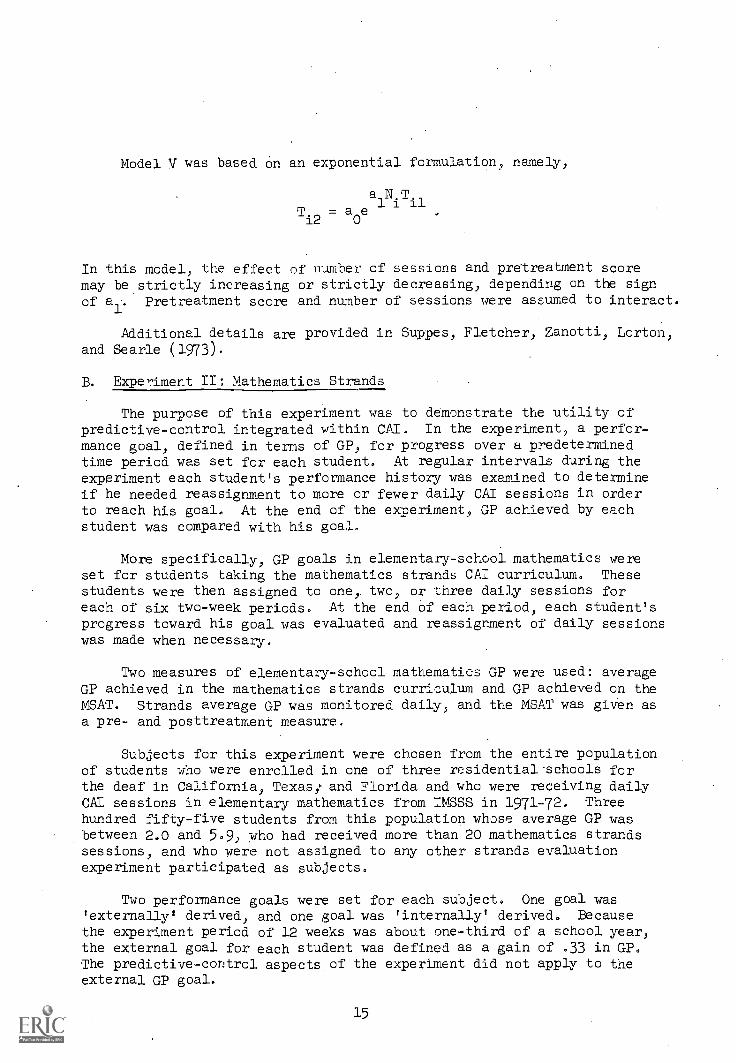
Model V was based on an exponential formulation, namely,
alNiT
T. = a0e
it
In this model, the effect of number of sessions and pretreatment scoremay be strictly increasing or strictly decreasing, depending on the signof a1. Pretreatment score and number of sessions were assumed to interact.
Additional details are provided in Suppes, Fletcher, Zanotti, Lorton,and Searle (1973).
B. Experiment II: Mathematics Strands
The purpose of this experiment was to demonstrate the utility ofpredictive-control integrated within CAI. In the experiment, a perfor-mance goal, defined in terms of GP, for progress over a predeterminedtime period was set for each student. At regular intervals during theexperiment each student's performance history was examined to determineif he needed reassignment to more or fewer daily CAI sessions in orderto reach his goal. At the end of the experiment, GP achieved by eachstudent was compared with his goal.
More specifically, GP goals in elementary-school mathematics wereset for students taking the mathematics strands CAT curriculum. Thesestudents were then assigned to one, two, or three daily sessions foreach of six two-week periods. At the end of each period, each student'sprogress toward his goal was evaluated and reassignment of daily sessionswas made when necessary.
Two measures of elementary-school mathematics GP were used: averageGP achieved in the mathematics strands curriculum and GP achieved on theMSAT. Strands average GP was monitored daily, and the MSAT was given asa pre- and posttreatment measure.
Subjects for this experiment were chosen from the entire populationof students who were enrolled in one of three residential' schools forthe deaf in California, Texas; and Florida and who were receiving dailyCAI sessions in elementary mathematics from IMSSS in 1971-72. Threehundred fifty-five students from this population whose average GP wasbetween 2.0 and 5.9, who had received more than 20 mathematics strandssessions, and who were not assigned to any other strands evaluationexperiment participated as subjects.
Two performance goals were set for each subject. One goal was'externally' derived, and one goal was 'internally' derived. Becausethe experiment period of 12 weeks was about one-third of a school year,the external goal for each student was defined as a gain of .33 in GP.The predictive-control aspects of the experiment did not apply to theexternal GP goal.
15

It should be noted that a GP gain of .33 over 12 weeks of school isan overly-optimistic projection for students from this population. Gentileand Di Francesca (1969) surveyed the academic test Performance of hearing-impaired students. From their data it is clear that in this populationan improvement in GP of .33 measured by the SAT Arithmetic Computationsubtest is far more typical of an entire school year than of a 12-weekperiod.
The internal GP goal was more individualized than the external GPgoal in that it was uniquely determined from each student's performancehistory, and the predictive-control aspects of this experiment wereapplied to these goals. In setting the internal performance goals,average GP change per session was determined for each student by exam-ining his 20th-40th strands sessions. Average.GP change per session forany student who had not received 40 strands sessions was determined byexamining his 20th to his latest CAI session. The internal GP goal foreach student was then determined by extrapolation from these initialobservations and from a linear model of his progress, Number of sessionstaken and the internal GP goals were then used to integrate predictive-control techniques within the mathematics strands curriculum. Detailsof the method are given in Suppes, Fletcher, and Zanotti (1973).
C. Experiment III: GP Measures
Comparisons of the achievement measures used in this study with eachother and with standardized tests are of natural interest. Generally,when an educator speaks of grade placement he has a standardized test inmind. Because neither the MSAT nor GP measured by the strands curriculumis a common measure, it was decided to estimate the concurrent validityof the MSAT GP and strands average GP by comparing them with each otherand with paper and pencil administrations of the SAT.
Sixty subjects were drawn at random from among all subjects par-ticipating in Experiment I. Selection of the subjects was stratifiedso that four were chosen for each of the 15 MSAT form (Primary II,Intermediate I, Intermediate II) by treatment group (10, 40, 70, 100,130 sessions) cells. Two of the four subjects were chosen at randomand assigned to Group I; theremaining two were assigned to Group II.There were then 30 subjects (two from each form by treatment cell times15 cells) assigned to Group I and 30 assigned to Group II. Group I re-ceived paper and pencil administration of the SAT Arithmetic ComputationSubtest (SAT-COMP), Form W, before receiving the pretreatment MEAT, andGroup II received the SAT-COMP after receiving the pretreatment MEAT.The roles of Group I and Group II were reversed for the posttreatmentmeasure. Group IT received the SAT-COMP before the posttreatment MSAT,and Group I received the SAT-COMP after the posttreatment MSAT. Pre-
and posttreatment strands GP scores were also recorded for all thesubjects. Additional details are given in Suppes, Fletcher, Zanotti,Lorton, and Searle (1973).

D. Arithmetic Skills of Deaf and Hearing Students
Comparisons of deaf and hearing students' performance were ofnatural interest in this project and these comparisons were made usingperformance data from the mathematics strands curriculum. This workwas not undertaken in the context of an evaluation experiment, insteadit drew on the extensive data base composed of information automaticallyrecorded by the strands program during student sessions.
Most results from evaluation experiments reported here and else-where are analyzed using linear regression models. These models areadequate for many applications, but, however accurately they predictresponse probabilities, they do not postulate specific algorithmic pro-cesses that students use in solving problems.. Finite automaton modelsare natural theoretical tools for describing algorithmic processes, butthey have no place for a probabilistic theory of error, and a naturalstep is to use probabilistic automata in place of finite deterministicautomata. However, automaton models do. not reflect obvious commonalitiesthat exist among the algorithmic tasks of arithmetic that students areasked to solve. For this reason, Suppes and Flannery (1973) used reg-ister machine models to compare the performances of deaf and hearingstudents in the mathematics strands curriculum.
The basic data for this work were the mean percentages correct foreach equivalence class in the strands curriculum. It should be notedthat before a student can reach a given equivalence class in a givenstrand he must master the previous equivalence class leading up toindependent of such external factors as grade in school, chronologicalage, hearing loss, and minority group status. In a genuine sense, thestrands performance data provide a very broad basis for comparing dif-ferent groups of students with common preparation and prior performance.These comparisons were discussed in detail by Suppes and'Flannery (1973).
E. Problem Solving Experiment__The purpose of the work with arithmetic word problems was to achieve
optimization of learning rates in the context of individual differences.There were three distinguishable aspects to this effort: identificationof appropriate dimensions of word problem difficulty, identification ofoptimal error rates, and development of a model of problem difficultyfor individual students.
Considering group data only and letting pi be the observed propor-tion of correct responses on problem i for a population of students, a,simple linear model of the form,
= Z a.jx. + a
0,
ijj=1
17

can predict proportions of correct responses to new problems from thea. weightings already estimated for the entire student population and
assigned to the k dimensions of problem difficulty. These models wereused in the following steps:
Step 1.. A pilot study was conducted using a set of 65 problems.These were presented to students at a terminal, using response formatssomewhat different from those of the problem solving course, but withthe same constraints; that is, the computer carried out the ,alculations.
Step 2. The results of this study were examined and a set of vari-ables thought to relate to problem difficulty were defined. A stepwisemultiple regression analysis was used to determine the contribution ofeach of these variables to the multiple regression coefficient. Fivevariables were found to account for 60 percent of the variability, andthe contribution of each remaining variable was less than 1 percent.These variables were, in the order in which they entered the regression:OPUS, the minimum number Of arithmetic operations required for solution;CONWI, whether the solution required conversion of units with the unitof conversion absent from the problem statement.; LENGT, number of wordsin the problem statement; DIV, whether the solution required a division;and VCLUE, whether the problem contained a verbal clue for an operation.
Step 3. A set of problems was written and edited, and coded usingthe five variables identified in the pilot study.
Step 4. A multiple regression analysis was carried out on thepilot study data, using only these five variables. The regression coef-ficients obtained were used to predict the probability correct for the700 problems written for the main curriculum, and the problems wereordered according to predicted probability 'correct. The predicted proba-bility correct ranged from .95 to .07.
The 1971-72 performance data were used to repeat the entire processof identifying variables that contribute to the multiple regression coef-ficient, predicting probabilities of correct answers, and arranging theproblems In order of increasing difficulty. This analysis was performedfnr deaf and hearing students separately in order to compare the separateorderings of problems and weightings of thedimensions of difficulty.
Assuming that the problems are appropriately ordered in difficultyfor any student, we can position him in the curriculum so that the pro-portion of correct responses he makes remains fairly stable and so thathis progress in the curriculum is optimal. The following constant errorrate model from Suppes (1967) stabilizes the proportion of correct re-sponses about the value assigned to r, which is assumed to be the optimalrate of correct responding for a student.
18

where
xn +l
xn
E
xn
xn
xn-E
if
if
if
if
ps(c) > r
s
ps(c) > rs ,
ps(c) <r
s
ps(c) <r
S,
-xn
E
1 < x
xn<e
E< X- n
<
E
xn
is the position of student s in the curriculum,
is a small, positive constant used to define the stepsize of student s' walk through the curriculum,
(c) is the proportion of correct answers achieved by students over some previously used portion of the curriculum,
rs
is the optimum rate of correct answers for student s.
Although discussed earlier by Suppes (1967) many will recognizeaspects of 'tailored testing' as discussed by Lord (1971a, 1971b) inthis procedure. Lord, however, uses Birnbaum'3 3-parameter logisticmodel of item difficulty which is strictly empirically derived and,therefore, cannot be applied to predicting difficulty of new problemsthat have not been attempted by a large number of students.
The comparison of dimensions that contribute significantly to modelsof problem difficulty for deaf and hearing s'adents as well as the com-parison of weightings given these dimensions is of natural interest.Also of interest are the weightings given these dimensions in models ofproblem difficulty derived for individUal students.
It should be noted that because we have to find one set of a. to
apply across all problems for each individual, we can determine therelativeimportanceoftheka.variables for each individual from the
magnitude of these values. These values may not vary in any significantmanner from those developed for the population. In this case the calcu-lation of parameters for models of problem difficulty for individualsis a waste of time. This question can be investigated by testing thenull hypothesis that a linear relation holds between the set of a.
J
calculated for any individual student and the a calculated for the
entire population of students. Specifically, we can test the null hy-pothesis that there exists an
as/ 0 and such that the k-tuple of
parameters calculated for the model of problem difficulty o'er the entirepopulation
19

(a0, .' aks
) psu
ak) = as(a_ , as ls,
Changes of the a.1 over time (or learning) and different values of r
will also be of interest.
The work with arithmetic word problems is documented in Searle,Lorton, and Suppes (1973).
F. Language Arts Experiment
The purpose of the experiment was to measure the effect of varyingnumbers of language arts sessions on posttest scores. Each student wasallowed to take only a specified number of language arts sessions. Allother sign-ons were spent working math strands sessions. The experimentwas analogous to the math strands Experiment I described by Suppes,Fletcher, Zanotti, Lorton, and Searle (1973).
Two hundred thirty students from among those who were taking bothCAI math strands and CAI language arts in 1972-73 were selected for theexperiment, and were assigned at random to oni of five experimentalgroups that differed in the maximum number of 10-minute language artssessions they permitted. Students assigned to Groups 1, 2, 3, 4, and 5were permitted 20, 45, 70, 95, and 120 sessions, respectively. Thesubjects were selected from students in the California School for theDeaf, Berkeley, California, the Oklahoma School for the Deaf, Sulphur,Oklahoma, and the Texas School for the Deaf, Austin, Texas. Randomassignment of these subjects to the five treatment groups was stratifiedso that roughly the same number of students from each school could beassigned to each of the treatment groups. When the experiment began,45 students were assigned to Group 1, 46 were assigned to Group 2, 46were assigned to Group 3, 47 were assigned to Group 4, and 46 wereassigned to Group 5. One-way, fixed effects analysis of variance andfive models of student progress were used to investigate student per-formance at the end of the 80 school-day experiment period. The fivemodels bf student progress investigated were the same as those used inmathematics strands Experiment I.
The assistance of teachers and proctors was sought to help studentsachieve the number of language arts sessions they were assigned. Teacherswere urged not to give compensatory off-line work to those students as-signed to low numbers of on-line sessions, and, in general, not to alterthe classroom work of any student because of his participation in theexperiment.
The language arts experiment was documented by Fletcher and Beard(1973).
20

G. Langua,e Arts Item Analysis
The intentdifficulty thatdeaf students,were classifiedearlier, by theanswe r.
of this analysis was to discover useful dimensions ofaffected performance on language arts items taken byThree different item classifications were used. Itemsby subdivisions of the four course objectives listedrequired exercise taskl and by the format of the correct
There were four dimensions of classification by exercise task:
(a) Instructions given or no instructions given. This dimensiondistinguishes exercises that occur early in lessons for whichthe instructions are printed or reeated, from exercises thatoccur later in lessons when it was assumed the student madthem well in mind.
(b) Instance (number) or instance (text) or concept, This dimen-sion distinguishes exercises in which the student must answerwith an instance of a concept from exercises in which thestudent must answer with concept based on a given instance.When concepts are answers they are always abbreviated. Someinstances were numbered so the student could reply only withthe number(s) associated with the text of the instance- -instance (number) -- rather than with the actual text of theinstances--instance (text).
(c) Recognition or construction (explicit basis) or construction(implicit basis). This dimension distinguishes exercises inwhich the answer is printed. in the exercise displayrecognition--from exercises in which the answer does not appear in the dis-playconstruction. The construction (explicit basis) andconstruction (implicit basis) dimensions distinguish betweendegrees of explicitness in the exercise directions. In con-struction (explicit basis) a form, but not the correct form,of the correct .answer text is given; in construction (implicitbasis) no form of the correct answer is given explicitly.
(d) Usage or definition. This dimension distinguishes exercisesin whiCh the answer is to be derived on the basis of an im-plicit rule.of usage taught inductively in the curriculum fromexercises in which the answer is to be derived from the defin-ition of a grammatical category.
Given 2 times 3, times 3 times 2 possibilities, there would be 36categories under this.task classification scheme if it were not for thefolic :ig combinations that do not occur:
there are no concept-construction tasks;there are no concept-usage tasks;and there are no instance (number)-construction tasks.
21

Eighteen categories are left plus one category labeled "Giveaway."
There were two dimensions of classification based on format ofcorrect answers.
(a) Word or letter or number or abbreviation. There is some`nesting' Inder this dimension: word is subclassified as 1,2, 3, or 1 word strings; letter is classified as 1, 2, or 3letter strings; and number is classified as 1, 2, 3, 1, or5 number strings. Abbreviations present a problem in thatthey could, reasonably be classified as single letters, mul-tiple letters, or single words. It was decided that theywould confuse the single letter, multiple letter, or singleword results, and they were treated separately in the exercisetask data analyses.
(b) Sequence or no sequence. In some instances, the sequence of amultiple word, multiple letter, or multiple number response isimportant; in some instances sequence is not important. This
dimension distinguishes between these instances.
Classified in this way there were 17 correct answer formats that occurredin the language arts curriculum.
A more detailed description of the language arts item analysis isdocumented in Fletcher and Beard (1973).
H. Test Development
Two tests were developed specifically for this project: the computer-administered MSAT, and a language arts test (LAT). Construction andvalidation of the MSAT are discussed.in Suppes, Fletcher, Zanotti, Lorton,and Searle (1973), and construction and validation of the LAT are dis-cussed in Fletcher and Beard (1973). These practical developmentsevolved naturally into some theoretical work on test development.
Jensema (1973a) studied a simple method for estimating parametersfor the Birnbaum 3-parameter logistic mental-test model. The accuracyof the methOd was investigated using Monte-Carlo data, and data fromsix vocabulary tests were then used to demonstrate the usefulness ofthe method in prescreening items. Jensema (1973b) also used Monte-Carlodata and four different item banks to study termination of Bayesiantailored testing by two different methods: according to the number ofitems administered and according to the magnitude of the standard errorof estimate. The estimate of ability obtained through tailoring wascompared with the known ability of each Monte-Carlo 'examinee' as eachstandard error of estimate level was reached and as each item. was admin-istered.
22

I. Economics and Technology f the Network
The primary effort under this project was to develop and evaluateCAI curriculums used by deaf students. However, development and evalu-ation are insufficient in themselves to have a practical payoff forsubstantial numbers of students. For this reason, we investigated the
operational implementation of CAI. A central aspect of this implementa-tion concerned the basic economics of CAI- its cost, performance, anddegree of substitutability for other inputs into education of the deaf.
The basic cost assumption was that for $300 per month a teletype-writer terminal can be maintained in a typical school. This cost includesamortization of capital costs, use of the central computer system, com-munications, proctoring) and supplies. It does not include expenditures
for classroom space. A further assumption was that for 20 days per monthen average of 25 student sessions per day are given at each student ter-minal. Thus, 500 sessions per terminal per month were assumed to cost$300, or $.60 per session. The number of sessions per terminal per dayobtained by different sclols varies widely, and with effective schedulingit is feasible to obtain many more than 25 sessions per terminal per day.Many schools for the deaf obtained utilization rates in the. range of 35-Ito sessions per terminal per day, suggesting the possibility of substan-tially lower costs per session than $.6o. Also, a 6-hour school daywas assumed; the residential schools for the deaf used their terminals8-10 hours per day, further increasing the number of sessions per terminalper day and further decreasing the cost per session.
The decision of whether to provide CAI and how much CAI to providedepends not only on cost per session but on two other critical factors.First is the performance of CAI in raising student achievement. Secondis the issue of what must be given up in order to have CAI. Given thatbudgets are inevitably constrained, the more CAI an administrator pro-vides his students, the less he can provide of something else, Arequirement of good administration is to make these tradeoffs explicitly,both in terms of their cost and of their performance.
The study of the economics and technology of the CAI network main -t lined fOr the schools that participated in this project was describedin more detail Ar Fletcher, Jamison; Searle) and Smith (1973), and by-Ball and. Jamison (1972).
J. Grammatical and Semantic Analysis of EnE212-12.1sedliotheDeaf
There were three aspects of this work: collection and analysis ofa corpus of writing samples; study of the manual alphabet; study of pre-lingually deaf adolescents as nonnative users of English.
An important step in examining the language of hearing - .impairedstudents was the collection and analysis of a corpus of writing samples.An intensive analysis of a small sample of the written language of deafstudents obtained from Kendall School for the Deaf in Washington,.D.C.
23

and the California School for the Deaf in Berkeley, California, wasundertaken. This corpus was edited and divided into 1,311 sentences.Informally, these sentences were analogous to the complete thoughts ofclassical grammar. Nearly all of the sentences in the writing sampleswere terminated by conventional punctuation so the original corpus wasmodified very little. This corpus was analyzed with respect to sentencelength, vocabulary, and the grammar of its noun phrases. This work wasdetailed by Fletcher, Jamison, Searle, and Smith (1973).
Perceptual confusions in learning and perceiving letters of themanual, alphabet were studied in depth. Letters of the manual alphabetwere displayed as characters on a computer-graphics terminal, and per-ceptual confusions among these characters were investigated by closeexamination of the response profiles recorded for subjects learning to'read' the manual alphabet and by multidimensional scaling techniquesapplied to perceptual confusions that arose when the letters of themanual alphabet were rapidly displayed. It should be noted that theprecise control over display of these characters and'the comprehensiveand accurate recording of subject response data permitted by computer-graphics presentations established a unique experimental situation forstudying perception of the manual alphabet. This work is documented byWeyer (1973).
One explanation for the difficulties that deaf students experiencewith standard English is that they learn English as a second language.and that American Sign Language is their native language. This explan-ation has occurred recently in the literature of deaf education as a'speculation, but systematic, empirical studies of this explanation werelacking. Pursuant to this regard the Test of English as a Foreign Language (TOEFL) published by Educational Testing Service (1970) wasadministered to 13 prelingually deaf children of hearing parents (BP)and to 13 prelingually deaf children of deaf parents (DP). Mean age inthe HP group was 219 months and mean age in the DP group was 206 months.The TOEFL scores of the HP and DP subjects were compared with each otherand with the scores of the foreign student population used to standardizethe TOEFL. Scores achieved by the HP and DP subjects on the Paragraph-Meaning and Language subtexts of the SAT were also compared. This workwas described by Charrow and Fletcher (1973).
K. Surveys
Three extensive surveys of the cognitive literature on deafnesswere completed as an essential adjunct to the project. Suppes (1972b)surveyed the cognition of blind, deaf, and educable mentally retardedchildren in three areas: language and language development; conceptformation and abstraction; and elementary mathematical skills. Bonvillianand Charrow (1972) reviewed the psycholinguistic implications of deafnesswith particular emphasis on language acquisition and the use of signlanguage by the deaf. The Bonvillian and Charrow review was considerablyexpanded by Bonvillian, Charrow, and Nelson (1973) to include carefulreview of educational achievements of the deaf and available educationalprograms for the deaf with particular emphasis on the relative effective-ness of oral and manual communication techniques.
24

III. RESULTS
A. Experiment I: Mathematics Strands
Suppes, Fletcher, Zanotti, Lorton; and Searle (197) reported thatcomplete data were obtained for 60 students in group 1, 62 students ingroup 2, 60 students in group 3, 60 students in group 4, and 70 studentsin group 5.. The number of sessions taken fell short of the number as-signed in groups 3, 4, and 5, primarily because of difficulties inscheduling extra CAI sessions in the schools.. However, the groups re-mained sufficiently distinct to warrant proceeding with analysis ofvariance which used posttreatment LSAT scores and. average GP of themathematics strands as dependent measures. In order to make comparisonsacross all three MSAT battery scores, SAT scales were used to convertMSAT raw scores to GP scores. Analyses of variance were performed onpretreatment measures as well as posttreatment measures to check for anybias in the assignment of students to treatment groups. The F ratio of9.088 for the strands posttreatment GP was significant (F.99(4;307) = 3.48),
and the average GP improvement for the 10-sessions group 1 wasonly .15compared with :96 for group 5. The F ratio of 1.404 for the MSAT scoreswas nonsignificant (F.9(4,307) = 2.45), but the average GP improvement
for the 10-sessions group 1 was .42 compared with .76 for group 5.
Parameters for the five models were generated twice, once usingmathematics strands average GP as pretreatment and posttreatment achieve-ment measures and once using MSAT GP scores. The linear model withinteraction accounted for more of the variance in the dependent variable(posttreatment average GP) than did any of the other models, but despitethe inclusion of a term for the interaction of number of sessions withpretreatment GP, it represented only a slight improvement over the simplelinearmdel.Assuming.N.=120 or slightly less than one session per
day for a school year and taking a2.-.0123 from the linear model; we
can project Ti2 - Til =1.48. That is to say, if a-student from this
population takes about one strands session per day for an entire schoolyear, we can expect his strands average GP to increase by about a yearand a half. Data presented later show that strands average GP under-estimated both GP measured by paper and pencil administrations of theSAT and GP measured by the MSAT. This improvement of 1.48 can be com-pared with an expected GP increase over a school year of .3 to .4 in theSAT computation subtest fur hearing-impaired students receiving ordinaryinstruction (Gentile & DiFrancesca, 1969).
Among the models and parameters using MSAT GP as pretreatment andposttreatment measures, the multiplicative model from econometrics thatassumed weighted interaction of number of sessions with pretreatmentGP accounted for more of the variance in the posttreatment measure thandid any other model, but, as with strands average GP, it represented
25

only a slight improvement over Model I, the simple linear model. Again,assuming Ni = 120 and taking a2 = .0084 from the linear model, we can
project P.2 - Tit . 1.01. That is to say, if a student from this popu-
lation takes about one strands session per day for a school year of 120net days, we can expect his MSAT GP to increase by about one yearRoughly, we can expectan increase of .1 in MSAT GP for every 12 sessionstaken.
Suppes et al. concluded that the mathematics strands CPI curriculumcan lead to substantial increases in mathematics computation GP when usedby hearing-impaired students. The increases are sufficient to bring thestudents to GP gains expected of normal-hearing students. Moreover,these gains can be achieved by students working intensely for only a fewminutes a day in a supplementary drill-and-practice program. The timespent at a computer terminal by each student ranged from 6 to 10 minutesfor each session.
In addition, Suppes et al. concluded that a simple linear model ofstudent achievement gives a good account of the posttreatment distributionof GP measured either by the MSAT or by the strands GP. The investiga-tion of other models,. including models with interaction terms, did notlead to any substantial improvement in accounting for posttreatment GPvariance. The results of the analysis, including the application of thelinear model, indicate that greater numbers of CAI sessions are beneficialfor all students, across all levels cf pretreatment achievement.
B. Experiment II: Mathematics Strands
Suppes, Fletcher, and Zanotti (1973) reported that complete datawere obtained for 297 subjects. The subjects took far fewer mathematicsstrands CPI sessions than expected. In designing the experiment, itwas assumed that each subject could take as many as 150 sessions in the12-week experiment period and that each subject would take a minimum of50 sessions. As it turned out, 159 subjects (54%) took less than 50sessions. Despite these low numbers of accumulated sessions, 274 subjects(92%) exceeded their external goals measured by strands average GP and191 subjects (64%) exceeded their external goals measured by the MSAT GP.
The biweekly predictions in the experiment were made in terms of alinear model because the extensive analysis required to. fit a moresophisticated model had not taken place. Suppes, Fletcher, and Zanottireported that models of the following form predicted student progressin the experiment with a high degree of precision:
where'
GP. = + b. Si, c < 1 ,
GP. is the grade placement of student i,
26
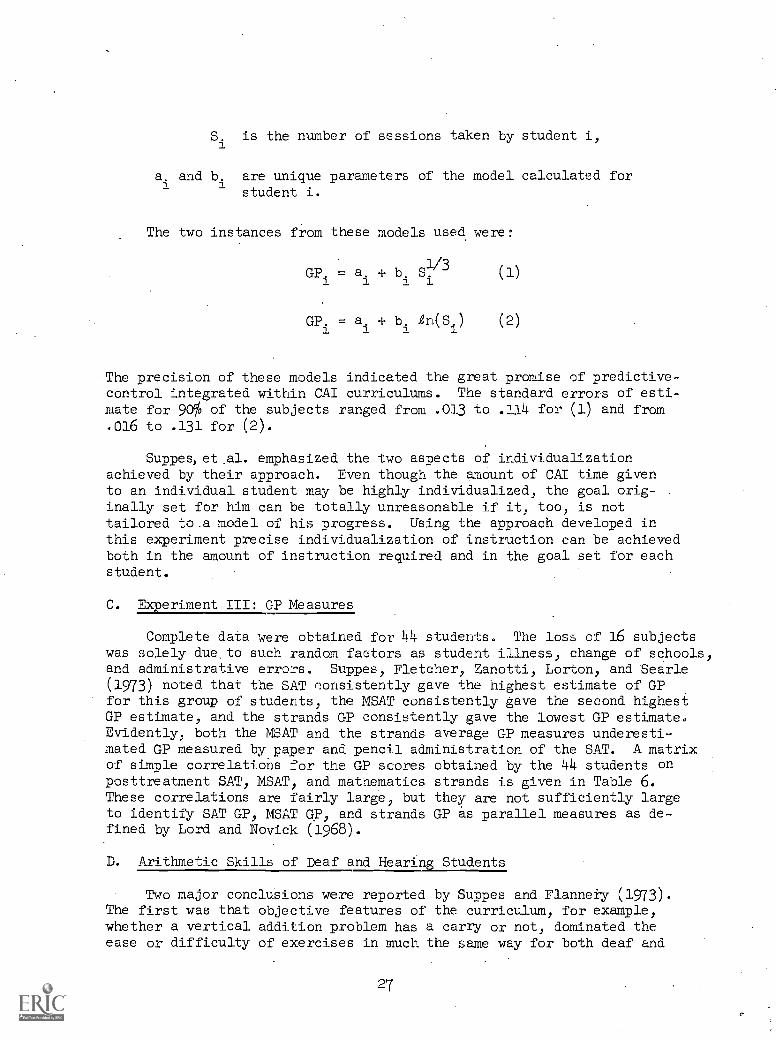
S. is the number of sessions taken by student i,i
a.andb.are unique parameters of the model calculated forstudent i.
The two instances from these models used were:
313GP. = a. + b. S. (1)
GP. = a. + b. 2n(Si) (2)I 1 1
The precision of these models indicated the great promise of predictive-control integrated within CAI curriculums. The standard errors of esti-mate for 90% of the subjects ranged from .013 to .1114 for (1) and from.016 to .131 for (2).
Suppes,et.al. emphasized the two aspects of individualizationachieved by their approach. Even though the amount of CAI time givento an individual student may be highly individualized, the goal orig-inally set for him can be totally unreasonable if it, too, is nottailored to.a model of his progress. Using the approach developed inthis experiment precise individualization of instruction can be achievedboth in the amount of instruction required and in the goal set for eachstudent.
C. Experiment III: GP Measures
Complete data were obtained for 44 students. The loss of 16 subjectswas solely due.to such random factors as student illness, change of schools,and administrative errors. Suppes, Fletcher, Zanotti, Lorton, and Searle(1973) noted that the SAT consistently gave the highest estimate of GPfor this group of students, the MSAT consistently gave the second highestGP estimate, and the strands GP consistently gave the lowest GP estimate.Evidently, both the MSAT and the strands average GP measures underesti-mated GP measured by paper and pencil administration of the SAT. A matrixof simple correlations for the GP scores obtained by the 44 students onposttreatment SAT, MSAT, and mathematics strands is given in Table 6.These correlations are fairly large, but they are not sufficiently largeto identify SAT GP, MSAT GP, and strands GP as parallel measures as de-fined by Lord and Novick (1968).
D. Arithmetic Skills of Deaf and Hearing Students
Two major concluSions were reported by Suppes and Flannery (1973).The first was that objective features of the curriculum, for example,whether a vertical addition problem has a carry or not, dominated theease or difficulty of exercises in much the same way for both deaf and
27

Table 6
Matrix of Simple Correlation Coefficients for GP Scores
Obtained by 44 Subjects on Posttreatment SAT,
MSAT, and Mathematics Strands Measures
SAT post- MSAT post-treatment treatment
SAT post -
treatment
MSAT post-treatment
Strands post-
treatment
1.000 .827
1.000
Strands post-treatment
.794
.807
1.000
28
normal-hearing children. This finding leads to the second conclusion,which. was more surprising than the first: the performance of the deafchildren was almost always slightly better than that of the normal-hearing children. More exactly, of the 7E1 equivalence classes, summingacross all grades and strands for which there were data, the can per-centage correct of the deaf students was higher than that of the normal-hearing students for 673 equivalence classes, and it was the same to twodecimals for 22 equivalence classes. These massive data support thethesis that the cognitive performance of deaf children is as good asthat of normal-hearing children, when the cognitive task does not directlyinvolve verbal skills. From an educational standpoint, the data suggestthat with proper organization of teaching effort, we should be able toobtain results in arithmetic as good for deaf children as we do foraverage to slightly below-average normalhearing children.
E. Problem Solving Experiment
Searle, Lorton, and. Suppes (1973) were able to account for 72% ofthe variance in observed proportions-of correct answers to the 125arithmetic word problems worked by their subjects. Using seven inde-pendent variables and proportion correct as the dependent variable,they obtained a multiple correlation coefficient of .85 with a standarderror of estimate of .27. They concluded that it is possible to accountfor a substantial portion of variability in student responses to arith-metic word problems using independent variables that: describe structuralfeatures of the problems. However, their models of problem. difficultywere inadequate in that both the predicted proportions of correct answersand the expected amount contributed to problem difficulty by each inde-pendent variable lacked precision. On this basis, Searle, Lorton, andSuppes further concluded that their results were situation dependent.
Comparisons of performance by deaf and disadvantaged. hearing studentsshowed that both groups found the same problems easy or hard. There wasa significant correlation between. the rank order of problems for the twogroups (Kendall's rho = .511, p < .001), and Searle, et al. concludedthat the different handicaps .characterizing the two groups of subjectsdid not produce different performance on the word. problems.
F. Language Arts Experiment
Fletcher and Beard (1973) reported that complete data were obtainedfor 197 subjects. However, 46 of these subjects had' received 100 or moresessions in 1971-72 and these subjects were remrwed from the experiment-prior to any data analyses which were then performed on the 151 remainingsubjects... In the analysis of variance there were 33, .27, 26, 33, and 32subjects in treatment groups 1, 2, 3, 4, and 5, respectively. Studentsin groups 1, 2, 3, 4, and 5 received an average of 22, 46, 69, 88, and.106 sessions, respectively. These averages were .1ess than expected forgroups 3, 4, and 5, but the treatment groups appeared sufficiently dis-tinct to proceed with analysis of variance. The F-ratio for this analysiswas not statistically significant, indicating that the range of sessions
29
considered did not have a significant effect on posttest scores. The
paper and pencil language arts test developed by the project appeared tobe reliable and fairly valid. The correlation between pre- and posttestscores on the test was .910 with an F-ratio for significance of regressionbeyond p < .01, and the correlation between posttest scores and number oflessons completed was .645 with an F-ratio for significance of regressionbeyond p < .01.
Models I, II, III, IV, and V accounted for 83%, 83%, 66%, 83 %, and33%, respectively, of posttest score variance. The only model to whicha term that included a measure of sessions taken contributed significantlywas Model V. In all other models the only significant independent vari-able was the pretest score. An additional model, Model VI, was investi-gated. This model was of the form
E(T2) = ao + a1T1 + a2N + a3L
where T2refers to posttest score,
T1refers to pretest score,
N refers to number of sessions taken,
L refers to number of lessons completed,
and a0,
al'
a2, and a3 are parameters of the model. Model VI accounted
for 85% of the variance in posttest scores. Both sessions and lessons,in addition to pretest scores, contributed significantly (p < .01) tothe model. However, the regression coefficient in Model VI for numberof sessions taken was negative, indicating an inverse relationship be-tween number of sessions taken and posttest scores when number of les,..cnscompleted is taken into account.
Fletcher and Beard concluded that the course is of significant. valueto students whose ratio of lessons completed to sessions taken is highbut of much less value to students whose ratio of lessons completed tosessions taken is low. The relationship between sessions taken and post-test scores was concluded to be more complex than anticipated.
G. Language Arts Item Analysis
Fletcher and Beard (1973) reported several results from their itemanalysis of the language arts curriculum that are not widely noted inthe literature on deafness.
First,.the 'directions' lessons were far easier than anticipatedgiven the general impression among deaf educators that deaf studentsexperience difficulty in following directions. Some reasons for thisresult may be.that the directions in these lessons and in the Curriculum
30

were easier to follow than those given in classroom instruction, thatthe directions given in the language arts CAI were more clearly communi-cated to students than are directions given in classroom instruction, andthat deaf students have less difficulty following directions than generallysupposed. More research is required to decide among these alternatives.
Second, although pronouns were generally far easier than anticipated,items on possessive pronouns were extremely difficult for the studentsSpecifically, possessive pronouns that differed in number (his boxes,their box) and/or gender (his sister, her husband) from the nouns theymodified were seldom completed correctly.
Third, copulas joining subjects with predicate complements that dif-fered in number from their subjects were vex difficult forthe students.Copulas for items such as the following:
The house (is, are) blue and white.The girls (seem, seems) lonely
were seldom completed correctly.-
Fourth, the students had very little trouble with contractions withthe exception of which was far more difficult fnr the students thananticipated.
H.. Test Development
Jensema (1973a) showed that estimation of guessing parameters forBirnbaum's 3-parameter model must be improved before tailored testingtechniqUes with multiple-choice items can become generally useful. The
Monte-Carlo data demonstrated that estimation of item difficulty by themethod discussed is accurate, but that estimation of item discriminationcan be relied on only for items with difficulties between -1,0 and +1.0,Jensema concluded that the method discussed should be used with cautionand must be viewed, not as a replacement for maximum likelihood estimation,but as a convenient technique for economically prescreening items.
Jensema (1973b) showed that the standard error of estimate was agood index of reliability regardless of the characteristics of the itemspresented. Be concluded that, generally, Bayesian tailored testing is .
best terminated by reaching a criterion value for the standara error ofestimate. However, if all the items presented have approximately equaldiscrimination and guessing parameters, the number of items that must beadministered to achieve a given level of reliability can be estimated.
I. Economics and Technology f the Network
Fletcher, Jamison, Searle, and Smith (1973) concluded that substan-tial amounts of CAI are feasible with only minor increases in student-to-staff ratios. The school administrator must determine the cross-overthat results from the increasing achievement due to CAI that is counter-balanced by the decreasing achievement due to larger student-to staff
31

racios. Ball and Jamison (1972) demonstrated the economic viability ofa satellite-based CAI communications network for dispersed populations.Four implementation alternatives were considered by Fletcher, et al. andby Ball and Jamison: first, operational utilization of the IMSSS facilityat Stanford with administrative and operational responsibilities borneby Stanford personnel; second, operational utilization of the IMSSSfacility with administrative and operationalresponsibilities borne by aschool serving the deaf community; third, implementation of curriculumsdeveloped under this project on small stand-alone computer systems locatedat school sites; and fourth, establishment of a large CAI center for thedeaf that would run 500-1500 student terminals simultaneously. Ball andJamison indicated that there are no absolute rules for choosing amongthese alternatives but that choices must be made relative to tradeoffsthat were explicated in their paper.
J. Grammatical and Semantic Analysis of English Used by the Deaf
Fletcher, Jamison, Searle, and Smith (1973) reported an averagesentence length of about nine words in the SAMPLE corpus. An irterestingtheoretical problem connected with the length of utterances in the corpuswas to account for the distribution of utterance lengths with a formalmodel of utterance generation. The three theoretical distributions in-vestigated were the geometric, the poisson, and the negative binomial.Of these, the negative binomial provided the best fit of the data Therewere 11,697 words (tokens) in SAMPLE, but only 1,898 different words(types). Fletcher, et al. listed the 100 most frequently occurring wordsand the grammatical categories appropriate for all entries in the SAMPLElexicon. Noun-phrases predominated the utterances in SAMPLE and a proba-bilistic grammar was constructed for the 2,366 noun-phrases in the corpus.
Weyer (1973) reported major clusters of perceptually confused char-acters in the manual alphabet. The largest cluster (A N S T) was composedof letters that involve a fist and differ from one another in thumbposition only. Other letters represented by folded fingers (E M 0) com-posed an adjacent cluster. Letters in the next cluster (B F U) weredistinguished by the number of vertical fingers, 3, and 2, respectively- -displayed, Minor confusion clusters composed of Y. and V, V and W, R, D,X, and Z, G and H, and J, and P and Q were also reported. There werepractically no confusions involving C, L, and Y. Weyer's study representedthe first application of multiple dimensional scaling to the manualalphabet.
Charrow and Fletcher (1973) reported statistically superior perfor-mance by DP subjects on three of the four TOEFL subtests (HP and DPsubjects' scores on the Reading Comprehension subtest did not differsignificantly), on total TOEFL scores, and on the Paragraph Meaning andLanguage SAT subtests. Parentage (whether the subjects had deaf orhearing parents) accounted for 53% of the variance in total TOEFL scoreand the indicated importance of parentage was corroborated by stepwisemultiple regression. Item-by-item comparisons within the TOEFL subtestsfor number of responses to the correct answer and to the most likely
32
wrong answer made by a standardization group of hearing, foreign studentswere undertaken. These compar:sons.showed the TOEFL performance of DPsubjects to be more like that of the standardization group than was theTOEFL performance of HP subjects. Charrow and Fletcher concluded thattheir results suggest that deaf students learn-English as a second lan-guage, but that more sensitive measures must be devised to provide moreconclusive results.
K. Surveys
Suppes (1972b) drew three broad conclusions from his survey of re-search on cognition in deaf children. Finst,. language problems arecentral to the education of handicapped children, but much remains to belearned about the source of. their difficulties and about how they may bemet. Second, the excellent methodology developed for the. learning ofdiscriminations and of simple associations by the handicapped needs tobe extended to more complex tasks. Third, more attention needs to begiven to estimating the magnitudes of the effects that result from varioustraining procedures and less attention to establishing statisticallysignificant differences among training procedures.
Bonvillian, Charrow, and Nelson (1973) concluded that: first, thedeaf are not deficient in intellectual competence, their weaker skillSin English and lower educational achievement require other explanations;second, despite deficiencies in processing English, many deaf personscommunicate effectively in sign language; and, third, similar linguisticabilities underlie effective use of sign language and spoken language.Bonvillian, et al. strongly recommend increased use of sign language ineducating the deaf.
33

TV. PUBLICATIONS
This project generated a substantial amount of documentation. Much
of.this documentation took-the form of IMSSS technical reports, and thesereports will be or already have been submitted either in whole or in partfor publication in the professional literature. The purpose of this sec-
tion is to review publications arising from the project with referenceto topics discussed in this report.
General
General discussions of the standards, objectives, and methods thatformed a foundation for this project were given by Fletcher and Stauffer('1973), Suppes (1971, 1972a), and Suppes and Morningstar (1970). Suppes,
Goldberg,. Kanz, Searle, and Stauffer (1971) documented many of the IMSSScurriculums used by this project and many of the operational techniques
of CAI. Friend (1971) documented a coding language, INSTRUCT, and anassociated coding system. that was used to program several curriculumsfor this project.
Experiment I: Mathematics Strands
Experiment I was reported by Suppes,.-Fletcher, Zanotti, Lorton, andSearle (1973).
Experiment II: Mathematics Strands
Experiment II was reported by Suppes, Fletcher, and Zanotti (1973).
Experiment III: GP Measures
Experi:-ent III was reported by Suppes, Fletcher, Zanotti, Lorton,.and Searle (1973).
Arithmetic Skills of Deaf and Hearing Students
Comparisons of deaf and hearing students' arithmetic skills werereported by Suppes and Flannery (1973). Comparisons of deaf and hearingstudents' arithmetic word problem solving skills were reported by Searle,Lorton, and Suppes (1973).
Problem Solving Experiment
The experiment on structural variables that affect arithmetic wordproblem difficulty was reported by Searle, Lorton, and. Suppes (1973).
Language Arts Experiment
The language arts evaluation experiment was reported.by Fletcherand Beard (1973).
34

Language Arts Item Analysis
An extensive. analysis of the language arts curriculum items wasreported by Fletcher and Beard (1973).
Test. Development
Theoretical and practical results in test development were reportedby Fletcher and Beard (1973), Jensema (1973a, 1973b), and Suppes, Fletcher,Zanotti, Lorton, and Searle.(1973).
Economics and Technology of the Network
The economics and technology of the CAE network maintained by thisproject was discussed by Ball and Jamison (1972) and Sanders and Ball(1972).
Grammatical and Semantic Analysis of Language Used by the Deaf.
The analysis of a corpus of writing samples produced by deaf studentswas reported by Fletcher, Jamison, Searle, and Smith (1973). Perceptualconfusions observed in learning and perceiving letters of the manualalphabet was reported by Weyer (1973). A study of English as the secondlanguage of deaf students was reported by Charrow and Fletcher. (1973).
Surveys
Three extensive surveys of the professional literature on deafstudents were prepared by Bonvillian and Charrow (1972), Bonvillian,Charrow, and Nelson (1973), and Suppes (1972b).
35

V. CONCLUSIONS
We began this project with the conviction that.we had a powerfulinstructional tool at our disposal. Our aims were to demonstrate that
CAI could be used to advantage by deaf students, that it could supportserious research in deaf education, and that a favorable argument could
be made for the economics of CAI. Behind these aims was the generalintent of initiating large-scale use of CAI in schools for the deaf. To
some extent we successfully met each of these aims.
It seems reasonable to conclude that CAI can be used successfully by
deaf students. We did not set out to apply CAI to all of deaf educationwe attempted only what we could do well Curriculum -work was concen-
trated on the skill subjects of mathematics and language arts, and, with-in these subjects, we emphasized aspects that were most amenable to computerpresentation. Under these constraints we achieved favbrable results.Certainly, the gains in mathematics computation ability that were two tothree times what is expected from classroom instruction and the precisionwith which grade placement increase could be predicted as a function ofCAI sessions are notable.
We also conclude that CAI provides a substantial foundation for re-search on the problems and processes of deaf education. The range of
research undertaken by this project barely represents the diversity ofinquiry that can be supported by CAI. The unobtrusive and precise con-trol over experimental conditions made possible by computer presentationsas well as the accuracy and speed of computer arithmetic and data retrieval permit a wide spectrum of experimental possibilities that we haveonly begun to explore.
The major drawback of CAI is its cost. Computers require a sizable.commitment of funds both for acquiring capital equipment and for main-tainidg operations. Fortunately, the steady increase. in the quality ofavailable CAI is matched by a steady decrease in its costs. In the mid-
1960's when CAI first became available, it cost about $40 per studentcontact hour. Currently, CAI offered-by the IMSSS system costs $1.50-$2.50 per student contact hour, depending on communication expenses. Forthe immediate future we can expect continued decreases in the costs andcontinued increases in the quality of CAI.
The proof of this project is in its impact on deaf education. Spec-
ifically, the willingness of the participating schools to support CAIfrom their own funding sources is the ultimate test of the project's im-pact. To date 13 of the 15 schools that participated in this projecthave committed funds to continuing their CAI activity in 1973-74. The
two remaining schools have not decided what CAI implementation alternativeto adopt. Two schools that received no CAI from this project will beadded to those supporting CAI in one network that directly resulted fromthis project. We expect the growth of CAI in schools for the deaf tocontinue.
36

VI. RECOMMERDATIONS
We emphasize that all work under this project properly representsbeginnings. There is no recommendation we support with more enthusiasmthan the recommendation that our work be taken up and continued. Theaccomplishments of this project are not end results, and it would be adisappointment if they were considered final.
37

VII. BIBLIOGRAPHY
Ball, J., and Jamison, D. Computer-assisted instruction for dispersedpopulations: System cost models. Technical Report No 190, Insti-tute for Mathematical Studies in the Social Sciences, Stanford.University, September 15, 1972.
Bonvillian, J. D., and Charrow, V. R. Psycholinguistic implications ofdeafness: A review. Technical Report No. 188, Institute for Mathe-matical Studies in the Social Sciences, Stanford University, July14, 1972.
Bonvillian, J. D., Charrow, V. R., and Nelson, K. E. Psycholinguisticand educational implications of deafness. Human Development, 1973,in press.
Charrow, V. R., and Fletcher, J. D. English as the second language ofdeaf students. Technical Report No. 208, Institute for MathematicalStudies in the Social Sciences, Stanford University, July 20, 1973,
Fletcher, J. D., and Atkinson, R. C. Evaluation of the Stanford CAIprogram in initial reading. Journal of Educational Psycholoqz,1972, 63, 597-602.
Fletcher, J. D., and Beard, M. H. Computer-assisted instruction inlanguage arts for hearing-impaired students. Technical Report No215, Institute for Mathematical Studies in the Social Sciences,Stanford University, September; 1973.
Fletcher, J. D., Jamison, D. T., Searle, B. W., and Smith, R. L.Computer-assisted instruction for the deaf at Stanford University.Annual Report, U.S.O.E., Contract Nc. 0EG-0-70-4797 (607), Insti-tute for Mathematical Studies in the Social Sciences, StanfordUniversity, January 8, 1973.
Fletcher, J. D., and Stauffer, C. M. Learning language by computer.The Volta Review, 1973, 75, 302-311.
Friend, J; E. Instruct coders' manual. Technical Report. No. 172,Institute for Mathematical Studies in the Social Sciences, StanfordUniversity, May 1, 1971.
Friend, J. E. Computerassisted instruction in programming: A curriculumdescription. Technical Report No. 211, Institute for Mathematical .
Studies in the Social Sciences, Stanford University, July 31, 1973.
Friend, J. E., and Atkinson, R. C. Computerassisted instruction inprogramming: AID. Technical Report No. 164, Institute for Mathe-matical Studies in the Social Sciences, Stanford University,January 25, 1971.
38

Gentile, A., and Di Francesca, S. Academic achievement test performanceof hearing impaired students. Washington: Office of DemographfcStudies, Series D, Number 1, September, 1969.
Goldberg, A. A generalized instructional system for elementary mathe-matical logic. Technical Report No. 179, Institute for MathematicalStudies in the Social Sciences, Stanford University, October 11, 1971,
Goldberg, A., and Suppes, P. A computer-assisted instruction-program forexercises on finding axioms.' Technical Report No. 186, Institutefor Mathematical Studies in the Social Sciences, Stanford University,June 23, 1972.
Jackson, R. M. Computer-assisted instruction for deaf and hard of hearingchildren. Report to the Superintendent and the Board of Education,Palo Alto Unified School District, 25 Churctiill Avenue, Palo Alto,California, June, 1972.
Jamison, D., Fletcher, J. D., Suppes, P., and Atkinson, R. C. Cost andperformance of computer-assisted instruction for education of dis-advantaged children. In J. Fromkin and R. Radne (Eds.), Educationas an industry. New York: National Bureau of Economic Research,Columbia University Press, 1973 (in press).
Jensema, C. Useful techniques for applying latent trait mental-testtheory. Technical Report No. 202, Institute for MathematicalStudies in the Social Sciences, Stanford University, May 9, 1973. (a)
Jensema, C. A note on the reliability of Bayesian tailored testing.Journal of Educational and Psychological Measurement, 1973, in press. (b)
Lord, F. M. Some test theory for tailored testing. In W. H. Holtzman(Ed.), Computer assisted instruction, testing, and guidance. New
York: Harper & Row, 1971. (a)
Lord, F. M. Robbins-Monro procedures for tailored testing. Journal ofEducational and Psychological. Measurement, 19713 31, 3-31, (b)
Lord, F. M., and Novick, M. R. Statistical theories of mental testscores. Reading, Mass.: Addison-Wesle57797:-
Sanders, W. R., and Ball, J. R. Logic documentation standard for theInstitute for Mathematical Studies in the Social Sciences. TechnicalReportNo. 191, Institute for Mathematical Studies in the SocialSdIences, Stanford University, October 4, 1971.
Searle, Lorton, P. V., and Suppes, P. Structural variables .
affecting CAI performance on arithmetic word problems of disadvan-taged and deaf students. Technical Report No. 213, Institute forMathematical Studies in the Social Sciences, Stanford University,August, 1913.
39

Suppes, P. Some theoretical models for mathematics learning. Journal
of Research and Development in Education, 1967, 1, 5-22.
Suppes, P. Computer-assisted instruction for deaf students. American
Annals of the 1-)eaf, 1971, 116, 500-508.
Suppes, P. Facts and fantasies of education. Technical Report No. 193,Institute for Mathematical Studies in the Social Sciences, StanfordUniversity, October 18, 1972. (a)
Suppes, P. A survey of cognition in handicapped children. TechnicalReport No. 197, Institute for Mathematical Studies in the SocialSciences, Stanford University, December 29, 1972. (b)
Suppes, P., and Flannery, L. I, A comparison of deaf and normal-hearingstudents' performance in arithmetic. Institute for MathematicalStudies in the Social Sciences, Stanford University, in press.
Suppes, P., Fletcher, J. D., and Zanotti, M. Models of individual tra-jectories in computer-assisted instruction for deaf students.Technical Report No. 21i, Institute for Mathematical Studies in theSocial Sciences, Stanford University, September, 1973.
Suppes, P., Fletcher, J. D.; Zanotti, M., Lorton, P. V., and. Searle., B. W.Evaluation of computer-assisted instruction in elementary mathematicsfor hearing-impaired students. Technical Report No. 200, Institutefor Mathematical Studies in the Social Sciences, Stanford University,March 17, 1973.
Suppes, P., Goldberg, A., Kanz, G., Searle, B., and Stauffer, C. Teacher'shandbook for CAI courses. Technical Report No. 178, Institute forMathematical Studies in the SoCial Sciences, Stanford University,September 1, 1971..
Suppes, P., and Morningstar, M. Technological innovations: Computer-assisted instruction and compensatory education. In F. Korten,S.. Cook, and J. Lacey (Eds.), Pacholaa and the 2Loblems of societyWashington, D.C.: American Psychological Association,. 1970.
Suppes, P., and Morningstar, M. Compute r -- assisted. instruction at Stanford,
1966-68: Data models, and evaluation of the arithmetic programs.A:21,1 York: Academic Press, 1972.
Sup e, P., Searle, B., and Lorton, P., Jr. The strands arithmetic CAIprogram. Institute for Mathematical Studies in the Social Sciences,Stanford University, 1973, in press.
Weyer, S. A. Fingerspelling by computer. Technical Report No. 212,Institute. for Mathematical Studies in the Social Sciences, Stanford.University, August, 1973.
4o