1«4 1-f •t'AuA :1. I P J Cor I
23
:1. . f Geophyss I P J C or p or ati o n I I I I I I I I I I� ' I I I I� _ I , ' I. SEISMICITY REPORT ON THE PAHOA ·PROSPECT HAWAII COUNTY HAWAII �4 •tA MICRO GEOPHYSICS CORPORATION 607 T Seet, Golden, Co 80401 303/279-0226 � . � � r
Transcript of 1«4 1-f •t'AuA :1. I P J Cor I

:1. . f Geophysics
I P J Corporation
I I I I I
I
I
I
I
I� '
I
I
I
I�
_I, '
I.
SEISMICITY REPORT
ON THE PAHOA ·PROSPECT
HAWAII COUNTY
HAWAII
�1\1«4 1-f •t'AuA
MICRO GEOPHYSICS CORPORATION
607 Tenth Street, Golden, Co 80401 303/279-0226
� .=.. � �r
SEISMICITY REPORT ON PAHOA PROSPECT
HAW AI I COUNTY
HAWAII
ABSTRACT
For the purpose O·f evaluating the geo�hermal potential of
a prospect Southeast of Pahoa, Puna District, Hawaii, a .hi.gh
gain (50-500K) , high-frequency (5�30hz) seismic array with a
detection threshold below magnitude 0.5 was operated for thirteen
days between December 27, 1974 and January 9, 1975. Forty-two
local microearthquakes were recorded, nineteen of which were
locatable.
The majority of located events were placed seaward of the
East Rift of Kilauea Volcano near previously recorded seismic
activity. The level of seismicity .recorded here. agrees with the
seismicity reported by the Hawaiian Volcano Observatory. The
location of these events and first motion studies suggest a
seaward dipping normal fault along the East Rift. A Poisson's
ratio anomaly appears to ·be associated with the active area. The
data supports the contention that this area has a high potential
for production of geothermal steam.L

'I
I
I
I
I
I
I
I
I
I
I
I
I
I
I
I
I
\I
-I
INTRODUCTION
LOCATION MAP
AoAHU . �w r:::::::;,�AUI
HONOW
·' . . . . 0 :::.: . .
SCALE
0 100
KILOMETERS
G) 0
LONG 156W
LAT 20°N
FIGURE 1
INDEX MAP
I
PACIFIC OCEAN
;;WAll
z I
: �,._,·"' I ,,.3d ;-r-
SCALE
10 20
KILOMETERS
FIGURE 2
A geothermal prospect of approx
imately 375km2 (150 mi2) extent in the
District of Puna on the Island of
Hawaii (Figures 1 and 2) was surveyed
for microearthquakes. Microeart;hquake
activity is felt by many to be a nee-
essary but not sufficient ingredient of
a commercial geothermal occurrence
(Lange and Westphal, 1969; Hamilton and
Muffler, 1972; Ward, 1972; Hamilton,
et al 1973). The area of this survey
is part of the East Rift system of
Kilauea Volcano. Recent volcanic
eruptions have occurred within the
boundaries of the survey in 1955 and
1960 and the entire region is composed
of Quaternary volcanic flows and ash.
In a region of current vulcanism,
such as the Pahoa prospect, the existence
of a concentrated region of microearthquake
activity is evidence for the existence of
permeable channels·which provide excel-
lent targets for possible geothermal
exploitation.
The Hawaiian Volcano Observatory
(HVO) maintaips a dense network of
permanent seismograph stations as part
of their program of monitoring volcanic

I
I
I
I
I I
activity. This network records $everal
thousand events per year. They current-
ly report events generating felt reports
(approximately m>3.5) to the World Wide
Standard Seismograph network for inclus
ion in the NOAA hypocent�r data file.
(Elliott Endo, HVO, personal com:tnunica-
tion). Three hundred eighty three events
HIS'I'ORI_CAL SEISMICITY
HAWA'II
I ...
\I . • • ' •
.. .. . . .
. . �· . . �- ·'
... ��� ·. .
.:·\.... .:. .
. ·.
: . . .:. I •· "• • ••••• f. "•( • • �: �> ; -:""��;-)_. ·. :.�.�, . :·.
,.-e:·PICE N TER
. .
�
I
I
I
within 50km of the survey origin, listed 0 tO ICM
in the NOAA hypocenter data .file, are
shown on the historical seismicity map in
Figure 3. The coverage is fair for the
I period 1935 to 1960 and good from 1960 to
I present. The staff of the HVO have
regularly, since 1962, written U.S.G.S.
. ...
..
.
-----�:__RADIUS a
FIGURE 3
Professional papers titled "Hawaiian Seismic Events of 19 __ II
/ ----
I
I Epic�nter maps of earthquakes with magnitude greater than 2.0 are
given. These reports have shown approximately 10 events per year
I near the location of activity recorded in this survey. Occasional
I
I (I
I
I ·;I
swarms have also been recorded in this area. For example, five
hundred ninety six events were recorded "near Pahoa" from August 27
to September 25, 1964 (Koyanagi and Okamuri, 1966).
The object of this survey was twofold, first to verify and
improve the location of the active area reported by the HVO and
second to maintain dense station coverage with enough azimuthal
control to develop a meaningful fault plane solution. The field
work was conducted according to the following schedule:
/

Dec 27 - Field party arrived in Hilo� installed 5 stations.
Dec 28 - Installation complete1 recording begun.
Dec 29 - Client inspection of seismograph stations.
Jan 10 - Recording discontinued.
Jan 11 - Field party and equipment arrived in Golden.

INSTRUMENT RESPONSE u
� z u '-4 2:10 0 .
:z <! (.9 >-� 3 U10 9 w >
1 --'-
0.1
1d 2 u " 2 6 u10
z
<! (9 � z 5 �10 w
� _J Q_ l/)
0 Qj
· -
� -j
-,
at 96 db
. I I I I ......_ I I
v I I I 11 �1NFILTERE91( �
+ �\·. � .
+-� .. '
I =: I FILTERED HI =30hz-r-- -
LOW= 5hz I I
I I .,
VEL9C IT( RESPONSE1 I I _l_ _l I
1.0 10 100 FREQUENCY- HERTZ
lll � I i � ·
��ir--UNFILTERE
U� J
yJ2:rFILTERED Hl·30;:-I ' . LOW• 5hz-
-DISPLACEMENT
RESPONSE -
I I
1----
l I I I I
10 10 100 FREQUENCY-HERTZ
FIGURE 4
1�
3 10
107
106
105

---
INSTRUMENTATION AND OPERATIONAL SUMMARY
Eight Sprengnether Instrument Co. MEQ-800-B portable_seismic
systems were used for this survey. Each system consists of a
Mark Products model LC-4, 1-hz natural.-frequency vertical seismo-
meter, gain-stable amplifer, in,tegral timing system, and smoked
paper recording with 0. OSnun sty.lus width and 120nun/min recording
speed. The frequency characteristics of the inst�ument are
summarized in Figure 4. G.ain changes are by 6db steps from the
arbitrarily assigned level of +96db plotted in the figure. +96db
is a typical gain in the western continental United States.
Clocks were synchronized daily with WWVH . Clock drifts
between synchronizations were below expected record reading errors,
therefore no corrections were necessary. Records were read to·
+0.03 sec for P arrivals and +0.10 sec for S-P times. Amplitudes,
peak-to-peak, were read to the nearest millimeter, and durations
to the nearest 0.5 sec.
Table 1 is a detailed operating
summary for the stations whose
locations are listed on Table 2 and
which are shown on the map in
Figure 5. All stations of this
survey were by necessity placed
on recent volcanic flow material.
STATION
HAWAII
LONG 155•
LAT 19°30'.tll + ORIGIN
LOCATIONS
I N
This material provides uniform, OCEAN
but noisy sites for seismograph
stations and is the major factor
limiting gains to 50-500 thousand.
0 10
KILOMETERS
FIGURE 5
20

TABLE 1
Opera tat i ng Sc-hedule of Seismographs
DEC. I 74 I JAN. '75 2 7 J 2 8 I 29 . I 3 o I 31 I 1 1· · 2 I 3 I 4 I 5 I 6 ! 7 I --l?) 1 9 1
•
I G 59
G 59 JG120 I G 59
1 G 240
I
�
I I
G 240 I
G 240 _.,.E��-L-'------- G240
G 240 G120 G240
1 G 240 1G1_�0 1(.;240, G 120
1 G 950 G480
G 24.0 1e:.120 1 G 240
I G :20
L10
I I I I I I . I I . - I
G GAIN/1000 AT 20 HERTZ L Lm'l-CUT FILTER SETTING (l:IZ) FILTERS 5-30 HZ UNLESS NOTE))
I
I
I

I
I
I
I
I
I
I
I
I
I
I
I
I
I
I
I
I
I
I
TABLE 2
STATION LOCATIONS
St?ttion x/km :i/km z/km ·
1 18.77 +1.83 0.012
2 15.32 -0.48 0.050
3 8.36 -1.25 0.198
4 11.95 -3.42 0.134
5 15.14 -3.56 0.049
6 3.76 -9.04 0.287
7 8.23 -4.62 0.280
8 7.67 -7.44 0.122
9 8.61 +1.20 0.125
10 9.35 -2.03 0.207
11 5.52 -6.74 0.304
Coordinates of ,stations are in kilometers from 1550W, 19°30' West 1 + X is East 1 + Y is North, Z is distance above mean sea level.
I
I
I
I
I
I
I
I
I
I
I
I
I
I
I
I
I
I
I
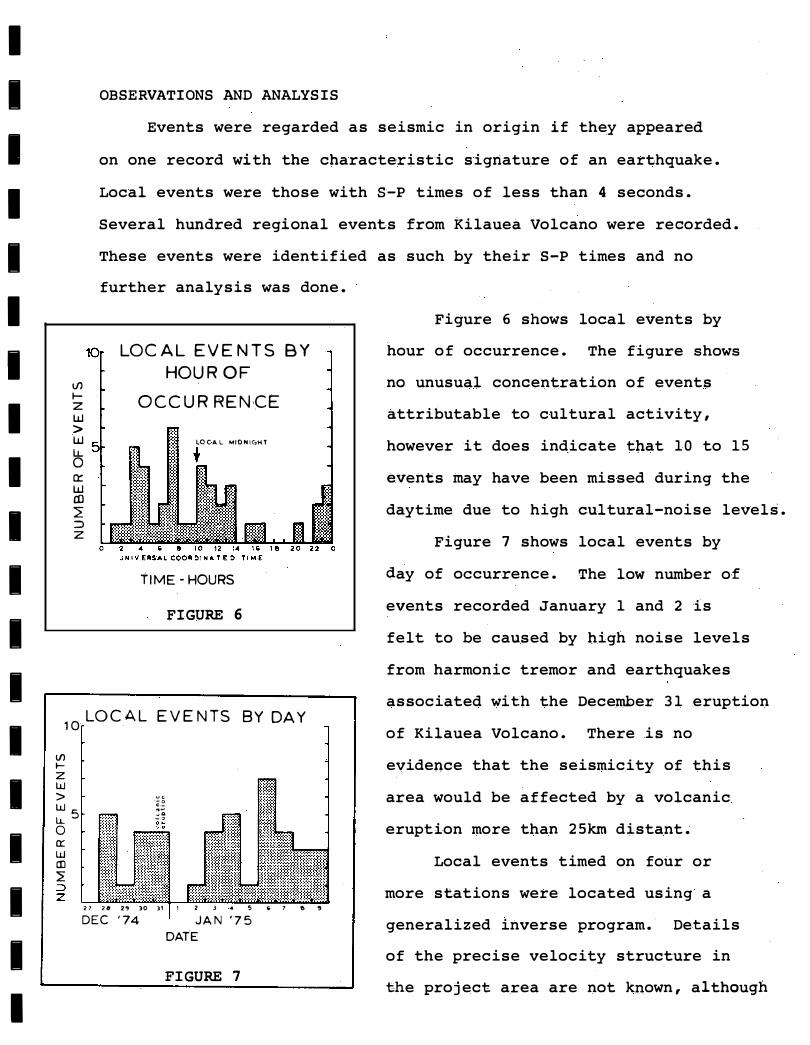
OBSERVATIONS AND ANALYSIS
Events were regarded as seismic in origin if they appeared
on one record with the characteristic signature of an earthquake.
Local events were those with S-P times of less than 4 seconds.
Several hundred regional events from Kilauea Volcano were recorded.
These events were identified as such by their S-P times arid no
lf) 1-z w > w lL 0 0::: w co L: ::) z
further analysis was done.
LOCAL EVENTS BY HOUR OF
OCCUR REN,CE
LOCAL MIONlC,HT
+
TIME- HOURS
FIGURE 6
10 LOCAL EVENTS BY DAY
l/) ....... z w > w
5 I.J.._ 0 a:: w CD 2 :::::> z
uc
C.� ��
�� o•
�!!!!i!!!i!i!!!f"·"· I �
.-;���r ·:���i�iif::::;�;�;!;�;�;�;�;�=� �::::::
27 28 2, 30 31 I , 2 3 • s • 7 s �
DEC '74 JAN '75
DATE
FIGURE 7
Figure 6 shows local events by
hour of occurrence. The figure shows
no unusual concentration of events
attributable to cultural activity,
however it does indicate that 10 to 15
events may have been missed during the
daytime due to high cultural-noise levels.
Figure 7 shows local events by
ciay of occurrence. The low number of
events recorded January 1 and 2 is
felt to be caused by high noise levels
from harmonic tremor and earthquakes
associated with the Deceit1ber 31 eruption
of Kilauea Volcano. There is no
evidence that the seismicity of this
area would be affected by a volcanic
eruption more than 25km distant.
Local events timed on fotir or
more stations were located using a
generalized inverse program. Details
of the precise velocity structure in
"bhe project area are not known, although

I
I
I
I
I
I.
I
I
I
I
I
I
I
I
I
I
I
I
I
refraction studies have been done on
the Island of Hawaii (Hill, 1969) �
Figure 8 illustrates two velocity
models based on this refraction
data. This .model is based on widely
0
2
VELOCITY MODEL THE EAST RIFT
THE ISLAND OF HAWAII ADAPTED FROM D.P. HILL
VELOCITY (KM/SEC)
I 2 4 6
I I I
MODEL
8
spaced refradtion shots and thus
__ .;;.-; I ALTERNATIVE
._ __ - ·-
does not give any indication of
small scale velocity variations
which are presumably present in
this region.
Using the �ethod of Peters and
Crosson (1972) error prediction maps
(Figure 9) were prepared in the
region S<X<lO, -lO<Y<O, at depth =
4
� �
�6 a.. w 0
8
---I
!
I I
FIGURE 8
2km, using a Skill/sec heilf space and assuming a timing error of
.030 sec and a velocity error of O.Skm/sec. These values where
chosen for computational ease and the values shown are relative.
The shape of these curves will be similar for any velocity model,
although the values will change. The actual uncertainties in the
region of the minimum are estimated to be +1 km in X and Y and + 2
km in z.
The locations of the nineteen
located events are shown in Figure
10, and Table 3. Magnitudes for the
located events were computed using
the equation: M=3.4 - log G+ log A
+ 2.4 log R, where;
G = 20 hz gain A = Maximum peak to peak trace
displacement R = hypocenter station distance
EPICENTER
ORIGIN o
EP1CENTE�
ST.TlON'
®o HAWAII
FIGURE 10
t
l

I
I (5,0)
I
I
I
I
I
I
I (5, 0)
I
I
I
I
I
I
I -
Jc··,·
I
I
I
Seismograph
jl II 10
.s
1.0
PREDICTED UNCERTAINTIES IN X
•
G •
•
•
PREDICTED UNCERTAINTIES IN Z
Error prediction Pahoa, Hawaii
coo'rdinates in km, time in seconds
FIGURE 9
0.5
1.0
PREDICTED UNC.ERTAINTIES IN Y
PREDICTED UNCERTAINTIES IN T

I
I TABLE 3
LOCATED EVENTS
I Station
I Number Date Time X y H M
1 362 0751 11.3 + 1.5 1.1 0.9
I 2 362 0752 11.9 - • 8 ' 1.1 0.4
3 363 1014 11.8 - .8 4.0 0.6
I 4 365 0624 15.2 - 3.5 3.4 1.1
I 5 365 0716 - 2.0 - 9.8 8.4 1.5
6 365 0740 11.5 - 6.2 5.2 0.8
I 7 365 1235 11.8 . - 1.5 1.0 - 0.1
8 003 724 1.4 - 6.5 4.5 0.8
I 9 003 1118 6.6 - 3.7 1.0 - 0.2
I 10 004 1355 13.8 - 1.5 1.3 - 0.3
11 004 2328 9.4 - 4.6 2.1 0.0
I 12 006 0331 3.1 - 8.7 5.2 1.5
13 006 0448 11.4 - 1. 5 1.0 0.3
I 14 006 0810 10.4 - 4.0 1.7 0.7
I 15 006 0937 11.9 - 6.5 , 7.3 0.8
16 006 1124 12.2 - 3.0 1.9 0.4
I 17 007 0340 10.2 - 4.9 .9 0.3
18 007 0422 19.4 2.6 1.0 1.4
I 19 007 1339 9.2 - 5.3 1.0 0.4
I Coordinates are in kilometers from 155°W, 19°301 North,
I + X is East, + Y is North, H is the depth below mean sea level. Time is UTC; date is Julian day.
I
I

I
I
I 20
I Ul10 � 9 w > 6 w
II � 4 Ill 2 2
II �
I I I
I
I
RECURRENCE CURVE
I 2's PER YEAR --T�----05 0.0 OS 1.0 1.5 20
MAGNITUDE
FIGURE 11
I FIRST
MOTION N
I
I
I
I
I I
I
0
----
0 0
0
•
• 0
d'. •
o Dilitation
• Compression
FIGURE 12
o.
Tbe magnitude was computed for all
arrivals and the average for each
event is reported in Table 3. A
cumulative recurrence curve for these
events is shown in Figure 11.
Figure 12 is a tipper-.hemisphere
composite fault plane solution. Sucb
a plot can be used to establish the
fault mechanism, the probable fault
plane, and the regional stress pattern
in the area. The first motion areas
are reasonably well separated by two
planes each with an East-West strike
and dips of 30° South and 60° North.
Many of tbe events recorded in this
survey showed very high S move-outs.
Figure 13 is the day, 006, 0331 UTC
e�ent illustrating this effect.
Note that there is another event
at 03.36 which is especially prominent
on record 4. When P times were plotted
against S-P times (a Wadati diagram)
these events did not form a straight
line (Figure 14). Model calculations
indicate that the most straight for-
ward means of explaining this data
is by a lateral variation in the body
wave velocity ratio. To check this
hypothesis, S-P times were plotted

MICROEARTOUAKE 03h 3f'DAY006UTC
STATION GAIN
6
I I 8 / 1��g�Jii:C�\i�--
I
I
I
I
I
I
I
I
I
I
I
I
I
I
I
I
I
I
I
9 78db /487,000
7 72db /243,000 .
1 0 7 2db
4
/243, 000
7 2db /243,000
,...... .:.:-::::._ , .... ,11 . .
1 1 ...... --- ..
. �- ·iii:;; .. ,:";�_;;;_ .. :.:.,;;._. .. .,. _ _ II. 66db / .. � ...
I 122 000 - :_ - · -., �g;;hh J If.t!t·-' . • 'flfi"f -�---.-.:·,·t�.A .. �- ;..,...,.
FIGURE 13

I
I
I
I
I
I
I
I
I
I
I
I
I
I
I
I
I
I.
I
versus P times and the Wadati slope
taken from the line between the origin
time and data point for the individual
station. Two assumptions are,required
to justify this procedure: (1) that
the computer generated origin time is
accurate and, (2) the Poi$son's ratio
for the entire hypocenter-to-sta�ion
path is constant. While neither of
these assumptions are perfectly valid,
WADATI DIAGRAM
\5+----+--
� 10'+-----w � 1-a.
I
(/)
1.0 15 P ARRIVAL TlME
(SEC)
FIGURE 14
20
it is felt that useful information may be developed from this technique.
The Poisson's ratios were plotted along the epicenter�to-station
rays and the resulting map was subjectively contoured as shown in
Figure 15. This figure shows a closed Poisson's ratio high approx-
POISSONS RATIO
� 35
" � .30 " ea
• 7
.9
"'--.21
.40
POISSON'S RATIO CONTOURS
FIGURE 15
Seismograph e2
..
t t
..._
0 ./fKM
«""�"'
<;__'?-� cF

imately surrounding.the active area. The uncertainty in each
determination is estimated to be about +0.05, bu� an area of
values clearly below 0.30 surrounds the closed high which
contained values as high as 0.44.

INTERPRETATION
The located events of this survey concentrate primarily
along and to the south of the Kilauea East Rift. Figure 16 shows
the epicenters and Poisson's ratio anomaly superimposed on the
topography. The composite fault plane solution is definitely
that of a normal fault and can not be inteq�reted as a thrust
or strike slip fault.
The hypocentral depth cont�ol is not precise enough to
predict a fault plane, but a clear trend of greater depth to
the south is present. Based on the observed hypocentral distrib
ution, tbe southward dipping plane is determined as the fault
plane. It is also very difficult to envision a normal fault
located to the south of the rift system dipping into the island.
The interpretation of a seaward dipping normal fault is there
fore given with considerable confidence.
Due to the strong velocity contrasts present in this area,
the uncertainty in the orientation of the fault plane is approx
imately 20°. 'Based -on the- sharp easte-rn-bounda-ry of. -the epicenters.
it was anticipated· that a transverse strike slip fault might ex-ist
along the_ epicentral, boundary • cNo events were found whose .first
·motions cou-ld be interpreted as =agreeing with such a mechanism
and ·no adequate explanation has ·been found- for the- lack o.f:
seismici-ty along the eastern tip of the rift.
Interpretation of the Poisson's ratio high reported in this
survey is more speculative. Given the assumptions stated above,
a clear anomaly in velocity r(itio is present in this area. The
simplest explanation is that of a change in rock type, but no
subsurface geological information is present to confirm or deny

t'lj H (j) c::::
m ....... "'
aoo'
�35 ;t ,0;:�00 �30�¥· :�-� · 6 · 5r,� so 700 I
� . i
.9
�
�· - �
o o� -�� ��----
:fr 200�NTOUR I·NTER .
100 VAL=100'
(
- -
t �
- -
k(()
opicenter
1KM
�'f"-� cP <(��-0
- - -

this interpretation. It should be noted that 1:0e<:ks of high,
Po.ts·son's ratio. tend to ha:ve less. strength and to .have higher
attenuation than rocks with low Poisson's ratio.
Another interpretation is based on observations that large
scale fracturing of rock can increase the Poisson's ratio by 0.1
(Kumamoto, 1972; O'Connell, 1974). If the rock throughout this area
is relatively homogeneous and if a source of heat is present in the
area, an area of increased fracturing on a large scale, as defined by
this anomaly, would be a favorable target for geothermal exploitation.
It is interesting to note that.the present tendency in earth
quake prediction measurements is to look for time-dependent, low
(down to 0.1) Poisson's ratio anomalies. There was no evidence
that this anomaly was time variant during the course of this survey.
In terms of the diffusion model presently accepted in the United
States, the Poisson's ratio low corresponds to an opening of micro
fractures which are dry. As these fractures fill with fluid, the
Poisson's ratio increases, often to a value above its long-term
average, just before failure. Thus fluid filled fractures may have
a Poisson's ratio higher than the value expected for the undisturbed
rock, but this interpretation is dependent on acceptance of the
diffusion earthquake prediction model. A body of evidence does
exist (Walsh, Coombs, 1975) that indicates that vapor filled cracks
would cause a low Poisson • s ratio. Th_l::s_!�
_ig�
-�.9-
��-�on
_�_::�ti�
-�ay
be evidence.against the existence of steam-filled fissures at de:eth.
In s\immary, a velocity ratio anomaly is present in the area
outlineq in Figure 15 and a·possible interpretation of this anomaly
is that it is due to fluid filled fractures. If a source of heat is
present, such an area is a favorable target for geothermal exploration.

..
CONCLUSIONS
1. The seismicity recorded by this survey is at g. high
level (2-4· magnitude zero events per day) and is consistent with
the historical �eismicity recorded in this area for over 10 years.
2. The events detected have a common gravity mechanism �nd
a similar geographic expression (East-West strike, probably 30--40°
South dip).
3. The high level of seismicity indicates that extensive
fracturing of the rock has taken place in this area and that good
permeability is probably developed along the fault systems. If
the existence of a heat source can be established by other geo
physical methods, the area has a good potential for the production
of commercial earth steam.
RECOMMENDATIONS
1. The existence of an adequate heat source in the area is
necessary before an extensive drilling program is undertaken.
Other. geophysical methods, such as electrical resistivity, should
be applied to confirm or deny the presence of a heat source, and
thereby confirm or deny the existence of a drillable target.
2. A program of monitoring of the earthquake risk engendered
by the injection or wi.thdrawal of fluids is necessary i:f a geo
thermal field is established. Such a risk evaluation program
should be appended to the program evaluating the risk of damage
to geothermal wells and power plants by the frequent lava flows
across the area •
_I
I
I
I
I
I
I
I
I
I
I
I
I
I
I
.I
...
I
I
I
REFERENCES
Brune, J.N., Allen, C.R., 1967, Microearthquake: Survey of the San .Andreas Fault System in Southern California, B.S.S.A., vol.57, no.2,.pp.277�296.
Coffman, J., C.A. vonHake, 1973, Earthquake History of the u.s. ,
u. S. Department of Commerce, NOAA, Environment data service.
Hamilton, R.M., L.J.P. Muffler, 1972, Microearthquakes: Geysers Geothermal Area, Califo:t:nia, Journal of Geophysical Research, Vol.77, no.ll, pp.2081-2086.
Hill, D.P., 1969; Crustal Structure of the Island of Hawaii from Seismic-Refraction Measurements, BSSA, v.59, no.l, pp.lOl-130.
Kinoshita, W.T.,· 1963, Earthquake and Deformation in the Koae Fault Zone, Kilauea Volcano, Hawaii, USGS Prof. Paper, 575-C, pp.Cl73-176.
Kisslinger, C. arid Engdahl, E.R., 1973, The Interpretation of the Wadati Diagram with Relaxed Assumptions, BSSA, vol.63, no.5, pp.l723"-1736.
----,1974, Semyenov Prediction, Test of the Semyenov Prediction Technique in the Central Aleutian Islands, Tectonophysics, vol.23, pp.237-246.
Koyanagi, R.Y., 1964, Hawaiian seismic events during 1962, in Geological Survey Research. 1964; U.s. Geol. Survey Prof. Paper 475-D, p.D�l2-Dll7.
_ _: __ , 1968, Hawaiian seismic events during 1965, in Geolog.ical Survey Research 1968; U.S. Geol. Survey Prof. Paper 600-B, p.B95-B98.
----,1969a, Hawaiian seismic events during 1967, in Geological Survey Research 1969; u.s. Geol. Survey Prof. Paper 650-B, p.Bll3-Bll6.
----,1969b, Hawaiian seismic events during 1967, in Geological Survey Research 1969; u.s. Geol. Survey Prof. Paper 650-C, p.C79-C82.
----,1969c, Hawaiian seismic events during 1968, in Geological Survey Research 1969; u.s. Geol. Survey Prof. Paper 650-D, p.Dl68-Dl7L
Koyanagi, R.Y., and Endo, E.T., 1965, Hawaiian seismic events during 1963, in Geological Survey Research 1965; u.s. Geol. Survey Prof. Paper 525-B, p.Bl3-Bl6.
----,1971, Hawaiian Seismic events during 1969, USGS Prof. Paper 750�C, pp.Cl58-Cl64.
Koyanagi, R.Y., and Okamura, A.T., 1966, Hawaiian seismic events during 1964, in Geological Survey Research �966; U.s.· Geol. Survey Prof. Paper 550-C, p.Cl29-Cl32.

..
I
I
I
I
I
I
I
I
I
I
I
I
I
I
I
I
I
I
I
Koyanagi, R.Y., Swanson, D.A., and Endo, E.T., 1972, Distribution of Earthquakes related to Mobility of the Soutb Flank of Kilauea Volcano, Hawaii, USGS �ref. Paper, 800-D, pp.D89-D97.
Kumamoto, L.H., 1973, Redundant Strain Observations in Southern. Nevada: Strain Steps from the Handely Nuclear test, unpublished MSC Thesis #Tl457, Colorado School of Mines, Golden, Colorado.
Lange, A.L., et.nd Westphal, W.H., 1969, Microearthquakes near the Geysers, Sonoma County, California, JGR, vol.74, pp.4377.
Malahoff, A. and McCoy, 1967, The Geologic Structure .of the Puna Submarine Ridge, Hawaii, JGR, vo1.72, no.2, pp.541-548.
O'Connell, R.J., and Budiansky, B., 1974, Seismic Velocities of Dry and Saturated Cracked Rocks and Precursory Velocity Changes, Ees, 1974.
Peters, D.C. and Crosson, R.S., 1973, Application of Prediction Analysis to Hypocenter Determination using a local array, BSSA, v.62, no.3, pp.775-788.
Sanford, A.R., and Singh, s., 1968, Microearthquake Activity, Minimum Reco.rding Time for Determining Short-term Seismicity Forms, BSSA, vol.SB, no.2, pp.639-644.
Ward, P.L., Microearthquakes: Prospecting Tool and Possible Hazard in the Development of Geothermal Resources, Geothermics, vol.l, no.l, pp.3-12 (1972).
Ward, P.L., and Bjornson, s., 1971, Microearthquakes, Swarms and Geothermal Areas of Iceland, Journal of Geophysical Resources, vol.76, no.l7, pp.3953-3982.
Ward, P.L. and Jacob, K.H., 1971, Microearthquakes: In the ·
Anuachapan Geothermal Field, El Salvador, Central America, Science, vol.l73, pp.328-330.
Ward, P.L. and Gregersen, 1973, Comparison of Earthquake Locations determined with data from a network of stations and small tripartite arrays on Kilauea Volcano, Hawaii, BSSA, vol.63, no.3, pp.679-711.