
13790 NW 4 Street, Suite 105 Sunrise, Florida 33325 ... · CITY OF SUNRISE, FLORIDA POLICE...
69
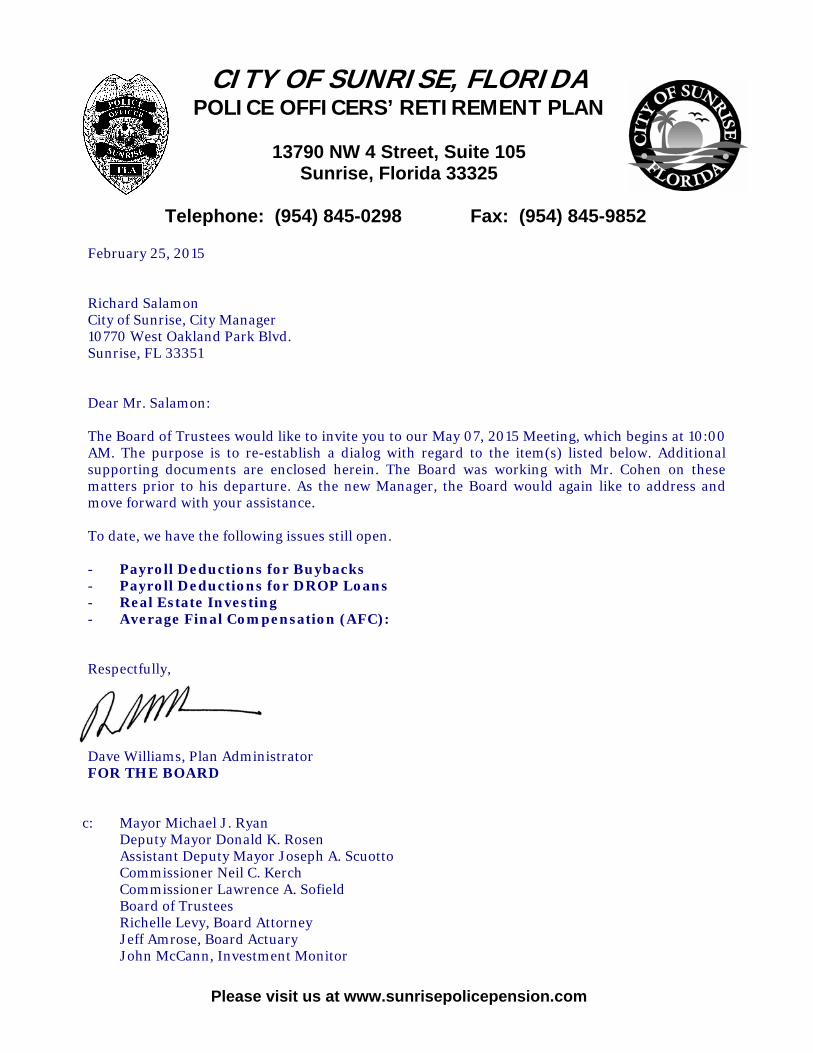
CITY OF SUNRISE, FLORIDA POLICE OFFICERS’ RETIREMENT PLAN 13790 NW 4 Street, Suite 105 Sunrise, Florida 33325 Telephone: (954) 845-0298 Fax: (954) 845-9852 Please visit us at www.sunrisepolicepension.com February 25, 2015 Richard Salamon City of Sunrise, City Manager 10770 West Oakland Park Blvd. Sunrise, FL 33351 Dear Mr. Salamon: The Board of Trustees would like to invite you to our May 07, 2015 Meeting, which begins at 10:00 AM. The purpose is to re-establish a dialog with regard to the item(s) listed below. Additional supporting documents are enclosed herein. The Board was working with Mr. Cohen on these matters prior to his departure. As the new Manager, the Board would again like to address and move forward with your assistance. To date, we have the following issues still open. - Payroll Deductions for Buybacks - Payroll Deductions for DROP Loans - Real Estate Investing - Average Final Compensation (AFC): Respectfully, Dave Williams, Plan Administrator FOR THE BOARD c: Mayor Michael J. Ryan Deputy Mayor Donald K. Rosen Assistant Deputy Mayor Joseph A. Scuotto Commissioner Neil C. Kerch Commissioner Lawrence A. Sofield Board of Trustees Richelle Levy, Board Attorney Jeff Amrose, Board Actuary John McCann, Investment Monitor
Transcript of 13790 NW 4 Street, Suite 105 Sunrise, Florida 33325 ... · CITY OF SUNRISE, FLORIDA POLICE...
CITY OF SUNRISE, FLORIDA
POLICE OFFICERS’ RETIREMENT PLAN
13790 NW 4 Street, Suite 105 Sunrise, Florida 33325
Telephone: (954) 845-0298 Fax: (954) 845-9852
Please visit us at www.sunrisepolicepension.com
February 25, 2015 Richard Salamon City of Sunrise, City Manager 10770 West Oakland Park Blvd. Sunrise, FL 33351 Dear Mr. Salamon: The Board of Trustees would like to invite you to our May 07, 2015 Meeting, which begins at 10:00 AM. The purpose is to re-establish a dialog with regard to the item(s) listed below. Additional supporting documents are enclosed herein. The Board was working with Mr. Cohen on these matters prior to his departure. As the new Manager, the Board would again like to address and move forward with your assistance. To date, we have the following issues still open. - Payroll Deductions for Buybacks - Payroll Deductions for DROP Loans - Real Estate Investing - Average Final Compensation (AFC): Respectfully,
Dave Williams, Plan Administrator FOR THE BOARD
c: Mayor Michael J. Ryan
Deputy Mayor Donald K. Rosen Assistant Deputy Mayor Joseph A. Scuotto Commissioner Neil C. Kerch Commissioner Lawrence A. Sofield Board of Trustees
Richelle Levy, Board Attorney Jeff Amrose, Board Actuary John McCann, Investment Monitor
W Wijistlr .Assrt Q!nusultiugW
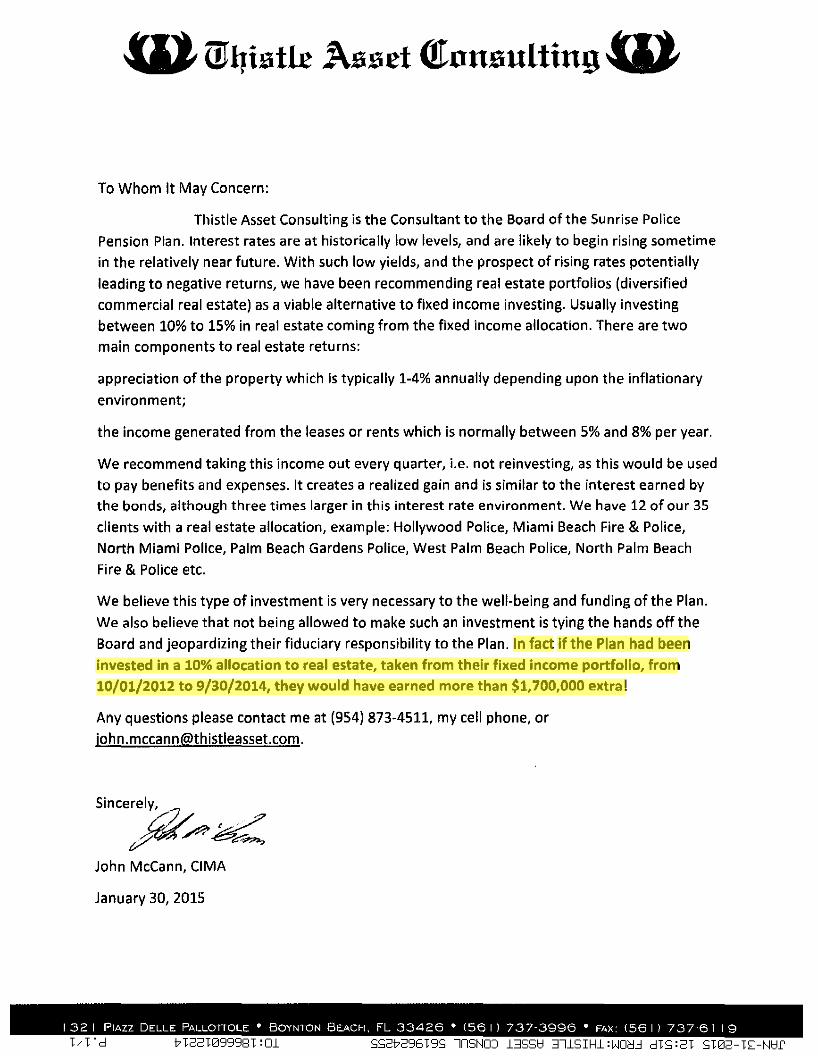
To Whom It May Concern:
Thistle Asset Consulting is the Consultant to the Board of the Sunrise Police
Pension Plan. Interest rates are at historically low levels, and are likely to begin rising sometime
in the relatively near future. With such low yields, and the prospect of rising rates potentially
leading to negative returns, we have been recommending real estate portfolios (diversified
commercial real estate) as a viable alternative to fixed income investing. Usually investing
between 10% to 15% in real estate coming from the fixed income allocation. There are two
main components to real estate returns:
appreciation of the property which is typically 1-4% annually depending upon the inflationary
environment;
the income generated from the leases or rents which is normally between 5% and 8% per year.
We recommend taking this income out every quarter, i.e. not reinvesting, as this would be used
to pay benefits and expenses. It creates a realized gain and is similar to the interest earned bythe bonds, although three times larger in this interest rate environment. We have 12 of our 35
clients with a real estate allocation, example: Hollywood Police, Miami Beach Fire &Police,
North Miami Police, Palm Beach Gardens Police, West Palm Beach Police, North Palm Beach
Fire & Police etc.
We believe this type of investment is very necessary to the well-being and funding of the Plan.
We also believe that not being allowed to make such an investment is tying the hands off the
Board and jeopardizing their fiduciary responsibility to the Plan. In fact if the Plan had been
invested in a 10% allocation to real estate, taken from their fixed income portfolio, from
10/01/2012 to 9/30/2014, they would have earned more than $1,700,000 extra!
Any questions please contact me at (954) 873-4511, my cell phone, or
Sincerely,
~/*~John McCann, CIMA
January 30, 2015
1321 PIAZZ DELLE PALLOTTOLE • BOYNTON BEACH, FL 33426 • (561) 737-3996 • FAX (561) 737-61 19Td'd bT221099981 :01 SS2b295T9S lnSNOJ 13SS~ 3l1SIH1:WOd~ dTS:2T ST02-T[-N~r
davew
Highlight
davew
Highlight
davew
Highlight

CITY OF SUNRISE, FLORIDA
POLICE OFFICERS’ RETIREMENT PLAN
13790 NW 4 Street, Suite 105 Sunrise, Florida 33325
Telephone: (954) 845-0298 Fax: (954) 845-9852
Please visit us at www.sunrisepolicepension.com
October 16, 2013 Alan Cohen City of Sunrise, City Manager 10770 West Oakland Park Blvd Sunrise, FL 33351 Dear Mr. Cohen: The Board of Trustees would like to take this opportunity to invite you to a City of Sunrise Police Officers’ Retirement Plan Meeting on November 7, 2013 (10:00 AM). An alternative date would be January 9, 2014, at the same time. First and foremost, the purpose of the invitation is to introduce you to the Board and their representatives. Secondly, there are several outstanding issues that the Board would like to address and resolve. To help you better understand the situation, I have enclosed back-up material for your review. The issues are as follows: Payroll Deductions for Buybacks: The pension ordinance permits members to buy time in the system, but does not consider the mechanism to allow a member to pay for the buyback over time. This has limited the members to lump sum payments only. As such it has not been widely used. The Board asked the city to do payroll deductions so that a member could pay over time instead of one lump sum. It is felt that accepting payments over time would increase participation in this program. City representatives declined to participate. Payroll Deductions for DROP Loans: The Board was approached concerning DROP Loans. The Board learned that loans were permitted and would be a benefit to the members participating in the DROP. The loans would be similar to 457 deferred compensation loans currently available to members who have 457 accounts. The only mechanism missing was the repayment of the loan. The Board felt that a payroll deduction would be the best method and would ensure timely & seamless repayment. The Board communicated that request to city representatives and we were told the city was not inclined to participate. Real Estate Investing: The Board through its advisors has determined that real estate is a viable compliment to our bond portfolio. The Board would like to pursue real estate, but it is prohibited by ordinance. Having the ability to seek other alternatives would allow the Board to apply the prudent investor rule and fulfill its fiduciary responsibilities.

Page Two Alan Cohen October 16, 2013 Average Final Compensation (AFC): The finance department has always accepted the responsibility to complete the AFC’s for members who are retiring or entering the DROP. In 2012 the Board learned that the city was using a different definition than what the ordinance said for the police plan. That has reportedly been resolved, but the Board learned that the finance department still in part manually calculates the AFC. Additionally, there is a question about how pay is factored. For example should pay be counted when it was paid or when it was earned? The finance department backs out time in the AFC if the time was earned prior to or after the average period. According to the Board Actuary, manually backing out this time could possibly negate the AFC itself. Another issue is the 300 hour overtime contribution. Is it based on the first 300 hours per calendar year, fiscal year or a continuous year like the AFC is factored? On behalf of the Board of Trustees, I look forward to your response. If you wish to meet prior to the meeting(s) cited, kindly let me know. I could also arrange for our Board Actuary and Investment Monitor to attend as well. Thank you in advance for your time and attention in this matter of mutual concern. Respectfully,
Michael West, Chairman FOR THE BOARD
c: Board of Trustees Ron Cohen, Board Attorney Jeff Amrose, Board Actuary John McCann, Investment Monitor Dave Williams, Plan Administrator

Payroll Deductions for Buybacks

CITY OF SUNRISE, FLORIDA
POLICE OFFICERS’ RETIREMENT PLAN
13790 NW 4 Street, Suite 105 Sunrise, Florida 33325
Telephone: (954) 845-0298 Fax: (954) 845-9852
Please visit us at www.sunrisepolicepension.com
March 4, 2013 Sent via E-Mail Mayor Michael J. Ryan Deputy Mayor Joseph A. Scuotto City Commission Office City Commission Office 10770 West Oakland Park Blvd. 10770 West Oakland Park Blvd. Sunrise, FL 33351 Sunrise, FL 33351 Assistant Deputy Mayor Lawrence A. Sofield Commissioner Donald K. Rosen City Commission Office City Commission Office 10770 West Oakland Park Blvd. 10770 West Oakland Park Blvd. Sunrise, FL 33351 Sunrise, FL 33351 Dear Honorable Mayor & Commissioners: I am writing on behalf of the Board of Trustees, City of Sunrise Police Officers’ Retirement Plan. The purpose of this communication is to bring to your attention the Board’s standing request to allow Members of the Plan the ability to purchase prior service through payroll deductions. Our prior request of January 3, 2013, resulted in a one line negative response from Ms. Kisslan. The Ordinance (and State Law) currently permits Members of the Plan the ability to purchase prior police and/or military credit. All of the costs for the service credit is paid for by the Member. However, the only mechanism in place today is to purchase the service by paying in one lump sum. There has only been one member that I recall that was able to do that. So in short, we have a benefit in place that is financially prohibitive. Many cities throughout the State of Florida allow for payroll deductions. Essentially, this would allow Members the ability to payoff the cost of the service purchase over time and at full actuarial cost. I attached the initial request and response for your review. Further I have also attached a letter from the Union endorsing this effort. In closing, The Board of Trustees would like to thank you in advance for your sincere consideration in this matter. Respectfully,
David M. Williams, Plan Administrator FOR THE BOARD
c: Board of Trustees


Payroll Deductions for DROP Loans


Real Estate Investing
RONALD J. COHEN, P.A. --·----------------------RECEIVEDATTORNEYS AND COUNSELORS AT LAW
October 10, 2012 OCT 15 21]12
Sunrise Police Retirement Plan
Kimberly Kisslan Office of the City Attorney 10770 West Oakland Park Boulevard Sunrise, FL 33351
Re: City of Sunrise Police Retirement Plan
Dear Ms. Kisslan:
We represent the City of Sumise Police Retirement Plan. The Board of Trustees for this plan devote much of their time and energy on investments of the plan assets. They have engaged fund professionals in the form of investment managers and an investment consultant who makes recommendations as to the types of investments and managers. It has been recommended to the Board of Trustees by the Plan's independent investment consultant, Thistle Asset Management, that the Plan invest in real estate. I am enclosing a letter from John McCann of Thistle Asset Management explaining the basis for this recommendation. Currently, the ordinance does not allow for investment in real estate and would need to be amended to all for such. I have enclosed a proposed ordinance amendment for your consideration. Please feel free to contact me to discuss further.
~~ Richelle Levy
cc: David Williams, Plan Adminstrator P:\Documents\2009\09-047\Correspondence\real estate investments Itrto Kislan.dOCX
Andrew Jackson Building • 8100 Oak Lane, Suite 403 • Miami Lakes, Florida 33016 Dade 305.823.1212 • Broward 954.922.1446 • Facsimile 305.823.7778
www.roncohenlaw.com
:.~-
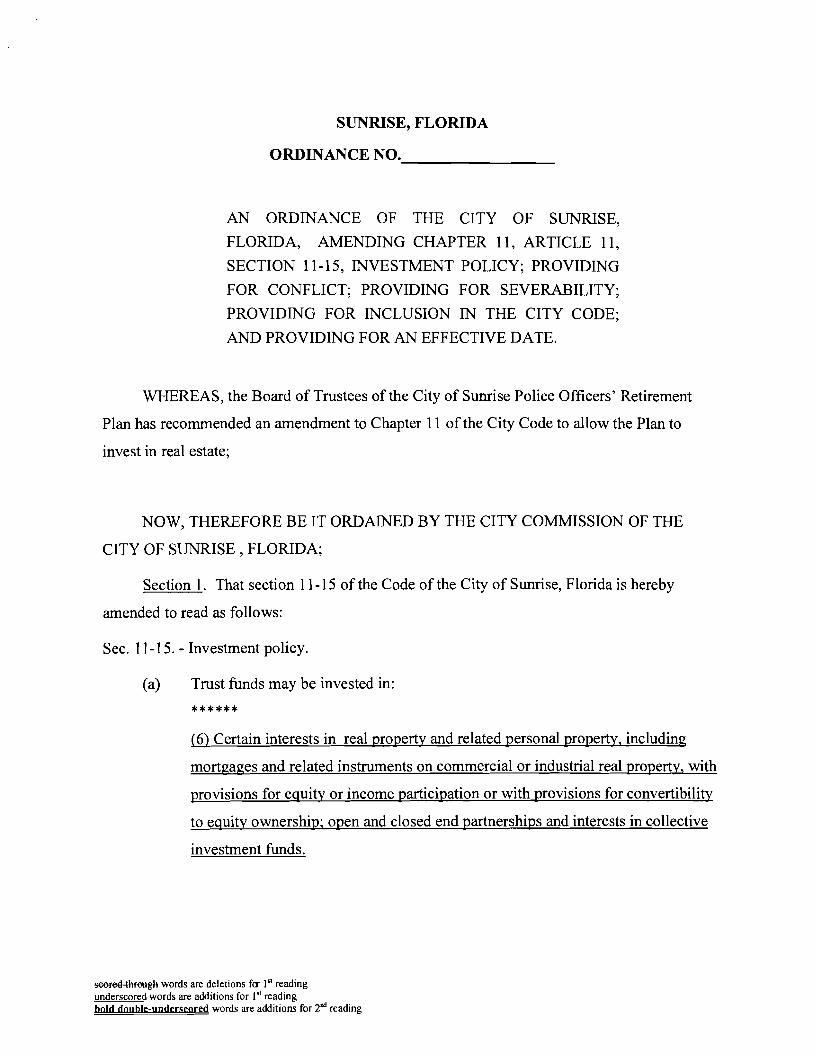
SUNRISE, FLORIDA
ORDINANCE NO. _
AN ORDINANCE OF THE CITY OF SUNRISE,
FLORIDA, AMENDING CHAPTER 11, ARTICLE 11,
SECTION 11-15, INVESTMENT POLICY; PROVIDING
FOR CONFLICT; PROVIDING FOR SEVERABILITY;
PROVIDING FOR INCLUSION IN THE CITY CODE;
AND PROVIDING FOR AN EFFECTIVE DATE.
WHEREAS, the Board of Trustees of the City of Sunrise Police Officers' Retirement
Plan has recommended an amendment to Chapter 11 of the City Code to allow the Plan to
invest in real estate;
NOW, THEREFORE BE IT ORDAINED BY THE CITY COMMISSION OF THE
CITY OF SUNRISE, FLORIDA;
Section 1. That section 11-15 of the Code of the City of Sunrise, Florida is hereby
amended to read as follows:
Sec. 11-15. - Investment policy.
(a) Trust funds may be invested in:
****** (6) Certain interests in real property and related personal property, including
mortgages and related instruments on commercial or industrial real property, with
provisions for equity or income participation or with provisions for convertibility
to equity ownership; open and closed end partnerships and interests in collective
investment funds.
56sfeEl t1uoogh words are deletions fer 1st reading underscored words are additions for 1" reading bold double-underscored words are additions for 2nd reading

Section 2. Conflict. All ordinances or parts of ordinances, all City Code Sections or
parts of City Code Sections, and all resolutions or parts of resolutions in conflict with this
ordinance are hereby repealed to the extent of such conflict.
Section 3. Severability. Should any provision of this Ordinance be declared by a court of
competent jurisdiction to be invalid, the same shall not affect the validity of the Ordinance as a
whole, nor any part thereof, other than the part declared to be invalid.
Section 4. Inclusion in the City Code. It is the intention ofthe City Commission, and it is
hereby ordained that the provisions of this Ordinance shall become and be made a part of the
Code of the City of Sunrise, Florida.
Section 5. Effective Date. This Ordinance shall be effective immediately upon its passage.
PASSED AND ADOPTED upon this first reading the _ Day of , 2012.
PASSED AND ADOPTED upon this second reading the _ Day of _
2012.
seared thFellghwords are deletions fcr 151 reading underscored words are additions for I" reading bold double-underscored words are additions for 2nd reading
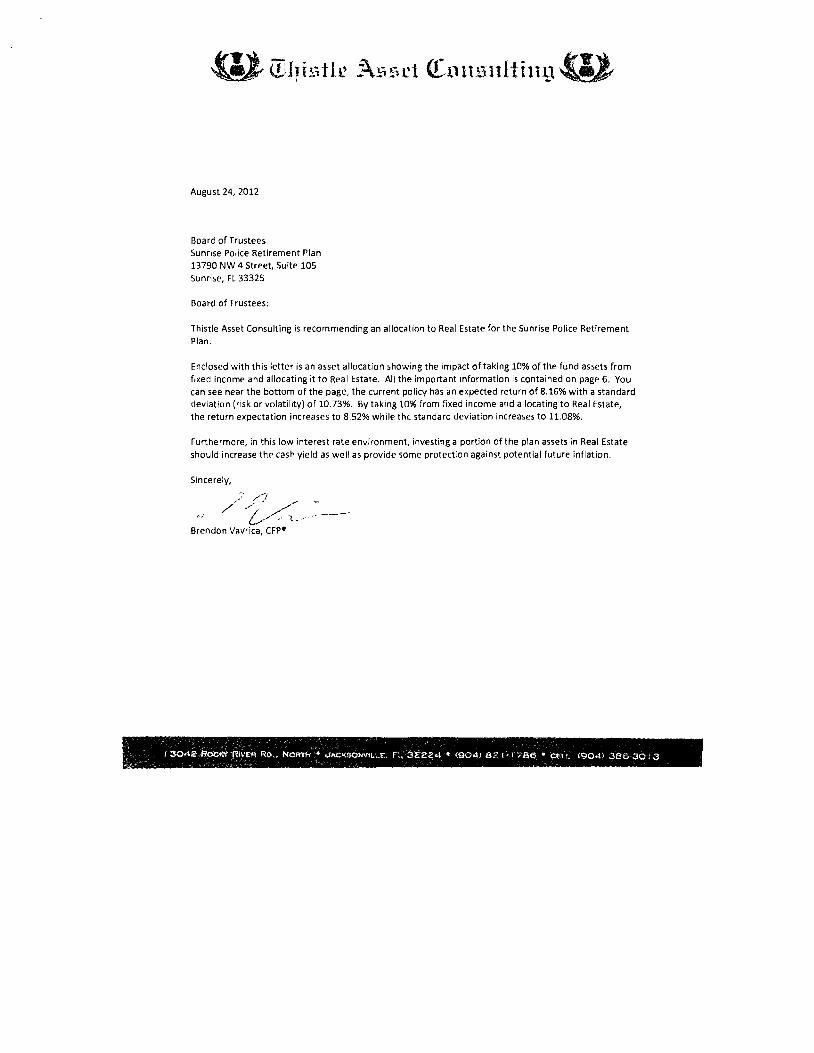
August 24, 2012
Board of Trustees Sunrise Police Retirement Plan 13790 NW 4 Street, Suite 105 Sunrise, FL 33325
Board of Trustees:
Thistle Asset Consulting is recommending an allocation to Real Estate for the Sunrise Police Retirement Plan.
Enclosed with this letter is an asset allocation showing the impact of taking 10% of the fund assets from fixed income and allocating it to Real Estate. All the important information is contained on page 6. You can see near the bottom of the page, the current policy has an expected return of 8.16% with a standard deviation (risk or volatility) of 10.73%. By taking 10% from fixed income and allocating to Real Estate, the return expectation increases to 8.52% while the standard deviation increases to 11.08%.
Furthermore, in this low interest rate environment, investing a portion ofthe plan assets in Real Estate should increase the cash yield as well as provide some protection against potential future inflation.
Sincerely,
., /3042 RocK'('RIIlt"1'l Ro.. NORTH' <.J..cI<,SONVILL'E:. n. 3ZeZ4 • (904) 82,-,786 • C€I..L (904) ~e6'30 13. < ••
i
Asset Allocation Analysis
i
Asset Allocation Analysis for
Sunrise Police by
Thistle Asset Consulting

Asset Allocation Analysis
Scenario Assumptions August 24, 2012 Sunrise Police
BV Scenario
Asset Class Proxy Cash Equivalents Inter-Term Govt Bond Municipal Bonds Corporate Bonds High Yield Bonds Large Value Stocks Large Growth Stocks Small Value Stocks Small Growth Stocks Mid Cap Stocks Real Estate Venture Capital International Stocks International Bonds Emerging Equities Inflation
FED 3-Mo T-Bill (S) CITI Treas/Agy I-lOy BarCap MunicipaIBond BarCap Credit Bond BarCap High Yield RUSS 1000 Value RUSS 1000 Growth RUSS 2000 Value RUSS 2000 Growth RUSS MidCap Index Wilshire RESI CAMB US Venture Cap MSCI EAFE Index-$ CITI World Bnd-AII $ MSCI Emerg Free-$
Return 2.10% 4.40 3.75 6.00 7.00
10.00 9.75
10.50 10.95 10.25 8.75 8.50
10.25 4.00
12.50 2.50
Risk 1.75% 6.00 7.75 8.00
12.00 16.00 19.00 19.75 23.75 19.00 8.25
35.00 20.25 13.00 40.50
Yield 2.10% 4.40 3.75 6.00 9.10 2.20 1.55 2.15 1.50 1.90 6.65 0.00 1.70 4.00 0.75
1

Asset Allocation Analysis
Scenario Assumptions August 24, 2012 Sunrise Police
BV Scenario Return
14 I I
Emerging Equities.12
Small Value Stock~International Stocks o Small Growth Stocks
10 Large Value Stocks. I" Real Estate. Mid Cap Stockl \Large Growth Stocks
• Venture Capital 8
High Yield Bonds •
6 • Corporate Bondsrr> Govt Bond
4 ~ • International Bonds
Municipal Bonds
2 • Cash Equivalents
o Iii I Iii I i II I I I I I I I
o 5 10 15 20 25 30 35 40 45
Risk (Std Deviation)
2
Asset Allocation Analysis I
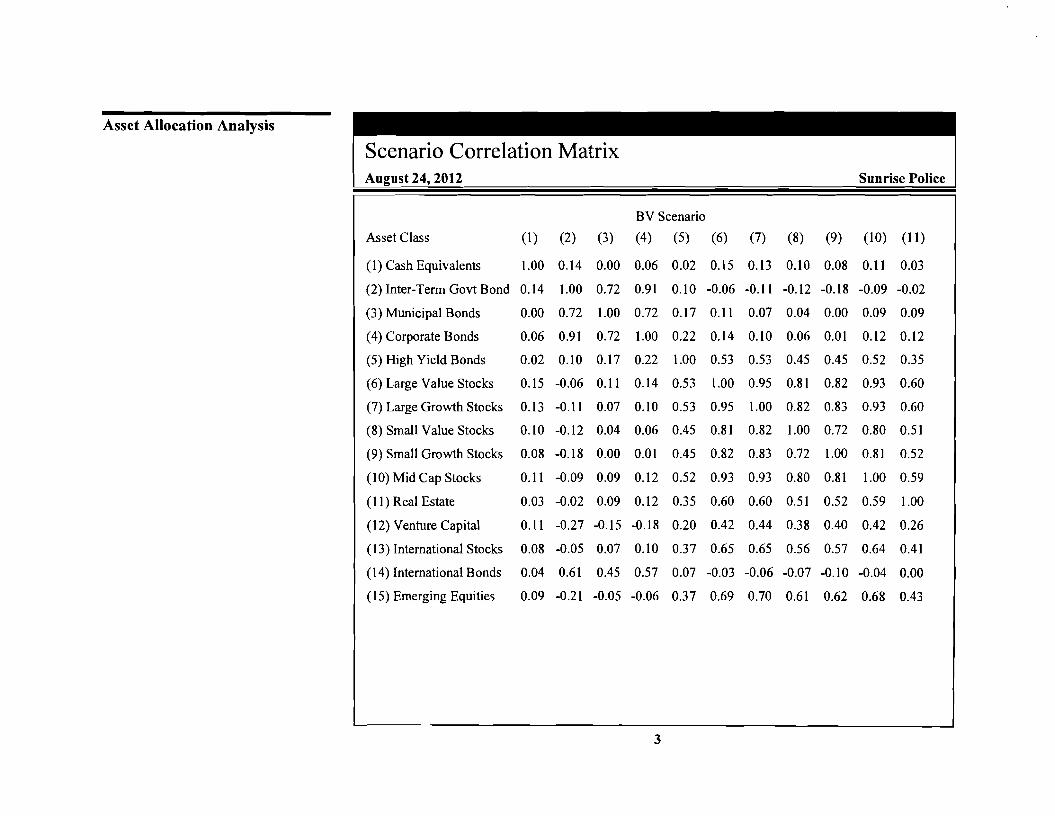
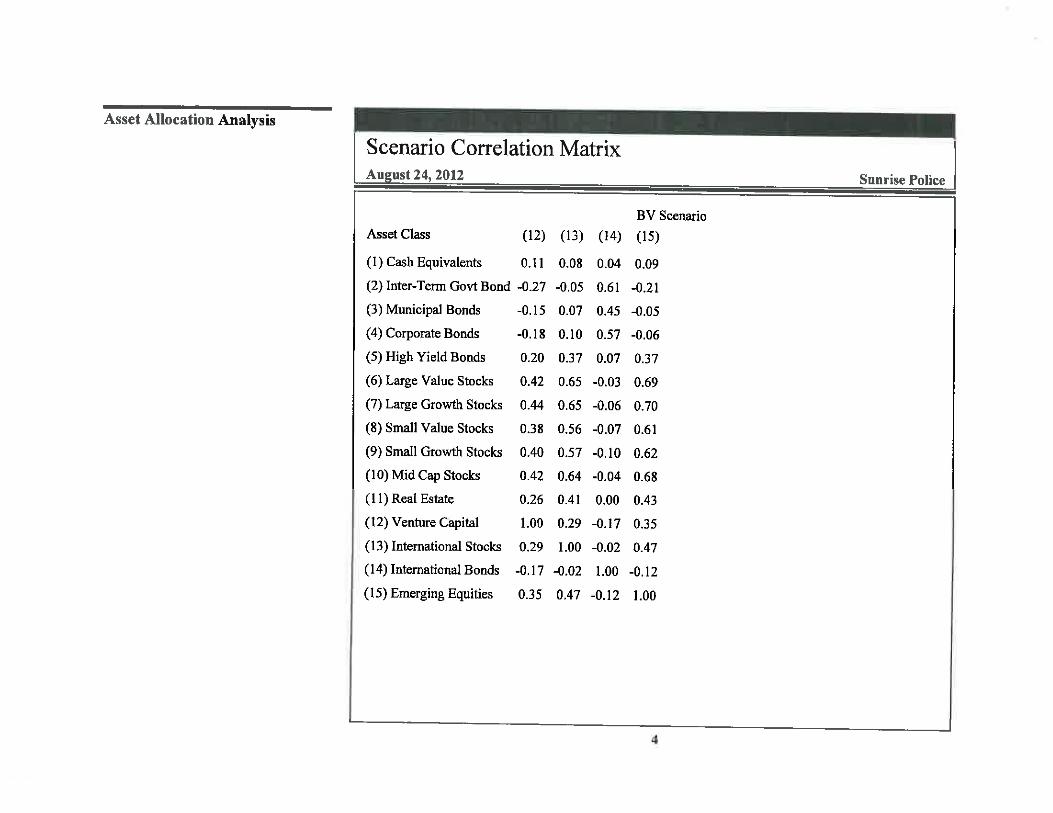
Scenario Correlation Matrix August 24, 2012 Sunrise Police
BV Scenario
Asset Class (I) (2) (3) (4) (5) (6) (7) (8) (9) (10) (11)
(I) Cash Equivalents 1.00 0.14 0.00 0.06 0.02 0.15 0.13 0.10 0.08 0.11 0.03
(2) Inter-Term Govt Bond 0.14 1.00 0.72 0.91 0.10 -0.06 -0.11 -0.12 -0.18 -0.09 -0.02
(3) Municipal Bonds 0.00 0.72 1.00 0.72 0.17 0.11 0.07 0.04 0.00 0.09 0.09
(4) Corporate Bonds 0.06 0.91 0.72 1.00 0.22 0.14 0.10 0.06 0.01 0.12 0.12
(5) High Yield Bonds 0.02 0.10 0.17 0.22 1.00 0.53 0.53 0.45 0.45 0.52 0.35
(6) Large Value Stocks 0.15 -0.06 0.11 0.14 0.53 1.00 0.95 0.81 0.82 0.93 0.60
(7) Large Growth Stocks 0.13 -0.11 0.07 0.10 0.53 0.95 1.00 0.82 0.83 0.93 0.60
(8) Small Value Stocks 0.10 -0.12 0.04 0.06 0.45 0.81 0.82 1.00 0.72 0.80 0.51
(9) Small Growth Stocks 0.08 -0.18 0.00 0.01 0.45 0.82 0.83 0.72 1.00 0.81 0.52
(10) Mid Cap Stocks 0.11 -0.09 0.09 0.12 0.52 0.93 0.93 0.80 0.81 1.00 0.59
( 11)Real Estate 0.03 -0.02 0.09 0.12 0.35 0.60 0.60 0.51 0.52 0.59 1.00
(12) Venture Capital 0.11 -0.27 -0.15 -0.18 0.20 0.42 0.44 0.38 0.40 0.42 0.26
(13) International Stocks 0.08 -0.05 0.07 0.10 0.37 0.65 0.65 0.56 0.57 0.64 0.41
(14) International Bonds 0.04 0.61 0.45 0.57 0.07 -0.03 -0.06 -0.07 -0.10 -0.04 0.00
(15) Emerging Equities 0.09 -0.21 -0.05 -0.06 0.37 0.69 0.70 0.61 0.62 0.68 0.43
3

Asset Allocation Analysis I
Scenario Correlation Matrix Auzust 24, 2012
Asset Class (12) (13) (14)
(1) Cash Equivalents 0.11 0.08 0.04
(2) Inter-Term Govt Bond -0.27 -0.05 0.61
(3) Municipal Bonds -0.15 0.07 0.45
(4) Corporate Bonds -0.18 0.10 0.57
(5) High Yield Bonds 0.20 0.37 0.07
(6) Large Value Stocks 0.42 0.65 -0.03
(7) Large Growth Stocks 0.44 0.65 -0.06
(8) Small Value Stocks 0.38 0.56 -0.07
(9) Small Growth Stocks 0.40 0.57 -0.10
(10) Mid Cap Stocks 0.42 0.64 -0.04
(11) Real Estate 0.26 0.41 0.00
(12) Venture Capital 1.00 0.29 -0.17
(13) International Stocks 0.29 1.00 -0.02
( 14) International Bonds -0.17 -0.02 1.00
(15) Emerging Equities 0.35 0.47 -0.12
Sunrise Police
BV Scenario
(15)
0.09
-0.21
-0.05
-0.06
0.37
0.69
0.70
0.61
0.62
0.68
0.43
0.35
0.47
-0.12
1.00
4
Asset Allocation Analysis
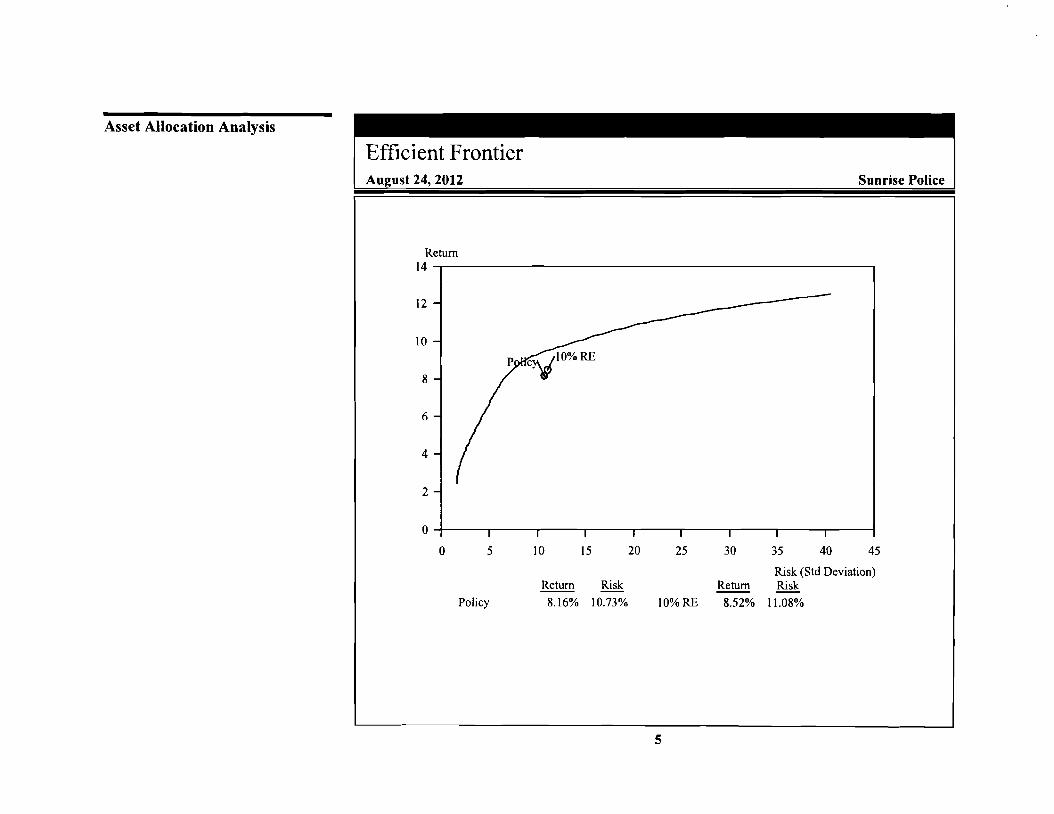
Efficient Frontier August 24, 2012 Sunrise Police
Return 14
12
10
8
6
4
2
0
0 5 10 15 20 25 30 35 40 45
Risk (Std Deviation) Return Risk Return Risk
Policy 8.16% 10.73% 10% RE 8.52% 11.08%
5

Asset Allocation Analysis
Investment Alternatives August 24, 2012 Sunrise Police
Asset Class
Cash Equivalents Inter-Term Govt Bond Municipal Bonds Corporate Bonds High Yield Bonds Large Value Stocks Large Growth Stocks Small Value Stocks Small Growth Stocks Mid Cap Stocks Real Estate Venture Capital International Stocks International Bonds Emerging Equities
Policy
0.00% 20.00
0.00 20.00
0.00 15.50 15.50 5.00 5.00
10.00 0.00 0.00 9.00 0.00 0.00
10% RE
0.00% 15.00 0.00
15.00 0.00
15.50 15.50 5.00 5.00
10.00 10.00 0.00 9.00 0.00 0.00
Return 8.16% 8.52% Std Deviation 10.73% 11.08% Yield 3.19% 3.33% Sharpe Ratio 0.53 0.54
6

Asset Allocation Analysis
Target Returns Auzust 24,2012 Sunrise Police
Probability of Exceeding Target Return
Year I Year 20 Year 25 Year 30 Year 40
Target Return 7.80%
Policy 49.37% 47.20% 46.87% 46.57% 46.04% 10%RE 50.56 52.51 52.80 53.07 53.54
Target Return 8.30%
Policy 47.51 39.00 37.74 36.62 34.64 10%RE 48.75 44.42 43.77 43.18 42.14
Target Return 8.80%
Policy 45.66 31.30 29.29 27.53 24.53 10%RE 46.95 36.60 35.09 33.75 31.41
7

Asset Allocation Analysis
The Efficient Frontier August 24, 2012 Sunrise Police
The Efficient Frontier traces out the portfolios that offer the greatest amount of return for given levels of risk. All portfolios on the frontier are efficient and selection of the proper portfolio depends upon the investor's goals and tolerance for risk.
The diagram below illustrates the concept of efficiency. The "Inefficient Portfolio" does not lie on the frontier because an alternate portfolio can be found that offers more return for the same amount of risk A second portfolio can be found that offers the same return, but less risk Both of these "efficient" portfolios are more desirable to investors trying to maximize return and minimize risk.
High
I Same Risk, More Return
Efficient FrotlberExpected
Return
ineffICient Portfolio•
r
Low
Low ~.------- Risk High
When calculating the efficient frontier, multiple factors are considered: Market expectations for return, risk and correlation of assets
• Constraints limiting investment in particular asset classes Your tax rates
Portfolio optimization is a mathematical technique for finding the portfolios that lie along the efficient frontier These ideas were developed by Dr Harry Markowitz and earned him a Nobel Prize in Economics in 1990. These theories are collectively known as Modem Portfolio Theory.
8
Asset Allocation Analysis
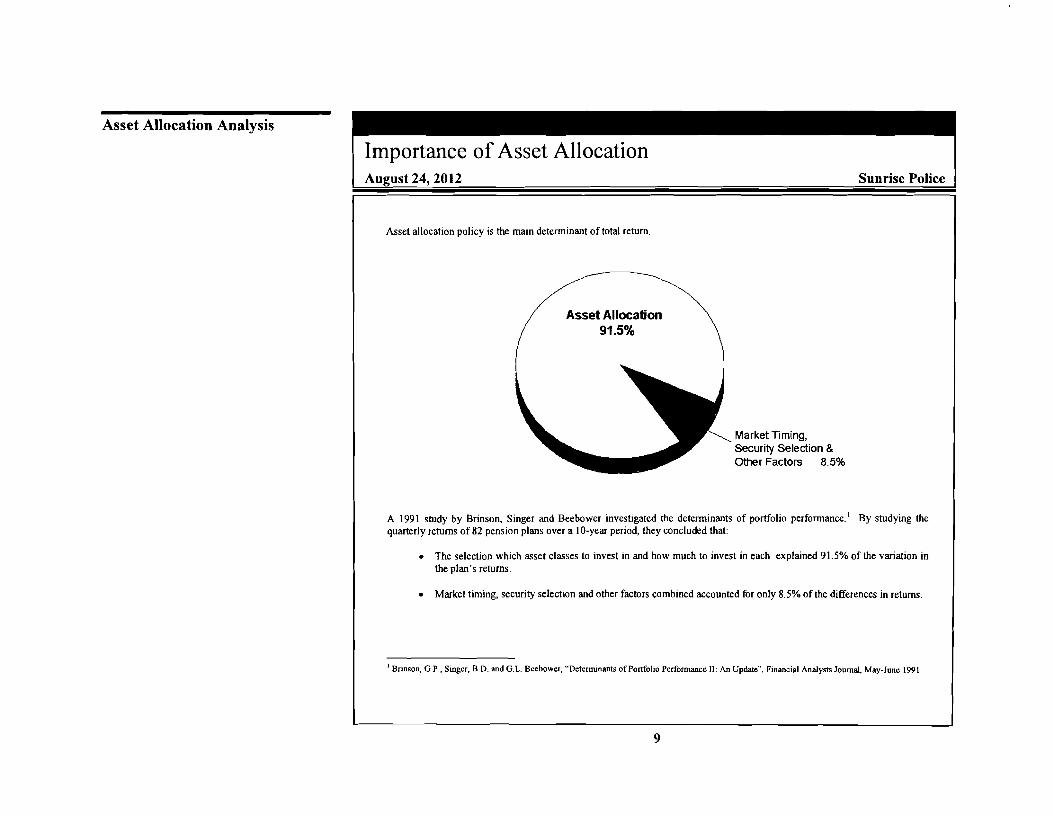
Importance of Asset Allocation August 24, 2012 Sunrise Police
Asset allocation policy is the main determinant of total return.
Market Timing, Security Selection & other Factors 8.5%
A 1991 study by Brinson, Singer and Beebower investigated the determinants of portfolio performance. I By studying the quarterly returns of 82 pension plans over a IO-year period, they concluded that:
• The selection which asset classes to invest in and how much to invest in each explained 91.5% of the variation in the plan's returns.
• Market timing, security selection and other factors combined accounted for only 8.5% of the differences in returns.
I Brinson, G P., Singer, B.D. and G.L. Beebower, "Determinants of Portfolio Performance II: An Update", Financial Analysts Journal, May-June 1991
Asset Allocation 91.5%
9

CITY OF SUNRISE, FLORIDA
POLICE OFFICERS’ RETIREMENT PLAN
13790 NW 4 Street, Suite 105 Sunrise, Florida 33325
Telephone: (954) 845-0298 Fax: (954) 845-9852
Please visit us at www.sunrisepolicepension.com
March 18, 2013 Sent via E-Mail Mayor Michael J. Ryan Deputy Mayor Joseph A. Scuotto City Commission Office City Commission Office 10770 West Oakland Park Blvd. 10770 West Oakland Park Blvd. Sunrise, FL 33351 Sunrise, FL 33351 Assistant Deputy Mayor Lawrence A. Sofield Commissioner Donald K. Rosen City Commission Office City Commission Office 10770 West Oakland Park Blvd. 10770 West Oakland Park Blvd. Sunrise, FL 33351 Sunrise, FL 33351 Commissioner Neil Kerch City Commission Office 10770 West Oakland Park Blvd. Sunrise, FL 33351 Dear Honorable Mayor & Commissioners: I am writing on behalf of the Board of Trustees, City of Sunrise Police Officers’ Retirement Plan. The purpose of this communication is to bring to your attention the Board’s standing request to include real estate in our investment portfolio. Our prior request of October 10, 2012, resulted in a one line negative response from Ms. Kisslan. I feel certain you know that real estate investments are commonplace in public funds such as ours. The Board of Trustees feels that it would be a prudent investment, and would supplement our fixed income return. Our current ordinance (created in the 1980’s) does not permit such an allocation, and the Board is formally requesting the Commission to consider this matter. The Board would like to be able to invest 10-15% of the fixed income portion of the portfolio in this investment vehicle. I have attached the original request (and back-up) that was transmitted to Ms. Kisslan. Further I have attached an updated asset allocation dated February 14, 2013 and a letter from Mr. McCann, Plan Performance Monitor of Thistle Asset Consulting. Mr. McCann indicated that he would be pleased to appear before the Commission to discuss his report in detail. In the best interest of “the Plan” and “the Plan Sponsor” the Board of Trustees would like to thank you for your sincere consideration. Respectfully,
David M. Williams, Plan Administrator FOR THE BOARD
c: Board of Trustees


davew
Typewritten Text
February 14, 2013

Asset Allocation Analysis
February 14, 2013
Asset Allocation Analysisfor
Sunrise Policeby
Thistle Asset Consulting
Asset Allocation Analysis
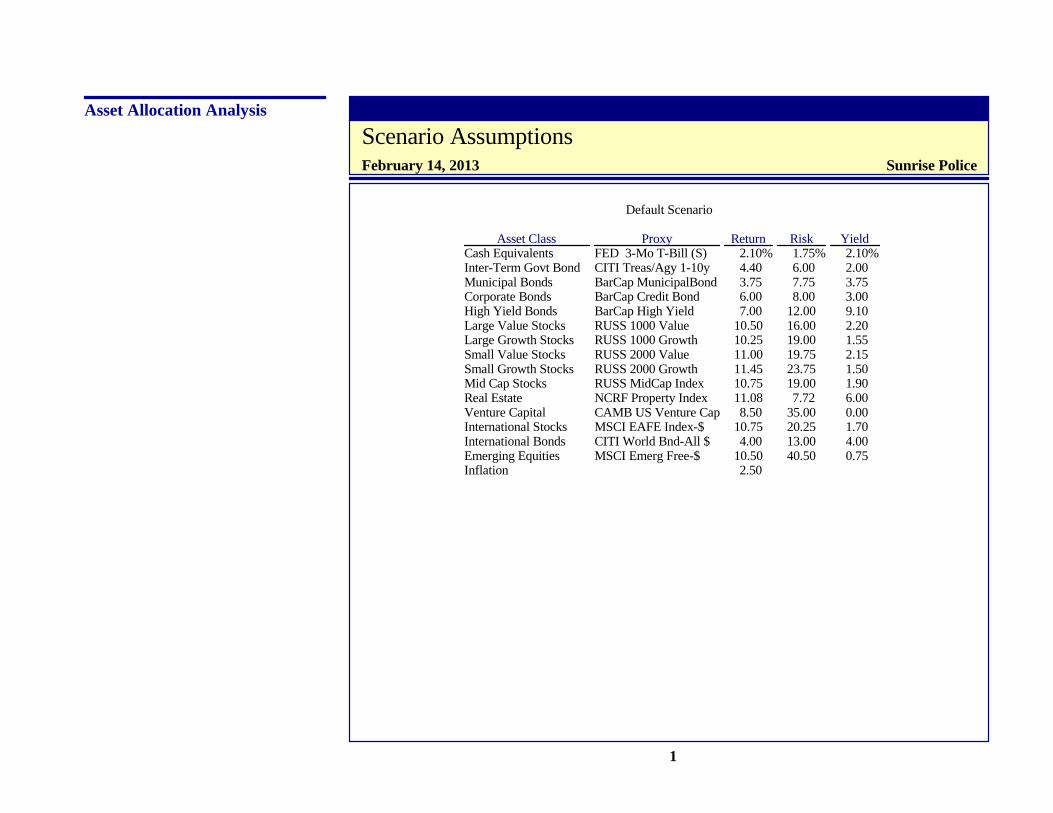
Scenario AssumptionsFebruary 14, 2013 Sunrise Police
1
Default Scenario
Asset Class Proxy Return Risk YieldCash Equivalents FED 3-Mo T-Bill (S) 2.10% 1.75% 2.10%Inter-Term Govt Bond CITI Treas/Agy 1-10y 4.40 6.00 2.00Municipal Bonds BarCap MunicipalBond 3.75 7.75 3.75Corporate Bonds BarCap Credit Bond 6.00 8.00 3.00High Yield Bonds BarCap High Yield 7.00 12.00 9.10Large Value Stocks RUSS 1000 Value 10.50 16.00 2.20Large Growth Stocks RUSS 1000 Growth 10.25 19.00 1.55Small Value Stocks RUSS 2000 Value 11.00 19.75 2.15Small Growth Stocks RUSS 2000 Growth 11.45 23.75 1.50Mid Cap Stocks RUSS MidCap Index 10.75 19.00 1.90Real Estate NCRF Property Index 11.08 7.72 6.00Venture Capital CAMB US Venture Cap 8.50 35.00 0.00International Stocks MSCI EAFE Index-$ 10.75 20.25 1.70International Bonds CITI World Bnd-All $ 4.00 13.00 4.00Emerging Equities MSCI Emerg Free-$ 10.50 40.50 0.75Inflation 2.50

Asset Allocation Analysis
Scenario AssumptionsFebruary 14, 2013 Sunrise Police
2
0 5 10 15 20 25 30 35 40 45
1
2
3
4
5
6
7
8
9
10
11
12
Cash Equivalents
Inter-Term Govt Bond
Municipal Bonds
Corporate Bonds
High Yield Bonds
Large Value Stocks Large Growth Stocks
Small Value Stocks Small Growth Stocks
Mid Cap Stocks
Real Estate
Venture CapitalInternational Stocks
International Bonds
Emerging Equities
Default Scenario
Risk (Std Deviation)
Return
Asset Allocation Analysis
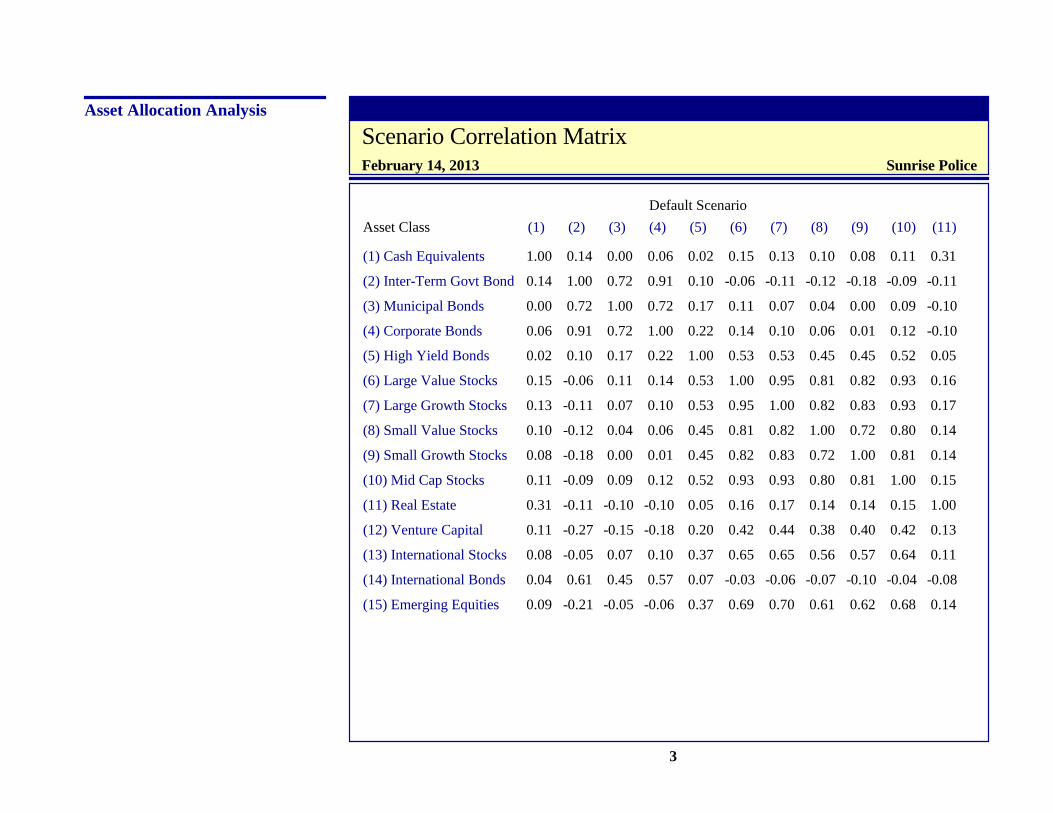
Scenario Correlation MatrixFebruary 14, 2013 Sunrise Police
3
Default Scenario
(1) (2) (3) (4) (5) (6) (7) (8) (9) (10) (11)
(1) Cash Equivalents
(2) Inter-Term Govt Bond
(3) Municipal Bonds
(4) Corporate Bonds
(5) High Yield Bonds
(6) Large Value Stocks
(7) Large Growth Stocks
(8) Small Value Stocks
(9) Small Growth Stocks
(10) Mid Cap Stocks
(11) Real Estate
(12) Venture Capital
(13) International Stocks
(14) International Bonds
(15) Emerging Equities
Asset Class
1.00 0.14 0.00 0.06 0.02 0.15 0.13 0.10 0.08 0.11 0.31
0.14 1.00 0.72 0.91 0.10 -0.06 -0.11 -0.12 -0.18 -0.09 -0.11
0.00 0.72 1.00 0.72 0.17 0.11 0.07 0.04 0.00 0.09 -0.10
0.06 0.91 0.72 1.00 0.22 0.14 0.10 0.06 0.01 0.12 -0.10
0.02 0.10 0.17 0.22 1.00 0.53 0.53 0.45 0.45 0.52 0.05
0.15 -0.06 0.11 0.14 0.53 1.00 0.95 0.81 0.82 0.93 0.16
0.13 -0.11 0.07 0.10 0.53 0.95 1.00 0.82 0.83 0.93 0.17
0.10 -0.12 0.04 0.06 0.45 0.81 0.82 1.00 0.72 0.80 0.14
0.08 -0.18 0.00 0.01 0.45 0.82 0.83 0.72 1.00 0.81 0.14
0.11 -0.09 0.09 0.12 0.52 0.93 0.93 0.80 0.81 1.00 0.15
0.31 -0.11 -0.10 -0.10 0.05 0.16 0.17 0.14 0.14 0.15 1.00
0.11 -0.27 -0.15 -0.18 0.20 0.42 0.44 0.38 0.40 0.42 0.13
0.08 -0.05 0.07 0.10 0.37 0.65 0.65 0.56 0.57 0.64 0.11
0.04 0.61 0.45 0.57 0.07 -0.03 -0.06 -0.07 -0.10 -0.04 -0.08
0.09 -0.21 -0.05 -0.06 0.37 0.69 0.70 0.61 0.62 0.68 0.14
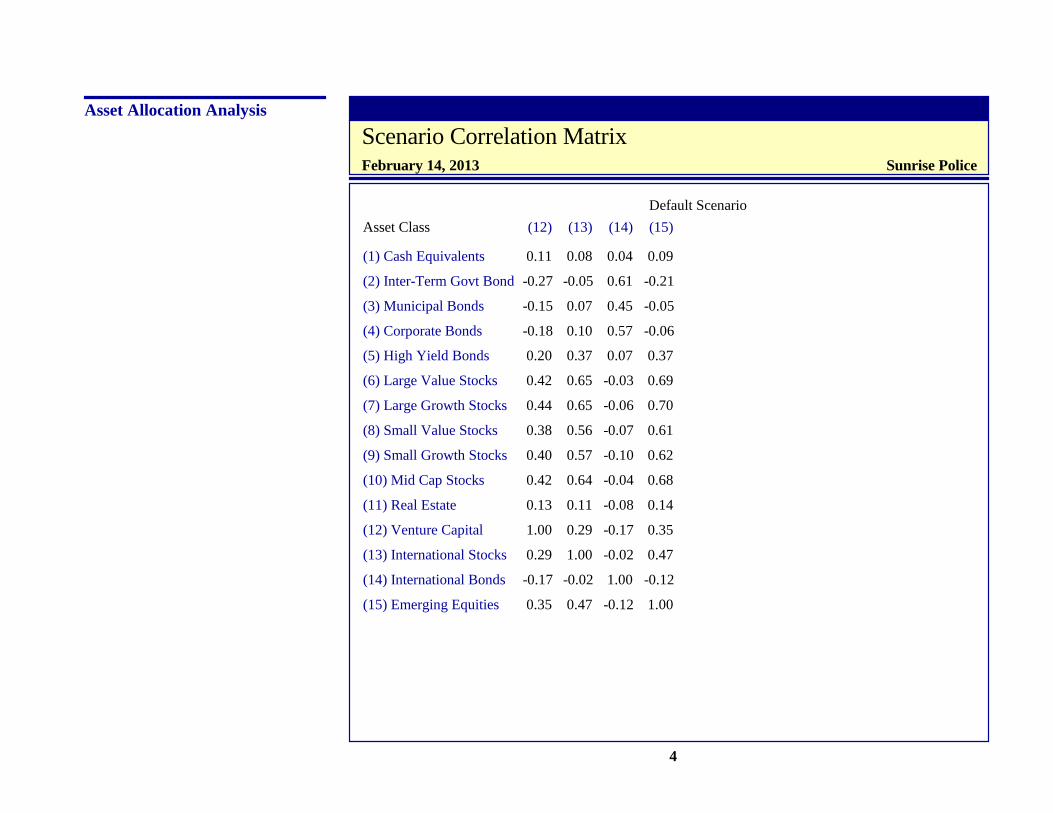
Asset Allocation Analysis
Scenario Correlation MatrixFebruary 14, 2013 Sunrise Police
4
Default Scenario
(12) (13) (14) (15)
(1) Cash Equivalents
(2) Inter-Term Govt Bond
(3) Municipal Bonds
(4) Corporate Bonds
(5) High Yield Bonds
(6) Large Value Stocks
(7) Large Growth Stocks
(8) Small Value Stocks
(9) Small Growth Stocks
(10) Mid Cap Stocks
(11) Real Estate
(12) Venture Capital
(13) International Stocks
(14) International Bonds
(15) Emerging Equities
Asset Class
0.11 0.08 0.04 0.09
-0.27 -0.05 0.61 -0.21
-0.15 0.07 0.45 -0.05
-0.18 0.10 0.57 -0.06
0.20 0.37 0.07 0.37
0.42 0.65 -0.03 0.69
0.44 0.65 -0.06 0.70
0.38 0.56 -0.07 0.61
0.40 0.57 -0.10 0.62
0.42 0.64 -0.04 0.68
0.13 0.11 -0.08 0.14
1.00 0.29 -0.17 0.35
0.29 1.00 -0.02 0.47
-0.17 -0.02 1.00 -0.12
0.35 0.47 -0.12 1.00
Asset Allocation Analysis
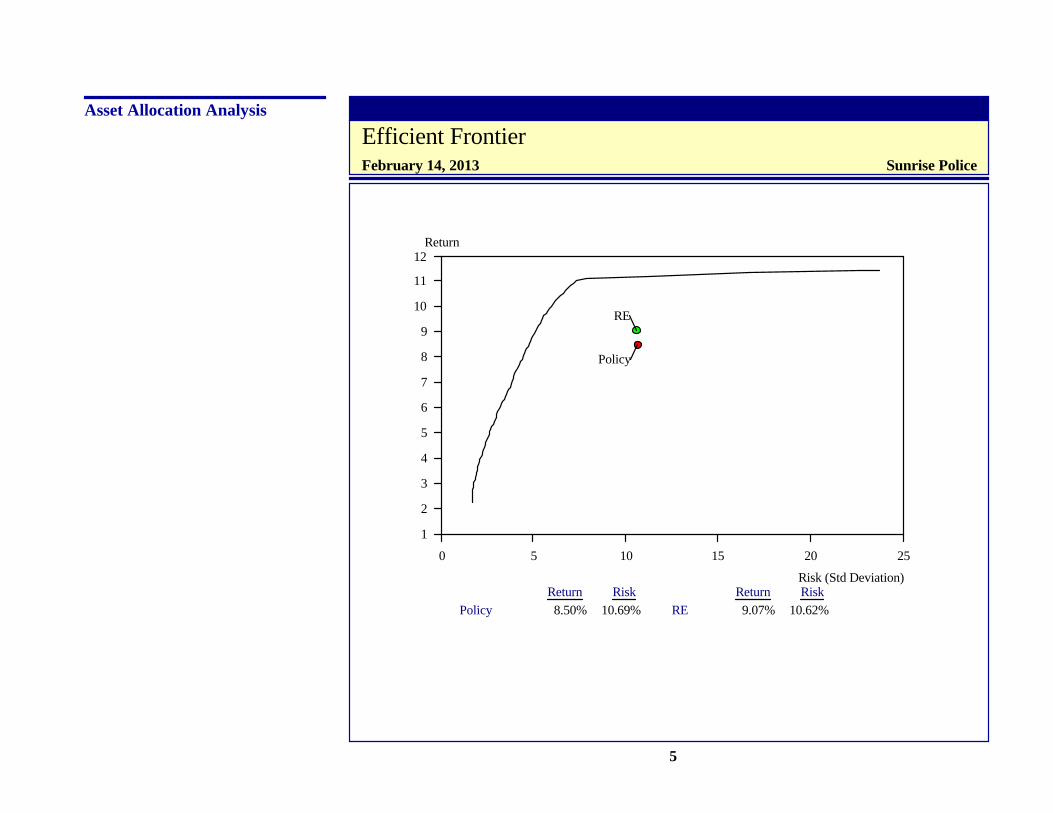
Efficient FrontierFebruary 14, 2013 Sunrise Police
5
0 5 10 15 20 25
1
2
3
4
5
6
7
8
9
10
11
12
Policy
RE
Risk (Std Deviation)
Return
Return ReturnRisk RiskPolicy 8.50% 10.69% RE 9.07% 10.62%

Asset Allocation Analysis
Investment AlternativesFebruary 14, 2013 Sunrise Police
6
Asset Class Policy RECash Equivalents 0.00% 0.00%Inter-Term Govt Bond 16.00 12.00Municipal Bonds 0.00 0.00Corporate Bonds 24.00 18.00High Yield Bonds 0.00 0.00Large Value Stocks 15.50 15.50Large Growth Stocks 15.50 15.50Small Value Stocks 10.00 10.00Small Growth Stocks 0.00 0.00Mid Cap Stocks 10.00 10.00Real Estate 0.00 10.00Venture Capital 0.00 0.00International Stocks 9.00 9.00International Bonds 0.00 0.00Emerging Equities 0.00 0.00Return 8.50% 9.07%Std Deviation 10.69% 10.62%Yield 2.18% 2.52%Sharpe Ratio 0.56 0.62
Asset Allocation Analysis
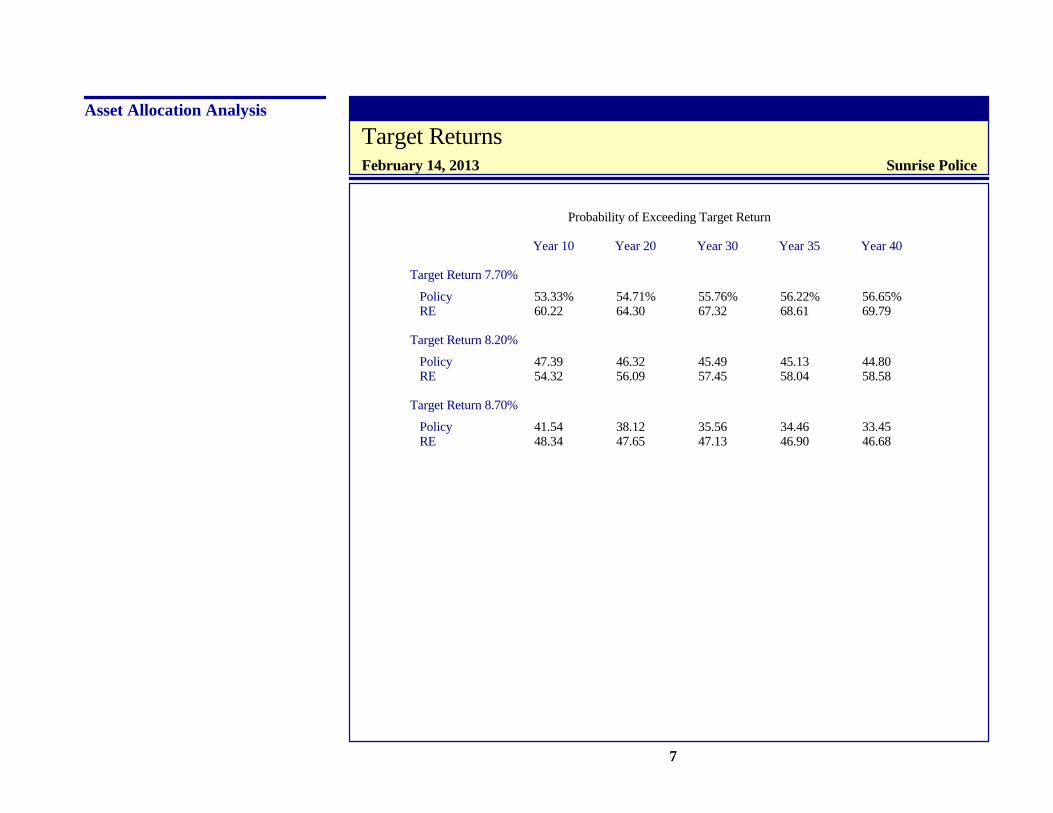
Target ReturnsFebruary 14, 2013 Sunrise Police
7
Probability of Exceeding Target Return
Year 10 Year 20 Year 30 Year 35 Year 40
Target Return 7.70%
Policy 53.33% 54.71% 55.76% 56.22% 56.65%RE 60.22 64.30 67.32 68.61 69.79
Target Return 8.20%
Policy 47.39 46.32 45.49 45.13 44.80RE 54.32 56.09 57.45 58.04 58.58
Target Return 8.70%
Policy 41.54 38.12 35.56 34.46 33.45RE 48.34 47.65 47.13 46.90 46.68
CITY OF SUNRISE, FLORIDA
POLICE OFFICERS’ RETIREMENT PLAN
13790 NW 4 Street, Suite 105 Sunrise, Florida 33325
Telephone: (954) 845-0298 Fax: (954) 845-9852
Please visit us at www.sunrisepolicepension.com
June 20, 2013 Sent via E-Mail Mayor Michael J. Ryan Deputy Mayor Neil C. Kerch City Commission Office City Commission Office 10770 West Oakland Park Blvd. 10770 West Oakland Park Blvd. Sunrise, FL 33351 Sunrise, FL 33351 Assistant Deputy Mayor Lawrence A. Sofield Commissioner Donald K. Rosen City Commission Office City Commission Office 10770 West Oakland Park Blvd. 10770 West Oakland Park Blvd. Sunrise, FL 33351 Sunrise, FL 33351 Commissioner Joseph A. Scuotto City Commission Office 10770 West Oakland Park Blvd. Sunrise, FL 33351 Dear Honorable Mayor & Commissioners: Please find the attached excellent REAL ESTATE article for your interest. Additionally, please accept this correspondence as a follow-up to my March 18, 2013 communication. Thank you for your time and consideration in this matter of mutual concern. Respectfully,
David M. Williams, Plan Administrator FOR THE BOARD
c: Board of Trustees

Real assets solutions: Implementing the RealizationMay 2013
INVESTMENT STRATEGIES
FOR INSTITUTIONAL AND PROFESSIONAL INVESTOR USE ONLY | NOT FOR RETAIL USE OR DISTRIBUTION
Connecting you with our global network of investment experts
Today, interest rates are lower than they have been in over six decades. At the same time, global equity market uncertainty—and correlations—remain elevated, while GDP growth prospects for the developed markets are low-to-moderate at best. And the specter of inflation looms on the horizon in the wake of unprecedented monetary and fiscal stimulus packages.In short, investors face a perfect storm of challenges to their portfolio:
• How to generate sufficient income when rates are so low
• How to reduce portfolio risk when public market uncertainty and correlations are so high
• How to achieve growth when developed market economies are so stunted
• How to be ready for inflation when it comes
Sources: Bloomberg, J.P. Morgan Asset Management.A 10-year U.S. Treasury; data as of December 2012.B VIX Index (S&P 500 Volatility Index); data as of December 2012.C IMF data. Estimates for 2010–2019 are forecasts from J.P. Morgan Asset Management-Global Real Assets; data as of June 2012.D U.S. Consumer Price Index (CPI) year-over-year; data as of December 2012.
The Realization: A perfect storm of challenges for investorsEXHIBIT 1A: LOW YIELDING BONDS…FOR THE FORESEEABLE FUTUREA
EXHIBIT 1C: HIGH GDP GROWTH IN DEVELOPED MARKETS A THING OF THE PASTC EXHIBIT 1D: INFLATION AT LEAST A MEDIUM-TERM THREATD
EXHIBIT 1B: VOLATILE EQUITIES AND HIGH CORRELATIONSB
1.80
2
4
6
8
10
12
14
16
1980 1984 1988 1992 1996 2000 2004 2008 2012
100
20304050
VIX
Inde
xB 60708090
2001 2002 2003 2004 2005 2006 2007 2008 2009 2010 2011 2012
WorldCom9/11
SARSSE AsiaTsunami
JPMorgan buysBear Sterns
Lehman Brothersbankruptcy
$787bn stimuluspackage signed
1st Greek Bailout
BP Oil Spill
Europeancrisis
10-year correlations
S&P 500
MSCI World
MSCI EM
S&P 500 1.0MSCI World 1.0 1.0MSCI EM 0.8 0.9 1.0
Perc
ent
Yield-to-maturity on10-year TreasuriesA
?
-4-202468
10121416
1980 1984 1988 1992 1996 2000 2004 2008 2012 2016
0
2
4
6
Real
GDP
gro
wth
rat
es (%
)
Perc
ent
U.S. inflation, CPI annual amounts8
10
12
1960-69 1970-79 1980-89 1990-99 2000-09 2010-19
United States Japan
Spain
Germany
United Kingdom France

Implementing the Realization
2 | Real assets solutions: Implementing the Realization
Real solutions from real assets: Higher and more diversified allocationsIn a research paper entitled The Realization (May 2012), the J.P. Morgan Asset Management—Global Real Assets (GRA) team proposed that, to address these fundamental challenges, institutional investors will need to increase allocations to real assets to as high as 25% or more of their portfolios. While this figure will vary by investor (and certainly be lower for portfolios with liquidity and/or regulatory restrictions), the rationale for higher and more diversified allocations is that real assets provide real solutions to the challenges facing investors today. Real assets include real estate, infrastructure (e.g., regulated utilities, power generation, transportation assets), timberland, farmland, shipping and other large-scale, long-life tangible investments that deliver what investors are looking for.
• Income: Core real estate and infrastructure typically yield 5%–7% per year, or 300–500 basis points above 10-year Treasuries.
• Stability: Returns for these assets are less volatile than for equities, particularly when part of a diversified real assets portfolio, due to low correlations between and among different real assets categories.
• Growth: Real assets provide a direct link to higher growth Asian economies, offering a “pure play” on local GDP growth.
• Inflation sensitivity: These assets, particularly core infrastructure, can enhance inflation sensitivity through their ability to provide positive real returns, even during periods of rising or elevated inflation.
A Barclays U.S. Agg Yield-to-Worst, S&P 500 Dividend Yield, FTSE/EPRA NAREIT Global REITs Dividend Yield, J.P. Morgan U.S. Core RE strategy trailing 12-month income return, J.P. Morgan U.S. Core-plus RE strategy trailing 12-month income return, J.P. Morgan OECD Infrastructure strategy trailing 12-month cash yield; as of December 2012.
B MSCI World Index; Equally weighted real assets is an equally weighted portfolio of: U.S. Core RE (NCREIF—ODCE), OECD Infrastructure (J.P. Morgan GRA Research modeled), Europe Non-core RE (DTZ Research), and Emerging Market RE (China—Jones Lang LaSalle). All returns are U.S. Dollar denominated; as of December 31, 2011.
C Bloomberg, J.P. Morgan Asset Management, IMF. Estimates for 2013 through 2017 are from IMF. D Bloomberg, Barclays, Standard & Poors, NCREIF, Global Financial Data, and J.P. Morgan Asset Management-GRA Research. Past performance is no guarantee
of future results.
The Realization: Real solutions from real assetsEXHIBIT 2A: HIGHER CURRENT INCOME POTENTIAL THAN TRADITIONAL ASSETSA
EXHIBIT 2C: LINK TO EMERGING MARKET GROWTHC EXHIBIT 2D: INFLATION PROTECTION WHEN IT MATTERSD
EXHIBIT 2B: LOWER VOLATILITY THAN EQUITIESB
U.S.fixed
income
U.S.equities
GlobalREITs
U.S.coreRE
U.S.core-plus
RE
U.S. REmezzanine
debt
OECDcore/
core-plusinfrastructure
Real assets
Traditional assets
Dividend yields/income returns
Perc
ent
1.7 2.23.6
5.36.0 6.5
8.4
0123456789
2006
-30
-20
-10
0
10
20
30
1995
1996
1997
1998
1999
2000
2001
2002
2003
2004
2005
2007
2008
2009
2010
2011
Qua
rter
ly to
tal r
etur
ns (%
)
MSCI global equities Equally weighted real assets
World United States Europe Developing Asia India China
0
2
4
6
8
10
12
1990–99 2000–09 2010–11 2012 2013–2017E
Real
GDP
gro
wth
rat
es (%
)
0
1
2
3
4
5
1969
1970
1971
1972
1973
1974
1975
1976
1977
1978
1979
1980
1981
1982
1983
1984
1985
Inde
x
Regulatedinfrastructure
U.S. CPI
U.S. RE
Corporate debt
S&P 500
Nominal return and inflation indices, 1970–1985

J.P. Morgan Asset Management | 3
The Realization Solutions Pyramid: Finding the appropriate mix of real assets for your needsInstitutional investors tend to broadly diversify their equity portfolios (e.g., large cap, mid cap, small cap, growth, value, domestic, international, emerging, etc.) and fixed income portfolios (e.g., government, corporate and high yield—by different rating levels, etc.). Investors need to consider doing the same for their real assets portfolios. Traditionally, when investing in real assets, investors have turned first to real estate and, more often than not, to home country core real estate. A key point of the Realization is that while core real estate is a prudent first step, it should not be the last one. When planning to implement the Realization through a higher allocation to real assets, it is important to:
• Think strategically about building a foundation that is diversified across both core real estate and core infrastructure in developed markets for steady income, reduced volatility, inflation sensitivity and relative liquidity.
• Consider augmenting this foundation with complementary non-core real assets in developed markets for enhanced returns and diversification.
• Explore adding global diversification and total return opportunities through emerging market real assets.
Stable structure: The Realization Solutions Pyramid divides a real assets allocation into categories with unique and complementary benefits
Source: J.P. Morgan Asset Management-Global Real Assets; as of March 2013.
Emergingmarkets
real assets
EM real estateAsia infrastructure
Global shipping
Developed markets complementary real assets
Value added/opportunistic real assets
Developed markets core real assets
Core/core+ real estate Core/core+ infrastructure
Mezzanine Timber/farmlandREITs
GLOBAL DIVERSIFIERSGlobal diversification and tactical/opportunistic returns
CORE COMPLEMENTSAdded diversification and/or enhanced returns
CORE FOUNDATIONStable income with lower volatility,diversification, plus inflation sensitivity
Implementing the Realization
4 | Real assets solutions: Implementing the Realization
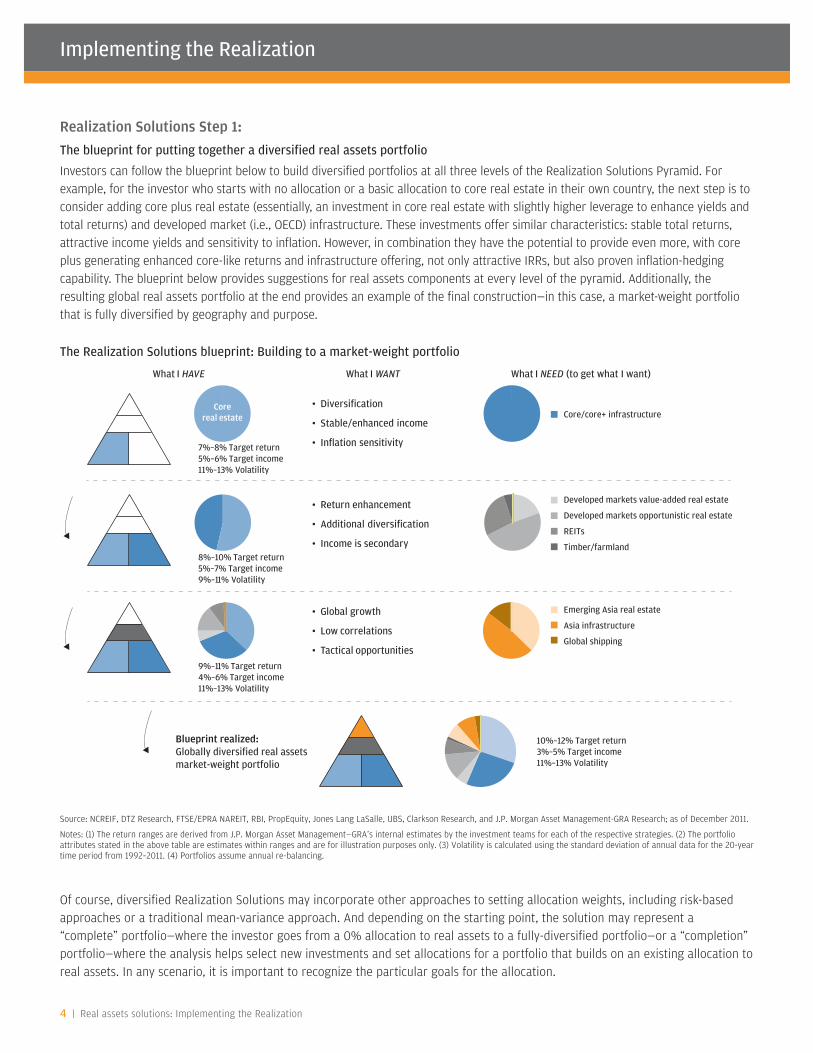
Realization Solutions Step 1: The blueprint for putting together a diversified real assets portfolio
Investors can follow the blueprint below to build diversified portfolios at all three levels of the Realization Solutions Pyramid. For example, for the investor who starts with no allocation or a basic allocation to core real estate in their own country, the next step is to consider adding core plus real estate (essentially, an investment in core real estate with slightly higher leverage to enhance yields and total returns) and developed market (i.e., OECD) infrastructure. These investments offer similar characteristics: stable total returns, attractive income yields and sensitivity to inflation. However, in combination they have the potential to provide even more, with core plus generating enhanced core-like returns and infrastructure offering, not only attractive IRRs, but also proven inflation-hedging capability. The blueprint below provides suggestions for real assets components at every level of the pyramid. Additionally, the resulting global real assets portfolio at the end provides an example of the final construction—in this case, a market-weight portfolio that is fully diversified by geography and purpose.
The Realization Solutions blueprint: Building to a market-weight portfolio
Of course, diversified Realization Solutions may incorporate other approaches to setting allocation weights, including risk-based approaches or a traditional mean-variance approach. And depending on the starting point, the solution may represent a “complete” portfolio—where the investor goes from a 0% allocation to real assets to a fully-diversified portfolio—or a “completion” portfolio—where the analysis helps select new investments and set allocations for a portfolio that builds on an existing allocation to real assets. In any scenario, it is important to recognize the particular goals for the allocation.
Source: NCREIF, DTZ Research, FTSE/EPRA NAREIT, RBI, PropEquity, Jones Lang LaSalle, UBS, Clarkson Research, and J.P. Morgan Asset Management-GRA Research; as of December 2011.
Notes: (1) The return ranges are derived from J.P. Morgan Asset Management—GRA’s internal estimates by the investment teams for each of the respective strategies. (2) The portfolio attributes stated in the above table are estimates within ranges and are for illustration purposes only. (3) Volatility is calculated using the standard deviation of annual data for the 20-year time period from 1992–2011. (4) Portfolios assume annual re-balancing.
What I HAVE What I NEED (to get what I want)What I WANT
• Diversification
• Stable/enhanced income
• Inflation sensitivity
• Global growth
• Low correlations
• Tactical opportunities
• Return enhancement
• Additional diversification
• Income is secondary
Core/core+ infrastructure
Developed markets value-added real estate
Developed markets opportunistic real estate
REITs
Timber/farmland
Emerging Asia real estate
Asia infrastructure
Global shipping
Corereal estate
7%–8% Target return5%–6% Target income11%–13% Volatility
8%–10% Target return5%–7% Target income9%–11% Volatility
9%–11% Target return4%–6% Target income11%–13% Volatility
Blueprint realized:Globally diversified real assetsmarket-weight portfolio
10%–12% Target return3%–5% Target income11%–13% Volatility
J.P. Morgan Asset Management | 5
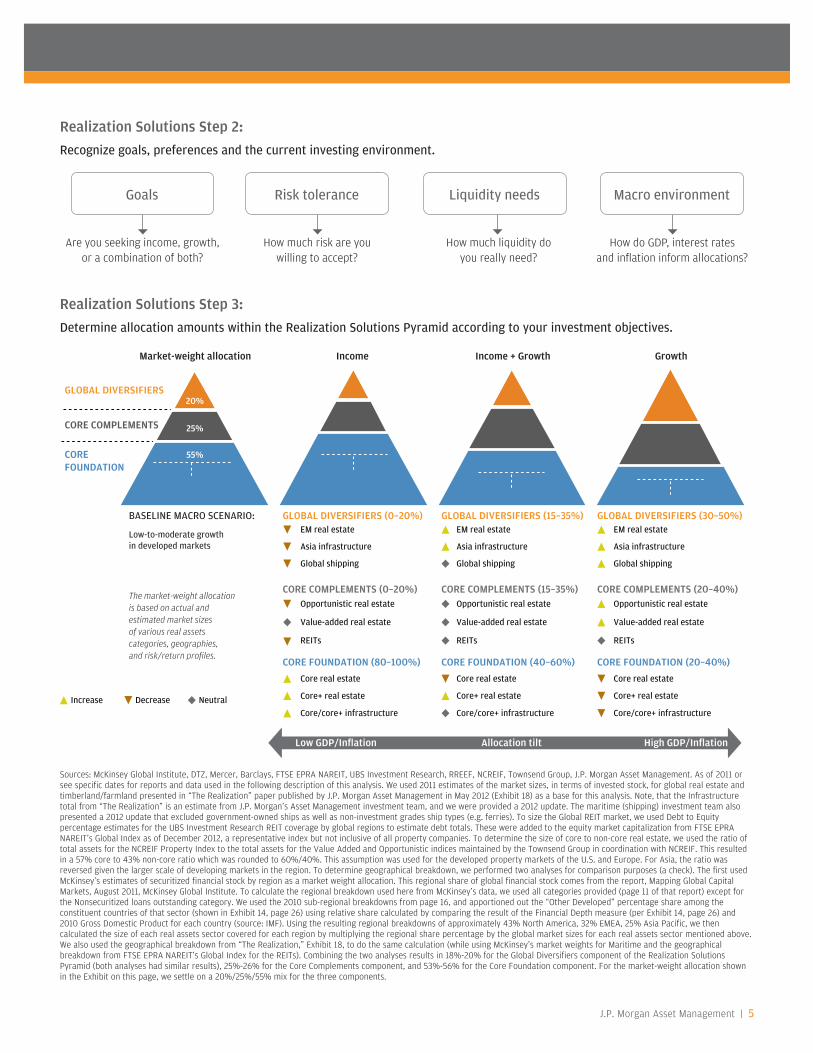
Sources: McKinsey Global Institute, DTZ, Mercer, Barclays, FTSE EPRA NAREIT, UBS Investment Research, RREEF, NCREIF, Townsend Group, J.P. Morgan Asset Management. As of 2011 or see specific dates for reports and data used in the following description of this analysis. We used 2011 estimates of the market sizes, in terms of invested stock, for global real estate and timberland/farmland presented in “The Realization” paper published by J.P. Morgan Asset Management in May 2012 (Exhibit 18) as a base for this analysis. Note, that the Infrastructure total from “The Realization” is an estimate from J.P. Morgan’s Asset Management investment team, and we were provided a 2012 update. The maritime (shipping) investment team also presented a 2012 update that excluded government-owned ships as well as non-investment grades ship types (e.g. ferries). To size the Global REIT market, we used Debt to Equity percentage estimates for the UBS Investment Research REIT coverage by global regions to estimate debt totals. These were added to the equity market capitalization from FTSE EPRA NAREIT’s Global Index as of December 2012, a representative index but not inclusive of all property companies. To determine the size of core to non-core real estate, we used the ratio of total assets for the NCREIF Property Index to the total assets for the Value Added and Opportunistic indices maintained by the Townsend Group in coordination with NCREIF. This resulted in a 57% core to 43% non-core ratio which was rounded to 60%/40%. This assumption was used for the developed property markets of the U.S. and Europe. For Asia, the ratio was reversed given the larger scale of developing markets in the region. To determine geographical breakdown, we performed two analyses for comparison purposes (a check). The first used McKinsey’s estimates of securitized financial stock by region as a market weight allocation. This regional share of global financial stock comes from the report, Mapping Global Capital Markets, August 2011, McKinsey Global Institute. To calculate the regional breakdown used here from McKinsey’s data, we used all categories provided (page 11 of that report) except for the Nonsecuritized loans outstanding category. We used the 2010 sub-regional breakdowns from page 16, and apportioned out the “Other Developed” percentage share among the constituent countries of that sector (shown in Exhibit 14, page 26) using relative share calculated by comparing the result of the Financial Depth measure (per Exhibit 14, page 26) and 2010 Gross Domestic Product for each country (source: IMF). Using the resulting regional breakdowns of approximately 43% North America, 32% EMEA, 25% Asia Pacific, we then calculated the size of each real assets sector covered for each region by multiplying the regional share percentage by the global market sizes for each real assets sector mentioned above. We also used the geographical breakdown from “The Realization,” Exhibit 18, to do the same calculation (while using McKinsey’s market weights for Maritime and the geographical breakdown from FTSE EPRA NAREIT’s Global Index for the REITs). Combining the two analyses results in 18%-20% for the Global Diversifiers component of the Realization Solutions Pyramid (both analyses had similar results), 25%-26% for the Core Complements component, and 53%-56% for the Core Foundation component. For the market-weight allocation shown in the Exhibit on this page, we settle on a 20%/25%/55% mix for the three components.
Goals Liquidity needs Macro environmentRisk tolerance
How do GDP, interest rates and inflation inform allocations?
Realization Solutions Step 2: Recognize goals, preferences and the current investing environment.
Realization Solutions Step 3: Determine allocation amounts within the Realization Solutions Pyramid according to your investment objectives.
GLOBAL DIVERSIFIERS (30–50%)EM real estate
Asia infrastructure
Global shipping
CORE COMPLEMENTS (20–40%)Opportunistic real estate
Value-added real estate
REITs
CORE FOUNDATION (20–40%)
Core real estate
Core+ real estate
Core/core+ infrastructure
20%
GLOBAL DIVERSIFIERS
CORE COMPLEMENTS
CORE FOUNDATION
25%
55%
20%
GLOBAL DIVERSIFIERS (0–20%)EM real estate
Asia infrastructure
Global shipping
CORE COMPLEMENTS (0–20%)Opportunistic real estate
Value-added real estate
REITs
CORE FOUNDATION (80–100%)
Core real estate
Core+ real estate
Core/core+ infrastructure
GLOBAL DIVERSIFIERS (15–35%)EM real estate
Asia infrastructure
Global shipping
CORE COMPLEMENTS (15–35%)Opportunistic real estate
Value-added real estate
REITs
CORE FOUNDATION (40–60%)
Core real estate
Core+ real estate
Core/core+ infrastructure
Market-weight allocation Income + GrowthIncome Growth
BASELINE MACRO SCENARIO:
Low-to-moderate growth in developed markets
The market-weight allocation is based on actual and estimated market sizes of various real assets categories, geographies, and risk/return profiles.
Allocation tiltLow GDP/Inflation High GDP/Inflation
Are you seeking income, growth, or a combination of both?
How much liquidity do you really need?
How much risk are you willing to accept?
Increase Decrease Neutral

Implementing the Realization
6 | Real assets solutions: Implementing the Realization
Implementing the Realization through Global Real Assets OmniThe Global Real Assets Omni program has been designed by J.P. Morgan Asset Management to help investors build customized portfolio allocations across different real assets categories, geographies, and structures. The Omni team of dedicated real assets professionals works collaboratively with investors and consultants to design and implement real assets solutions that are tailored to individual risk/return objectives. They do not take a one-size-fits-all approach. The Omni team uses a combination of top-down and bottom-up real assets analytics and research to inform portfolio construction:
• Customized portfolio analysis and design
– Collaborative and objective-driven
– Investor preferences and consultant input
• Omni allocation modeling tools
– Mean-variance
– Risk-based
– Inflation sensitivity
– Other bespoke models
• Omni historical real assets dataset
– More science, less art
In conclusion: Get started nowInvestors are at various stages of the Realization, an expected structural shift toward higher and more diversified real assets allo-cations. Real assets can diversify vs. your existing holdings of traditional assets, while delivering higher distributable income, reduced volatility, increased inflation sensitivity and higher risk-adjusted return potential. Each real assets category offers a unique set of risk-return characteristics. These risks can be mitigated by constructing a broadly diversified portfolio of real assets catego-ries. Those investors who recognize, embrace and act on these Realization Solutions in their portfolio allocations are likely to have better investment outcomes than those who do not.
CONNECTING YOUwith our global network of investment experts
Bernie McNamaraExecutive DirectorGlobal Real Assets [email protected]
Michael C. Hudgins Executive Director, Real Estate Strategist Global Real [email protected]
Pulkit SharmaVice PresidentGlobal Real Assets Omni [email protected]
Global realestate
Globalinfrastructure
Globalshipping
Other realassets
GLOBAL REAL ASSETS OMNI

J.P. Morgan Asset Management | 7
Appendix: The Real Assets Palette Real assets offer a spectrum of opportunities spanning real estate, REITs, infrastructure, land and even shipping. Investors can select from these strategies to build a diversified portfolio designed to meet their objectives.
ASIA INFRASTRUCTURE
Attractive risk
• Nearly $1 trillion in annual infrastructure investment needed in Asia, supported by enabling regulatory environment
• True diversification: accessing the building blocks of Asia’s growth via infrastructure
• Entry valuations + sustainability emphasis + local execution = attractive risk adjusted returns
INDIA REAL ESTATE
• Massive urbanization trend, expanding middle class, soon to be largest country by population
• Acute shortage of growth capital post financial crisis + huge demand-supply imbalance = an attractive entry point
• Opportunities to partner with high quality Indian developers for infill sites in gateway cities to provide “last mile capital” on compelling terms, especially for mid-income housing
Capital scarcity
CHINA REAL ESTATE
Aligned JV structures
• China: world’s 2nd largest economy and 3rd largest RE market by investable stock
• GDP growth expectations 2–3X OECD countries (2013) + urbanization + domestic consumption = need for office in Tier 1 cities, retail and mass residential
• Keys to success: strong local JV partner structures with aligned interests, sourcing advantages and enhanced asset management
LATIN AMERICA (BRAZIL) REAL ESTATE
• Brazil: macro-economic stability, young and expanding middle-class, low unemployment, steady growth outlook
• Underpenetrated RE market with developers in need of capital, the potential for further yield compression, and solid exit options
• Greenfield development opportunities across office, retail, residential, logistics and distribution centers
Steady growth
GLOBAL SHIPPING
Industry recapitalization
• Post global financial crisis industry distress continues to present opportunities for discounted purchases and new builds across bulkers, tankers, and containerships
• Recovering global economy and dwindling new supply provide tailwind to charter rates
• Need for new financing/operating structures provides income and growth opportunities
U.S. MEZZANINE/VALUE-ADDED/OPPORTUNISTIC REAL ESTATE
• Mezz: potential to earn significantly wider spreads vs. historical averages due to first mortgage shortfall
• Value-Add/Opp: significant discounts to core on properties in need of (re)development, recapitalization, or repositioning
• Value-Add/Opp: historically low new construction + low vacancy = opportunities for build-to-core and improve-to-core strategiesTactical premium
EUROPEAN VALUE-ADDED/OPPORTUNISTIC REAL ESTATE
Extreme risk aversion
• Ongoing distress in Europe causing extreme risk aversion among investors and significant discounts on non-core/trophy assets
• €250 bn of assets in suspended animation
• Broad brush mispricing of risk assets + critical need for recapitalization of properties = opportunity for proven investor-operators with active management
U.S., NON-U.S., AND GLOBAL REITS
• U.S.: opportunities to invest across the REIT capital stack in the U.S. to take advantage of market movements and mispricings and/or to reduce traditional REIT volatility
• Non-U.S./Global: typically lower volatility than U.S. REITs due to lower leverage on average; ability to tap into growth markets
• Liquidity enables tactical springing strategies Springing strategy
CORE/CORE PLUS REAL ESTATE
Strong fundamentals
• A foundational investment due to steady income, lower volatility, inflation sensitivity and diversification vs. financial assets
• Pricing has rebounded significantly since the bottom but fundamentals remain strong
• Low cost financing makes core plus (moderate leverage) particularly attractive
CORE/CORE PLUS INFRASTRUCTURE
• Essential, monopolistic services deliver stable, growing, and inflation-sensitive cash flows across regulated utilities, power generation and transportation sectors
• Similar attributes to core RE, but with low correlations for added diversification
• Time is now: discount rates likely to compress
Bridge to The Realization
Implementing the Realization
FOR INSTITUTIONAL AND PROFESSIONAL INVESTOR USE ONLY | NOT FOR RETAIL USE OR DISTRIBUTION
NOTICE TO EUROPEAN INVESTORS: FOR PROFESSIONAL CLIENTS ONLY. NOT FOR RETAIL USE OR DISTRIBUTION. Any forecasts, figures, opinions or investment techniques and strategies set out, unless otherwise stated, are J.P. Morgan Asset Management’s own at the date of publication. They are considered to be accurate at the time of writing, but no warranty of accuracy is given and no liability in respect of any error or omission is accepted. They may be subject to change without reference or notification to you. The views contained herein are not to be taken as either advice or a recom-mendation to buy or sell any investment, and the material should not be relied upon as containing sufficient information to support an investment decision. It should be noted that the value of investments and the income from them may fluctuate in accordance with market conditions and taxation agreements, and investors may not get back the full amount invested. Both past performance and yield may not be a reliable guide to future performance. You should also note that if you contact J.P. Morgan Asset Management by telephone, those lines could be recorded and may be monitored for security and training purposes. J.P. Morgan Asset Management is the brand name for the asset management business of JPMorgan Chase & Co. and its affiliates worldwide.
Real estate and infrastructure investing may be subject to a higher degree of market risk because of concentration in a specific industry, sector or geographical sector. Real estate and infrastructure investing may be subject to risks including, but not limited to, declines in the value of real estate, risks related to general and economic conditions, changes in the value of the underlying property owned by the trust and defaults by borrower. International investing involves a greater degree of risk and increased volatility. Changes in currency exchange rates and differences in accounting and taxation policies outside the U.S. can raise or lower returns. Also, some overseas markets may not be as politically and economically stable as the United States and other nations. The Fund’s investments in emerging markets could lead to more volatility in the value of the Fund. As mentioned above, the normal risks of investing in foreign countries are heightened when investing in emerging markets. In addition, the small size of securities markets and the low trading volume may lead to a lack of liquidity, which leads to increased volatility. Also, emerging markets may not provide adequate legal protection for private or foreign investment or private property.
An Internal Rate of Return—also sometimes called an Asset Weighted Return—measures the performance of a portfolio or investment between two dates, taking into account the amount of capital invested during each time period. An Internal Rate of Return calculation gives greater weight to those time periods where more capital was invested, and takes into account not only the size of cash flows, but also the length of time that each cash flow affected the portfolio. Essentially, an Internal Rate of Return answers the question, “if all the capital had been invested in a money market account instead (but the same contributions and withdrawals were made), what interest rate would have resulted in the same ending value?” These calculations are used where the timing and size of cash flows are important to the validity of the results, for example, when reviewing the returns on individual investment positions. Internal Rates of Return are also used to compute an unleveraged return in order to illustrate the impact of leverage on performance.
The Target Return has been established by J.P. Morgan Investment Management Inc. “J.P. Morgan” based on its assumptions and calculations using data available to it and in light of current market conditions and available investment opportunities and is subject to the risks set forth herein and to be set forth more fully in the Memorandum. The target returns are for illustrative purposes only and are subject to significant limitations. An investor should not expect to achieve actual returns similar to the target returns shown above. Because of the inherent limitations of the target returns, potential investors should not rely on them when making a decision on whether or not to invest in the strategy. The target returns cannot account for the impact that economic, market, and other factors may have on the implementation of an actual investment program. Unlike actual performance, the target returns do not reflect actual trading, liquidity constraints, fees, expenses, and other factors that could impact the future returns of the strategy. The manager’s ability to achieve the target returns is subject to risk factors over which the manager may have no or limited control. There can be no assurance that the Fund will achieve its investment objective, the Target Return or any other objectives. The return achieved may be more or less than the Target Return. The data supporting the Target Return is on file with J.P. Morgan and is available for inspection upon request.
Leverage: Certain of the Fund’s investments may be leveraged, which may adversely affect income earned by the Fund or may result in a loss of principal. The use of leverage creates an opportunity for increased net income, but at the same time involves a high degree of financial risk and may increase the exposure of the Fund or its investments to factors such as rising interest rates, downturns in the economy or deterioration in the condition of the investment collateral. The Fund may be unable to secure attractive financing as market fluctuations may significantly decrease the availability and increase the cost of lever.
J.P. Morgan Asset Management is the brand for the asset management business of JPMorgan Chase & Co. and its affiliates worldwide. This communication is issued by the following entities: in the United Kingdom by JPMorgan Asset Management (UK) Limited, which is regulated by the Financial Conduct Authority; in other EU jurisdictions by JPMorgan Asset Management (Europe) S.à r.l.; in Switzerland by J.P. Morgan (Suisse) SA, which is regulated by the Swiss Financial Market Supervisory Authority FINMA; in Hong Kong by JF Asset Management Limited, or JPMorgan Funds (Asia) Limited, or JPMorgan Asset Management Real Assets (Asia) Limited, all of which are regulated by the Securities and Futures Commission; in India by JPMorgan Asset Management India Private Limited which is regulated by the Securities & Exchange Board of India; in Singapore by JPMorgan Asset Management (Singapore) Limited, which is regulated by the Monetary Authority of Singapore; in Japan by JPMorgan Securities Japan Limited, which is regulated by the Financial Services Agency; in Australia by JPMorgan Asset Management (Australia) Limited, which is regulated by the Australian Securities and Investments Commission; in Brazil by Banco J.P. Morgan S.A., which is regulated by The Brazilian Securities and Exchange Commission (CVM) and Brazilian Central Bank (Bacen); and in Canada by JPMorgan Asset Management (Canada) Inc., which is a registered Portfolio Manager and Exempt Market Dealer in all Canadian provinces and territories except the Yukon and is also registered as an Investment Fund Manager in British Columbia and Ontario. This communication is issued in the United States by J.P. Morgan Investment Management Inc., which is regulated by the Securities and Exchange Commission. Accordingly this document should not be circulated or presented to persons other than to professional, institutional or wholesale investors as defined in the relevant local regulations. The value of investments and the income from them may fall as well as rise and investors may not get back the full amount invested.
270 Park Avenue, New York, NY 10017
© 2013 JPMorgan Chase & Co. | IS_Implementing the Realization

Asset Allocation Analysis
The Efficient FrontierFebruary 14, 2013 Sunrise Police
8
The Efficient Frontier traces out the portfolios that offer the greatest amount of return for given levels of risk. All portfolios on the frontier are efficient and selection of the proper portfolio depends upon the investor’s goals and tolerance for risk. The diagram below illustrates the concept of efficiency. The “Inefficient Portfolio” does not lie on the frontier because an alternate portfolio can be found that offers more return for the same amount of risk. A second portfolio can be found that offers the same return, but less risk. Both of these “efficient” portfolios are more desirable to investors trying to maximize return and minimize risk.
When calculating the efficient frontier, multiple factors are considered:
• Market expectations for return, risk and correlation of assets • Constraints limiting investment in particular asset classes • Your tax rates
Portfolio optimization is a mathematical technique for finding the portfolios that lie along the efficient frontier. These ideas were developed by Dr. Harry Markowitz and earned him a Nobel Prize in Economics in 1990. These theories are collectively known as Modern Portfolio Theory.

Asset Allocation Analysis
Importance of Asset AllocationFebruary 14, 2013 Sunrise Police
9
Asset allocation policy is the main determinant of total return.
A 1991 study by Brinson, Singer and Beebower investigated the determinants of portfolio performance.1 By studying the quarterly returns of 82 pension plans over a 10-year period, they concluded that:
• The selection which asset classes to invest in and how much to invest in each explained 91.5% of the variation in the plan’s returns.
• Market timing, security selection and other factors combined accounted for only 8.5% of the differences in returns.
1 Brinson, G.P., Singer, B.D. and G.L. Beebower, “Determinants of Portfolio Performance II: An Update”, Financial Analysts Journal, May-June 1991.

Average Final Compensation (AFC)
March 22, 2012 Minutes: Average Final Compensation Calculation (City Programming Error) Mr. Williams explained the background of the situation. In short, the city has always maintained complete control and authority in determining the (AFC) average final calculation for our members. When a member leaves (or requires a calculation) the AFC is calculated by the city and provided to the Board. That data is provided to the Board Actuary who derives the final benefit and the pension options. The final calculation is provided to the member to make a selection (if applicable). Recently a member was provided a benefit estimate. That member raised a concern about the formulation of the AFC. Mr. Williams explained the foregoing procedure to the member, provided him all the back-up material (to include the definition of AFC) and directed him to the city. Mr. Williams learned that as a result of that discussion, the city acknowledged that their definition was incorrectly programmed in their system since apparently October 1, 2000. Mr. Williams suggested three options: Option 1 – The City sends all the historical data on everyone to the administrator He has a system in place and can do the calculations internally and have them reviewed by the Fund Actuary. Option 2 – The City transfer the payroll data directly to the Actuary who will do the calculations, or Option 3 – The Actuary and his staff audit the city system and confirm it is accurately calculating the AFC and then the city recalculate everyone who retired since October 1, 2000. Finally, Mr. Williams stated that all the retirees from October 01, 2000 need to be notified. Ms. Toebe stated for the record that there was no malicious intent at all in doing the calculations. It was strictly an error. She defined what the AFC was prior to October 2000. What the City was using was the best consecutive three years which is how the program was done by MIS and administered by Finance Department. For the most part those best three consecutive years are the last years just as they would be for the best three years. She talked about VIN and overtime and stated that it would not be the last three years. It was brought to her attention and she talked to Mr. Eddy and stated that the calculations were incorrect in situations other than VIN. She stated that she would like to do it on a case by case basis for going forward and they would be doing the best three years as the ordinance states. If anyone wants calculations reviewed that would be no problem, but to go back and look at every single member that retired since October 2000 “really serves no purpose because for the most part their calculations will be accurate”. She stated that it would be impossible for the Board or the Actuary to calculate the benefit because of retroactive payments, etc. She stated that it belongs in payroll to do this. The programming was set up to use consecutive years because that is how the general employees plan is set up. Mr. Berman asked if there is a system in place now that will fix this and Ms. Toebe stated yes – going forward the program has been done and they are utilizing that new program now. Discussion was held on spot checking retirees vs. re-checking all retirees since October 2000. Mr. Amrose feels that all AFC’s will have to be recalculated and if a change is noted, the benefit will be re-calculated. The Board asked Ms. Toebe if it can be done to recalculate all retirees possibly affected. She stated it can be done, but it will take a while. Due to this city error, Mr. Berman asked about the cost involved for Mr. Amrose to sample check. He stated that it will be at their billable rate. He can’t predict how long it will take. Ms. Toebe stated that GRS would have to come on site and it can take an hour per re-calculation. Mr. Amrose stated that to re-check 5 members, it would cost approximately $1,500.00.

Mr. Williams stated that the Board should hear from the Attorney. Mr. Cohen stated that he feels that the issue goes to the Trustees’ Fiduciary responsibility. He feels that this raises some very serious concerns because now we know that the calculations may not have been happening correctly. The Trustees did not breach their fiduciary responsibility but need to use prudence and diligence in examining the issue, determining who has been affected and then looking at what would be the appropriate remedy. He thinks to start by doing a random sampling is fine. At some point, the Board will need to look at all of the affected retirees. Mr. Berman confirmed that he expects the City to look at all of them and our Actuary will look at random sampling. Mr. Cohen stated that once the system is understood by the Fund Actuary and how it is happening, where the problems have been and what to look for, it may not mean that it requires someone at Jeff’s level to look at the rest. Someone might be at a lesser rate. Mr. Cohen stated that this remedying this issue could require a procedural change. Generally speaking for Pension Plans, he likes the final calculation (particularly smaller plans like ours and where the Administrator is not getting the raw data in a way in which it can be manipulated) done by somebody who is beholden to only the Fund. We want to make sure that this is the last time we deal with this issue. Mr. Cohen stated that what the Board is doing is reasonable and diligent. It is ultimately the Fund’s responsibility to pay benefits to the people who are entitled to benefits in the amount in which they are entitled. This is a serious matter, we need to look at it carefully and understand exactly what happened, to make sure it is not going to happen again and we need to make a decision on how to remedy this. Mr. Ransone asked if this request needs to go to the City from Mr. Cohen. Mr. Cohen stated that as long as the minutes reflect the same, it is sufficient. Ms. Toebe stated that she does not feel a letter is necessary. Ms. Toebe stated that if we are looking to change so that everything is done independently, then we would be the only pension plan in the city doing that. This was clearly an inaccuracy that was made because the department was looking at the best consecutive years like it is required to in the other City Pension plans. This plan is unique in that it is the best years, not necessarily consecutive, so that was not picked up in accordance with the ordinance. Now that they know that what they did was incorrect, they are going back and looking at approximately 81 people. She stated that if they send the hard copy to the administrator, he cannot manipulate the data and neither can the Fund actuary. There are payment issues in which years are crossed over and no one would know how to apply them. Mr. Williams clarified that this is her definition of payroll in terms of retroactive payments and how they are applied (when earned not paid). She stated that this was “hammered out” with the previous City Attorney before and she did not want to “go there”. Mr. Berman asked what she meant. Ms. Toebe went on to say that what happened in the past, guys would work a lot of overtime or get retroactive payments and it was decided by the City in conjunction with the pension plan that that retro payment if it crossed over three fiscal years was gonna be applied to the correct fiscal year, not have a big lump sum in the one year because that is not right either. Mr. Williams stated that they are attributing the retroactive to when it was earned and not when it was paid. Mr. Amrose stated that he would need the information carved out and then he can spread it out. Mr. Berman asked who agreed to this definition. Ms. Toebe stated it was when Former City Attorney Jeff Olson was here. Mr. Eddy stated that he was on the Board then. Mr. Olson was the City Attorney and he remembers changing the calculations on four or five people in the DROP by minimal amounts. Afterwards, the City sent a letter (Klausner or Linn) to the Board saying that if we did not change it back, they would sue the Board. Our Attorney at the time asked if it was really worth the fight for a few dollars for these guys and if they have an individual problem with it, let the PBA go ahead and contact the City.

Ms. Toebe stated that they knew where the breakdown was and why it broke down now so they are correcting it now and they will go back and look at the other people and they will apply the new definition to those estimated 81 people. Mr. Eddy asked Mr. Amrose if they do this for other Cities and he said that one other city where the definition of average final compensation is like this, but not exactly like this. They built a program and it is complicated. Mr. Cohen stated that it bothered him when Ms. Toebe mentioned that Mr. Williams or Mr. Amrose would not have the intimate knowledge to be able to do the calculation. Mr. Cohen said we need to understand exactly how the calculations are being done and have confidence that they are being done correctly. Motion to have the city re-calculate all retirees from October 01, 2000 to date and have the Actuary and staff come in and look at the programming and methodology comparing the old AFC’s to the new AFC’s, by Mr. Ransone, seconded by Mr. Bettencourt. Motion passed 4-0. Motion to have Dave send out a letter updating members (from October 01, 2000) that may be affected, by Mr. Ransone, seconded by Mr. Berman. Motion passed 4-0. November 1, 2012 Minutes: AFC Update – Mr. Jeff & Mrs. Trisha Amrose - GRS Mr. Amrose briefed the Board regarding the review of the city’s procedures determining the Average Final Compensation. During the onsite inspection at the City of Sunrise Finance Department it was determined that the City is now using the following method: The City is finding the highest twelve month period via the computer system. Years two and three are being identified manually. Further, it was learned that once the AFC was identified by the City, any retroactive payments that were earned outside of the three year period were being backed out. Because of that action the AFC may not be accurate. Mr. Amrose concluded by saying that the highest three years may not be the best three year average. Mr. Amrose provided a couple of examples for the Board. Mrs. Amrose indicated that the City recalculated every retiree since October 01, 2000. However, the City is holding off on the release of that information until the city’s methodology is approved by the Board. After discussion among the Board, the methodology was still in question and was not approved by the Board. Mr. Amrose will communicate his findings in written form to the Board Attorney.