12.510 Introduction to Seismology Spring 2008 For ... May, 2, 2008 M 1 This is the last lecture in...
13
MIT OpenCourseWare http://ocw.mit.edu 12.510 Introduction to Seismology Spring 2008 For information about citing these materials or our Terms of Use, visit: http://ocw.mit.edu/terms.
Transcript of 12.510 Introduction to Seismology Spring 2008 For ... May, 2, 2008 M 1 This is the last lecture in...

MIT OpenCourseWare http://ocw.mit.edu
12.510 Introduction to Seismology Spring 2008 For information about citing these materials or our Terms of Use, visit: http://ocw.mit.edu/terms.

12.510 May, 2, 2008 M
1
This is the last lecture in 12.510 2008. It includes a review of the moment tensor, focal
mechanisms, radiation patter, seismic source, magnitude, magnitude saturation, and moment
magnitude.
A quick review of the Moment Tensor and focal mechanisms
For a point source at 𝒙, 𝒕 the solution for the equation of motion is expressed with the Green’s
function 𝑮(𝒙, 𝒕):
𝑢 𝑥, 𝑡 𝐷𝑖𝑠𝑝𝑙𝑎𝑐𝑒𝑚𝑒𝑡
= 𝑑𝑡 𝑖𝑛𝑡𝑔𝑟𝑎𝑡𝑒 𝑜𝑣𝑒𝑟 𝑡𝑒 𝑠𝑝𝑎𝑐𝑖𝑎𝑙 𝑡𝑖𝑚𝑒 𝑓𝑢𝑛𝑐𝑡𝑖𝑜𝑛
𝐺(𝑥, 𝑡 − 𝑡 , 𝑥, 0)𝑠𝑝𝑎𝑡𝑖𝑎𝑙 𝑒𝑥𝑡𝑒𝑛𝑡 𝑜𝑓 𝑠𝑜𝑢𝑟𝑐𝑒
∗ 𝑓 𝑥 , 𝑡 𝑠𝑜𝑢𝑟𝑐𝑒 𝑓𝑢𝑛𝑐𝑡𝑖𝑜𝑛
𝑑𝑥 . (1)
The force is described by the following relation:
𝑓𝑖 = 𝐴𝛿 𝑥 − 𝑥 ∗ 𝛿 𝑡 − 𝑡 ∗ 𝛿𝑖𝑛 ; (2)
where𝐴 is the amplitude, 𝒕, 𝒕 is the time, (𝒙,𝒙 ) is the position, and n is the direction.
Substituting equation (2) in the equation of motion and then solving for the displacement (u)
resulting from the wave motion due to a point source, leads to the following relations:
𝑢𝑖 𝑥, 𝑡 = 𝐺𝑖𝑗 𝑥, 𝑡; 𝑥 , 𝑡 𝑓𝑗 𝑥 , 𝑡 ,
𝑢 𝑥, 𝑡 ~𝐺(𝑥, 𝑡; 𝑥 , 𝑡 ); 𝑢 𝑥, 𝑡 =𝜕
𝜕𝑥∗ 𝐺𝑖𝑗 (𝑥, 𝑡, 𝑥 , 𝑡 )𝑀𝑗𝑘 ;
(3)
where 𝑢𝑖 is the displacement, 𝑓𝑗 is the force vector. Green’s function gives the displacement at
point x that results from the unit force function applied at point x . Internal forces 𝑓 must act in
opposing directions −𝑓, at a distance d so as to conserve momentum (force couple). For angular
momentum conservation, a complementary couple balances the double couple forces. Figure 1
shows nine different force couples for the components of the moment tensor.

12.510 May, 2, 2008 M
2
Figure 1: Different force couples for the components of the moment tensor (Source: Shearer,
1999)
Single couple Double force couple
Figure 2: Single and double couple
Conserve momentum (angular) force couple
Moment Tesnor
Starting with defining the moment tensor as:
𝑀𝑖𝑗 = 𝑀11 𝑀12 𝑀13
𝑀21 𝑀22 𝑀23
𝑀31 𝑀32 𝑀33
;
(4)
−𝑓
𝑓
𝑑
𝑀𝑥𝑦
𝑀𝑥𝑦
𝑀𝑦𝑥

12.510 May, 2, 2008 M
3
where Mij represents a pair of opposing forces pointing in the direction, separated in the 𝑗
direction. Its magnitude is the product 𝑓𝑑 [unit: Nm] which is called seismic moment.
For angular momentum conservation, the condition Mij = Mji should be satisfied, so the
momentum tensor is symmetric. Therefore we have only six independent elements. This moment
tensor represents the internally generated forces that can act at a point in an elastic medium.
The displacement for a force couple with a distance d in the xkdirection is given by
𝑢𝑖 𝑥, 𝑡 = 𝐺𝑖𝑗 𝑥, 𝑡, 𝑥 , 𝑡 𝑓𝑗 𝑥 , 𝑡 − 𝐺𝑖𝑗 𝑥, 𝑡, 𝑥 − 𝑥 𝑑, 𝑡 𝑓𝑗 𝑥 , 𝑡 =𝜕𝐺𝑖𝑗 𝑥, 𝑡, 𝑥 , 𝑡
𝜕𝑥𝑘𝑓𝑗 𝑥 , 𝑡 𝑑.
(5)
The last term can be replaced by moment tensor to get the displacement u,
𝑢𝑖 𝑥, 𝑡 =𝜕𝐺𝑖𝑗 𝑥 ,𝑡,𝑥 ,𝑡
𝜕𝑥𝑘𝑀𝑗𝑘 (𝑥 , 𝑡 ).
There is a linear relationship between the displacement and the components of the moment
tensor that involves the spatial derivatives of the Green’s functions. We can see the internal
force 𝑓 is proportional to the spatial derivative of moment tensor when compared equation
(3a) with (6).
(6)
Seismic moment
𝑓𝑗 ~𝜕
𝜕𝑥𝑘𝑀𝑗𝑘
(7)
Let’s consider a right-lateral movement on a vertical fault oriented in the x1
direction and the
corresponding moment tensor is given by
𝑀 = 0 𝑀12 0
𝑀21 0 00 0 0
= 0 𝑀0 0𝑀0 0 00 0 0
,
where 𝑀0 = 𝜇𝐷𝑠 called scalar seismic moment which is the best measure of earthquake size
and energy release, μ is shear modulus, 𝐷 = 𝐷𝑠/𝐿 is average displacement, and s is area
of the fault. M0 can be time dependent, so 𝑀0 = 𝜇𝐷 𝑡 𝑠(𝑡) . The right-hand side time
dependent terms become source time function, 𝑥(𝑡), thus the seismic moment function is
given by:
(8)
𝑀(𝑡)~𝜇𝐷 𝑡 𝑠(𝑡). (9)

12.510 May, 2, 2008 M
4
We can diagonalize the moment matrix (equation 8) to find principal axes. In this case, the
principal axes are at 45° to the original x1
and x2
axes, we get:
𝑀 = 𝑀0 0 00 𝑀0 00 0 0
.
Principal axes become tension and pressure axis. The above matrix represents that 1x′
coordinate is the tension axis, T, and 2x′ is the pressure axis, P. (see Figure 3)
(10)
Figure 3: The double-coupled forces and their rotation along the principal axes.(Source: Shearer,
1999)
Radiation Patterns
Figure 4: Radial componet
Flip goes to zero before it flips again
12.510 May, 2, 2008 M
5
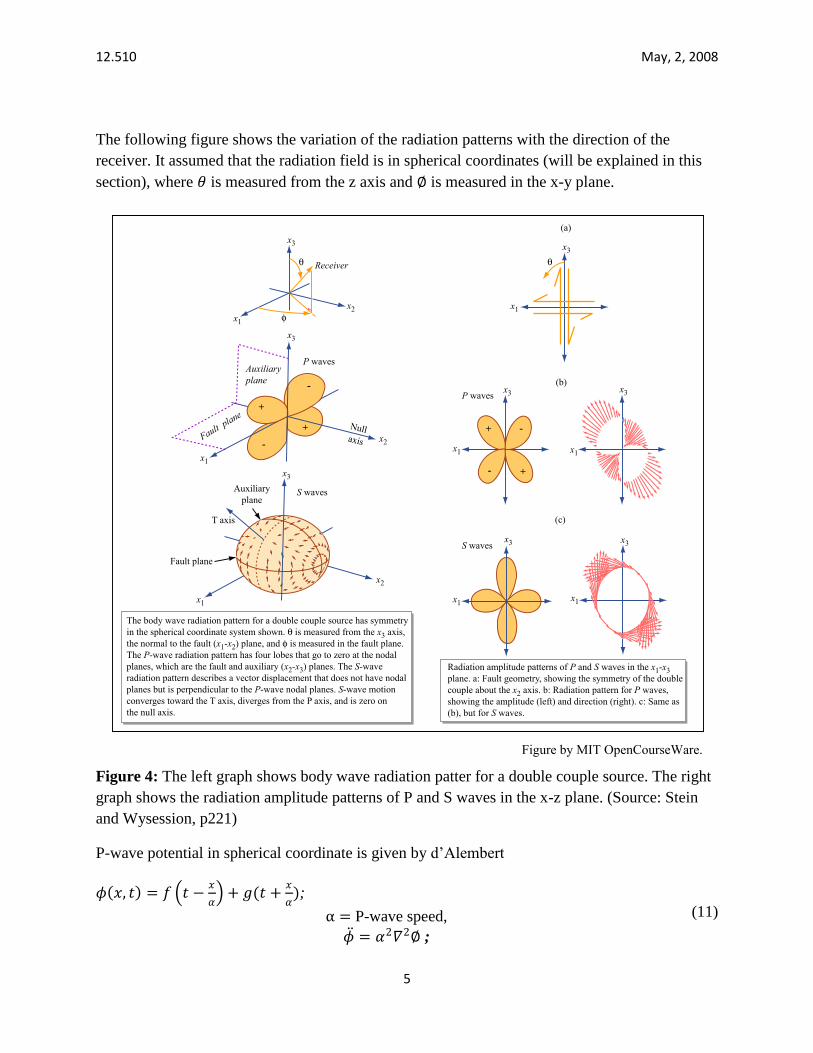
The following figure shows the variation of the radiation patterns with the direction of the
receiver. It assumed that the radiation field is in spherical coordinates (will be explained in this
section), where 𝜃 is measured from the z axis and ∅ is measured in the x-y plane.
Figure 4: The left graph shows body wave radiation patter for a double couple source. The right
graph shows the radiation amplitude patterns of P and S waves in the x-z plane. (Source: Stein
and Wysession, p221)
P-wave potential in spherical coordinate is given by d’Alembert
𝜙 𝑥, 𝑡 = 𝑓 𝑡 −𝑥
𝛼 + 𝑔(𝑡 +
𝑥
𝛼);
α = P-wave speed,
𝜙 = 𝛼2𝛻2∅ ;
(11)
θ θ
φx1
x1
x1
x1
x3
x2
S wavesAuxiliaryplane
T axis
Fault plane
x2
x2
x3
x3 x3
x1
x1 x1
x3
x1
x3 x3
x3
Receiver
+
+
-
+
+
-
-
-
Nullaxis
P waves
P waves
S waves
Auxiliaryplane
Fault plane
(a)
(b)
(c)
The body wave radiation pattern for a double couple source has symmetryin the spherical coordinate system shown. θ is measured from the x3 axis,the normal to the fault (x1-x2) plane, and φ is measured in the fault plane. The P-wave radiation pattern has four lobes that go to zero at the nodal planes, which are the fault and auxiliary (x2-x3) planes. The S-wave radiation pattern describes a vector displacement that does not have nodal planes but is perpendicular to the P-wave nodal planes. S-wave motion converges toward the T axis, diverges from the P axis, and is zero on the null axis.
Radiation amplitude patterns of P and S waves in the x1-x3plane. a: Fault geometry, showing the symmetry of the double couple about the x2 axis. b: Radiation pattern for P waves, showing the amplitude (left) and direction (right). c: Same as(b), but for S waves.
Figure by MIT OpenCourseWare.

12.510 May, 2, 2008 M
6
r is the distance from the point source, and τ is time residual. Therefore, the displacement field is
given by the gradient of the displacement potential 𝑢 =𝜕𝜙
𝜕𝑟,
Spherical medium
In spherical coordinates, far field displacement is given by
∅(𝑥, 𝑡) =𝑓(𝑡−
𝑟
𝛼)
𝑟; (12)
where r is the distance from the point source, and τ is time residual.
Then we use Helmholtz potential;
𝑢 = 𝛻∅ + 𝛻 × 𝜓, 𝛻.𝜓 = 0,
the displacement field is given by the gradient of the displacement potential 𝑢 =𝜕𝜙
𝜕𝑟, which
leads to the following equation:
(13)
𝑢 𝑥, 𝑡 = 1
𝑟2 𝑓 𝜏
𝐼
+ 1
𝑟𝛼 𝜕𝑓 𝜏
𝜕𝜏 𝐼𝐼
. (14)
The first term in the right hand side is near field displacement because of the decay as 1
𝑟2 and the
second term is far field displacement with the decay as 1
𝑟 . When we consider the relation
between internal force and moment tensor given by equation (9), we can find that the near field
term has no time dependence but the far field term has time dependence. The relations are given
by:
𝑓 ~𝜕𝑀
𝜕𝑥,𝜕𝑓
𝜕𝜏~𝜕𝑀
𝜕𝜏 ~𝑀 𝑡
(15)
Therefore, the near field term represents the permanent static displacement due to the source and
the far field term represents the dynamic response or transient seismic waves that are radiated by
the source that cause no permanent displacement. Figure 5 represents the near and far field
behaviors.
in summary
I ~1
r near field solution Static displacement
II ~1
r far field solution transit displacement
M t = moment time function

12.510 May, 2, 2008 M
7
Figure 5: The relationships between near-field and far-field displacement and velocity (Source:
Shearer, 1999).
Figure 6: Radial component
In spherical coordinates, the far field displacement is given by:
𝑢𝑟 𝑥, 𝑡 =1
4𝜋𝜌𝛼2𝑟𝑀 (𝑡 −
𝑟
𝛼) 𝑠𝑖𝑛 2𝜃 𝑐𝑜𝑠 𝜑 𝑟𝑎𝑑𝑖𝑎𝑡𝑖𝑜𝑛 𝑝𝑎𝑡𝑡𝑒𝑟𝑛
,
~1
𝑟𝑀 (𝑡 −
𝑟
𝛼).
(16)
The first amplitude term decays as 1
𝑟 . The second term reflects the pulse radiated from the fault,
𝑀 𝑡 , which propagates away with the P-wave speed α and arrives at a distance 𝑟 at time 𝑡 −𝑟
𝛼 .
𝑀 𝑡 is called the seismic moment rate function or source time function. Its integration form in
𝑢𝑟
𝑢𝑧 𝑢𝑡

12.510 May, 2, 2008 M
8
terms of time is given by equation (9). The final term describes the P-wave radiation pattern
depedig on the two nodal planes. The first term describes P-wave radiation pattern depending on
the two angles (𝜃,𝜙). At 𝜃 = 𝜙 = 90° , the siplacement is zero on the two nodal planes. The
maximum amplitudes are between the two nodal planes. Figure 8 shows the far-field radiation
pattern for P-waves and S-waves for a double-couple source.
Figure 7: The far-field radiation pattern for P-waves (top) and S-waves (bottom) for a double-
couple source (Source: Shearer, 1999).
Magnitude
Seismic Source we have to find the location

12.510 May, 2, 2008 M
9
Surface wave mechanisms
Figure 8: Magitude
Note: Please read Stein and Wysession, Chapter 4, for details.
Figure 9
1. distance
2. radiation pattern
3. ”Medium”
a. Reflection/transmissions
b. Anisotropy
c. Heterogeneity
d. Unelasticity (attenuation)
The first measure is the magnitude, which is based on the amplitude of the waves recorded on a
seismogram. The wave amplitude reflects the earthquake size once the amplitudes are corrected
for the decrease with distance due to geometric spreading and attenuation. Magnitude scales have
the general form:
𝑀 = 𝑙𝑜𝑔 𝐴
𝑇 + 𝑓 ,∆ + 𝐶
(17)
where A is amplitude of the signal , T is dominant period, f is correction for the variation of
amplitude with the earthquake’s depth h, distance Δ from the seismometer, and C is the regional
scale factor.
For global studies, the primary magnitude scales are:
p-wave
𝑀𝑏
Surface wave
𝑀𝑠

12.510 May, 2, 2008 M
10
The body wave magnitude mb: measured from the early portion of the body wave train:
Mb = log A
T + Q h,∆
(18)
Measurements of mb depend on the seismometer used and the portion of the wave train
measured. Common practice uses a period of ~1sec for the P and ~4s for the S.
The surface wave magnitude Ms: measured using the largest amplitude (zero to peak) of the
surface waves
where the first form is general and the second uses the amplitudes of Rayleigh waves with a
period of 20 sec, which often have the largest amplitudes.
Limitations
These relations are empirical and thus no direct connection to the physics of earthquakes.
Additionally, body and surface wave magnitudes do not correctly reflect the size of large
earthquakes.
Magnitude saturation
It’s a general phenomenon for Mb above about 6.2 and Ms above about 8.3.
Figure 10 shows the theoretical source spectra of surface and body waves. The two are identical
below the -2
corner frequency. As the fault length increases, the seismic moment increases and
the corner frequency moves to the left, to lower frequencies. The moment M0 determining the
zero-frequency level becomes larger. However, Ms, measured at 20 s, depends on the spectral
amplitude at this period. For earthquakes with moments less than 1026
dyn-cm, a 20s period
corresponds to the flat part of the spectrum, so Ms increases with moment. But for larger
moments, 20s is to the right of the first corner frequency, so Ms does not increase as the same
rate as the moment. Once the moment exceeds 5.1027
dyn-cm, 20 s is to the right of the second
corner. Thus Ms saturates at about 8.2 even if the moment increases. It is similar for body wave
magnitude, which depends on the amplitude at a period of 1s. Because this period is shorter that
20s, mb saturates at a lower moment (~1025
dyn-cm), and remains at about 6 even for larger
earthquakes.
𝑀𝑠 = 𝑙𝑜𝑔 𝐴
𝑇 + 1.661 𝑙𝑜𝑔 ∆ + 3.3,
𝑀𝑠 = 𝑙𝑜𝑔 𝐴20 + 1.661 𝑙𝑜𝑔 ∆ + 2.0,
(19)

12.510 May, 2, 2008 M
11
Figure 10: Saturated body and surface wave magnitudes (Source: Stein and Wysession, p221).
Moment magnitude
A simple solution by Kanamori (equation 21) defines the magnitude scale based on the seismic
moment. The moment magnitude:
𝑀𝑏 = 𝑇~1𝑠𝑒𝑐
𝑀𝑐 = 𝑇~20𝑠𝑒𝑐
(20)
𝑀𝑤 =𝑙𝑜𝑔𝑀0
1.5− 10.73
(21)
This expression gives a magnitude directly tied to earthquake source processes that does not
saturate. Mw is the common measure for large earthquakes. Estimation of M0 requires more
analysis than for mb or Ms. However, semi-automated programs like the Harvard CMT project

12.510 May, 2, 2008 M
12
regularly compute moment magnitude for most earthquakes larger than Mw5
(http://www.seismology.harvard.edu/projects/CMT/ ).
An example of the Harvard CMT catalog:
010104J BALI REGION, INDONESIA
Date: 2004/ 1/ 1
Centroid Time: 20:59:33.6
GMT Lat= -8.45
Lon= 115.83
Depth= 35.6
Half duration= 2.0
Centroid time minus hypocenter time: 1.7
Moment Tensor: Expo=24 1.690 -2.190 0.503 2.530 1.590 5.520
Mw = 5.8
Mb = 5.5 Ms = 5.4
Scalar Moment = 6.58e+24
Fault plane: strike=349 dip=63 slip=162
Fault plane: strike=87 dip=74 slip=28
Updated by: Sami Alsaadan
Sources: notes from May 2, 2005, by Lori Eich.. May 4, 2005, Kang Hyeun Ji. May 9, 2005, by
Sophie Michelet. May 2, 2008 lecture.
“An Introduction to Seismology, Earthquakes, And Earth Structure” by Stein &Wysession
(2007).