12.1 SOLUTIONS 861 CHAPTER TWELVE - Valenciafd.valenciacollege.edu/file/tsmith143/ch12.pdf · 12.1...
46
12.1 SOLUTIONS 861 CHAPTER TWELVE Solutions for Section 12.1 Exercises 1. The distance of a point P =(x, y, z) from the yz-plane is |x|, from the xz-plane is |y|, and from the xy-plane is |z|. So, B is closest to the yz-plane, since it has the smallest x-coordinate in absolute value. B lies on the xz-plane, since its y-coordinate is 0. B is farthest from the xy-plane, since it has the largest z-coordinate in absolute value. 2. The distance of a point P =(x, y, z) from the yz-plane is |x|, from the xz-plane is |y|, and from the xy-plane is |z|. So A is closest to the yz-plane, since it has the smallest x-coordinate in absolute value. B lies on the xz-plane, since its y-coordinate is 0. C is farthest from the xy-plane, since it has the largest z-coordinate in absolute value. 3. Your final position is (1, -1, -3). Therefore, you are in front of the yz-plane, to the left of the xz-plane, and below the xy-plane. 4. Your final position is (1, -1, 1). This places you in front of the yz-plane, to the left of the xz-plane, and above the xy-plane. 5. The point P is √ 1 2 +2 2 +1 2 = √ 6=2.45 units from the origin, and Q is √ 2 2 +0 2 +0 2 =2 units from the origin. Since 2 < √ 6, the point Q is closer. 6. The distance formula: d = p (x2 - x1) 2 +(y2 - y1) 2 +(z2 - z1) 2 gives us the distance between any pair of points (x1,y1,z1) and (x2,y2,z2). Thus, we find Distance from P1 to P2 =2 √ 2 Distance from P2 to P3 = √ 6 Distance from P1 to P3 = √ 10 So P2 and P3 are closest to each other. 7. The equation is x 2 + y 2 + z 2 = 25 8. The equation is (x - 1) 2 +(y - 2) 2 +(z - 3) 2 = 25 9. The graph is a plane parallel to the yz-plane, and passing through the point (-3, 0, 0). See Figure 12.1. 31 x y z x = -3 -3 Figure 12.1 x y z y =1 1 Figure 12.2 10. The graph is a plane parallel to the xz-plane, and passing through the point (0, 1, 0). See Figure 12.2. 11. The graph is all points with y =4 and z =2, i.e., a line parallel to the x-axis and passing through the points (0, 4, 2); (2, 4, 2); (4, 4, 2) etc. See Figure 12.3.
Transcript of 12.1 SOLUTIONS 861 CHAPTER TWELVE - Valenciafd.valenciacollege.edu/file/tsmith143/ch12.pdf · 12.1...
12.1 SOLUTIONS 861
CHAPTER TWELVE
Solutions for Section 12.1
Exercises
1. The distance of a point P = (x, y, z) from the yz-plane is |x|, from the xz-plane is |y|, and from the xy-plane is |z|.So, B is closest to the yz-plane, since it has the smallest x-coordinate in absolute value. B lies on the xz-plane, since itsy-coordinate is 0. B is farthest from the xy-plane, since it has the largest z-coordinate in absolute value.
2. The distance of a point P = (x, y, z) from the yz-plane is |x|, from the xz-plane is |y|, and from the xy-plane is |z|.So A is closest to the yz-plane, since it has the smallest x-coordinate in absolute value. B lies on the xz-plane, since itsy-coordinate is 0. C is farthest from the xy-plane, since it has the largest z-coordinate in absolute value.
3. Your final position is (1,−1,−3). Therefore, you are in front of the yz-plane, to the left of the xz-plane, and below thexy-plane.
4. Your final position is (1,−1, 1). This places you in front of the yz-plane, to the left of the xz-plane, and above thexy-plane.
5. The point P is√
12 + 22 + 12 =√
6 = 2.45 units from the origin, and Q is√
22 + 02 + 02 = 2 units from the origin.Since 2 <
√6, the point Q is closer.
6. The distance formula: d =√
(x2 − x1)2 + (y2 − y1)2 + (z2 − z1)2 gives us the distance between any pair of points(x1, y1, z1) and (x2, y2, z2). Thus, we find
Distance from P1 to P2 = 2√
2
Distance from P2 to P3 =√
6
Distance from P1 to P3 =√
10
So P2 and P3 are closest to each other.
7. The equation is x2 + y2 + z2 = 25
8. The equation is (x− 1)2 + (y − 2)2 + (z − 3)2 = 25
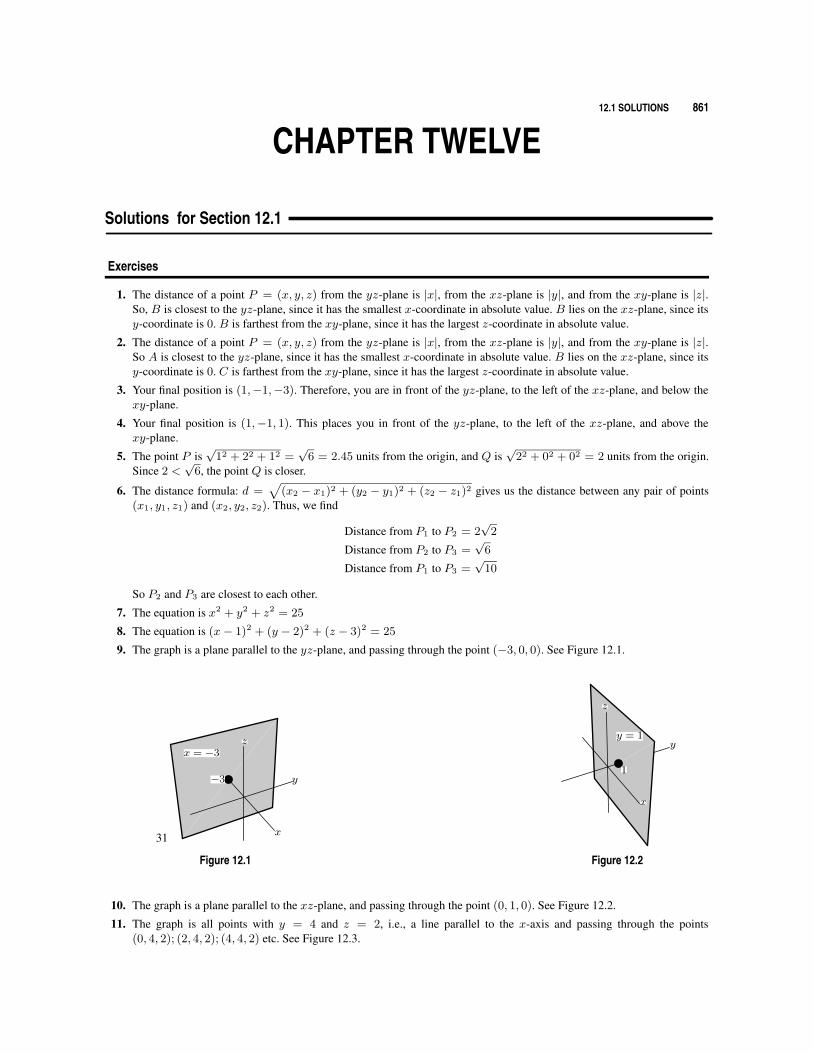
9. The graph is a plane parallel to the yz-plane, and passing through the point (−3, 0, 0). See Figure 12.1.
31 x
y
zx = −3
−3
Figure 12.1
x
y
z
y = 1
1
Figure 12.2
10. The graph is a plane parallel to the xz-plane, and passing through the point (0, 1, 0). See Figure 12.2.
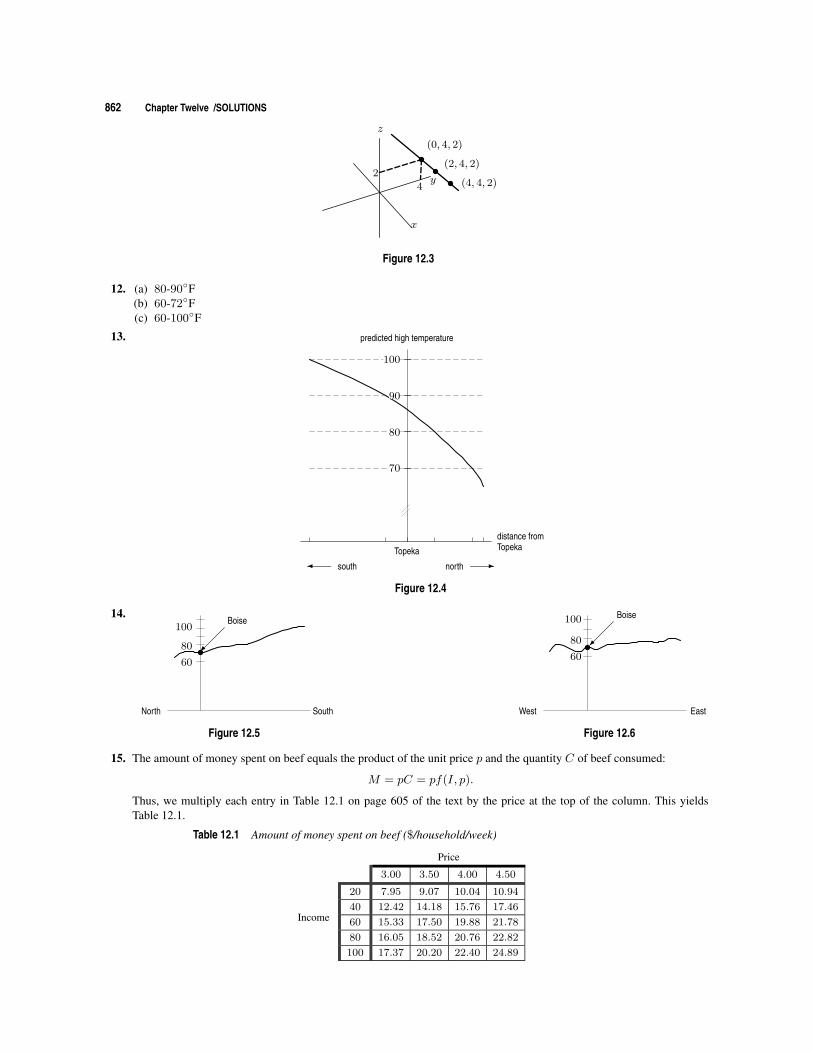
11. The graph is all points with y = 4 and z = 2, i.e., a line parallel to the x-axis and passing through the points(0, 4, 2); (2, 4, 2); (4, 4, 2) etc. See Figure 12.3.
862 Chapter Twelve /SOLUTIONS
z
x
y2
4
(0, 4, 2)
(2, 4, 2)
(4, 4, 2)
Figure 12.3
12. (a) 80-90◦F(b) 60-72◦F(c) 60-100◦F
13.
-north� south
100
90
80
70
Topeka
distance fromTopeka
predicted high temperature
Figure 12.4
14.
North South
60
80
100
Boise
Figure 12.5
West East
60
80
100
Boise
Figure 12.6
15. The amount of money spent on beef equals the product of the unit price p and the quantity C of beef consumed:
M = pC = pf(I, p).
Thus, we multiply each entry in Table 12.1 on page 605 of the text by the price at the top of the column. This yieldsTable 12.1.
Table 12.1 Amount of money spent on beef ($/household/week)
Income
Price
3.00 3.50 4.00 4.50
20 7.95 9.07 10.04 10.94
40 12.42 14.18 15.76 17.46
60 15.33 17.50 19.88 21.78
80 16.05 18.52 20.76 22.82
100 17.37 20.20 22.40 24.89
12.1 SOLUTIONS 863
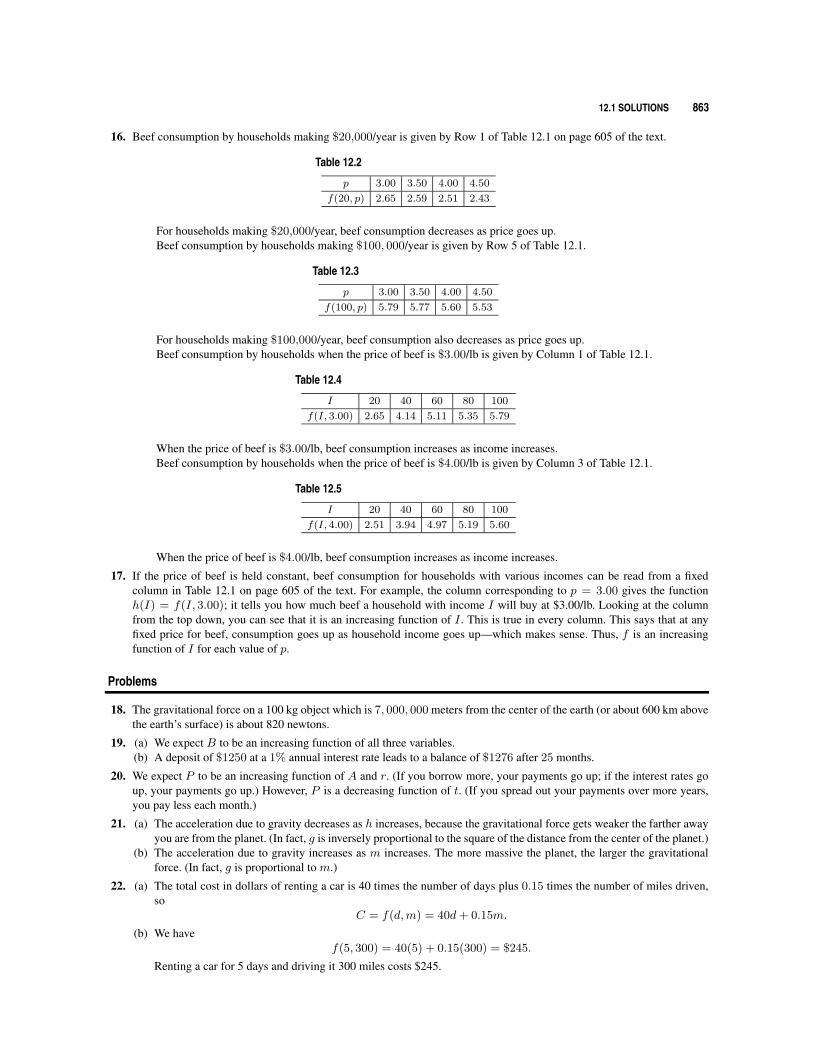
16. Beef consumption by households making $20,000/year is given by Row 1 of Table 12.1 on page 605 of the text.
Table 12.2
p 3.00 3.50 4.00 4.50
f(20, p) 2.65 2.59 2.51 2.43
For households making $20,000/year, beef consumption decreases as price goes up.Beef consumption by households making $100, 000/year is given by Row 5 of Table 12.1.
Table 12.3
p 3.00 3.50 4.00 4.50
f(100, p) 5.79 5.77 5.60 5.53
For households making $100,000/year, beef consumption also decreases as price goes up.Beef consumption by households when the price of beef is $3.00/lb is given by Column 1 of Table 12.1.
Table 12.4
I 20 40 60 80 100
f(I, 3.00) 2.65 4.14 5.11 5.35 5.79
When the price of beef is $3.00/lb, beef consumption increases as income increases.Beef consumption by households when the price of beef is $4.00/lb is given by Column 3 of Table 12.1.
Table 12.5
I 20 40 60 80 100
f(I, 4.00) 2.51 3.94 4.97 5.19 5.60
When the price of beef is $4.00/lb, beef consumption increases as income increases.
17. If the price of beef is held constant, beef consumption for households with various incomes can be read from a fixedcolumn in Table 12.1 on page 605 of the text. For example, the column corresponding to p = 3.00 gives the functionh(I) = f(I, 3.00); it tells you how much beef a household with income I will buy at $3.00/lb. Looking at the columnfrom the top down, you can see that it is an increasing function of I . This is true in every column. This says that at anyfixed price for beef, consumption goes up as household income goes up—which makes sense. Thus, f is an increasingfunction of I for each value of p.
Problems
18. The gravitational force on a 100 kg object which is 7, 000, 000 meters from the center of the earth (or about 600 km abovethe earth’s surface) is about 820 newtons.
19. (a) We expect B to be an increasing function of all three variables.(b) A deposit of $1250 at a 1% annual interest rate leads to a balance of $1276 after 25 months.
20. We expect P to be an increasing function of A and r. (If you borrow more, your payments go up; if the interest rates goup, your payments go up.) However, P is a decreasing function of t. (If you spread out your payments over more years,you pay less each month.)
21. (a) The acceleration due to gravity decreases as h increases, because the gravitational force gets weaker the farther awayyou are from the planet. (In fact, g is inversely proportional to the square of the distance from the center of the planet.)
(b) The acceleration due to gravity increases as m increases. The more massive the planet, the larger the gravitationalforce. (In fact, g is proportional to m.)
22. (a) The total cost in dollars of renting a car is 40 times the number of days plus 0.15 times the number of miles driven,so
C = f(d,m) = 40d+ 0.15m.
(b) We havef(5, 300) = 40(5) + 0.15(300) = $245.
Renting a car for 5 days and driving it 300 miles costs $245.
864 Chapter Twelve /SOLUTIONS
23. (a) According to Table 12.2 of the problem, it feels like −19◦F.(b) A wind of 20 mph, according to Table 12.2.(c) About 17.5 mph. Since at a temperature of 25◦F, when the wind increases from 15 mph to 20 mph, the temperature
adjusted for wind-chill decreases from 13◦F to 11◦F, we can say that a 5 mph increase in wind speed causes an 2◦Fdecrease in the temperature adjusted for wind-chill. Thus, each 2.5 mph increase in wind speed brings about a 1◦Fdrop in the temperature adjusted for wind-chill. If the wind speed at 25◦F increases from 15 mph to 17.5 mph, thenthe temperature you feel will be 13− 1 = 12◦F.
(d) Table 12.2 shows that with wind speed 20 mph the temperature will feel like 0◦F when the air temperature is some-where between 15◦F and 20◦F. When the air temperature drops 5◦F from 20◦F to 15◦F, the temperature adjusted forwind-chill drops 6◦F from 4◦F to −2◦F. We can say that for every 1◦F decrease in air temperature there is about a6/5 = 1.2◦F drop in the temperature you feel. To drop the temperature you feel from 4◦F to 0◦F will take an airtemperature drop of about 4/1.2 = 3.3◦F from 20◦F. With a wind of 20 mph, approximately 20 − 3.3 = 16.7◦Fwould feel like 0◦F.”
24. Table 12.6 Temperature adjusted for wind-chill at20◦F
Wind speed (mph) 5 10 15 20 25Adjusted temperature (◦F) 13 9 6 4 3
Table 12.7 Temperature adjusted for wind-chill at 0◦F
Wind speed (mph) 5 10 15 20 25Adjusted temperature (◦F) −11 −16 −19 −22 −24
25. Each entry is the square of the y coordinate, so a possible formula is
f(x, y) = y2.
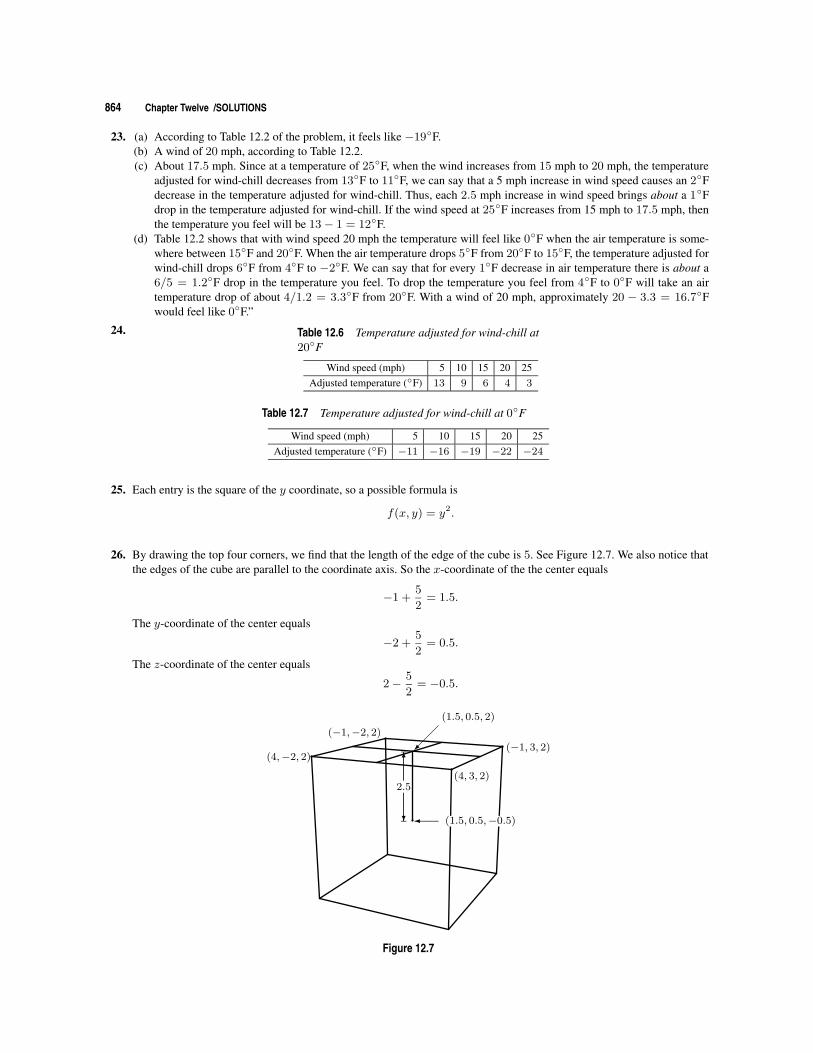
26. By drawing the top four corners, we find that the length of the edge of the cube is 5. See Figure 12.7. We also notice thatthe edges of the cube are parallel to the coordinate axis. So the x-coordinate of the the center equals
−1 +5
2= 1.5.
The y-coordinate of the center equals
−2 +5
2= 0.5.
The z-coordinate of the center equals
2− 5
2= −0.5.
(1.5, 0.5, 2)
(4,−2, 2)
(−1,−2, 2)
(−1, 3, 2)
(4, 3, 2)
6
?
2.5
� (1.5, 0.5,−0.5)
Figure 12.7
12.2 SOLUTIONS 865
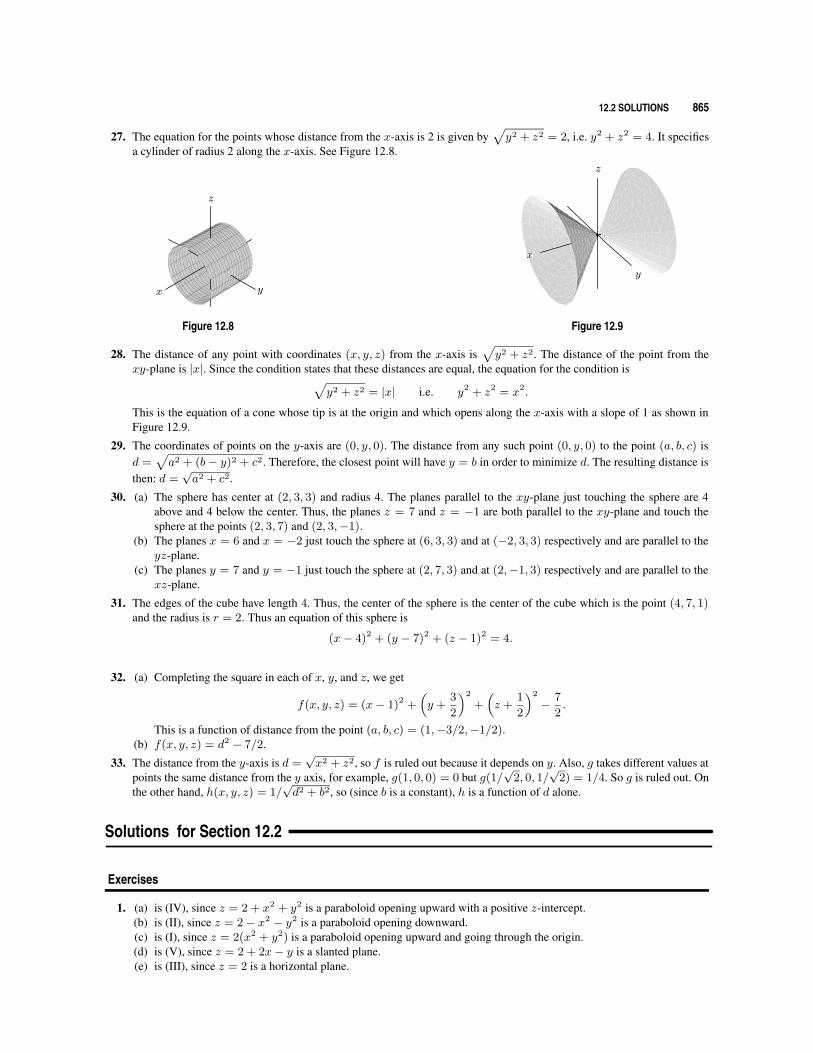
27. The equation for the points whose distance from the x-axis is 2 is given by√y2 + z2 = 2, i.e. y2 + z2 = 4. It specifies
a cylinder of radius 2 along the x-axis. See Figure 12.8.
x y
z
Figure 12.8
x
y
z
Figure 12.9
28. The distance of any point with coordinates (x, y, z) from the x-axis is√y2 + z2. The distance of the point from the
xy-plane is |x|. Since the condition states that these distances are equal, the equation for the condition is√y2 + z2 = |x| i.e. y2 + z2 = x2.
This is the equation of a cone whose tip is at the origin and which opens along the x-axis with a slope of 1 as shown inFigure 12.9.
29. The coordinates of points on the y-axis are (0, y, 0). The distance from any such point (0, y, 0) to the point (a, b, c) isd =
√a2 + (b− y)2 + c2. Therefore, the closest point will have y = b in order to minimize d. The resulting distance is
then: d =√a2 + c2.
30. (a) The sphere has center at (2, 3, 3) and radius 4. The planes parallel to the xy-plane just touching the sphere are 4above and 4 below the center. Thus, the planes z = 7 and z = −1 are both parallel to the xy-plane and touch thesphere at the points (2, 3, 7) and (2, 3,−1).
(b) The planes x = 6 and x = −2 just touch the sphere at (6, 3, 3) and at (−2, 3, 3) respectively and are parallel to theyz-plane.
(c) The planes y = 7 and y = −1 just touch the sphere at (2, 7, 3) and at (2,−1, 3) respectively and are parallel to thexz-plane.
31. The edges of the cube have length 4. Thus, the center of the sphere is the center of the cube which is the point (4, 7, 1)and the radius is r = 2. Thus an equation of this sphere is
(x− 4)2 + (y − 7)2 + (z − 1)2 = 4.
32. (a) Completing the square in each of x, y, and z, we get
f(x, y, z) = (x− 1)2 +(y +
3
2
)2
+(z +
1
2
)2
− 7
2.
This is a function of distance from the point (a, b, c) = (1,−3/2,−1/2).(b) f(x, y, z) = d2 − 7/2.
33. The distance from the y-axis is d =√x2 + z2, so f is ruled out because it depends on y. Also, g takes different values at
points the same distance from the y axis, for example, g(1, 0, 0) = 0 but g(1/√
2, 0, 1/√
2) = 1/4. So g is ruled out. Onthe other hand, h(x, y, z) = 1/
√d2 + b2, so (since b is a constant), h is a function of d alone.
Solutions for Section 12.2
Exercises
1. (a) is (IV), since z = 2 + x2 + y2 is a paraboloid opening upward with a positive z-intercept.(b) is (II), since z = 2− x2 − y2 is a paraboloid opening downward.(c) is (I), since z = 2(x2 + y2) is a paraboloid opening upward and going through the origin.(d) is (V), since z = 2 + 2x− y is a slanted plane.(e) is (III), since z = 2 is a horizontal plane.
866 Chapter Twelve /SOLUTIONS
2. (a) The value of z only depends on the distance from the point (x, y) to the origin. Therefore the graph has a circularsymmetry around the z-axis. There are two such graphs among those depicted in the figure in the text: I and V. Theone corresponding to z = 1
x2+y2 is I since the function blows up as (x, y) gets close to (0, 0).(b) For similar reasons as in part (a), the graph is circularly symmetric about the z-axis, hence the corresponding one
must be V .(c) The graph has to be a plane, hence IV.(d) The function is independent of x, hence the corresponding graph can only be II. Notice that the cross-sections of this
graph parallel to the yz-plane are parabolas, which is a confirmation of the result.(e) The graph of this function is depicted in III. The picture shows the cross-sections parallel to the zx-plane, which have
the shape of the cubic curves z = x3 − constant.
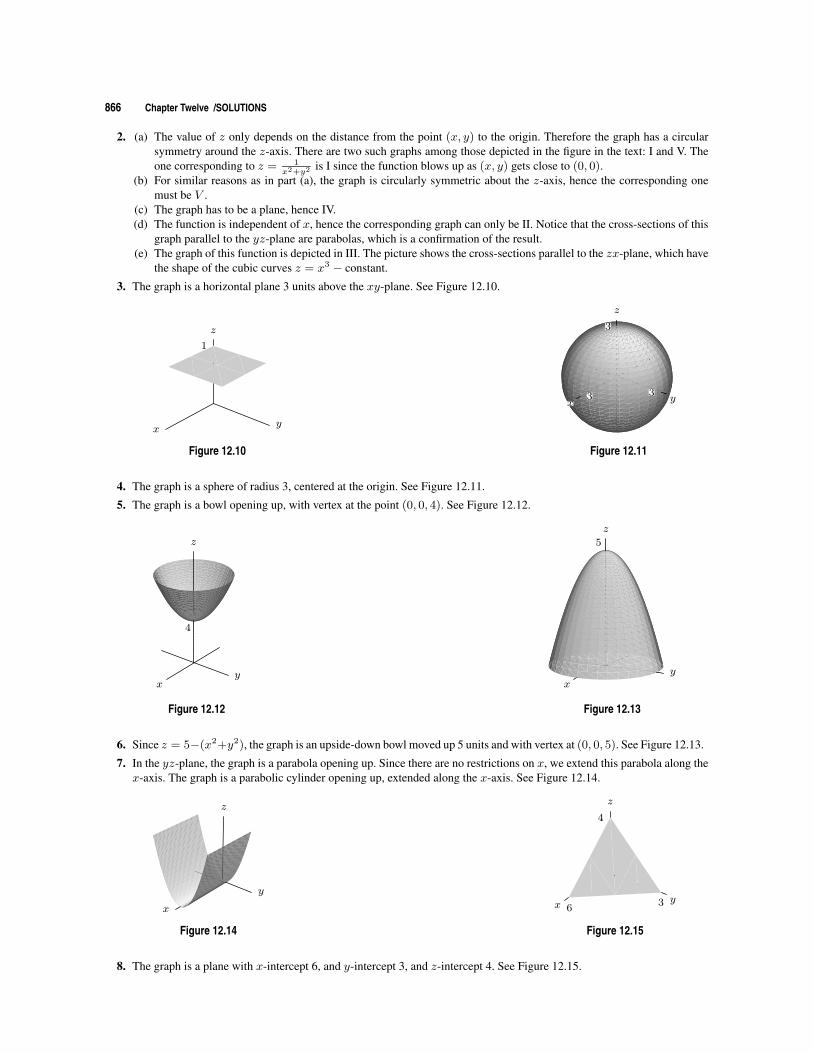
3. The graph is a horizontal plane 3 units above the xy-plane. See Figure 12.10.
1
xy
z
Figure 12.10
3 3
3
x y
z
Figure 12.11
4. The graph is a sphere of radius 3, centered at the origin. See Figure 12.11.
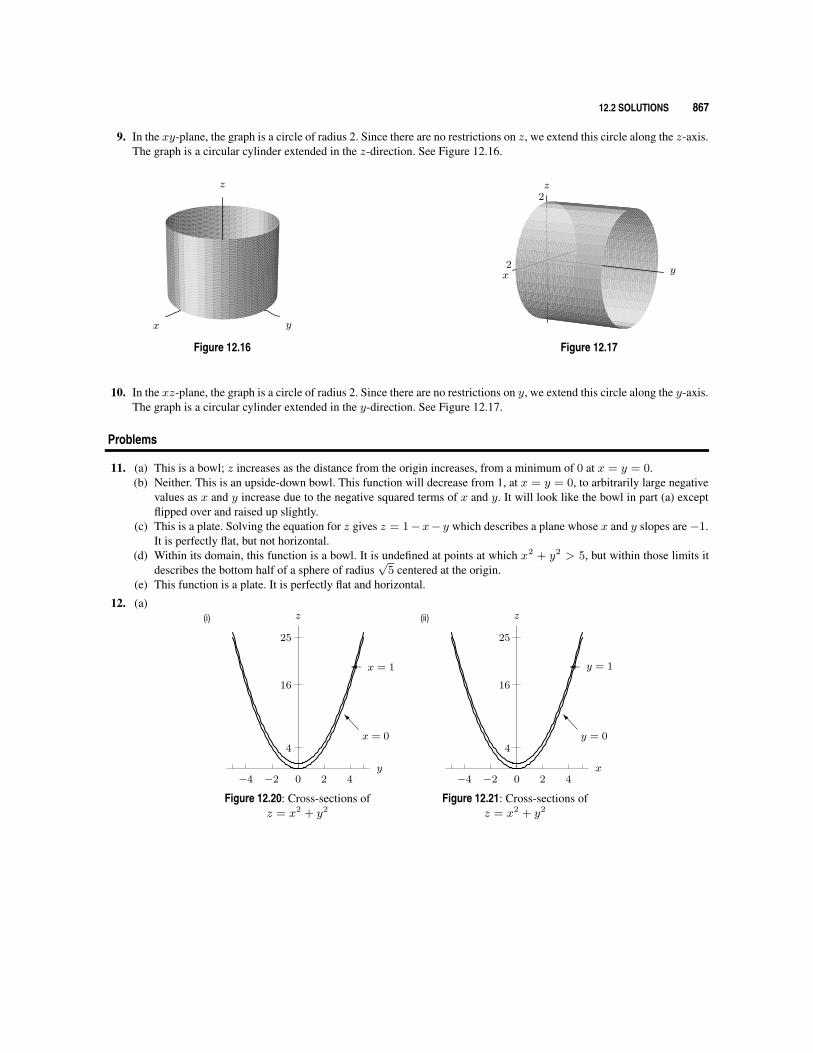
5. The graph is a bowl opening up, with vertex at the point (0, 0, 4). See Figure 12.12.
4
xy
z
Figure 12.12
5
xy
z
Figure 12.13
6. Since z = 5−(x2+y2), the graph is an upside-down bowl moved up 5 units and with vertex at (0, 0, 5). See Figure 12.13.
7. In the yz-plane, the graph is a parabola opening up. Since there are no restrictions on x, we extend this parabola along thex-axis. The graph is a parabolic cylinder opening up, extended along the x-axis. See Figure 12.14.
x
y
z
Figure 12.14
63
4
xy
z
Figure 12.15
8. The graph is a plane with x-intercept 6, and y-intercept 3, and z-intercept 4. See Figure 12.15.
12.2 SOLUTIONS 867
9. In the xy-plane, the graph is a circle of radius 2. Since there are no restrictions on z, we extend this circle along the z-axis.The graph is a circular cylinder extended in the z-direction. See Figure 12.16.
x y
z
Figure 12.16
2
2
xy
z
Figure 12.17
10. In the xz-plane, the graph is a circle of radius 2. Since there are no restrictions on y, we extend this circle along the y-axis.The graph is a circular cylinder extended in the y-direction. See Figure 12.17.
Problems
11. (a) This is a bowl; z increases as the distance from the origin increases, from a minimum of 0 at x = y = 0.(b) Neither. This is an upside-down bowl. This function will decrease from 1, at x = y = 0, to arbitrarily large negative
values as x and y increase due to the negative squared terms of x and y. It will look like the bowl in part (a) exceptflipped over and raised up slightly.
(c) This is a plate. Solving the equation for z gives z = 1−x− y which describes a plane whose x and y slopes are−1.It is perfectly flat, but not horizontal.
(d) Within its domain, this function is a bowl. It is undefined at points at which x2 + y2 > 5, but within those limits itdescribes the bottom half of a sphere of radius
√5 centered at the origin.
(e) This function is a plate. It is perfectly flat and horizontal.
12. (a)
0−2 2−4 4
4
16
25
� x = 1
Ix = 0
y
z(i)
Figure 12.20: Cross-sections ofz = x2 + y2
0−2 2−4 4
4
16
25
� y = 1
Iy = 0
x
z(ii)
Figure 12.21: Cross-sections ofz = x2 + y2
868 Chapter Twelve /SOLUTIONS
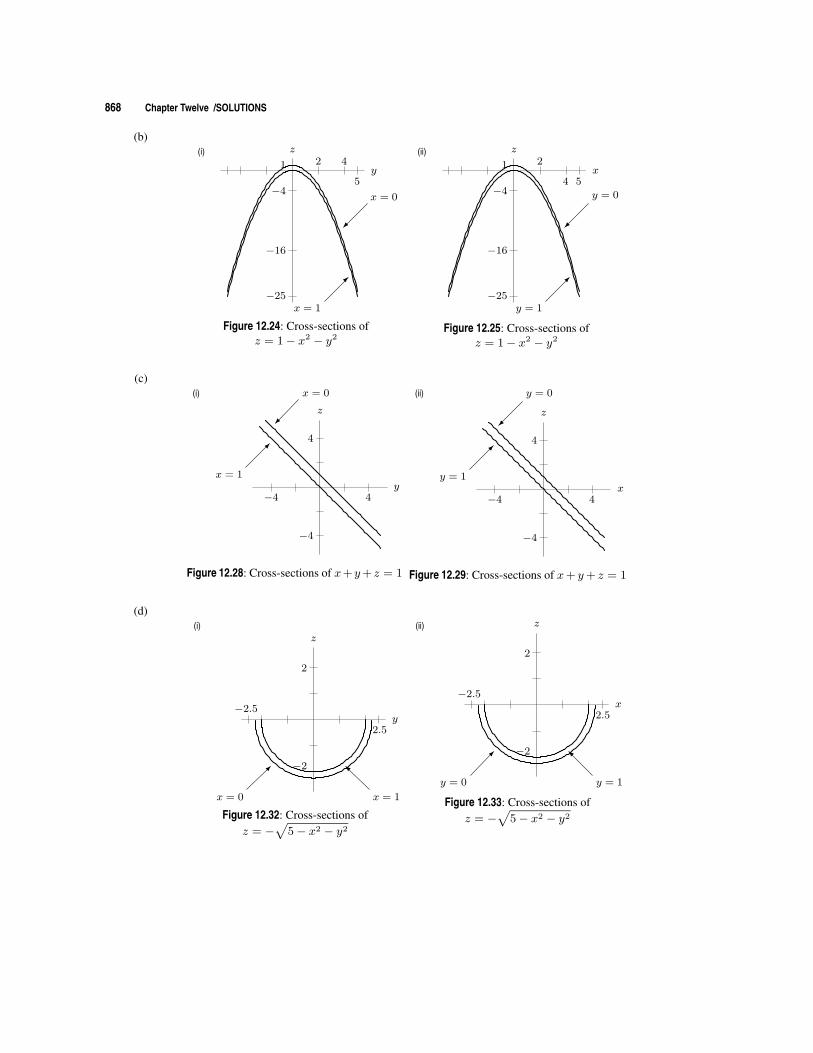
(b)
2 4
5
1
−4
−16
−25�
x = 1
x = 0
y
z(i)
Figure 12.24: Cross-sections ofz = 1− x2 − y2
2
4 5
1
−4
−16
−25�
y = 1
y = 0
x
z(ii)
Figure 12.25: Cross-sections ofz = 1− x2 − y2
(c)
−4 4
4
−4
y
z
x = 0
�
x = 1
(i)
Figure 12.28: Cross-sections of x+y+ z = 1
−4 4
4
−4
x
z
y = 0
�
y = 1
(ii)
Figure 12.29: Cross-sections of x+ y+ z = 1
(d)
−2.5
2.5
−2
2
�
x = 0
I
x = 1
y
z(i)
Figure 12.32: Cross-sections ofz = −
√5− x2 − y2
−2.5
2.5
−2
2
�
y = 0
I
y = 1
x
z(ii)
Figure 12.33: Cross-sections ofz = −
√5− x2 − y2
12.2 SOLUTIONS 869
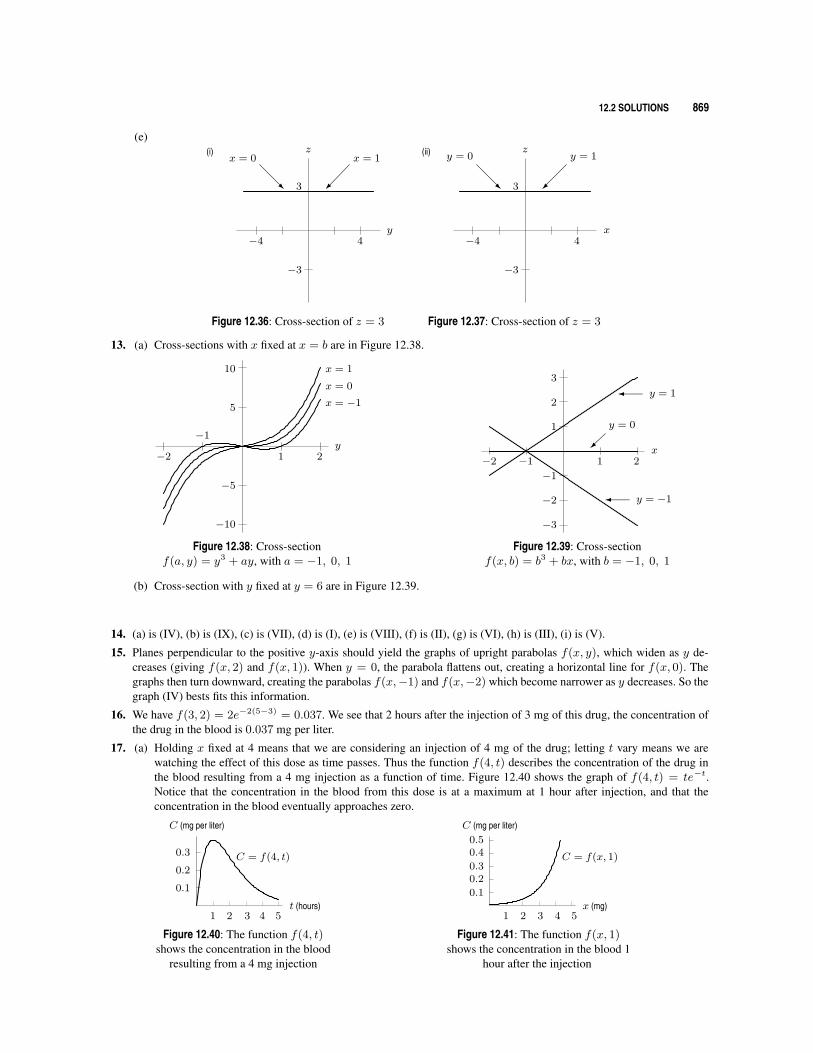
(e)
4−4
−3
3
y
z
R
x = 0
x = 1(i)
Figure 12.36: Cross-section of z = 3
4−4
−3
3
x
z
R
y = 0
y = 1(ii)
Figure 12.37: Cross-section of z = 3
13. (a) Cross-sections with x fixed at x = b are in Figure 12.38.
−1
1−2 2
−5
5
−10
10 x = 1
x = 0
x = −1
y
Figure 12.38: Cross-sectionf(a, y) = y3 + ay, with a = −1, 0, 1
−2 −1 1 2
−3
−2
−1
1
2
3� y = 1
� y = −1
y = 0
x
Figure 12.39: Cross-sectionf(x, b) = b3 + bx, with b = −1, 0, 1
(b) Cross-section with y fixed at y = 6 are in Figure 12.39.
14. (a) is (IV), (b) is (IX), (c) is (VII), (d) is (I), (e) is (VIII), (f) is (II), (g) is (VI), (h) is (III), (i) is (V).
15. Planes perpendicular to the positive y-axis should yield the graphs of upright parabolas f(x, y), which widen as y de-creases (giving f(x, 2) and f(x, 1)). When y = 0, the parabola flattens out, creating a horizontal line for f(x, 0). Thegraphs then turn downward, creating the parabolas f(x,−1) and f(x,−2) which become narrower as y decreases. So thegraph (IV) bests fits this information.
16. We have f(3, 2) = 2e−2(5−3) = 0.037. We see that 2 hours after the injection of 3 mg of this drug, the concentration ofthe drug in the blood is 0.037 mg per liter.
17. (a) Holding x fixed at 4 means that we are considering an injection of 4 mg of the drug; letting t vary means we arewatching the effect of this dose as time passes. Thus the function f(4, t) describes the concentration of the drug inthe blood resulting from a 4 mg injection as a function of time. Figure 12.40 shows the graph of f(4, t) = te−t.Notice that the concentration in the blood from this dose is at a maximum at 1 hour after injection, and that theconcentration in the blood eventually approaches zero.
1 2 3 4 5
0.1
0.2
0.3 C = f(4, t)
C (mg per liter)
t (hours)
Figure 12.40: The function f(4, t)shows the concentration in the blood
resulting from a 4 mg injection
1 2 3 4 5
0.1
0.20.3
0.40.5
C = f(x, 1)
x (mg)
C (mg per liter)
Figure 12.41: The function f(x, 1)shows the concentration in the blood 1
hour after the injection
870 Chapter Twelve /SOLUTIONS
(b) Holding t fixed at 1 means that we are focusing on the blood 1 hour after the injection; letting x vary means weare considering the effect of different doses at that instant. Thus, the function f(x, 1) gives the concentration ofthe drug in the blood 1 hour after injection as a function of the amount injected. Figure 12.41 shows the graph off(x, 1) = e−(5−x) = ex−5. Notice that f(x, 1) is an increasing function of x. This makes sense: If we administermore of the drug, the concentration in the bloodstream is higher.
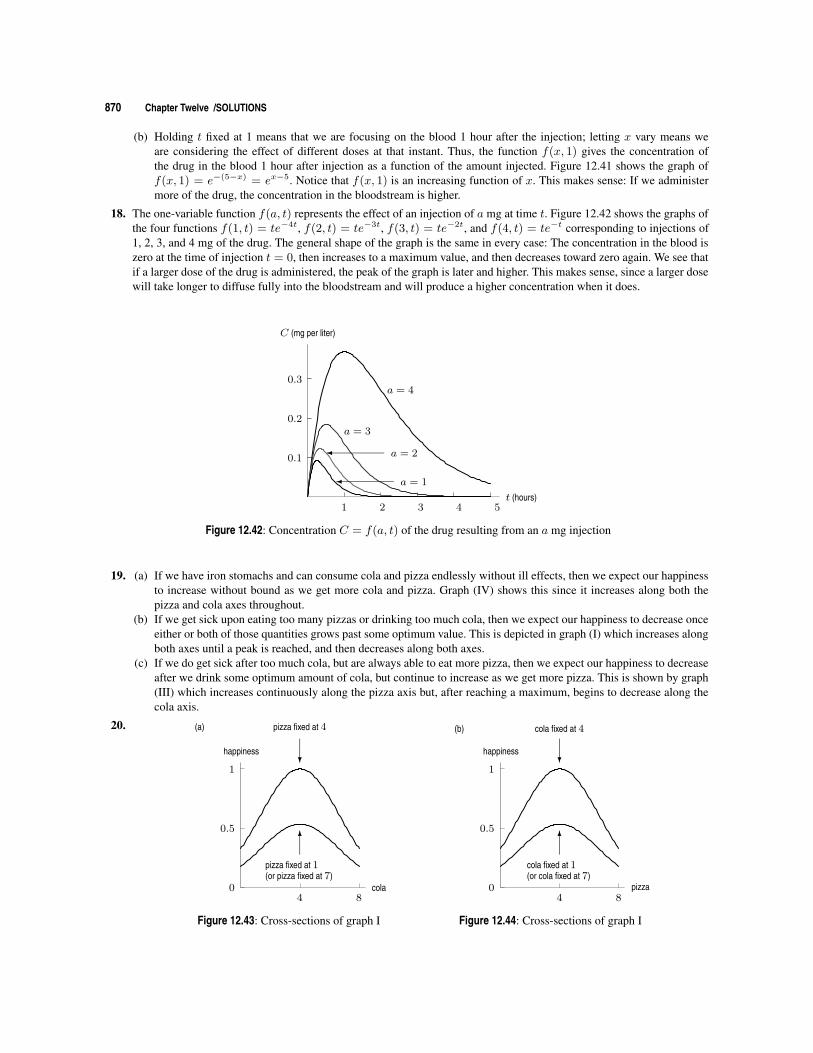
18. The one-variable function f(a, t) represents the effect of an injection of a mg at time t. Figure 12.42 shows the graphs ofthe four functions f(1, t) = te−4t, f(2, t) = te−3t, f(3, t) = te−2t, and f(4, t) = te−t corresponding to injections of1, 2, 3, and 4 mg of the drug. The general shape of the graph is the same in every case: The concentration in the blood iszero at the time of injection t = 0, then increases to a maximum value, and then decreases toward zero again. We see thatif a larger dose of the drug is administered, the peak of the graph is later and higher. This makes sense, since a larger dosewill take longer to diffuse fully into the bloodstream and will produce a higher concentration when it does.
1 2 3 4 5
0.1
0.2
0.3
� a = 1
� a = 2
a = 3
a = 4
t (hours)
C (mg per liter)
Figure 12.42: Concentration C = f(a, t) of the drug resulting from an a mg injection
19. (a) If we have iron stomachs and can consume cola and pizza endlessly without ill effects, then we expect our happinessto increase without bound as we get more cola and pizza. Graph (IV) shows this since it increases along both thepizza and cola axes throughout.
(b) If we get sick upon eating too many pizzas or drinking too much cola, then we expect our happiness to decrease onceeither or both of those quantities grows past some optimum value. This is depicted in graph (I) which increases alongboth axes until a peak is reached, and then decreases along both axes.
(c) If we do get sick after too much cola, but are always able to eat more pizza, then we expect our happiness to decreaseafter we drink some optimum amount of cola, but continue to increase as we get more pizza. This is shown by graph(III) which increases continuously along the pizza axis but, after reaching a maximum, begins to decrease along thecola axis.
20.
4 80
0.5
1?
pizza fixed at 4
6
pizza fixed at 1(or pizza fixed at 7)
cola
happiness
(a)
Figure 12.43: Cross-sections of graph I
4 80
0.5
1?
cola fixed at 4
6
cola fixed at 1(or cola fixed at 7)
pizza
happiness
(b)
Figure 12.44: Cross-sections of graph I
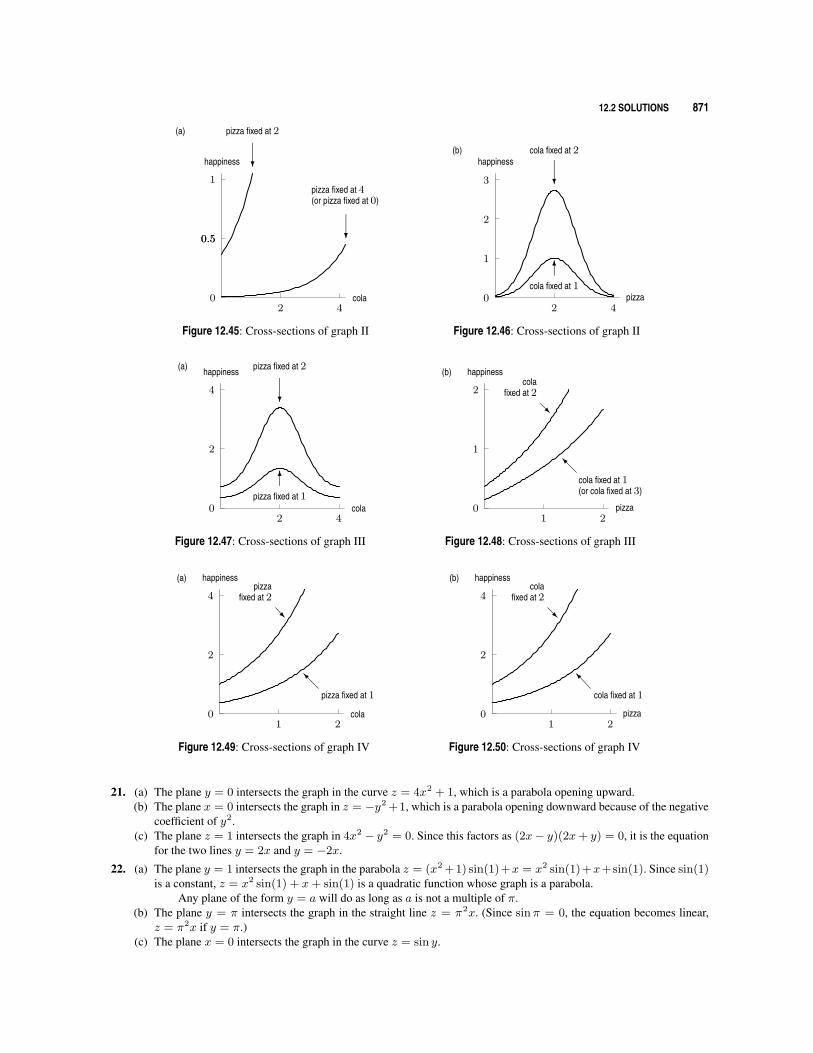
12.2 SOLUTIONS 871
2 40
0.5
1
cola
happiness
0.5
?
pizza fixed at 2
?
pizza fixed at 4(or pizza fixed at 0)
(a)
Figure 12.45: Cross-sections of graph II
2 40
1
2
3
pizza
happiness
6cola fixed at 1
?
cola fixed at 2(b)
Figure 12.46: Cross-sections of graph II
2 40
2
4
cola
happiness
6pizza fixed at 1
?
pizza fixed at 2(a)
Figure 12.47: Cross-sections of graph III
1 20
1
2
pizza
happiness
R
colafixed at 2
Icola fixed at 1(or cola fixed at 3)
(b)
Figure 12.48: Cross-sections of graph III
1 20
2
4
cola
happiness
R
pizzafixed at 2
Ipizza fixed at 1
(a)
Figure 12.49: Cross-sections of graph IV
1 20
2
4
pizza
happiness
R
colafixed at 2
Icola fixed at 1
(b)
Figure 12.50: Cross-sections of graph IV
21. (a) The plane y = 0 intersects the graph in the curve z = 4x2 + 1, which is a parabola opening upward.(b) The plane x = 0 intersects the graph in z = −y2 +1, which is a parabola opening downward because of the negative
coefficient of y2.(c) The plane z = 1 intersects the graph in 4x2 − y2 = 0. Since this factors as (2x− y)(2x+ y) = 0, it is the equation
for the two lines y = 2x and y = −2x.
22. (a) The plane y = 1 intersects the graph in the parabola z = (x2 +1) sin(1)+x = x2 sin(1)+x+sin(1). Since sin(1)is a constant, z = x2 sin(1) + x+ sin(1) is a quadratic function whose graph is a parabola.
Any plane of the form y = a will do as long as a is not a multiple of π.(b) The plane y = π intersects the graph in the straight line z = π2x. (Since sinπ = 0, the equation becomes linear,
z = π2x if y = π.)(c) The plane x = 0 intersects the graph in the curve z = sin y.
872 Chapter Twelve /SOLUTIONS
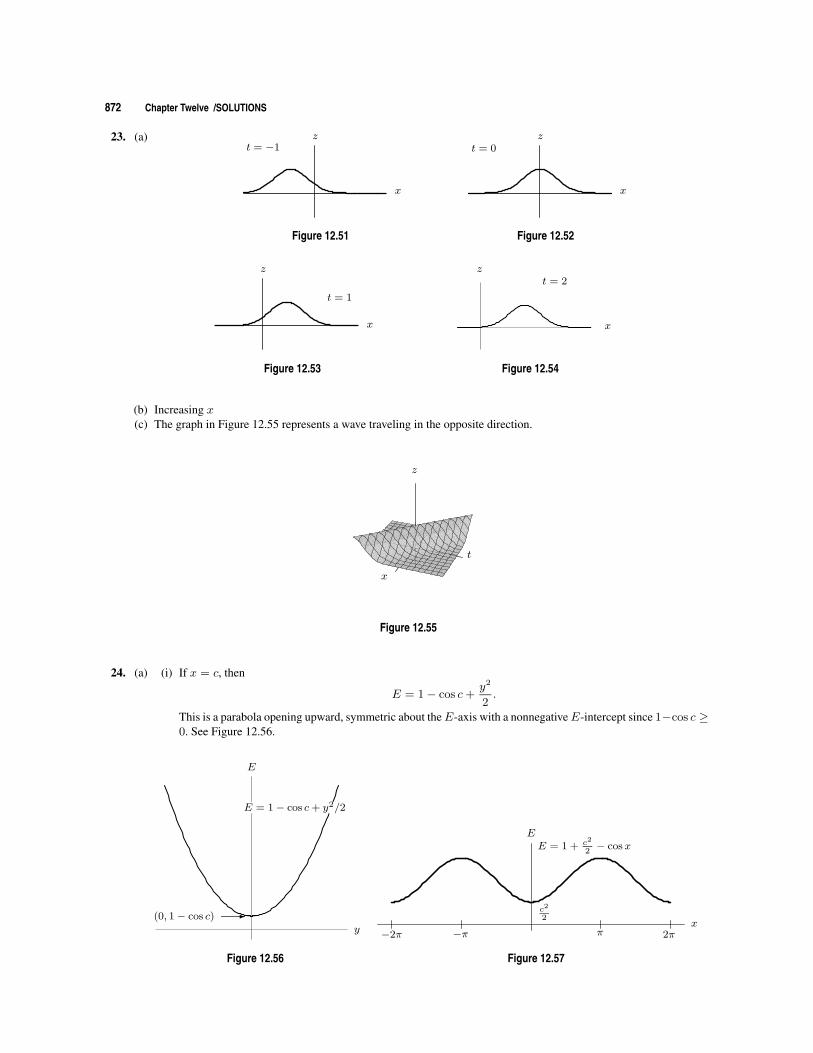
23. (a)
x
zt = −1
Figure 12.51
x
zt = 0
Figure 12.52
t = 1
x
z
Figure 12.53
t = 2z
x
Figure 12.54
(b) Increasing x(c) The graph in Figure 12.55 represents a wave traveling in the opposite direction.
x
t
z
Figure 12.55
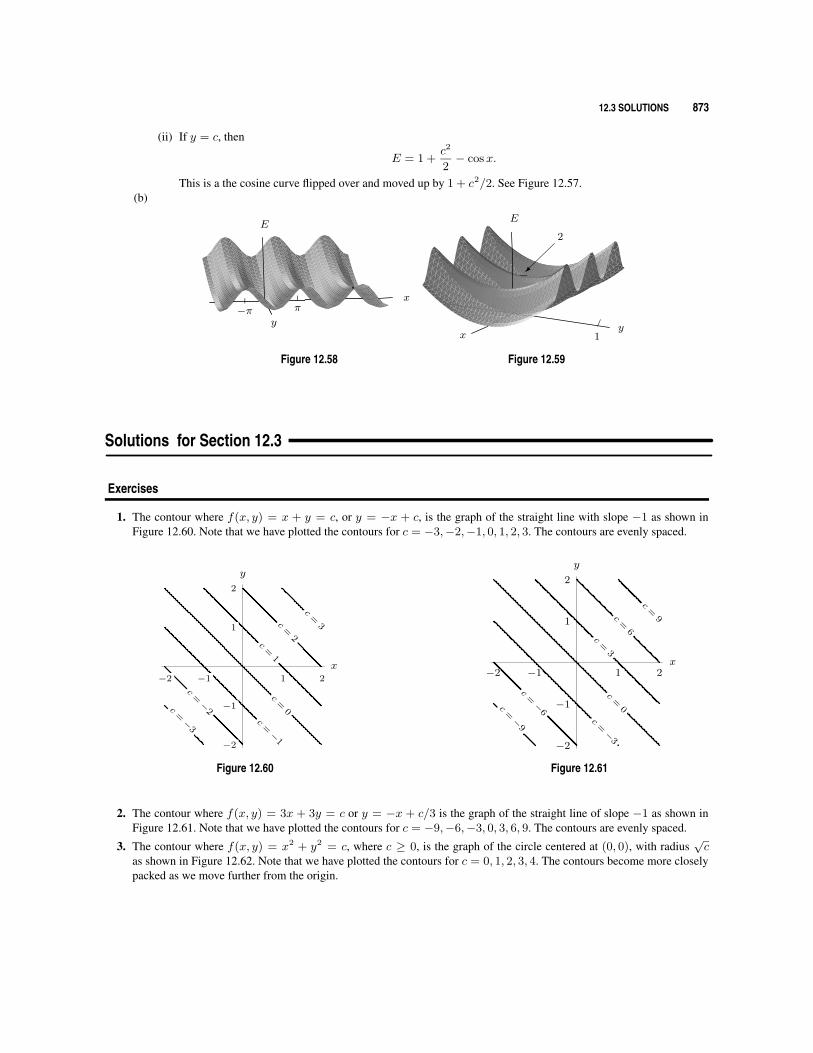
24. (a) (i) If x = c, then
E = 1− cos c+y2
2.
This is a parabola opening upward, symmetric about theE-axis with a nonnegativeE-intercept since 1−cos c ≥0. See Figure 12.56.
-(0, 1− cos c)
E
y
E = 1− cos c+ y2/2
Figure 12.56
−2π −π π 2π
c2
2x
EE = 1 + c2
2− cosx
Figure 12.57
12.3 SOLUTIONS 873
(ii) If y = c, then
E = 1 +c2
2− cosx.
This is a the cosine curve flipped over and moved up by 1 + c2/2. See Figure 12.57.(b)
x
E
y−π π
Figure 12.58
yx
E
2
1
Figure 12.59
Solutions for Section 12.3
Exercises
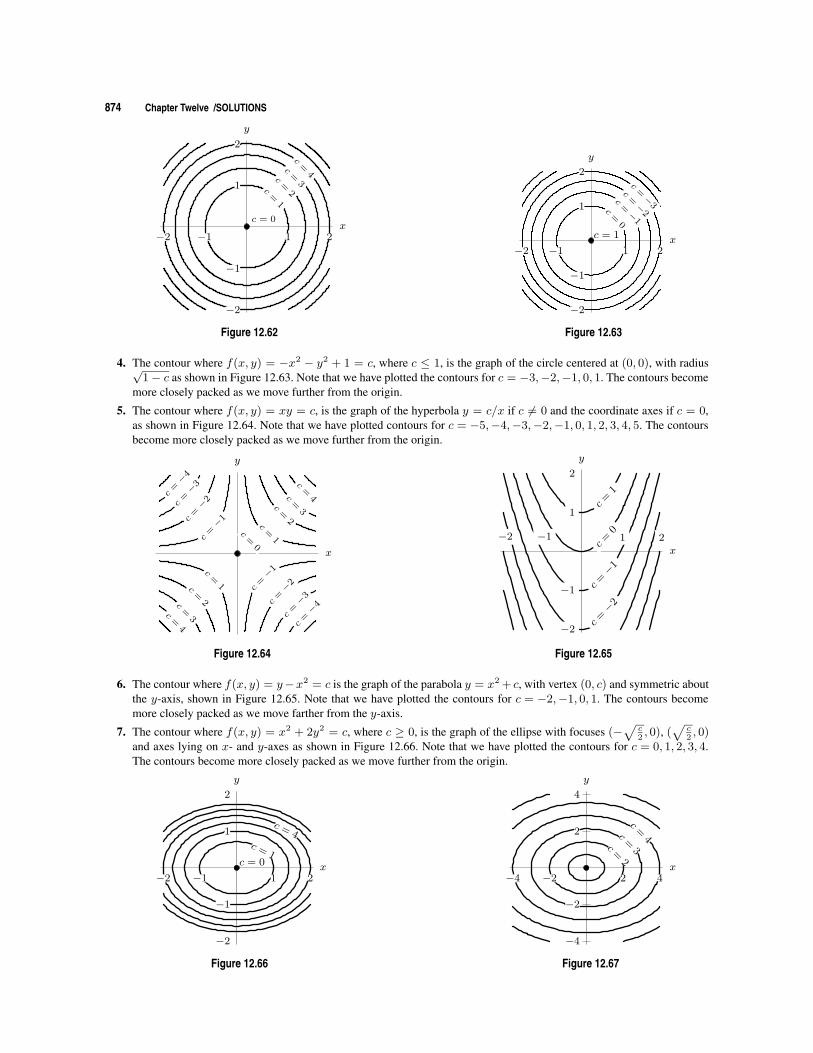
1. The contour where f(x, y) = x + y = c, or y = −x + c, is the graph of the straight line with slope −1 as shown inFigure 12.60. Note that we have plotted the contours for c = −3,−2,−1, 0, 1, 2, 3. The contours are evenly spaced.
x
y
−2 −1 1 2
−2
−1
1
2
c=
0c=−1
c=−2c
=−3
c=
1
c=
2
c=
3
Figure 12.60
x
y
−2 −1 1 2
−2
−1
1
2
c=
0
c=−3
c=−6c
=−9
c=
3
c=
6
c=
9
Figure 12.61
2. The contour where f(x, y) = 3x + 3y = c or y = −x + c/3 is the graph of the straight line of slope −1 as shown inFigure 12.61. Note that we have plotted the contours for c = −9,−6,−3, 0, 3, 6, 9. The contours are evenly spaced.
3. The contour where f(x, y) = x2 + y2 = c, where c ≥ 0, is the graph of the circle centered at (0, 0), with radius√c
as shown in Figure 12.62. Note that we have plotted the contours for c = 0, 1, 2, 3, 4. The contours become more closelypacked as we move further from the origin.
874 Chapter Twelve /SOLUTIONS
x
y
c=
1
c=
2
c=
3
c=
4
c = 0
−2 −1 1 2
−2
−1
1
2
Figure 12.62
x
y
c=
0
c=−3c
=−1
c=−2
−2 −1 1 2
−2
−1
1
2
c = 1
Figure 12.63
4. The contour where f(x, y) = −x2 − y2 + 1 = c, where c ≤ 1, is the graph of the circle centered at (0, 0), with radius√1− c as shown in Figure 12.63. Note that we have plotted the contours for c = −3,−2,−1, 0, 1. The contours become
more closely packed as we move further from the origin.
5. The contour where f(x, y) = xy = c, is the graph of the hyperbola y = c/x if c 6= 0 and the coordinate axes if c = 0,as shown in Figure 12.64. Note that we have plotted contours for c = −5,−4,−3,−2,−1, 0, 1, 2, 3, 4, 5. The contoursbecome more closely packed as we move further from the origin.
x
y
c=−1c
=−2c
=−3c
=−4
c=−1
c=−2
c=−3
c=−4
c=
1c=
2c=
3c=
4
c=
1
c=
2
c=
3
c=
4
c=
0
Figure 12.64
−2 −1 1 2
−2
−1
1
2
x
y
c=
1
c=
0
c=−1
c=−2
Figure 12.65
6. The contour where f(x, y) = y−x2 = c is the graph of the parabola y = x2 + c, with vertex (0, c) and symmetric aboutthe y-axis, shown in Figure 12.65. Note that we have plotted the contours for c = −2,−1, 0, 1. The contours becomemore closely packed as we move farther from the y-axis.
7. The contour where f(x, y) = x2 + 2y2 = c, where c ≥ 0, is the graph of the ellipse with focuses (−√
c2, 0), (
√c2, 0)
and axes lying on x- and y-axes as shown in Figure 12.66. Note that we have plotted the contours for c = 0, 1, 2, 3, 4.The contours become more closely packed as we move further from the origin.
−2 −1 1 2
−2
−1
1
2
x
y
c =1
c =4
c = 0
Figure 12.66
42
4
2
−4 −2
−4
−2
x
y
c=
2
c=
3
c=
4
Figure 12.67

12.3 SOLUTIONS 875
8. The contour where f(x, y) =√x2 + 2y2 = c, where c ≥ 0, is the graph of the ellipse with focuses (− c
√2
2, 0), ( c
√2
2, 0)
and axes lying on x- and y-axes as shown in Figure 12.67. Note that we have plotted the contours for c = 0, 1, 2, 3, 4. SeeFigure 12.67.
9. The contour where f(x, y) = cos(√x2 + y2) = c, where −1 ≤ c ≤ 1, is a set of circles centered at (0, 0), with radius
cos−1 c+ 2kπ with k = 0, 1, 2, .. and− cos−1 c+ 2kπ, with k = 1, 2, 3, ... as shown in Figure 12.68. Note that we haveplotted contours for c = 0, 0.2, 0.4, 0.6, 0.8, 1.
5π2
− 5π2
5π2
− 5π2
x
y
c = 1
�
�c=
0
Figure 12.68
10. (a) Level curves are in Figure 12.69.
z = 1
z = 2
z = −1
z = −2
x
y
z = −1
z = −2
z = 1
z = 2
Figure 12.69
y
z
z = −2y (x = −2)
z = 2y (x = 2)
z = y (x = 1)
z = −y (x = −1)
Figure 12.70
(b) Cross-sections with x constant are in Figure 12.70(c) Setting y = x gives the curve z = x2 in Figure 12.71
Line x = y
zCurve z = x2
Figure 12.71
11. We expect total sales to decrease as the price increases and to increase as advertising expenditures increase. Movingparallel to the x-axis, theQ-values on the contours decrease, whereas moving parallel to the y-axis, theQ-values increase.Thus, x is the price and y is advertising expenditures
876 Chapter Twelve /SOLUTIONS
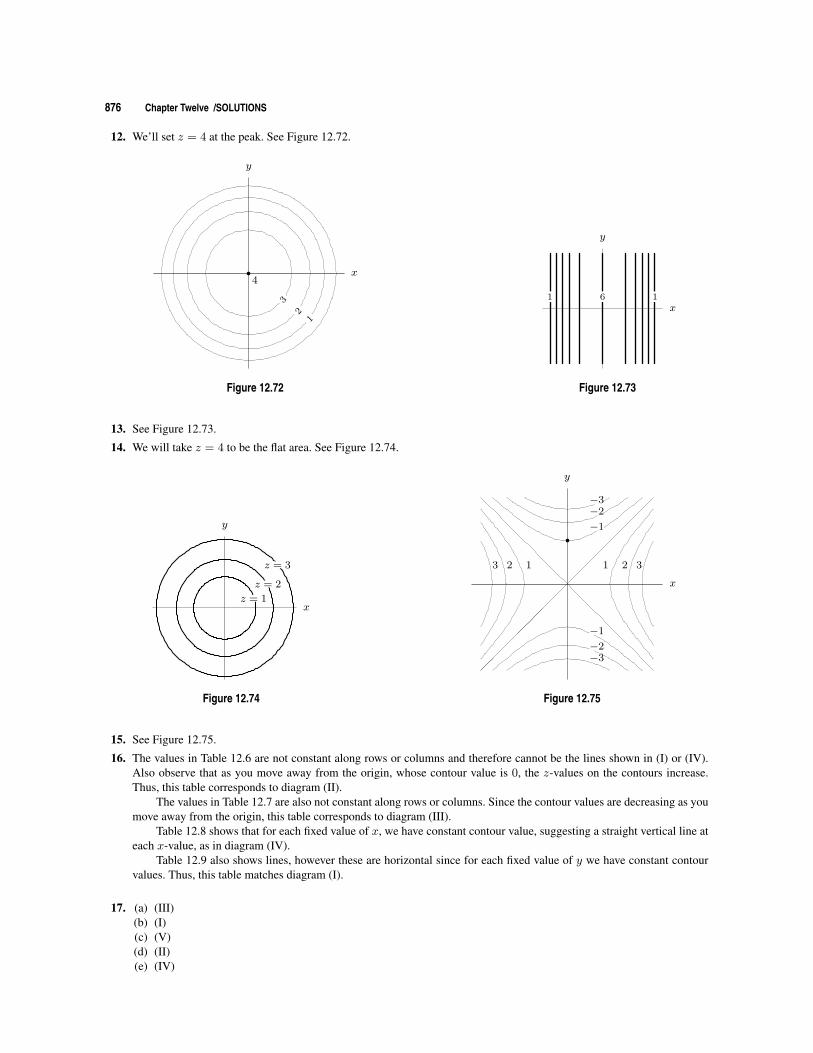
12. We’ll set z = 4 at the peak. See Figure 12.72.
x
y
4
32
1
Figure 12.72
y
x1 6 1
Figure 12.73
13. See Figure 12.73.
14. We will take z = 4 to be the flat area. See Figure 12.74.
x
y
z = 1
z = 2
z = 3
Figure 12.74
y
x
−3−2
−1
−3−2
−1
1 2 3123
Figure 12.75
15. See Figure 12.75.
16. The values in Table 12.6 are not constant along rows or columns and therefore cannot be the lines shown in (I) or (IV).Also observe that as you move away from the origin, whose contour value is 0, the z-values on the contours increase.Thus, this table corresponds to diagram (II).
The values in Table 12.7 are also not constant along rows or columns. Since the contour values are decreasing as youmove away from the origin, this table corresponds to diagram (III).
Table 12.8 shows that for each fixed value of x, we have constant contour value, suggesting a straight vertical line ateach x-value, as in diagram (IV).
Table 12.9 also shows lines, however these are horizontal since for each fixed value of y we have constant contourvalues. Thus, this table matches diagram (I).
17. (a) (III)(b) (I)(c) (V)(d) (II)(e) (IV)
12.3 SOLUTIONS 877
Problems
18. (a) is (I), because there is a minimum at the origin and the surface slopes steadily upward.(b) is (IV), because there is a maximum at the origin and the surface slopes increasingly steeply downward as we
move away from the origin.(c) is (II), because there is a maximum at the origin and the surface slopes steadily downward.(d) is (III), because there is a minimum at the origin and the surface slopes increasingly fast upward as we move
away from the origin.
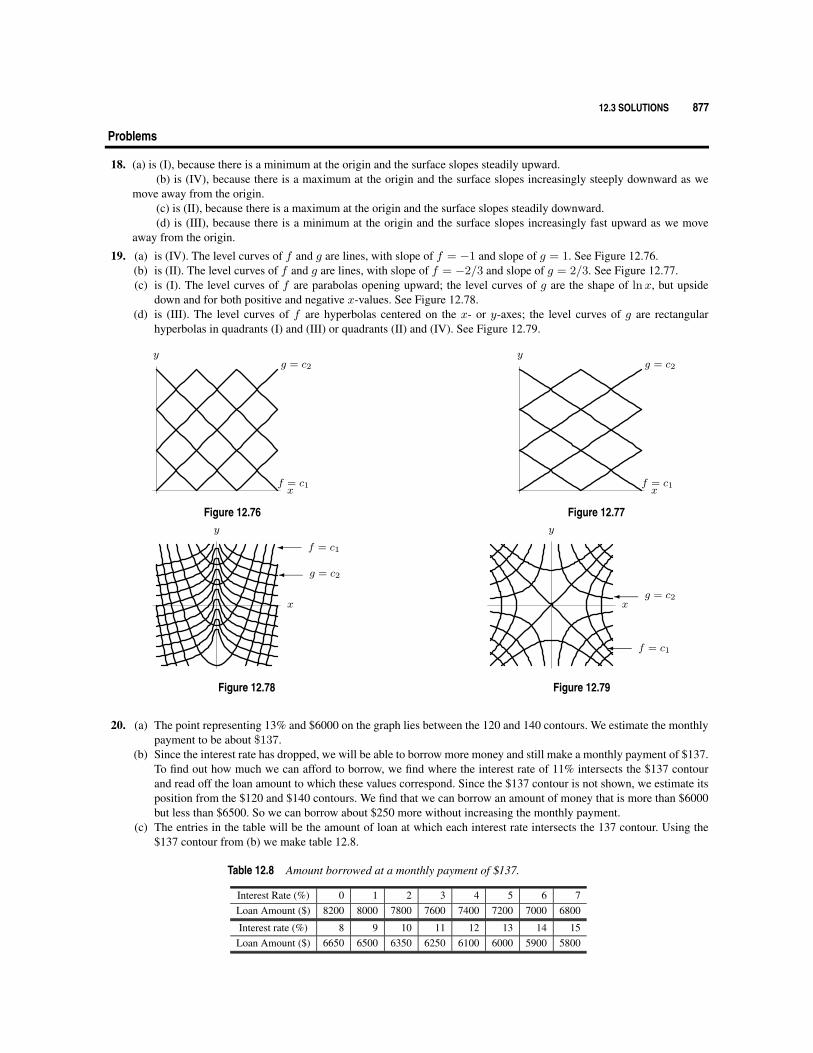
19. (a) is (IV). The level curves of f and g are lines, with slope of f = −1 and slope of g = 1. See Figure 12.76.(b) is (II). The level curves of f and g are lines, with slope of f = −2/3 and slope of g = 2/3. See Figure 12.77.(c) is (I). The level curves of f are parabolas opening upward; the level curves of g are the shape of lnx, but upside
down and for both positive and negative x-values. See Figure 12.78.(d) is (III). The level curves of f are hyperbolas centered on the x- or y-axes; the level curves of g are rectangular
hyperbolas in quadrants (I) and (III) or quadrants (II) and (IV). See Figure 12.79.
x
yg = c2
f = c1
Figure 12.76
x
yg = c2
f = c1
Figure 12.77
x
y
� g = c2
� f = c1
Figure 12.78
x
� f = c1
� g = c2
y
Figure 12.79
20. (a) The point representing 13% and $6000 on the graph lies between the 120 and 140 contours. We estimate the monthlypayment to be about $137.
(b) Since the interest rate has dropped, we will be able to borrow more money and still make a monthly payment of $137.To find out how much we can afford to borrow, we find where the interest rate of 11% intersects the $137 contourand read off the loan amount to which these values correspond. Since the $137 contour is not shown, we estimate itsposition from the $120 and $140 contours. We find that we can borrow an amount of money that is more than $6000but less than $6500. So we can borrow about $250 more without increasing the monthly payment.
(c) The entries in the table will be the amount of loan at which each interest rate intersects the 137 contour. Using the$137 contour from (b) we make table 12.8.
Table 12.8 Amount borrowed at a monthly payment of $137.
Interest Rate (%) 0 1 2 3 4 5 6 7Loan Amount ($) 8200 8000 7800 7600 7400 7200 7000 6800
Interest rate (%) 8 9 10 11 12 13 14 15Loan Amount ($) 6650 6500 6350 6250 6100 6000 5900 5800
878 Chapter Twelve /SOLUTIONS
21. (a) The contour lines are much closer together on path A, so path A is steeper.(b) If you are on path A and turn around to look at the countryside, you find hills to your left and right, obscuring the
view. But the ground falls away on either side of pathB, so you are likely to get a much better view of the countrysidefrom path B.
(c) There is more likely to be a stream alongside path A, because water follows the direction of steepest descent.
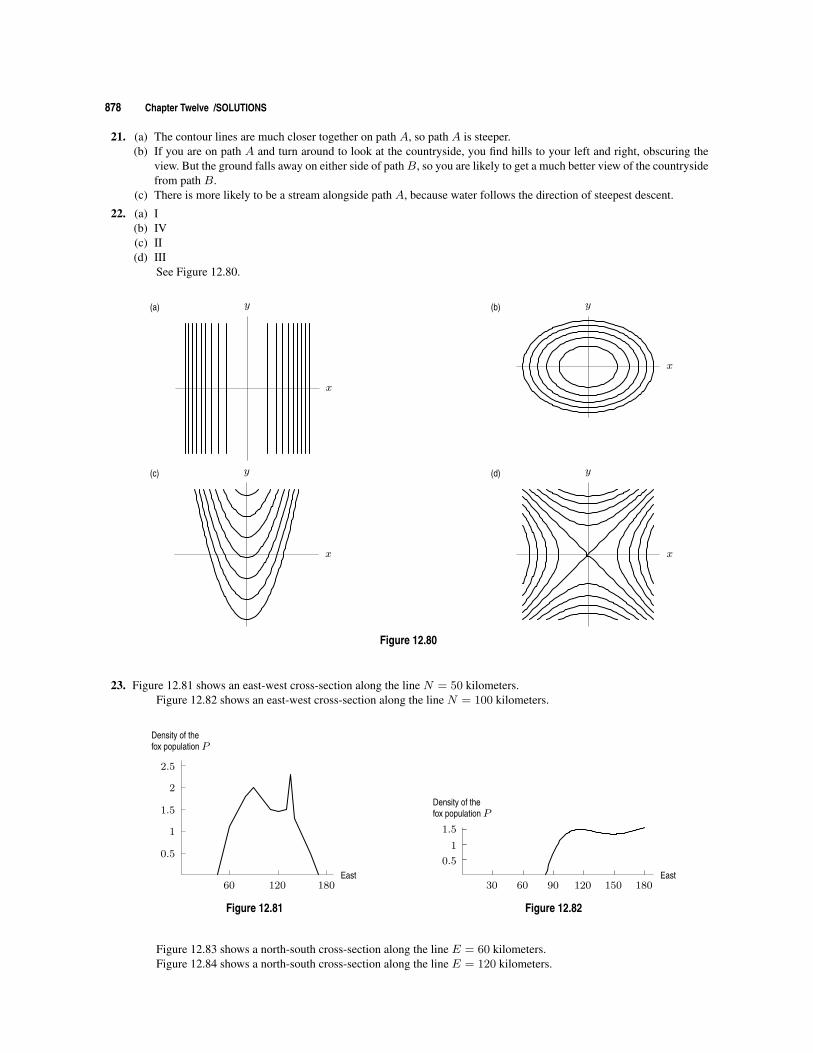
22. (a) I(b) IV(c) II(d) III
See Figure 12.80.
x
y(a)
x
y(b)
x
y(c)
x
y(d)
Figure 12.80
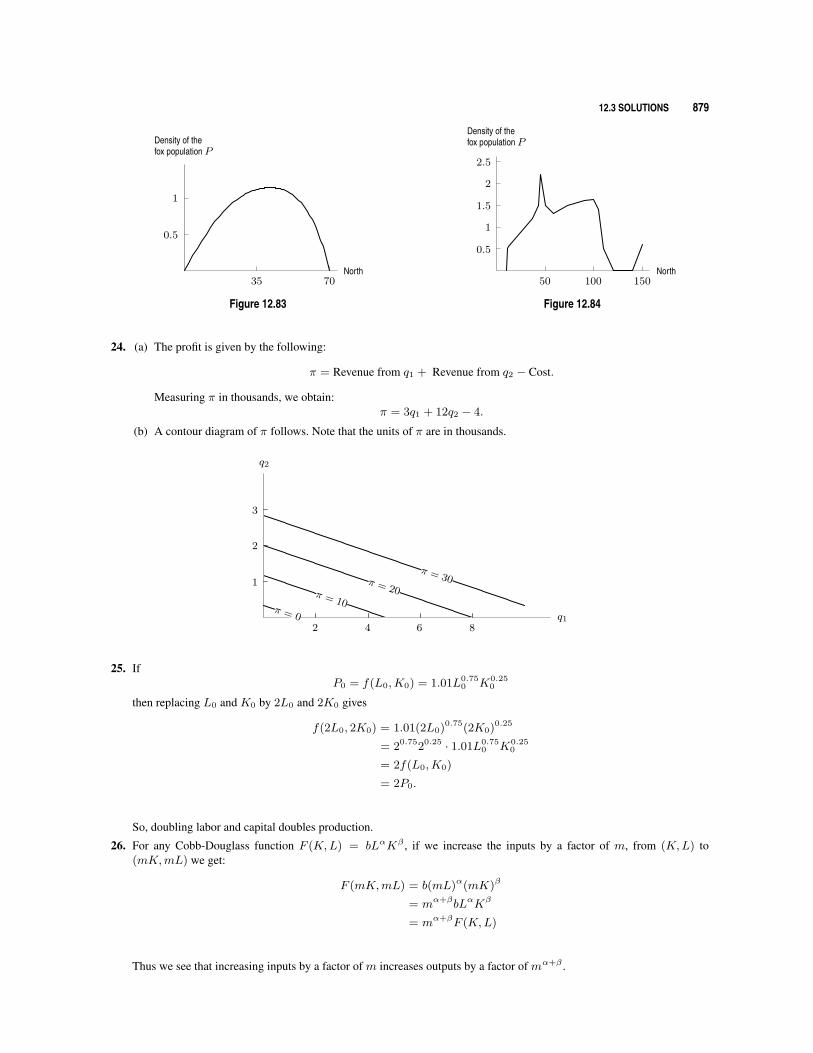
23. Figure 12.81 shows an east-west cross-section along the line N = 50 kilometers.Figure 12.82 shows an east-west cross-section along the line N = 100 kilometers.
60 120 180
0.5
1
1.5
2
2.5
East
Density of thefox population P
Figure 12.81
30 60 90 120 150 180
0.5
1
1.5
East
Density of thefox population P
Figure 12.82
Figure 12.83 shows a north-south cross-section along the line E = 60 kilometers.Figure 12.84 shows a north-south cross-section along the line E = 120 kilometers.
12.3 SOLUTIONS 879
35 70
0.5
1
North
Density of thefox population P
Figure 12.83
50 100 150
0.5
1
1.5
2
2.5
North
Density of thefox population P
Figure 12.84
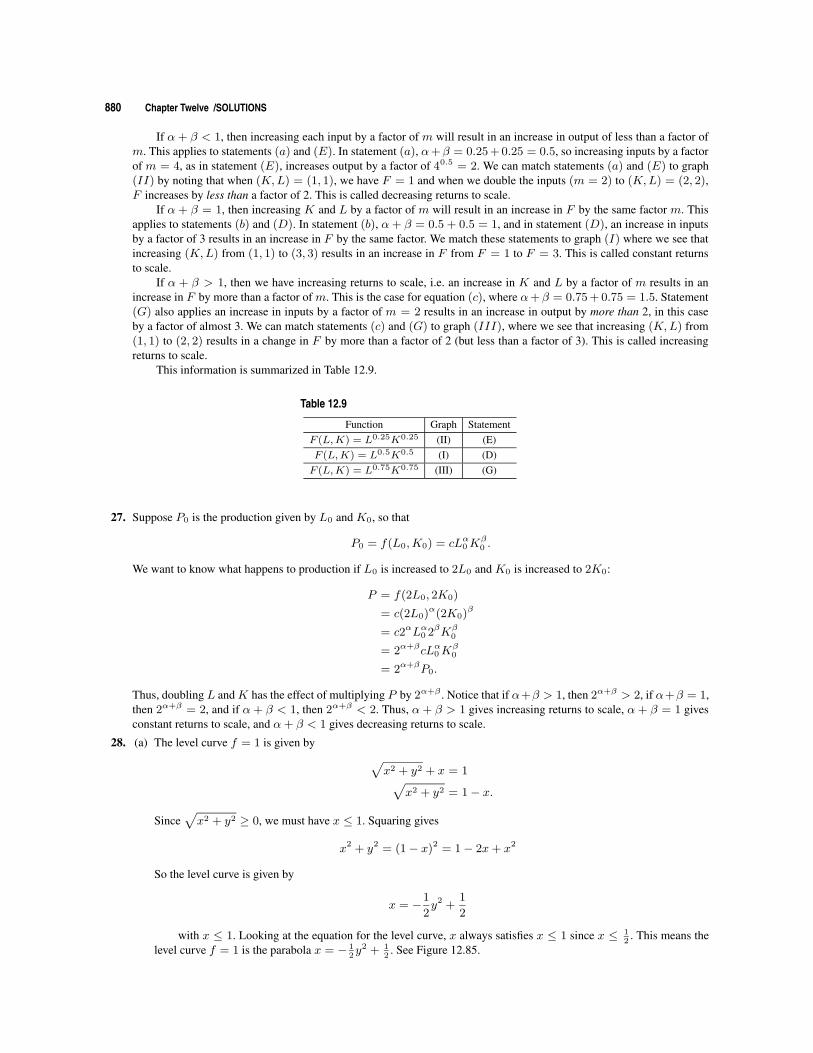
24. (a) The profit is given by the following:
π = Revenue from q1 + Revenue from q2 − Cost.
Measuring π in thousands, we obtain:π = 3q1 + 12q2 − 4.
(b) A contour diagram of π follows. Note that the units of π are in thousands.
2 4 6 8
1
2
3
q1
q2
π = 0
π = 10
π = 20
π = 30
25. IfP0 = f(L0,K0) = 1.01L0.75
0 K0.250
then replacing L0 and K0 by 2L0 and 2K0 gives
f(2L0, 2K0) = 1.01(2L0)0.75(2K0)0.25
= 20.7520.25 · 1.01L0.750 K0.25
0
= 2f(L0,K0)
= 2P0.
So, doubling labor and capital doubles production.
26. For any Cobb-Douglass function F (K,L) = bLαKβ , if we increase the inputs by a factor of m, from (K,L) to(mK,mL) we get:
F (mK,mL) = b(mL)α(mK)β
= mα+βbLαKβ
= mα+βF (K,L)
Thus we see that increasing inputs by a factor of m increases outputs by a factor of mα+β .
880 Chapter Twelve /SOLUTIONS
If α+ β < 1, then increasing each input by a factor of m will result in an increase in output of less than a factor ofm. This applies to statements (a) and (E). In statement (a), α+β = 0.25 + 0.25 = 0.5, so increasing inputs by a factorof m = 4, as in statement (E), increases output by a factor of 40.5 = 2. We can match statements (a) and (E) to graph(II) by noting that when (K,L) = (1, 1), we have F = 1 and when we double the inputs (m = 2) to (K,L) = (2, 2),F increases by less than a factor of 2. This is called decreasing returns to scale.
If α + β = 1, then increasing K and L by a factor of m will result in an increase in F by the same factor m. Thisapplies to statements (b) and (D). In statement (b), α+ β = 0.5 + 0.5 = 1, and in statement (D), an increase in inputsby a factor of 3 results in an increase in F by the same factor. We match these statements to graph (I) where we see thatincreasing (K,L) from (1, 1) to (3, 3) results in an increase in F from F = 1 to F = 3. This is called constant returnsto scale.
If α + β > 1, then we have increasing returns to scale, i.e. an increase in K and L by a factor of m results in anincrease in F by more than a factor of m. This is the case for equation (c), where α+ β = 0.75 + 0.75 = 1.5. Statement(G) also applies an increase in inputs by a factor of m = 2 results in an increase in output by more than 2, in this caseby a factor of almost 3. We can match statements (c) and (G) to graph (III), where we see that increasing (K,L) from(1, 1) to (2, 2) results in a change in F by more than a factor of 2 (but less than a factor of 3). This is called increasingreturns to scale.
This information is summarized in Table 12.9.
Table 12.9
Function Graph StatementF (L,K) = L0.25K0.25 (II) (E)F (L,K) = L0.5K0.5 (I) (D)F (L,K) = L0.75K0.75 (III) (G)
27. Suppose P0 is the production given by L0 and K0, so that
P0 = f(L0,K0) = cLα0Kβ0 .
We want to know what happens to production if L0 is increased to 2L0 and K0 is increased to 2K0:
P = f(2L0, 2K0)
= c(2L0)α(2K0)β
= c2αLα0 2βKβ0
= 2α+βcLα0Kβ0
= 2α+βP0.
Thus, doubling L andK has the effect of multiplying P by 2α+β . Notice that if α+β > 1, then 2α+β > 2, if α+β = 1,then 2α+β = 2, and if α + β < 1, then 2α+β < 2. Thus, α + β > 1 gives increasing returns to scale, α + β = 1 givesconstant returns to scale, and α+ β < 1 gives decreasing returns to scale.
28. (a) The level curve f = 1 is given by√x2 + y2 + x = 1√
x2 + y2 = 1− x.
Since√x2 + y2 ≥ 0, we must have x ≤ 1. Squaring gives
x2 + y2 = (1− x)2 = 1− 2x+ x2
So the level curve is given by
x = −1
2y2 +
1
2
with x ≤ 1. Looking at the equation for the level curve, x always satisfies x ≤ 1 since x ≤ 12
. This means thelevel curve f = 1 is the parabola x = − 1
2y2 + 1
2. See Figure 12.85.
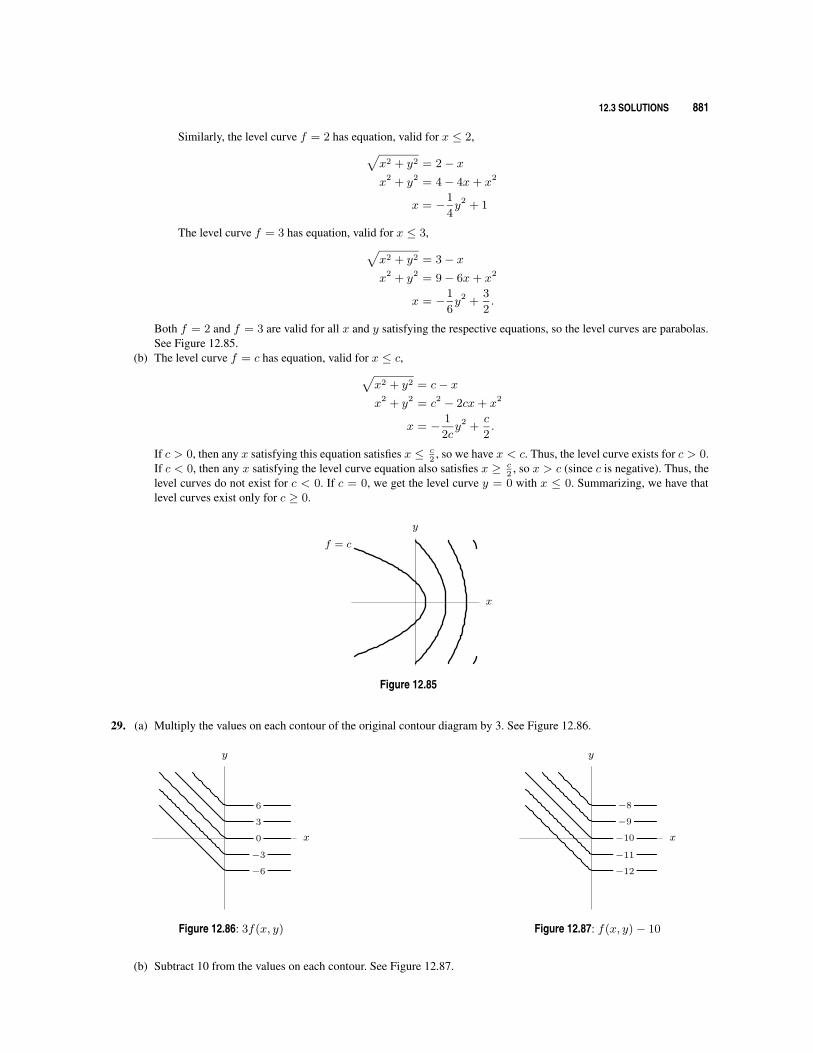
12.3 SOLUTIONS 881
Similarly, the level curve f = 2 has equation, valid for x ≤ 2,√x2 + y2 = 2− xx2 + y2 = 4− 4x+ x2
x = −1
4y2 + 1
The level curve f = 3 has equation, valid for x ≤ 3,√x2 + y2 = 3− xx2 + y2 = 9− 6x+ x2
x = −1
6y2 +
3
2.
Both f = 2 and f = 3 are valid for all x and y satisfying the respective equations, so the level curves are parabolas.See Figure 12.85.
(b) The level curve f = c has equation, valid for x ≤ c,√x2 + y2 = c− xx2 + y2 = c2 − 2cx+ x2
x = − 1
2cy2 +
c
2.
If c > 0, then any x satisfying this equation satisfies x ≤ c2
, so we have x < c. Thus, the level curve exists for c > 0.If c < 0, then any x satisfying the level curve equation also satisfies x ≥ c
2, so x > c (since c is negative). Thus, the
level curves do not exist for c < 0. If c = 0, we get the level curve y = 0 with x ≤ 0. Summarizing, we have thatlevel curves exist only for c ≥ 0.
x
y
f = c
Figure 12.85
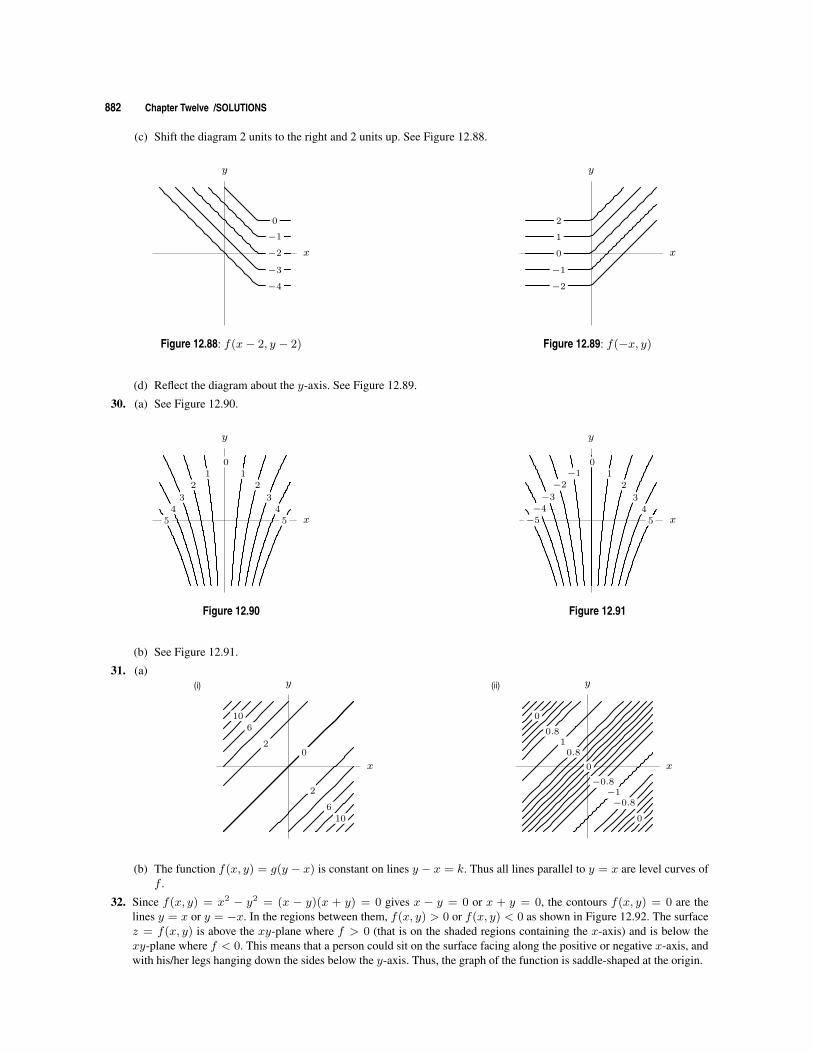
29. (a) Multiply the values on each contour of the original contour diagram by 3. See Figure 12.86.
−6
−3
0
3
6
x
y
Figure 12.86: 3f(x, y)
−12
−11
−10
−9
−8
x
y
Figure 12.87: f(x, y)− 10
(b) Subtract 10 from the values on each contour. See Figure 12.87.
882 Chapter Twelve /SOLUTIONS
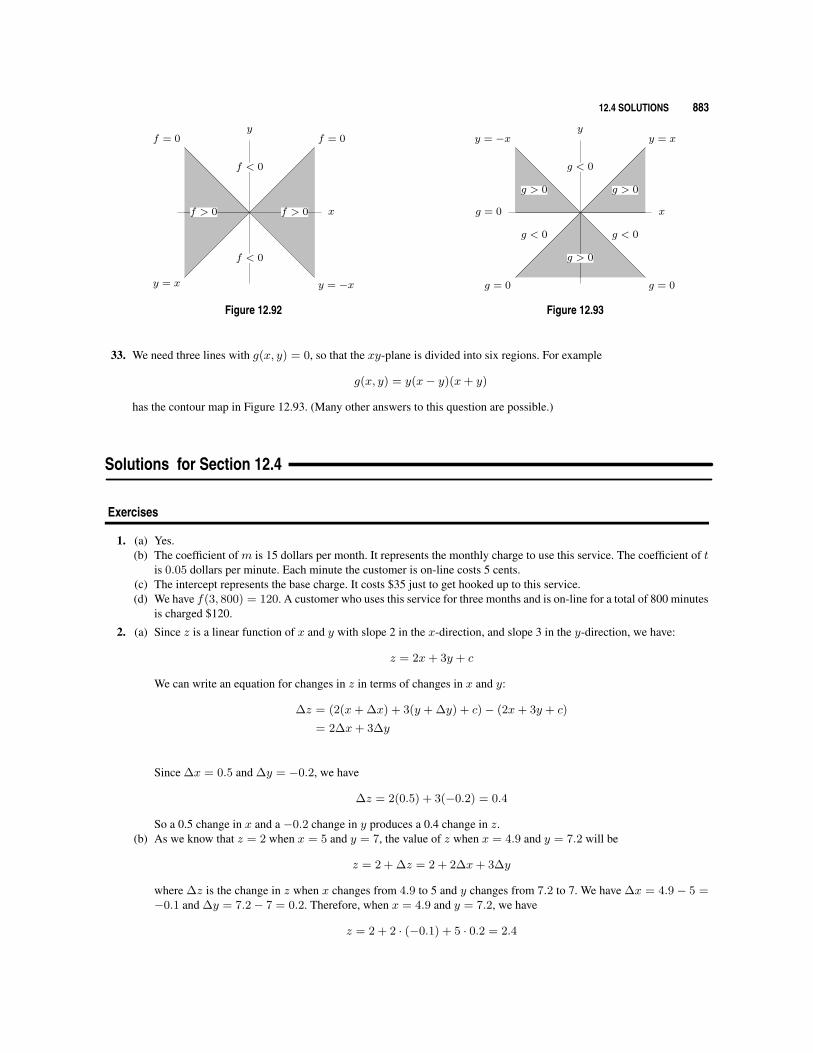
(c) Shift the diagram 2 units to the right and 2 units up. See Figure 12.88.
−4
−3
−2
−1
0
x
y
Figure 12.88: f(x− 2, y − 2)
−2
−1
0
1
2
x
y
Figure 12.89: f(−x, y)
(d) Reflect the diagram about the y-axis. See Figure 12.89.
30. (a) See Figure 12.90.
01
2
34
5
12
34
5 x
y
Figure 12.90
01
2
34
5
−1−2
−3−4−5 x
y
Figure 12.91
(b) See Figure 12.91.
31. (a)
106
20
2
610
x
y(i)
−0.8
0
−1−0.8
0
0.81
0.8
0
x
y(ii)
(b) The function f(x, y) = g(y − x) is constant on lines y − x = k. Thus all lines parallel to y = x are level curves off .
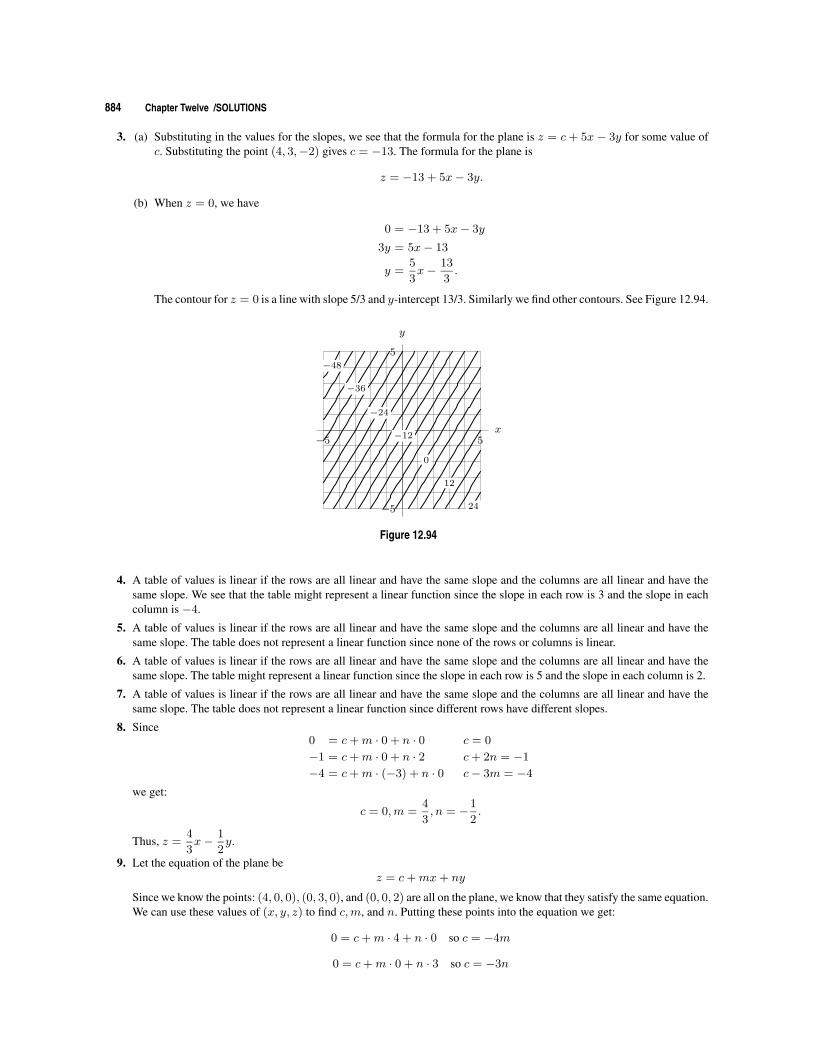
32. Since f(x, y) = x2 − y2 = (x − y)(x + y) = 0 gives x − y = 0 or x + y = 0, the contours f(x, y) = 0 are thelines y = x or y = −x. In the regions between them, f(x, y) > 0 or f(x, y) < 0 as shown in Figure 12.92. The surfacez = f(x, y) is above the xy-plane where f > 0 (that is on the shaded regions containing the x-axis) and is below thexy-plane where f < 0. This means that a person could sit on the surface facing along the positive or negative x-axis, andwith his/her legs hanging down the sides below the y-axis. Thus, the graph of the function is saddle-shaped at the origin.
12.4 SOLUTIONS 883
f > 0
f < 0
f > 0
f < 0
f = 0f = 0
y = x y = −x
x
y
Figure 12.92
g > 0
g < 0
g > 0
g < 0
g > 0
g < 0
g = 0
y = x
g = 0 g = 0
y = −x
x
y
Figure 12.93
33. We need three lines with g(x, y) = 0, so that the xy-plane is divided into six regions. For example
g(x, y) = y(x− y)(x+ y)
has the contour map in Figure 12.93. (Many other answers to this question are possible.)
Solutions for Section 12.4
Exercises
1. (a) Yes.(b) The coefficient of m is 15 dollars per month. It represents the monthly charge to use this service. The coefficient of t
is 0.05 dollars per minute. Each minute the customer is on-line costs 5 cents.(c) The intercept represents the base charge. It costs $35 just to get hooked up to this service.(d) We have f(3, 800) = 120. A customer who uses this service for three months and is on-line for a total of 800 minutes
is charged $120.
2. (a) Since z is a linear function of x and y with slope 2 in the x-direction, and slope 3 in the y-direction, we have:
z = 2x+ 3y + c
We can write an equation for changes in z in terms of changes in x and y:
∆z = (2(x+ ∆x) + 3(y + ∆y) + c)− (2x+ 3y + c)
= 2∆x+ 3∆y
Since ∆x = 0.5 and ∆y = −0.2, we have
∆z = 2(0.5) + 3(−0.2) = 0.4
So a 0.5 change in x and a −0.2 change in y produces a 0.4 change in z.(b) As we know that z = 2 when x = 5 and y = 7, the value of z when x = 4.9 and y = 7.2 will be
z = 2 + ∆z = 2 + 2∆x+ 3∆y
where ∆z is the change in z when x changes from 4.9 to 5 and y changes from 7.2 to 7. We have ∆x = 4.9− 5 =−0.1 and ∆y = 7.2− 7 = 0.2. Therefore, when x = 4.9 and y = 7.2, we have
z = 2 + 2 · (−0.1) + 5 · 0.2 = 2.4
884 Chapter Twelve /SOLUTIONS
3. (a) Substituting in the values for the slopes, we see that the formula for the plane is z = c+ 5x− 3y for some value ofc. Substituting the point (4, 3,−2) gives c = −13. The formula for the plane is
z = −13 + 5x− 3y.
(b) When z = 0, we have
0 = −13 + 5x− 3y
3y = 5x− 13
y =5
3x− 13
3.
The contour for z = 0 is a line with slope 5/3 and y-intercept 13/3. Similarly we find other contours. See Figure 12.94.
−5 5
−5
5−48
−36
−24
−12
0
12
24
x
y
Figure 12.94
4. A table of values is linear if the rows are all linear and have the same slope and the columns are all linear and have thesame slope. We see that the table might represent a linear function since the slope in each row is 3 and the slope in eachcolumn is −4.
5. A table of values is linear if the rows are all linear and have the same slope and the columns are all linear and have thesame slope. The table does not represent a linear function since none of the rows or columns is linear.
6. A table of values is linear if the rows are all linear and have the same slope and the columns are all linear and have thesame slope. The table might represent a linear function since the slope in each row is 5 and the slope in each column is 2.
7. A table of values is linear if the rows are all linear and have the same slope and the columns are all linear and have thesame slope. The table does not represent a linear function since different rows have different slopes.
8. Since0 = c+m · 0 + n · 0 c = 0
−1 = c+m · 0 + n · 2 c+ 2n = −1
−4 = c+m · (−3) + n · 0 c− 3m = −4
we get:
c = 0,m =4
3, n = −1
2.
Thus, z =4
3x− 1
2y.
9. Let the equation of the plane bez = c+mx+ ny
Since we know the points: (4, 0, 0), (0, 3, 0), and (0, 0, 2) are all on the plane, we know that they satisfy the same equation.We can use these values of (x, y, z) to find c,m, and n. Putting these points into the equation we get:
0 = c+m · 4 + n · 0 so c = −4m
0 = c+m · 0 + n · 3 so c = −3n
12.4 SOLUTIONS 885
2 = c+m · 0 + n · 0 so c = 2
Because we have a value for c, we can solve for m and n to get
c = 2,m = −1
2, n = −2
3.
So the linear function isz = 2− 1
2x− 2
3y.
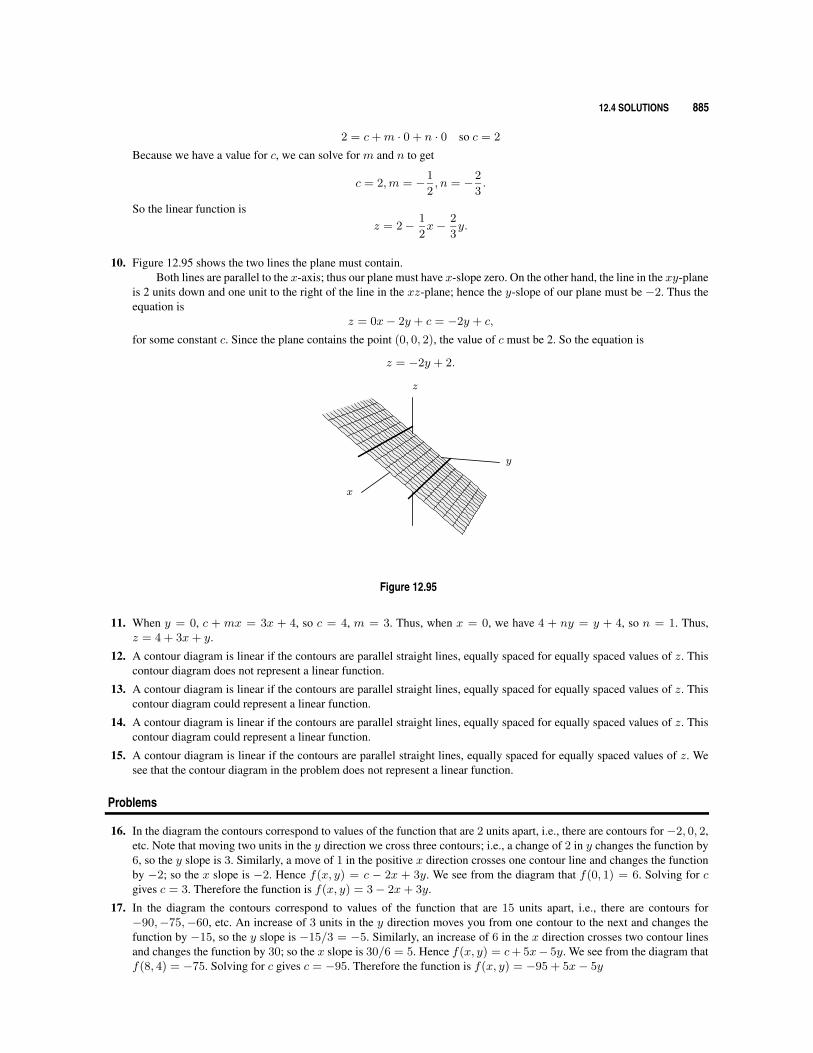
10. Figure 12.95 shows the two lines the plane must contain.Both lines are parallel to the x-axis; thus our plane must have x-slope zero. On the other hand, the line in the xy-plane
is 2 units down and one unit to the right of the line in the xz-plane; hence the y-slope of our plane must be −2. Thus theequation is
z = 0x− 2y + c = −2y + c,
for some constant c. Since the plane contains the point (0, 0, 2), the value of c must be 2. So the equation is
z = −2y + 2.
z
x
y
Figure 12.95
11. When y = 0, c + mx = 3x + 4, so c = 4, m = 3. Thus, when x = 0, we have 4 + ny = y + 4, so n = 1. Thus,z = 4 + 3x+ y.
12. A contour diagram is linear if the contours are parallel straight lines, equally spaced for equally spaced values of z. Thiscontour diagram does not represent a linear function.
13. A contour diagram is linear if the contours are parallel straight lines, equally spaced for equally spaced values of z. Thiscontour diagram could represent a linear function.
14. A contour diagram is linear if the contours are parallel straight lines, equally spaced for equally spaced values of z. Thiscontour diagram could represent a linear function.
15. A contour diagram is linear if the contours are parallel straight lines, equally spaced for equally spaced values of z. Wesee that the contour diagram in the problem does not represent a linear function.
Problems
16. In the diagram the contours correspond to values of the function that are 2 units apart, i.e., there are contours for−2, 0, 2,etc. Note that moving two units in the y direction we cross three contours; i.e., a change of 2 in y changes the function by6, so the y slope is 3. Similarly, a move of 1 in the positive x direction crosses one contour line and changes the functionby −2; so the x slope is −2. Hence f(x, y) = c − 2x + 3y. We see from the diagram that f(0, 1) = 6. Solving for cgives c = 3. Therefore the function is f(x, y) = 3− 2x+ 3y.
17. In the diagram the contours correspond to values of the function that are 15 units apart, i.e., there are contours for−90,−75,−60, etc. An increase of 3 units in the y direction moves you from one contour to the next and changes thefunction by −15, so the y slope is −15/3 = −5. Similarly, an increase of 6 in the x direction crosses two contour linesand changes the function by 30; so the x slope is 30/6 = 5. Hence f(x, y) = c+ 5x− 5y. We see from the diagram thatf(8, 4) = −75. Solving for c gives c = −95. Therefore the function is f(x, y) = −95 + 5x− 5y
886 Chapter Twelve /SOLUTIONS
18. For each column in the table, we find that as x increases by 1, f(x, y) increases by 2, so the x slope is 2. For each row inthe table, we find that as y increases by 1, f(x, y) decreases by 0.5, so the y slope is −0.5. So the function has the formf(x, y) = 2x− 0.5y + c. Also note that f(0, 0) = 1, so c = 1. Therefore, the function is f(x, y) = 2x− 0.5y + 1.
19. For each column in the table, we find that as x increases by 100, f(x, y) decreases by 1, so the x slope is −0.01. Foreach row in the table, we find that as y increases by 10, f(x, y) increases by 3, so the y slope is 0.3. So the functionhas the form f(x, y) = −0.01x + 0.3y + c. Also note that f(100, 10) = 3, so c = 1. Therefore, the function isf(x, y) = −0.01x+ 0.3y + 1
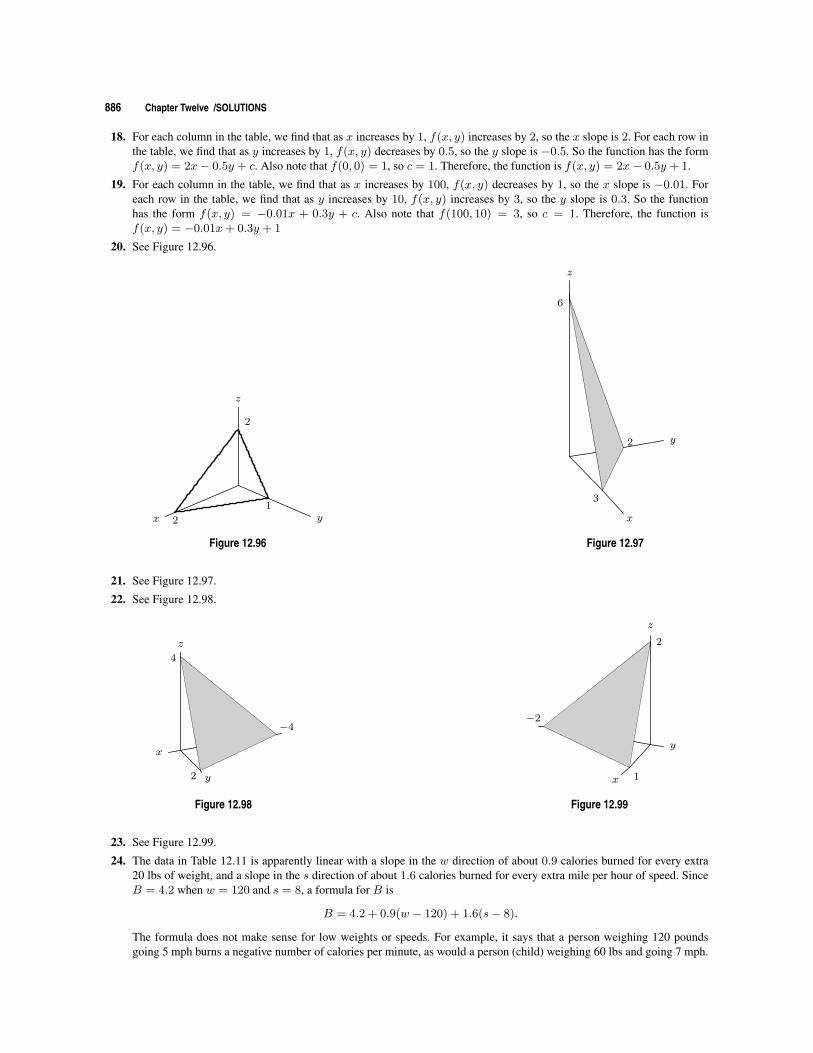
20. See Figure 12.96.
x 2 y1
z
2
Figure 12.96
x
y
z
3
6
2
Figure 12.97
21. See Figure 12.97.
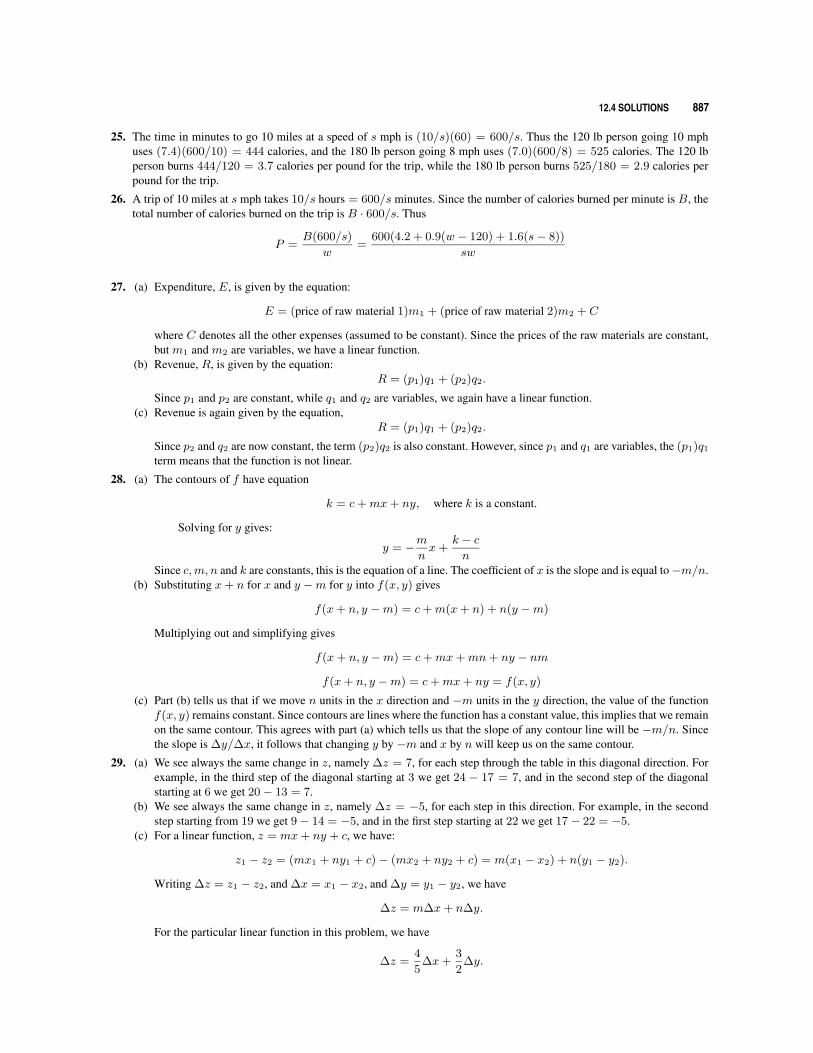
22. See Figure 12.98.
x
y
z
2
−4
4
Figure 12.98
x
y
z
1
−2
2
Figure 12.99
23. See Figure 12.99.
24. The data in Table 12.11 is apparently linear with a slope in the w direction of about 0.9 calories burned for every extra20 lbs of weight, and a slope in the s direction of about 1.6 calories burned for every extra mile per hour of speed. SinceB = 4.2 when w = 120 and s = 8, a formula for B is
B = 4.2 + 0.9(w − 120) + 1.6(s− 8).
The formula does not make sense for low weights or speeds. For example, it says that a person weighing 120 poundsgoing 5 mph burns a negative number of calories per minute, as would a person (child) weighing 60 lbs and going 7 mph.
12.4 SOLUTIONS 887
25. The time in minutes to go 10 miles at a speed of s mph is (10/s)(60) = 600/s. Thus the 120 lb person going 10 mphuses (7.4)(600/10) = 444 calories, and the 180 lb person going 8 mph uses (7.0)(600/8) = 525 calories. The 120 lbperson burns 444/120 = 3.7 calories per pound for the trip, while the 180 lb person burns 525/180 = 2.9 calories perpound for the trip.
26. A trip of 10 miles at s mph takes 10/s hours = 600/s minutes. Since the number of calories burned per minute is B, thetotal number of calories burned on the trip is B · 600/s. Thus
P =B(600/s)
w=
600(4.2 + 0.9(w − 120) + 1.6(s− 8))
sw
27. (a) Expenditure, E, is given by the equation:
E = (price of raw material 1)m1 + (price of raw material 2)m2 + C
where C denotes all the other expenses (assumed to be constant). Since the prices of the raw materials are constant,but m1 and m2 are variables, we have a linear function.
(b) Revenue, R, is given by the equation:R = (p1)q1 + (p2)q2.
Since p1 and p2 are constant, while q1 and q2 are variables, we again have a linear function.(c) Revenue is again given by the equation,
R = (p1)q1 + (p2)q2.
Since p2 and q2 are now constant, the term (p2)q2 is also constant. However, since p1 and q1 are variables, the (p1)q1
term means that the function is not linear.
28. (a) The contours of f have equation
k = c+mx+ ny, where k is a constant.
Solving for y gives:
y = −mnx+
k − cn
Since c,m, n and k are constants, this is the equation of a line. The coefficient of x is the slope and is equal to−m/n.(b) Substituting x+ n for x and y −m for y into f(x, y) gives
f(x+ n, y −m) = c+m(x+ n) + n(y −m)
Multiplying out and simplifying gives
f(x+ n, y −m) = c+mx+mn+ ny − nm
f(x+ n, y −m) = c+mx+ ny = f(x, y)
(c) Part (b) tells us that if we move n units in the x direction and −m units in the y direction, the value of the functionf(x, y) remains constant. Since contours are lines where the function has a constant value, this implies that we remainon the same contour. This agrees with part (a) which tells us that the slope of any contour line will be −m/n. Sincethe slope is ∆y/∆x, it follows that changing y by −m and x by n will keep us on the same contour.
29. (a) We see always the same change in z, namely ∆z = 7, for each step through the table in this diagonal direction. Forexample, in the third step of the diagonal starting at 3 we get 24 − 17 = 7, and in the second step of the diagonalstarting at 6 we get 20− 13 = 7.
(b) We see always the same change in z, namely ∆z = −5, for each step in this direction. For example, in the secondstep starting from 19 we get 9− 14 = −5, and in the first step starting at 22 we get 17− 22 = −5.
(c) For a linear function, z = mx+ ny + c, we have:
z1 − z2 = (mx1 + ny1 + c)− (mx2 + ny2 + c) = m(x1 − x2) + n(y1 − y2).
Writing ∆z = z1 − z2, and ∆x = x1 − x2, and ∆y = y1 − y2, we have
∆z = m∆x+ n∆y.
For the particular linear function in this problem, we have
∆z =4
5∆x+
3
2∆y.
888 Chapter Twelve /SOLUTIONS
In part (a), as we move down the diagonal, we are taking steps with the same ∆x = 5 and same ∆y = 2. Thereforewe will get the same change in z for each step,
∆z =4
5(5) +
3
2(2) = 7.
In part (b), for each step we have ∆x = −10 and ∆y = 2, so for each step
∆z =4
5(−10) +
3
2(2) = −5.
30. (a) We have ∆z = 7. Thus
Slope =7√
52 + 22=
7√29.
(b) We have ∆z = −5. Thus
Slope =−5√
(−10)2 + 22=−5√104
.
Solutions for Section 12.5
Exercises
1. (a) Observe that setting f(x, y, z) = c gives a cylinder about the x-axis, with radius√c. These surfaces are in graph (I).
(b) By the same reasoning the level curves for h(x, y, z) are cylinders about the y-axis, so they are represented in graph(II).
2. The level surfaces appear to be circular cylinders centered on the z-axis. Since they don’t change with z, there is no z inthe formula, and we can use the formula for a circle in the xy-plane, x2 + y2 = r2. Thus the level surfaces are of theform f(x, y, z) = x2 + y2 = c for c > 0.
3. The plane is represented byz = f(x, y) = 2x− y
2− 3
andg(x, y, z) = 4x− y − 2z = 6.
Other answers are possible
4. The top half of the sphere is represented by
z = f(x, y) =√
10− x2 − y2
andg(x, y, z) = x2 + y2 + z2 = 10, z ≥ 0.
Other answers are possible.
5. The bottom half of the ellipsoid is represented by
z = f(x, y) = −√
2(1− x2 − y2)
g(x, y, z) = x2 + y2 +z2
2= 1, z ≤ 0.
Other answers are possible
6. Yes,
z = f(x, y) =2
5x+
3
5y − 2.
7. No, because some z values correspond to two points on the surface.
8. Yes,z = f(x, y) = x2 + 3y2.
12.5 SOLUTIONS 889
9. No, because z =√x2 + 3y2 and z = −
√x2 + 3y2, so some z-values correspond to two points on the surface.
10. We are looking for all points (x, y, z) whose distance from the origin is 2, that is, (x− 0)2 + (y − 0)2 + (z − 0)2 = 4,or x2 + y2 + z2 = 4, which is a level surface of f(x, y, z) = x2 + y2 + z2.
11. We are looking for all points (x, y, z) whose distance from (a, b, c) is a constant k, that is, (x−a)2+(y−b)2+(z−c)2 =k2, which is a level surface of f(x, y, z) = (x− a)2 + (y − b)2 + (z − c)2.
12. If we solve for z, we get z = 13(5− x− 2y), so the level surface is the graph of f(x, y) = 1
3(5− x− 2y).
13. If we solve for z, we get z = (1− x2 − y)2, so the level surface is the graph of f(x, y) = (1− x2 − y)2.
14. Only the elliptical paraboloid, the hyperbolic paraboloid and the plane. These are the only surfaces in the catalog thatsatisfy the “vertical line test,” that is, they have at most one z-value for each x and y.
15. A hyperboloid of two sheets.
16. A cone.
17. An elliptic paraboloid.
18. A cylindrical surface.
Problems
19. The graph of g(x, y) = x+ 2y is the set of all points (x, y, z) satisfying z = x+ 2y, or x+ 2y − z = 0. This is a levelsurface, but we want the surface equal to the constant value 1, not 0, so we can add 1 to both sides to get x+2y−z+1 = 1.Thus, f(x, y, z) = x+ 2y − z + 1 has level surface f = 1 identical to the graph of g(x, y) = x+ 2y.
20. If we solve x2+y2/4+z2/9 = 1 for z we get z = ±3√
1− x2 − y2/4. Thus we can take f(x, y) = 3√
1− x2 − y2/4
and g(x, y) = −3√
1− x2 − y2/4.
21. In the xz-plane, the equation x2/4 + z2 = 1 is an ellipse, with widest points at x = ±2 on the x-axis and crossing thez-axis at z = ±1. Since the equation has no y term, the level surface is a cylinder of elliptical cross-section, centeredalong the y-axis.
22. Setting y to a constant c yields the equation x2 + z2 = 1 − c2/4, which, for −2 ≤ c ≤ 2 gives circular cross-sections.Fixing x = c yields the equation y2/4 + z2 = 1 − c2, which for −1 ≤ c ≤ 1 yields elliptical cross-sections. A similarresult is true for cross-sections with constant z. Thus the level surface appears to be a unit sphere, centered at the origin,that has been stretched by a factor of two in the y-direction (this shape is called an ellipsoid).
23. The level surfaces are graphs of the equations x+ y + z = c for different values of the constant c. These are all parallelplanes, with normal vector~i +~j + ~k .
24. The equation of any plane parallel to the plane z = 2x+3y−5 has x-slope 2 and y-slope 3, so has equation z = 2x+3y−cfor any constant c, or 2x+ 3y − z = c. Thus we could take g(x, y, z) = 2x+ 3y − z. Other answers are possible.
25. The level surfaces are the graphs of sin(x + y + z) = k for constant k (with −1 ≤ k ≤ 1). This means x + y + z =sin−1(k) + 2πn, or π − sin−1(k) + 2nπ for all integers n. Therefore for each value of k, with −1 ≤ k ≤ 1, we get aninfinite family of parallel planes. So the level surfaces are families of parallel planes.
26. The level surfaces are the graphs of g(x, y, z) = e−(x2+y2+z2) = k for constant values of k such that 0 < k ≤ 1. Sox2 + y2 + z2 = − ln k, which is the graph of a sphere since − ln k ≥ 0.
27. (a) The graph of f(x, y) is obtained by plotting points (x, y, z), where z = f(x, y). Since the square root function isnever negative, we have z ≥ 0. Setting z =
√1− x2 − y2 and squaring both sides leads to x2 + y2 + z2 = 1,
which is the equation for a sphere of radius 1. The graph of the function includes only those points where z ≥ 0, thatis, the upper hemisphere of radius 1, centered at the origin.
(b) If we take g(x, y, z) = f(x, y)− z =√
1− x2 − y2 − z, then the level surface g(x, y, z) = 0 is the surface S.
28. (a) The graph of f(x, y) is obtained by plotting points (x, y, z), where z = f(x, y). Since the square root function isnever negative, we have z ≥ 0. Setting z =
√1− y2 and squaring both sides leads to y2 + z2 = 1, which is the
equation for a circular cylinder of radius 1 lying along the x-axis (since x is missing from the equation). The graphof the function includes only those points where z ≥ 0, that is, the upper half of the cylinder.
(b) If we take g(x, y, z) = f(x, y)− z =√
1− y2 − z, then the level surface g(x, y, z) = 0 is the surface S.
29. Starting with the equation z =√x2 + y2, we flip the cone and shift it up one, yielding z = 1 −
√x2 + y2. This is a
cone with vertex at (0, 0, 1) that intersects the xy-plane in a circle of radius 1. Interchanging the variables, we see thaty = 1 −
√x2 + z2 is an equation whose graph includes the desired cone C. Finally, we express this equation as a level
surface g(x, y, z) = 1−√x2 + z2 − y = 0.
890 Chapter Twelve /SOLUTIONS
30. f(x, y, z) = x2 − y2 + z2 has 3 types of level surfaces depending on the values of c in the equation x2 − y2 + z2 = c.We write this as x2 + z2 = y2 + c and think of what happens as we take a cross-section of the surface, perpendicular tothe y-axis by holding y fixed.(i) For c > 0, the level surface is a hyperboloid of 1 sheet.(ii) For c < 0, the level surface is a hyperboloid of 2 sheets.(iii) For c = 0, the level surface is a cone.
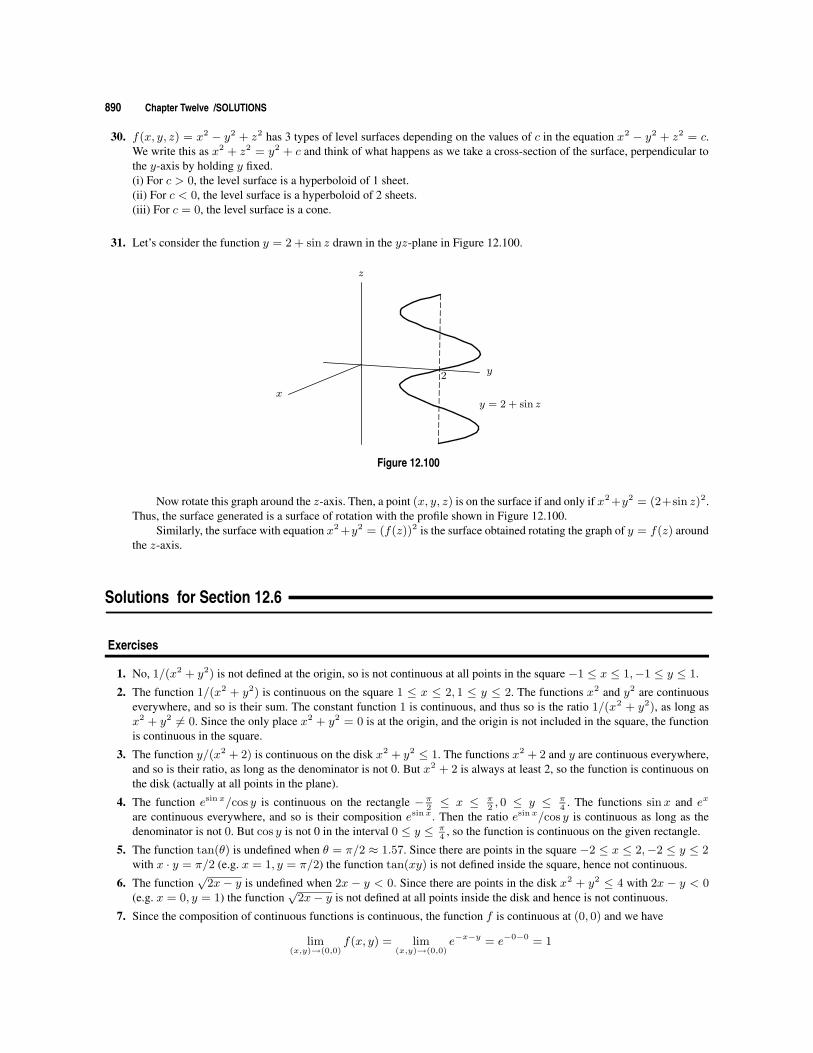
31. Let’s consider the function y = 2 + sin z drawn in the yz-plane in Figure 12.100.
x
y
z
y = 2 + sin z
2
Figure 12.100
Now rotate this graph around the z-axis. Then, a point (x, y, z) is on the surface if and only if x2 +y2 = (2+sin z)2.Thus, the surface generated is a surface of rotation with the profile shown in Figure 12.100.
Similarly, the surface with equation x2 +y2 = (f(z))2 is the surface obtained rotating the graph of y = f(z) aroundthe z-axis.
Solutions for Section 12.6
Exercises
1. No, 1/(x2 + y2) is not defined at the origin, so is not continuous at all points in the square −1 ≤ x ≤ 1,−1 ≤ y ≤ 1.
2. The function 1/(x2 + y2) is continuous on the square 1 ≤ x ≤ 2, 1 ≤ y ≤ 2. The functions x2 and y2 are continuouseverywhere, and so is their sum. The constant function 1 is continuous, and thus so is the ratio 1/(x2 + y2), as long asx2 + y2 6= 0. Since the only place x2 + y2 = 0 is at the origin, and the origin is not included in the square, the functionis continuous in the square.
3. The function y/(x2 + 2) is continuous on the disk x2 + y2 ≤ 1. The functions x2 + 2 and y are continuous everywhere,and so is their ratio, as long as the denominator is not 0. But x2 + 2 is always at least 2, so the function is continuous onthe disk (actually at all points in the plane).
4. The function esin x/cos y is continuous on the rectangle − π2≤ x ≤ π
2, 0 ≤ y ≤ π
4. The functions sinx and ex
are continuous everywhere, and so is their composition esin x. Then the ratio esin x/cos y is continuous as long as thedenominator is not 0. But cos y is not 0 in the interval 0 ≤ y ≤ π
4, so the function is continuous on the given rectangle.
5. The function tan(θ) is undefined when θ = π/2 ≈ 1.57. Since there are points in the square −2 ≤ x ≤ 2,−2 ≤ y ≤ 2with x · y = π/2 (e.g. x = 1, y = π/2) the function tan(xy) is not defined inside the square, hence not continuous.
6. The function√
2x− y is undefined when 2x − y < 0. Since there are points in the disk x2 + y2 ≤ 4 with 2x − y < 0(e.g. x = 0, y = 1) the function
√2x− y is not defined at all points inside the disk and hence is not continuous.
7. Since the composition of continuous functions is continuous, the function f is continuous at (0, 0) and we have
lim(x,y)→(0,0)
f(x, y) = lim(x,y)→(0,0)
e−x−y = e−0−0 = 1
12.6 SOLUTIONS 891
8. Since the composition of continuous functions is continuous, the function f is continuous at (0, 0). We have:
lim(x,y)→(0,0)
f(x, y) = lim(x,y)→(0,0)
(x2 + y2) = 0 + 0 = 0.
9. Since f doesn’t depend on y we have:
lim(x,y)→(0,0)
f(x, y) = limx→0
x
x2 + 1=
0
0 + 1= 0.
10. Since the composition of continuous functions is continuous, the function f is continuous at (0, 0). We have:
lim(x,y)→(0,0)
f(x, y) = lim(x,y)→(0,0)
x+ y
sin y + 2=
0 + 0
0 + 2= 0.
11. We want to compute
lim(x,y)→(0,0)
f(x, y) = lim(x,y)→(0,0)
sin(x2 + y2)
x2 + y2.
As r =√x2 + y2 is the distance from (x, y) to (0, 0) we have that (x, y) → (0, 0) is equivalent to r → 0. Hence the
limit becomes:
lim(x,y)→(0,0)
f(x, y) = limr→0
sin r2
r2= 1.
Problems
12. Points along the positive x-axis are of the form (x, 0); at these points the function looks like 2x/2x = 1 everywhere(except at the origin, where it is undefined). On the other hand, along the y-axis, the function looks like −y2/y2 = −1.Since approaching the origin along two different paths yields numbers that are not the same, the limit does not exist.
13. Points along the positive x-axis are of the form (x, 0); at these points the function looks like x/2x = 1/2 everywhere(except at the origin, where it is undefined). On the other hand, along the y-axis, the function looks like y2/y = y, whichapproaches 0 as we get closer to the origin. Since approaching the origin along two different paths yields numbers thatare not the same, the limit does not exist.
14. It is not continuous at (0, 0). The function f(x, y) = x2 + y2 gets closer and closer to 0 as (x, y) gets closer to theorigin; but the value of f(0, 0) is not 0, it is 2. Since the value of the function is not equal to the limit, the function is notcontinuous at the origin.
15. The function f(x, y) = x2 + y2 + 1 gets closer and closer to 1 as (x, y) gets closer to the origin. To make f continuousat the origin, we need to have f(0, 0) = 1. Thus c = 1 will make the function continuous at the origin.
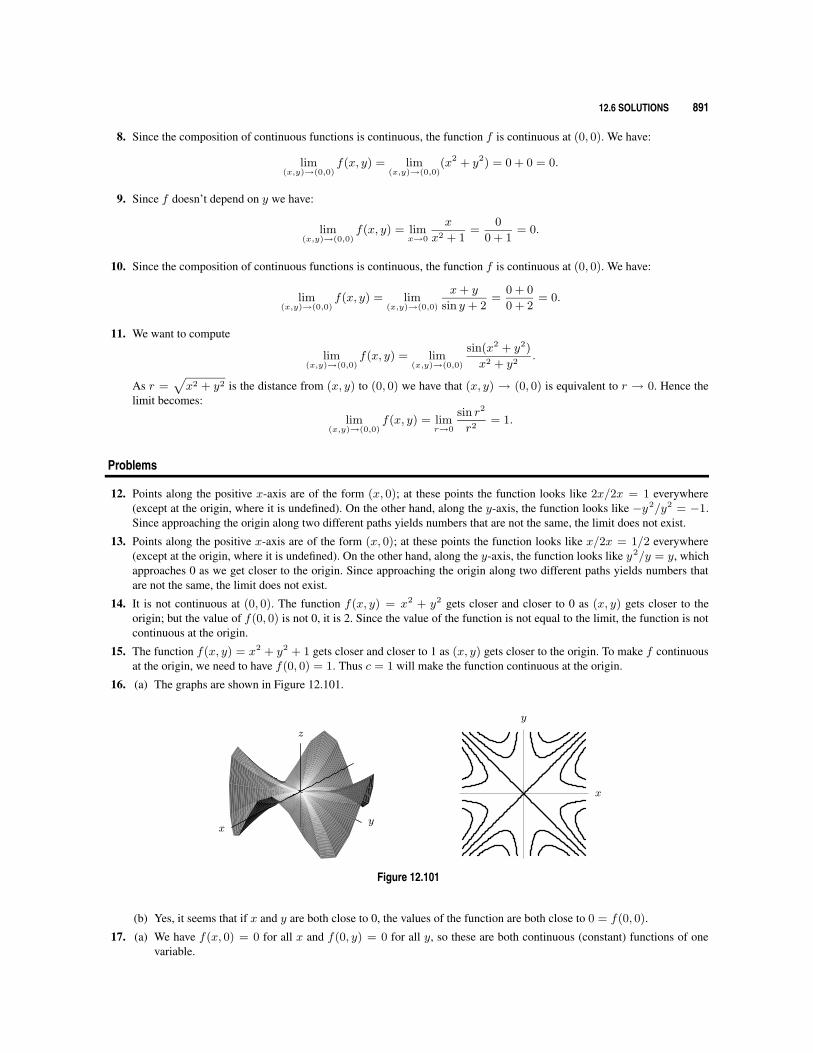
16. (a) The graphs are shown in Figure 12.101.
xy
z
y
x
Figure 12.101
(b) Yes, it seems that if x and y are both close to 0, the values of the function are both close to 0 = f(0, 0).
17. (a) We have f(x, 0) = 0 for all x and f(0, y) = 0 for all y, so these are both continuous (constant) functions of onevariable.
892 Chapter Twelve /SOLUTIONS
(b) The contour diagram suggests that the contours of f are lines through the origin. Providing it is not vertical, theequation of such a line is
y = mx.
To confirm that such lines are contours of f , we must show that f is constant along these lines. Substituting into thefunction, we get
f(x, y) = f(x,mx) =x(mx)
x2 + (mx)2=
mx2
x2 +m2x2=
m
1 +m2= constant.
Since f(x, y) is constant along the line y = mx, such lines are contained in contours of f .(c) We consider the limit of f(x, y) as (x, y)→ (0, 0) along the line y = mx. We can see that
limx→0
f(x,mx) =m
1 +m2.
Therefore, if m = 1 we have
lim(x,y)→(0,0)y=x
f(x, y) =1
2
whereas if m = 0 we havelim
(x,y)→(0,0)y=0
f(x, y) = 0.
Thus, no matter how close we are to the origin, we can find points (x, y) where the value f(x, y) is 1/2 and points(x, y) where the value f(x, y) is 0. So the limit lim(x,y)→(0,0) f(x, y) does not exist. Thus, f is not continuous at(0, 0), even though the one-variable functions f(x, 0) and f(0, y) are continuous at (0, 0). See Figures 17 and 17
18. Let us suppose that (x, y) approaches (0, 0) along the line y = x. Then
f(x, y) = f(x, x) =x3
x4 + x2=
x
x2 + 1.
Thereforelim
(x,y)→(0,0)y=x
f(x, y) = limx→0
x
x2 + 1= 0.
On the other hand, if (x, y) approaches (0, 0) along the parabola y = x2 we have
f(x, y) = f(x, x2) =x4
2x4=
1
2
andlim
(x,y)→(0,0)
y=x2
f(x, y) = limx→0
f(x, x2) =1
2.
Thus no matter how close they are to the origin, there will be points (x, y) such that f(x, y) is close to 0 and points (x, y)such that f(x, y) is close to 1
2. So the limit
lim(x,y)→(0,0)
f(x, y)
does not exist.
19. Let us suppose that (x, y) tends to (0, 0) along the curve y = kx2, where k 6= −1. We get
f(x, y) = f(x, kx2) =x2
x2 + kx2=
1
1 + k.
Therefore:limx→0
f(x, kx2) =1
1 + k
and so for k = 0 we getlim
(x,y)→(0,0)y=0
f(x, y) = 1
and for k = 1
lim(x,y)→(0,0)
y=x2
f(x, y) =1
2.
SOLUTIONS to Review Problems for Chapter Twelve 893
Thus no matter how close they are to the origin, there will be points (x, y) where the value f(x, y) is close to 1 and points(x, y) where f(x, y) is close to 1
2. So the limit:
lim(x,y)→(0,0)
f(x, y)
does not exist.
20. We will study the continuity of f at (a, 0). Now f(a, 0) = 1− a. In addition:
lim(x,y)→(a,0)y>0
f(x, y) = limx→a
(1− x) = 1− a
lim(x,y)→(a,0)y<0
f(x, y) = limx→a−2 = −2.
If a = 3, thenlim
(x,y)→(3,0)y>0
f(x, y) = 1− 3 = −2 = lim(x,y)→(3,0)y<0
f(x, y)
and so lim(x,y)→(3,0) f(x, y) = −2 = f(3, 0). Therefore f is continuous at (3, 0).On the other hand, if a 6= 3, then
lim(x,y)→(a,0)y>0
f(x, y) = 1− a 6= −2 = lim(x,y)→(a,0)y<0
f(x, y)
so lim(x,y)→(a,0) f(x, y) does not exist. Thus f is not continuous at (a, 0) if a 6= 3.Thus, f is not continuous along the line y = 0. (In fact the only point on this line where f is continuous is the point
(3, 0).)
21. The function, f is continuous at all points (x, y) with x 6= 3. We analyze the continuity of f at the point (3, a). We have:
lim(x,y)→(3,a),x<3
f(x, y) = limy→a
(c+ y) = c+ a
lim(x,y)→(3,a),x>3
f(x, y) = limx>3,x→3
(5− x) = 2.
We want to see if we can find one value of c such that c + a = 2 for all a. This would mean that c = 2 − a, but then cwould be dependent on a. Therefore, we cannot make the function continuous everywhere.
22. The function f is continuous at all points (x, y) with x 6= 3. So let’s analyze the continuity of f at the point (3, a). Wehave
lim(x,y)→(3,a)x<3
f(x, y) = limy→a
(c+ y) = c+ a
lim(x,y)→(3,a)x>3
f(x, y) = limy→a
(5− y) = 5− a.
So we need to see if we can find one value for c such that c+a = 5−a for all a. This would require that c = 5−2a,but then c would depend on a, which is exactly what we don’t want. Therefore, we cannot make the function continuouseverywhere.
Solutions for Chapter 12 Review
Exercises
1. Could not be true. If the origin is on the level curve z = 1, then z = f(0, 0) = 1 6= −1. So (0, 0) cannot be on bothz = 1 and z = −1.
2. Might be true. One may consider the function
z = f(x, y) = (x2 + y2 − 2)(x2 + y2 − 3) + 1
894 Chapter Twelve /SOLUTIONS
3. Might be true. The function z = x2 − y2 + 1 has this property. The level curve z = 1 is the lines y = x and y = −x.
4. Not true. There are no level curves for z > 1 or z ≤ 0.
5. True. For every point (x, y), compute the value z = e−(x2+y2) at that point. The level curve obtained by getting z equalto that value goes through the point (x, y).
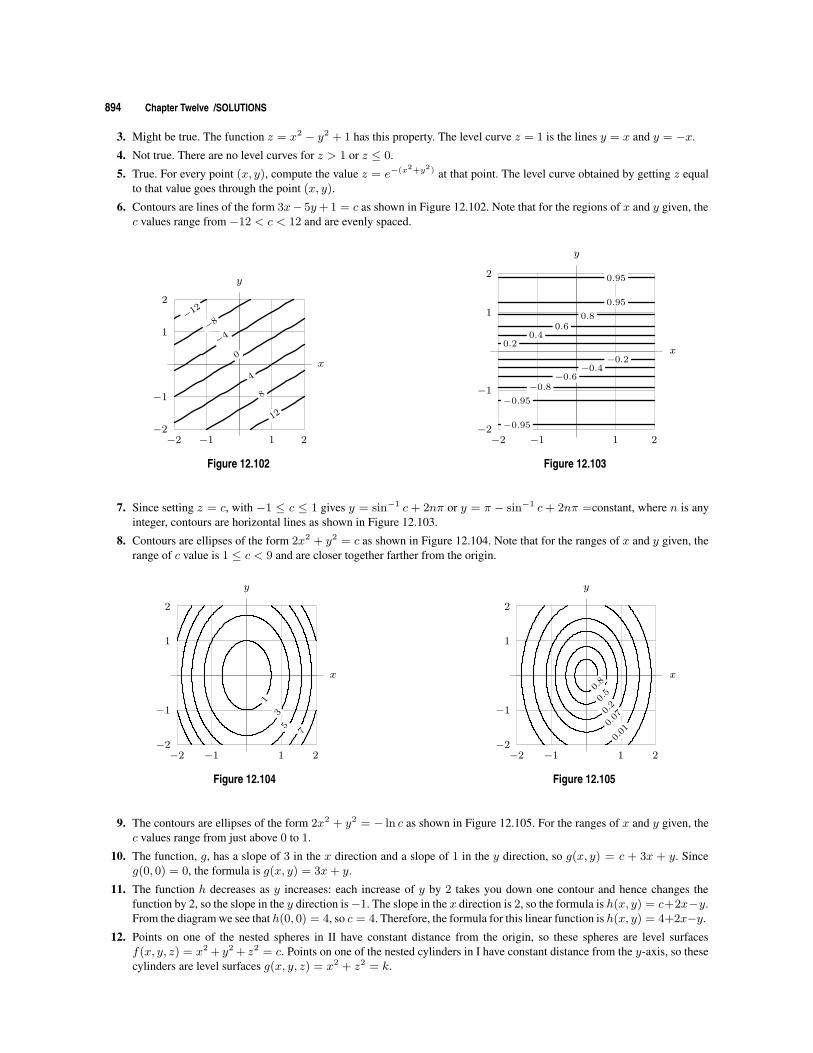
6. Contours are lines of the form 3x− 5y+ 1 = c as shown in Figure 12.102. Note that for the regions of x and y given, thec values range from −12 < c < 12 and are evenly spaced.
−2 −1 1 2−2
−1
1
2
x
y
−12
−8
−4
0
4
8
12
Figure 12.102
−2 −1 1 2−2
−1
1
2
x
y
−0.2
0.20.4
−0.4−0.6
0.60.8
−0.8
0.95
0.95
−0.95
−0.95
Figure 12.103
7. Since setting z = c, with −1 ≤ c ≤ 1 gives y = sin−1 c + 2nπ or y = π − sin−1 c + 2nπ =constant, where n is anyinteger, contours are horizontal lines as shown in Figure 12.103.
8. Contours are ellipses of the form 2x2 + y2 = c as shown in Figure 12.104. Note that for the ranges of x and y given, therange of c value is 1 ≤ c < 9 and are closer together farther from the origin.
−2 −1 1 2−2
−1
1
2
x
y
1
35
7
Figure 12.104
−2 −1 1 2−2
−1
1
2
x
y
0.8
0.5
0.2
0.07
0.01
Figure 12.105
9. The contours are ellipses of the form 2x2 + y2 = − ln c as shown in Figure 12.105. For the ranges of x and y given, thec values range from just above 0 to 1.
10. The function, g, has a slope of 3 in the x direction and a slope of 1 in the y direction, so g(x, y) = c + 3x + y. Sinceg(0, 0) = 0, the formula is g(x, y) = 3x+ y.
11. The function h decreases as y increases: each increase of y by 2 takes you down one contour and hence changes thefunction by 2, so the slope in the y direction is−1. The slope in the x direction is 2, so the formula is h(x, y) = c+2x−y.From the diagram we see that h(0, 0) = 4, so c = 4. Therefore, the formula for this linear function is h(x, y) = 4+2x−y.
12. Points on one of the nested spheres in II have constant distance from the origin, so these spheres are level surfacesf(x, y, z) = x2 + y2 + z2 = c. Points on one of the nested cylinders in I have constant distance from the y-axis, so thesecylinders are level surfaces g(x, y, z) = x2 + z2 = k.
SOLUTIONS to Review Problems for Chapter Twelve 895
13. These conditions describe a line parallel to the z-axis which passes through the xy-plane at (2, 1, 0).
14. The equation will be of the form mx + ny + ez = d, but you can divide through by d to get an equation of the formax + by + cz = 1 (d can not be zero, as the origin is not in the plane). Now plug in the points: From (0, 0, 2), we geta(0) + b(0) + c(2) = 1. From this we get c = 1
2. Similarly we get a = 1
5, and b = 1
3. So the equation that fits these
points is
x
5+y
3+z
2= 1.
The equation of this plane can also be obtained by calculating the normal as the cross product of two vectors lying in theplane.
15. We complete the square
x2 + 4x+ y2 − 6y + z2 + 12z = 0
x2 + 4x+ 4 + y2 − 6y + 9 + z2 + 12z + 36 = 4 + 9 + 36
(x+ 2)2 + (y − 3)2 + (z + 6)2 = 49
The center is (−2, 3,−6) and the radius is 7.
Problems
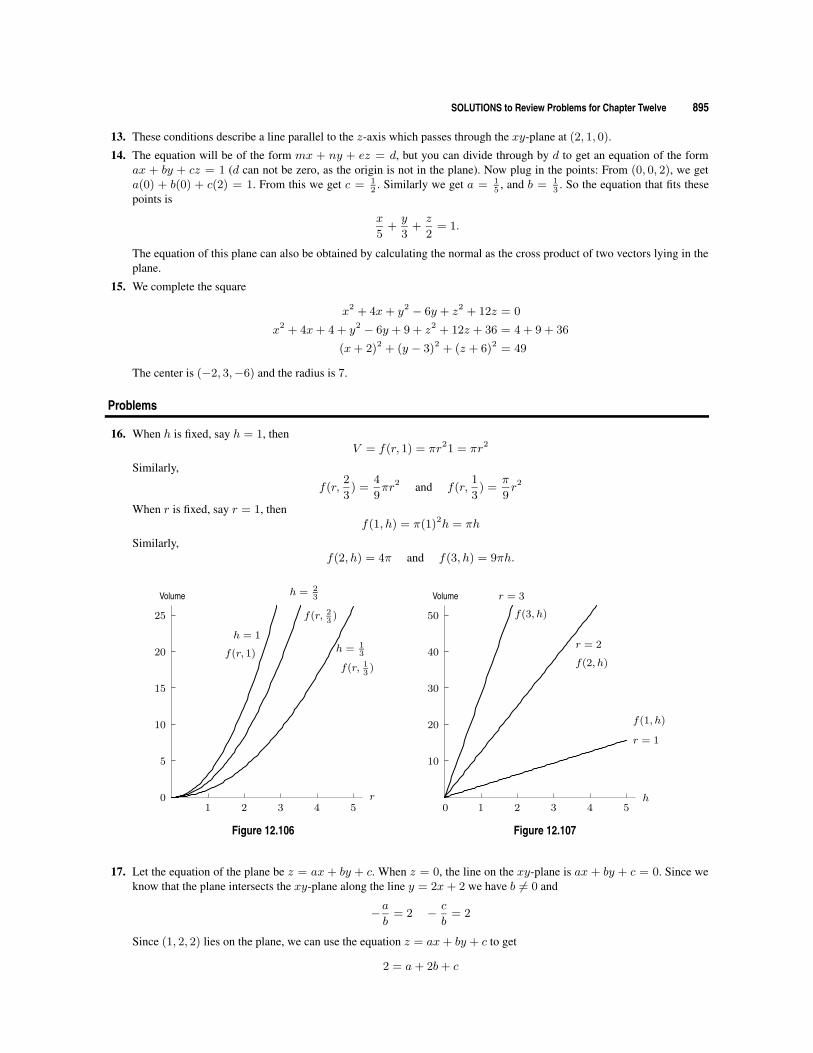
16. When h is fixed, say h = 1, thenV = f(r, 1) = πr21 = πr2
Similarly,
f(r,2
3) =
4
9πr2 and f(r,
1
3) =
π
9r2
When r is fixed, say r = 1, thenf(1, h) = π(1)2h = πh
Similarly,f(2, h) = 4π and f(3, h) = 9πh.
1 2 3 4 50
5
10
15
20
25
r
Volume
h = 13
f(r, 13
)
h = 23
f(r, 23
)
f(r, 1)
h = 1
Figure 12.106
1 2 3 4 50
10
20
30
40
50
r = 1
f(1, h)
r = 2
f(2, h)
r = 3
f(3, h)
h
Volume
Figure 12.107
17. Let the equation of the plane be z = ax + by + c. When z = 0, the line on the xy-plane is ax + by + c = 0. Since weknow that the plane intersects the xy-plane along the line y = 2x+ 2 we have b 6= 0 and
−ab
= 2 − c
b= 2
Since (1, 2, 2) lies on the plane, we can use the equation z = ax+ by + c to get
2 = a+ 2b+ c
896 Chapter Twelve /SOLUTIONS
Solving the equations givesa = 2,
b = −1,
c = 2.
Hence z = 2x− y + 2 and the linear function is f(x, y) = 2x− y + 2.
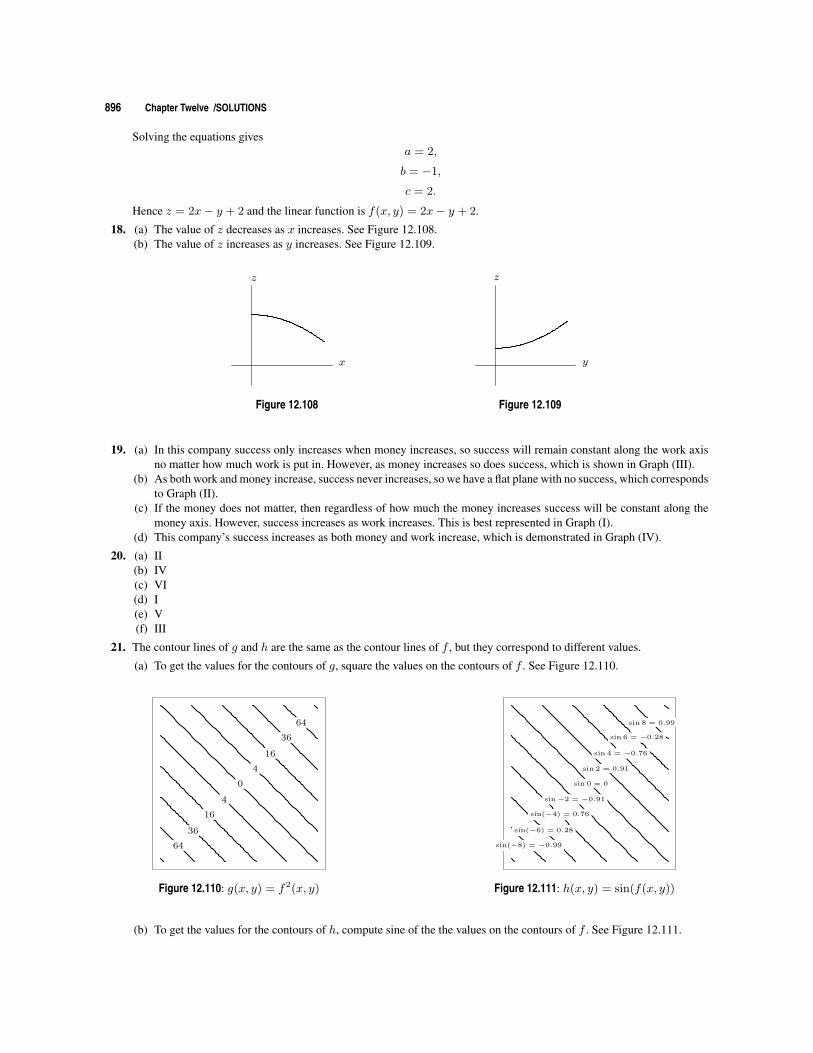
18. (a) The value of z decreases as x increases. See Figure 12.108.(b) The value of z increases as y increases. See Figure 12.109.
x
z
Figure 12.108
y
z
Figure 12.109
19. (a) In this company success only increases when money increases, so success will remain constant along the work axisno matter how much work is put in. However, as money increases so does success, which is shown in Graph (III).
(b) As both work and money increase, success never increases, so we have a flat plane with no success, which correspondsto Graph (II).
(c) If the money does not matter, then regardless of how much the money increases success will be constant along themoney axis. However, success increases as work increases. This is best represented in Graph (I).
(d) This company’s success increases as both money and work increase, which is demonstrated in Graph (IV).
20. (a) II(b) IV(c) VI(d) I(e) V(f) III
21. The contour lines of g and h are the same as the contour lines of f , but they correspond to different values.
(a) To get the values for the contours of g, square the values on the contours of f . See Figure 12.110.
64
36
16
4
0
4
16
36
64
Figure 12.110: g(x, y) = f2(x, y)
sin(−8) = −0.99
sin(−6) = 0.28
sin(−4) = 0.76
sin−2 = −0.91
sin 0 = 0
sin 2 = 0.91
sin 4 = −0.76
sin 6 = −0.28
sin 8 = 0.99
Figure 12.111: h(x, y) = sin(f(x, y))
(b) To get the values for the contours of h, compute sine of the the values on the contours of f . See Figure 12.111.
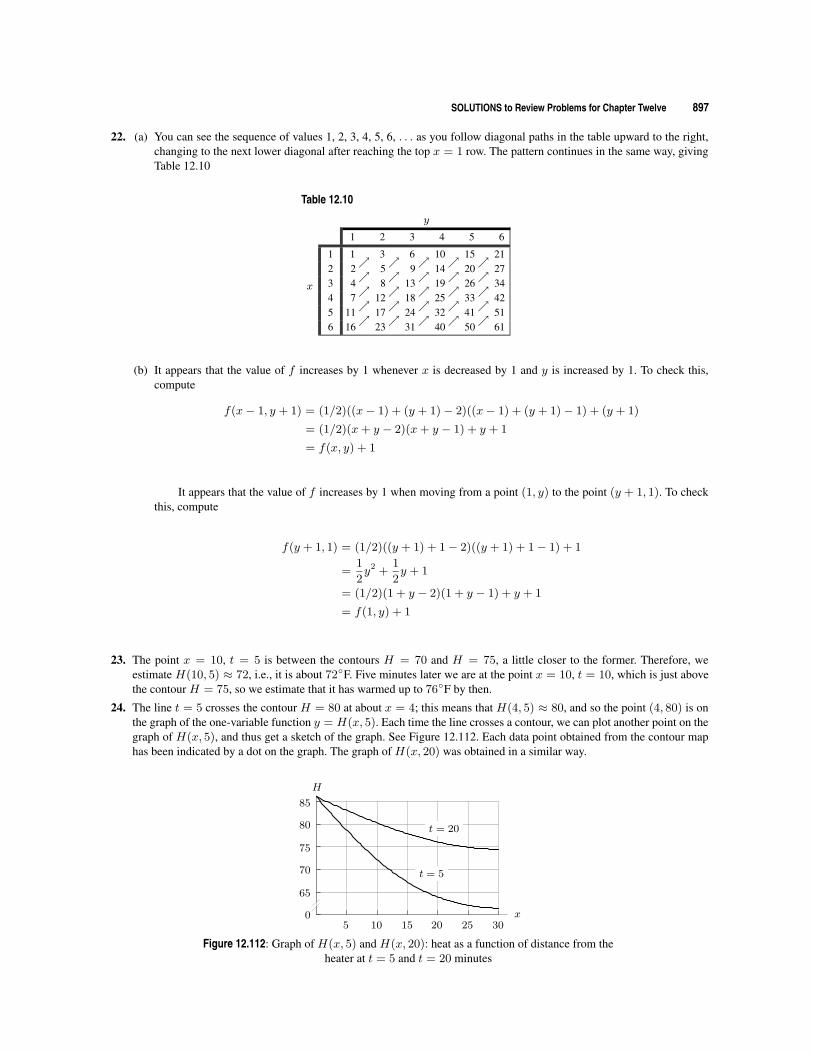
SOLUTIONS to Review Problems for Chapter Twelve 897
22. (a) You can see the sequence of values 1, 2, 3, 4, 5, 6, . . . as you follow diagonal paths in the table upward to the right,changing to the next lower diagonal after reaching the top x = 1 row. The pattern continues in the same way, givingTable 12.10
Table 12.10
x
y
1 2 3 4 5 6
1 1 3 6 10 15 212 2
↗5↗
9↗
14↗
20↗
273 4
↗8↗
13↗
19↗
26↗
344 7
↗12↗
18↗
25↗
33↗
425 11
↗17↗
24↗
32↗
41↗
516 16
↗23↗
31↗
40↗
50↗
61
(b) It appears that the value of f increases by 1 whenever x is decreased by 1 and y is increased by 1. To check this,compute
f(x− 1, y + 1) = (1/2)((x− 1) + (y + 1)− 2)((x− 1) + (y + 1)− 1) + (y + 1)
= (1/2)(x+ y − 2)(x+ y − 1) + y + 1
= f(x, y) + 1
It appears that the value of f increases by 1 when moving from a point (1, y) to the point (y + 1, 1). To checkthis, compute
f(y + 1, 1) = (1/2)((y + 1) + 1− 2)((y + 1) + 1− 1) + 1
=1
2y2 +
1
2y + 1
= (1/2)(1 + y − 2)(1 + y − 1) + y + 1
= f(1, y) + 1
23. The point x = 10, t = 5 is between the contours H = 70 and H = 75, a little closer to the former. Therefore, weestimate H(10, 5) ≈ 72, i.e., it is about 72◦F. Five minutes later we are at the point x = 10, t = 10, which is just abovethe contour H = 75, so we estimate that it has warmed up to 76◦F by then.
24. The line t = 5 crosses the contour H = 80 at about x = 4; this means that H(4, 5) ≈ 80, and so the point (4, 80) is onthe graph of the one-variable function y = H(x, 5). Each time the line crosses a contour, we can plot another point on thegraph of H(x, 5), and thus get a sketch of the graph. See Figure 12.112. Each data point obtained from the contour maphas been indicated by a dot on the graph. The graph of H(x, 20) was obtained in a similar way.
5 10 15 20 25 300
65
70
75
80
85
x
H
t = 20
t = 5
Figure 12.112: Graph of H(x, 5) and H(x, 20): heat as a function of distance from theheater at t = 5 and t = 20 minutes
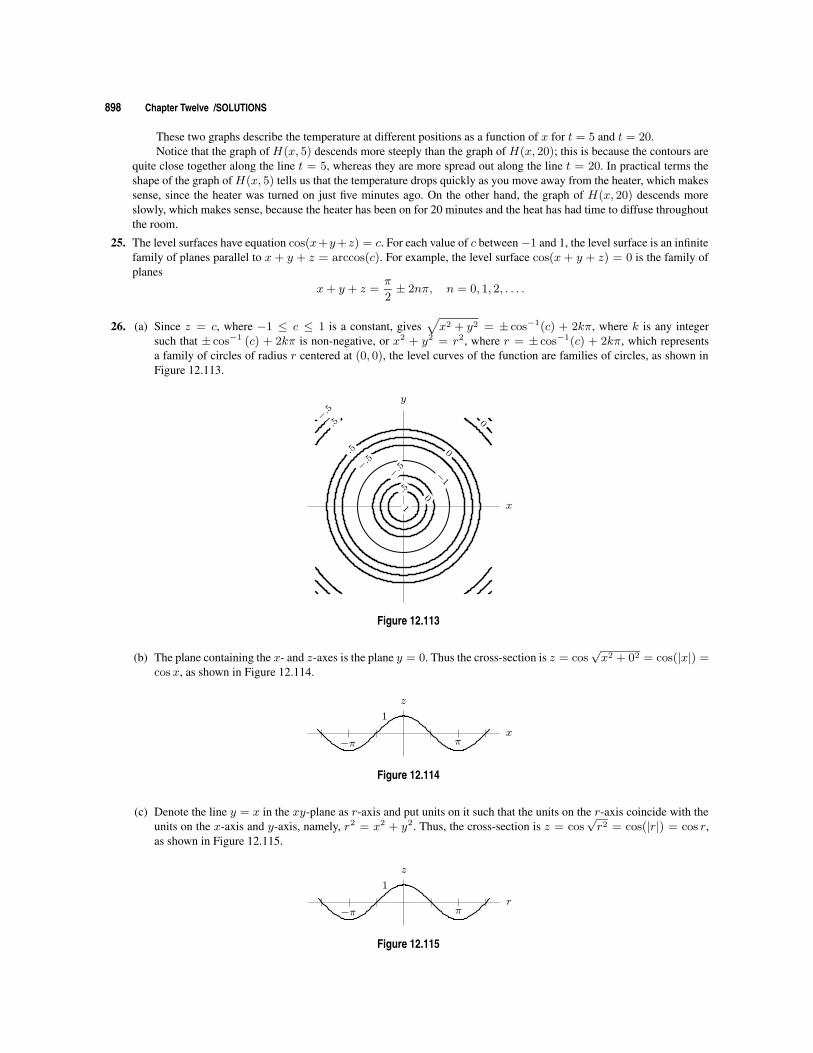
898 Chapter Twelve /SOLUTIONS
These two graphs describe the temperature at different positions as a function of x for t = 5 and t = 20.Notice that the graph of H(x, 5) descends more steeply than the graph of H(x, 20); this is because the contours are
quite close together along the line t = 5, whereas they are more spread out along the line t = 20. In practical terms theshape of the graph of H(x, 5) tells us that the temperature drops quickly as you move away from the heater, which makessense, since the heater was turned on just five minutes ago. On the other hand, the graph of H(x, 20) descends moreslowly, which makes sense, because the heater has been on for 20 minutes and the heat has had time to diffuse throughoutthe room.
25. The level surfaces have equation cos(x+y+z) = c. For each value of c between−1 and 1, the level surface is an infinitefamily of planes parallel to x + y + z = arccos(c). For example, the level surface cos(x + y + z) = 0 is the family ofplanes
x+ y + z =π
2± 2nπ, n = 0, 1, 2, . . . .
26. (a) Since z = c, where −1 ≤ c ≤ 1 is a constant, gives√x2 + y2 = ± cos−1(c) + 2kπ, where k is any integer
such that ± cos−1 (c) + 2kπ is non-negative, or x2 + y2 = r2, where r = ± cos−1(c) + 2kπ, which representsa family of circles of radius r centered at (0, 0), the level curves of the function are families of circles, as shown inFigure 12.113.
x
y
1
.50
−.5 −
1
−.5
0.5
.5 0−.5
Figure 12.113
(b) The plane containing the x- and z-axes is the plane y = 0. Thus the cross-section is z = cos√x2 + 02 = cos(|x|) =
cosx, as shown in Figure 12.114.
−π π
1
x
z
Figure 12.114
(c) Denote the line y = x in the xy-plane as r-axis and put units on it such that the units on the r-axis coincide with theunits on the x-axis and y-axis, namely, r2 = x2 + y2. Thus, the cross-section is z = cos
√r2 = cos(|r|) = cos r,
as shown in Figure 12.115.
−π π
1
r
z
Figure 12.115
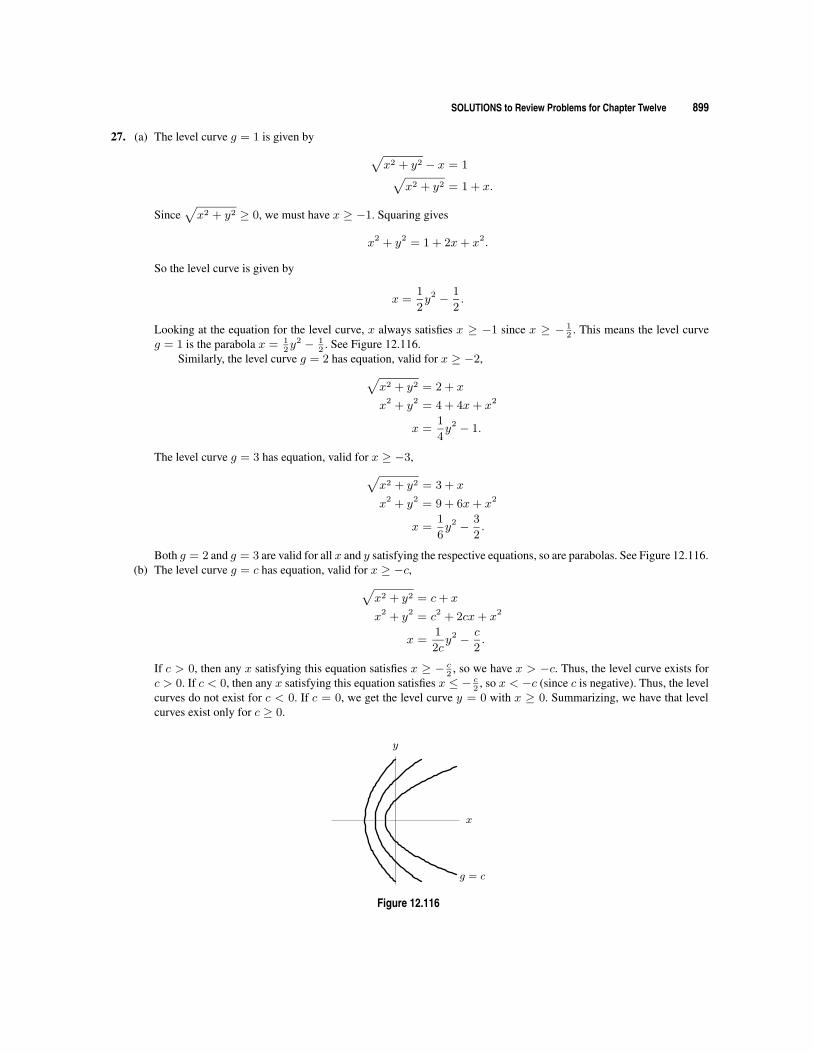
SOLUTIONS to Review Problems for Chapter Twelve 899
27. (a) The level curve g = 1 is given by√x2 + y2 − x = 1√
x2 + y2 = 1 + x.
Since√x2 + y2 ≥ 0, we must have x ≥ −1. Squaring gives
x2 + y2 = 1 + 2x+ x2.
So the level curve is given by
x =1
2y2 − 1
2.
Looking at the equation for the level curve, x always satisfies x ≥ −1 since x ≥ − 12
. This means the level curveg = 1 is the parabola x = 1
2y2 − 1
2. See Figure 12.116.
Similarly, the level curve g = 2 has equation, valid for x ≥ −2,√x2 + y2 = 2 + x
x2 + y2 = 4 + 4x+ x2
x =1
4y2 − 1.
The level curve g = 3 has equation, valid for x ≥ −3,√x2 + y2 = 3 + x
x2 + y2 = 9 + 6x+ x2
x =1
6y2 − 3
2.
Both g = 2 and g = 3 are valid for all x and y satisfying the respective equations, so are parabolas. See Figure 12.116.(b) The level curve g = c has equation, valid for x ≥ −c,
√x2 + y2 = c+ x
x2 + y2 = c2 + 2cx+ x2
x =1
2cy2 − c
2.
If c > 0, then any x satisfying this equation satisfies x ≥ − c2
, so we have x > −c. Thus, the level curve exists forc > 0. If c < 0, then any x satisfying this equation satisfies x ≤ − c
2, so x < −c (since c is negative). Thus, the level
curves do not exist for c < 0. If c = 0, we get the level curve y = 0 with x ≥ 0. Summarizing, we have that levelcurves exist only for c ≥ 0.
x
y
g = c
Figure 12.116
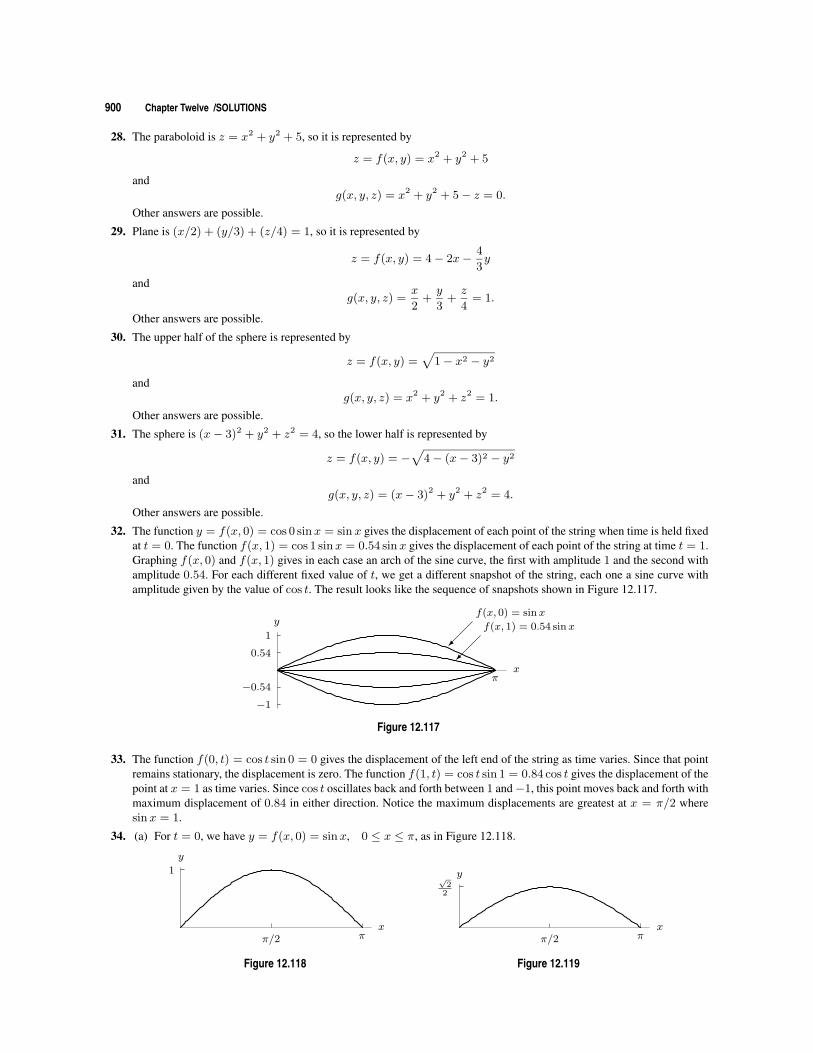
900 Chapter Twelve /SOLUTIONS
28. The paraboloid is z = x2 + y2 + 5, so it is represented by
z = f(x, y) = x2 + y2 + 5
andg(x, y, z) = x2 + y2 + 5− z = 0.
Other answers are possible.
29. Plane is (x/2) + (y/3) + (z/4) = 1, so it is represented by
z = f(x, y) = 4− 2x− 4
3y
andg(x, y, z) =
x
2+y
3+z
4= 1.
Other answers are possible.
30. The upper half of the sphere is represented by
z = f(x, y) =√
1− x2 − y2
andg(x, y, z) = x2 + y2 + z2 = 1.
Other answers are possible.
31. The sphere is (x− 3)2 + y2 + z2 = 4, so the lower half is represented by
z = f(x, y) = −√
4− (x− 3)2 − y2
andg(x, y, z) = (x− 3)2 + y2 + z2 = 4.
Other answers are possible.
32. The function y = f(x, 0) = cos 0 sinx = sinx gives the displacement of each point of the string when time is held fixedat t = 0. The function f(x, 1) = cos 1 sinx = 0.54 sinx gives the displacement of each point of the string at time t = 1.Graphing f(x, 0) and f(x, 1) gives in each case an arch of the sine curve, the first with amplitude 1 and the second withamplitude 0.54. For each different fixed value of t, we get a different snapshot of the string, each one a sine curve withamplitude given by the value of cos t. The result looks like the sequence of snapshots shown in Figure 12.117.
π
−1
−0.54
0.54
1
x
y
f(x, 0) = sinx
f(x, 1) = 0.54 sinx
Figure 12.117
33. The function f(0, t) = cos t sin 0 = 0 gives the displacement of the left end of the string as time varies. Since that pointremains stationary, the displacement is zero. The function f(1, t) = cos t sin 1 = 0.84 cos t gives the displacement of thepoint at x = 1 as time varies. Since cos t oscillates back and forth between 1 and−1, this point moves back and forth withmaximum displacement of 0.84 in either direction. Notice the maximum displacements are greatest at x = π/2 wheresinx = 1.
34. (a) For t = 0, we have y = f(x, 0) = sinx, 0 ≤ x ≤ π, as in Figure 12.118.
π/2 π
1
x
y
Figure 12.118
π/2 π
√2
2
x
y
Figure 12.119
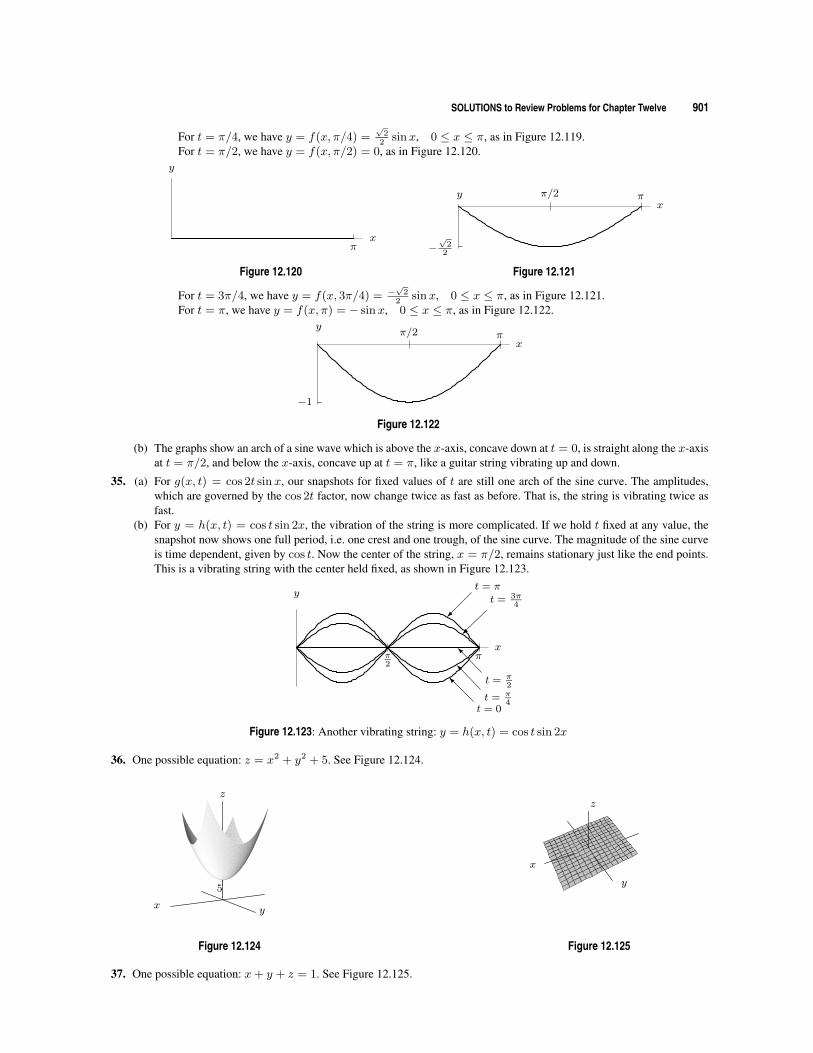
SOLUTIONS to Review Problems for Chapter Twelve 901
For t = π/4, we have y = f(x, π/4) =√
22
sinx, 0 ≤ x ≤ π, as in Figure 12.119.For t = π/2, we have y = f(x, π/2) = 0, as in Figure 12.120.
πx
y
Figure 12.120
π/2 π
−√
22
xy
Figure 12.121
For t = 3π/4, we have y = f(x, 3π/4) = −√
22
sinx, 0 ≤ x ≤ π, as in Figure 12.121.For t = π, we have y = f(x, π) = − sinx, 0 ≤ x ≤ π, as in Figure 12.122.
π/2 πx
−1
y
Figure 12.122
(b) The graphs show an arch of a sine wave which is above the x-axis, concave down at t = 0, is straight along the x-axisat t = π/2, and below the x-axis, concave up at t = π, like a guitar string vibrating up and down.
35. (a) For g(x, t) = cos 2t sinx, our snapshots for fixed values of t are still one arch of the sine curve. The amplitudes,which are governed by the cos 2t factor, now change twice as fast as before. That is, the string is vibrating twice asfast.
(b) For y = h(x, t) = cos t sin 2x, the vibration of the string is more complicated. If we hold t fixed at any value, thesnapshot now shows one full period, i.e. one crest and one trough, of the sine curve. The magnitude of the sine curveis time dependent, given by cos t. Now the center of the string, x = π/2, remains stationary just like the end points.This is a vibrating string with the center held fixed, as shown in Figure 12.123.
π2
πx
y
t = π
t = 3π4
I
t = 0
I
t = π4
I
t = π2
Figure 12.123: Another vibrating string: y = h(x, t) = cos t sin 2x
36. One possible equation: z = x2 + y2 + 5. See Figure 12.124.
yx
z
5
Figure 12.124
y
x
z
Figure 12.125
37. One possible equation: x+ y + z = 1. See Figure 12.125.
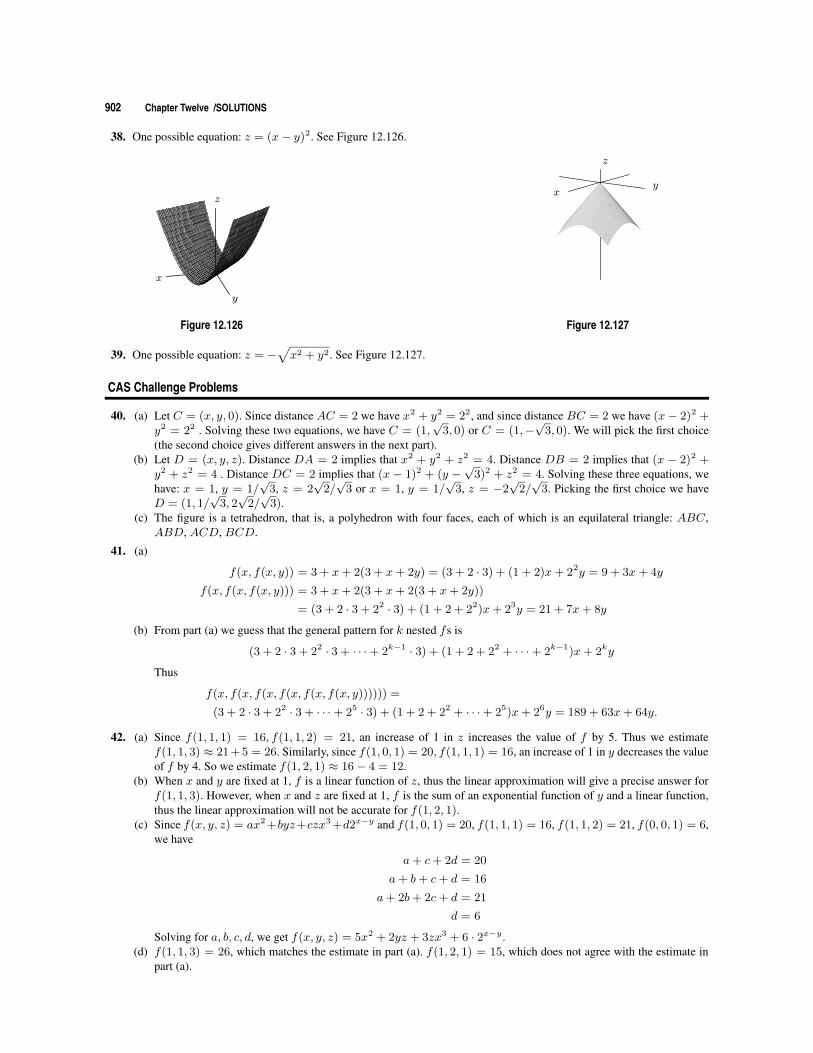
902 Chapter Twelve /SOLUTIONS
38. One possible equation: z = (x− y)2. See Figure 12.126.
z
y
x
Figure 12.126
yx
z
Figure 12.127
39. One possible equation: z = −√x2 + y2. See Figure 12.127.
CAS Challenge Problems
40. (a) Let C = (x, y, 0). Since distance AC = 2 we have x2 + y2 = 22, and since distance BC = 2 we have (x− 2)2 +y2 = 22 . Solving these two equations, we have C = (1,
√3, 0) or C = (1,−
√3, 0). We will pick the first choice
(the second choice gives different answers in the next part).(b) Let D = (x, y, z). Distance DA = 2 implies that x2 + y2 + z2 = 4. Distance DB = 2 implies that (x − 2)2 +
y2 + z2 = 4 . Distance DC = 2 implies that (x − 1)2 + (y −√
3)2 + z2 = 4. Solving these three equations, wehave: x = 1, y = 1/
√3, z = 2
√2/√
3 or x = 1, y = 1/√
3, z = −2√
2/√
3. Picking the first choice we haveD = (1, 1/
√3, 2√
2/√
3).(c) The figure is a tetrahedron, that is, a polyhedron with four faces, each of which is an equilateral triangle: ABC,
ABD, ACD, BCD.
41. (a)
f(x, f(x, y)) = 3 + x+ 2(3 + x+ 2y) = (3 + 2 · 3) + (1 + 2)x+ 22y = 9 + 3x+ 4y
f(x, f(x, f(x, y))) = 3 + x+ 2(3 + x+ 2(3 + x+ 2y))
= (3 + 2 · 3 + 22 · 3) + (1 + 2 + 22)x+ 23y = 21 + 7x+ 8y
(b) From part (a) we guess that the general pattern for k nested fs is
(3 + 2 · 3 + 22 · 3 + · · ·+ 2k−1 · 3) + (1 + 2 + 22 + · · ·+ 2k−1)x+ 2ky
Thus
f(x, f(x, f(x, f(x, f(x, f(x, y)))))) =
(3 + 2 · 3 + 22 · 3 + · · ·+ 25 · 3) + (1 + 2 + 22 + · · ·+ 25)x+ 26y = 189 + 63x+ 64y.
42. (a) Since f(1, 1, 1) = 16, f(1, 1, 2) = 21, an increase of 1 in z increases the value of f by 5. Thus we estimatef(1, 1, 3) ≈ 21 + 5 = 26. Similarly, since f(1, 0, 1) = 20, f(1, 1, 1) = 16, an increase of 1 in y decreases the valueof f by 4. So we estimate f(1, 2, 1) ≈ 16− 4 = 12.
(b) When x and y are fixed at 1, f is a linear function of z, thus the linear approximation will give a precise answer forf(1, 1, 3). However, when x and z are fixed at 1, f is the sum of an exponential function of y and a linear function,thus the linear approximation will not be accurate for f(1, 2, 1).
(c) Since f(x, y, z) = ax2 +byz+czx3 +d2x−y and f(1, 0, 1) = 20, f(1, 1, 1) = 16, f(1, 1, 2) = 21, f(0, 0, 1) = 6,we have
a+ c+ 2d = 20
a+ b+ c+ d = 16
a+ 2b+ 2c+ d = 21
d = 6
Solving for a, b, c, d, we get f(x, y, z) = 5x2 + 2yz + 3zx3 + 6 · 2x−y .(d) f(1, 1, 3) = 26, which matches the estimate in part (a). f(1, 2, 1) = 15, which does not agree with the estimate in
part (a).
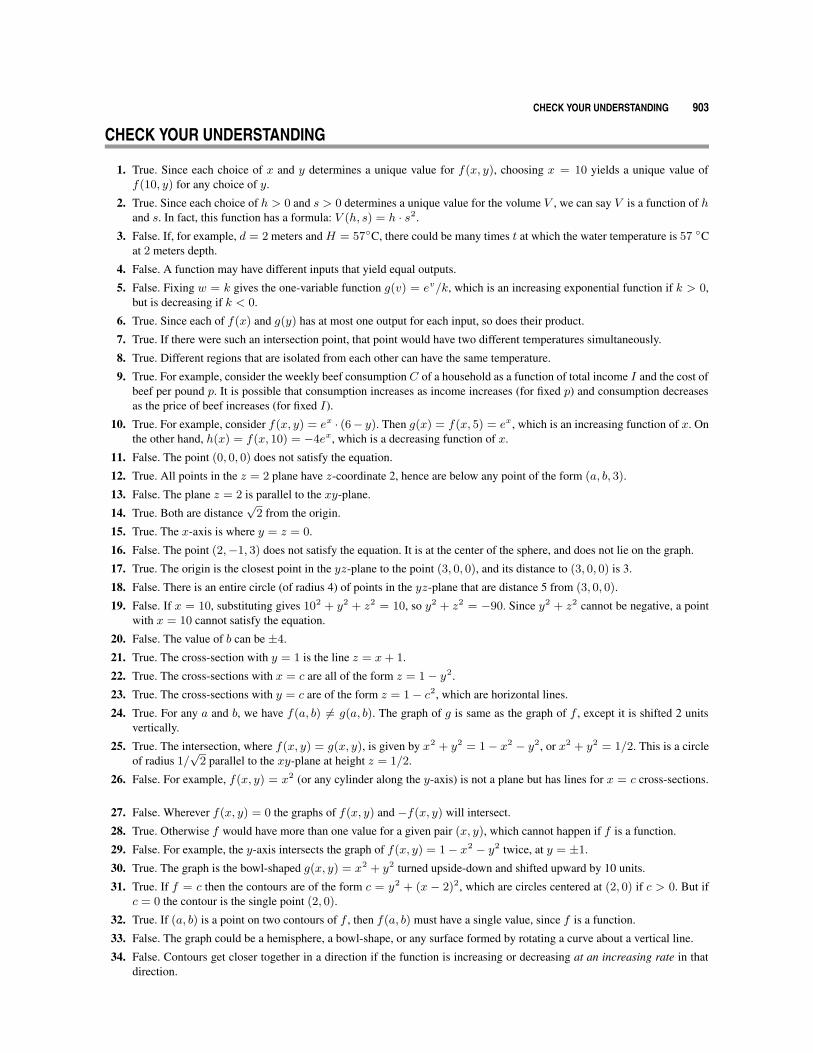
CHECK YOUR UNDERSTANDING 903
CHECK YOUR UNDERSTANDING
1. True. Since each choice of x and y determines a unique value for f(x, y), choosing x = 10 yields a unique value off(10, y) for any choice of y.
2. True. Since each choice of h > 0 and s > 0 determines a unique value for the volume V , we can say V is a function of hand s. In fact, this function has a formula: V (h, s) = h · s2.
3. False. If, for example, d = 2 meters and H = 57◦C, there could be many times t at which the water temperature is 57 ◦Cat 2 meters depth.
4. False. A function may have different inputs that yield equal outputs.
5. False. Fixing w = k gives the one-variable function g(v) = ev/k, which is an increasing exponential function if k > 0,but is decreasing if k < 0.
6. True. Since each of f(x) and g(y) has at most one output for each input, so does their product.
7. True. If there were such an intersection point, that point would have two different temperatures simultaneously.
8. True. Different regions that are isolated from each other can have the same temperature.
9. True. For example, consider the weekly beef consumption C of a household as a function of total income I and the cost ofbeef per pound p. It is possible that consumption increases as income increases (for fixed p) and consumption decreasesas the price of beef increases (for fixed I).
10. True. For example, consider f(x, y) = ex · (6− y). Then g(x) = f(x, 5) = ex, which is an increasing function of x. Onthe other hand, h(x) = f(x, 10) = −4ex, which is a decreasing function of x.
11. False. The point (0, 0, 0) does not satisfy the equation.
12. True. All points in the z = 2 plane have z-coordinate 2, hence are below any point of the form (a, b, 3).
13. False. The plane z = 2 is parallel to the xy-plane.
14. True. Both are distance√
2 from the origin.
15. True. The x-axis is where y = z = 0.
16. False. The point (2,−1, 3) does not satisfy the equation. It is at the center of the sphere, and does not lie on the graph.
17. True. The origin is the closest point in the yz-plane to the point (3, 0, 0), and its distance to (3, 0, 0) is 3.
18. False. There is an entire circle (of radius 4) of points in the yz-plane that are distance 5 from (3, 0, 0).
19. False. If x = 10, substituting gives 102 + y2 + z2 = 10, so y2 + z2 = −90. Since y2 + z2 cannot be negative, a pointwith x = 10 cannot satisfy the equation.
20. False. The value of b can be ±4.
21. True. The cross-section with y = 1 is the line z = x+ 1.
22. True. The cross-sections with x = c are all of the form z = 1− y2.
23. True. The cross-sections with y = c are of the form z = 1− c2, which are horizontal lines.
24. True. For any a and b, we have f(a, b) 6= g(a, b). The graph of g is same as the graph of f , except it is shifted 2 unitsvertically.
25. True. The intersection, where f(x, y) = g(x, y), is given by x2 + y2 = 1− x2 − y2, or x2 + y2 = 1/2. This is a circleof radius 1/
√2 parallel to the xy-plane at height z = 1/2.
26. False. For example, f(x, y) = x2 (or any cylinder along the y-axis) is not a plane but has lines for x = c cross-sections.
27. False. Wherever f(x, y) = 0 the graphs of f(x, y) and −f(x, y) will intersect.
28. True. Otherwise f would have more than one value for a given pair (x, y), which cannot happen if f is a function.
29. False. For example, the y-axis intersects the graph of f(x, y) = 1− x2 − y2 twice, at y = ±1.
30. True. The graph is the bowl-shaped g(x, y) = x2 + y2 turned upside-down and shifted upward by 10 units.
31. True. If f = c then the contours are of the form c = y2 + (x − 2)2, which are circles centered at (2, 0) if c > 0. But ifc = 0 the contour is the single point (2, 0).
32. True. If (a, b) is a point on two contours of f , then f(a, b) must have a single value, since f is a function.
33. False. The graph could be a hemisphere, a bowl-shape, or any surface formed by rotating a curve about a vertical line.
34. False. Contours get closer together in a direction if the function is increasing or decreasing at an increasing rate in thatdirection.
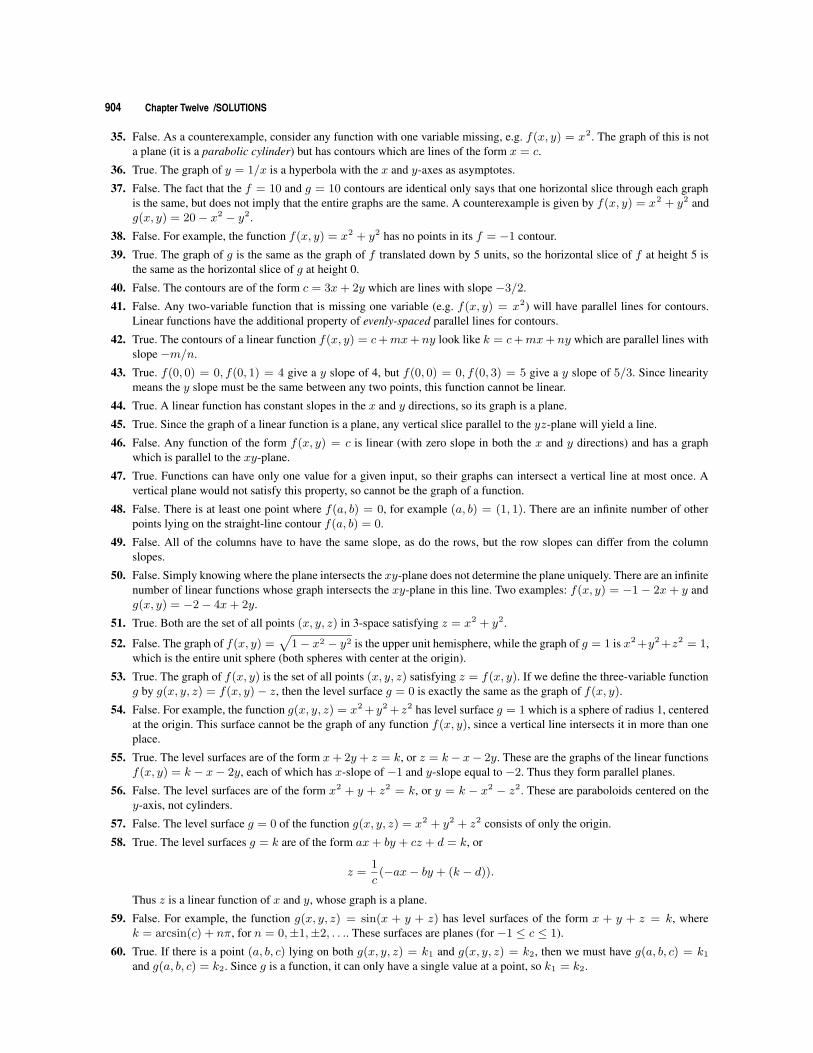
904 Chapter Twelve /SOLUTIONS
35. False. As a counterexample, consider any function with one variable missing, e.g. f(x, y) = x2. The graph of this is nota plane (it is a parabolic cylinder) but has contours which are lines of the form x = c.
36. True. The graph of y = 1/x is a hyperbola with the x and y-axes as asymptotes.
37. False. The fact that the f = 10 and g = 10 contours are identical only says that one horizontal slice through each graphis the same, but does not imply that the entire graphs are the same. A counterexample is given by f(x, y) = x2 + y2 andg(x, y) = 20− x2 − y2.
38. False. For example, the function f(x, y) = x2 + y2 has no points in its f = −1 contour.
39. True. The graph of g is the same as the graph of f translated down by 5 units, so the horizontal slice of f at height 5 isthe same as the horizontal slice of g at height 0.
40. False. The contours are of the form c = 3x+ 2y which are lines with slope −3/2.
41. False. Any two-variable function that is missing one variable (e.g. f(x, y) = x2) will have parallel lines for contours.Linear functions have the additional property of evenly-spaced parallel lines for contours.
42. True. The contours of a linear function f(x, y) = c+mx+ ny look like k = c+mx+ ny which are parallel lines withslope −m/n.
43. True. f(0, 0) = 0, f(0, 1) = 4 give a y slope of 4, but f(0, 0) = 0, f(0, 3) = 5 give a y slope of 5/3. Since linearitymeans the y slope must be the same between any two points, this function cannot be linear.
44. True. A linear function has constant slopes in the x and y directions, so its graph is a plane.
45. True. Since the graph of a linear function is a plane, any vertical slice parallel to the yz-plane will yield a line.
46. False. Any function of the form f(x, y) = c is linear (with zero slope in both the x and y directions) and has a graphwhich is parallel to the xy-plane.
47. True. Functions can have only one value for a given input, so their graphs can intersect a vertical line at most once. Avertical plane would not satisfy this property, so cannot be the graph of a function.
48. False. There is at least one point where f(a, b) = 0, for example (a, b) = (1, 1). There are an infinite number of otherpoints lying on the straight-line contour f(a, b) = 0.
49. False. All of the columns have to have the same slope, as do the rows, but the row slopes can differ from the columnslopes.
50. False. Simply knowing where the plane intersects the xy-plane does not determine the plane uniquely. There are an infinitenumber of linear functions whose graph intersects the xy-plane in this line. Two examples: f(x, y) = −1− 2x+ y andg(x, y) = −2− 4x+ 2y.
51. True. Both are the set of all points (x, y, z) in 3-space satisfying z = x2 + y2.
52. False. The graph of f(x, y) =√
1− x2 − y2 is the upper unit hemisphere, while the graph of g = 1 is x2 +y2 +z2 = 1,which is the entire unit sphere (both spheres with center at the origin).
53. True. The graph of f(x, y) is the set of all points (x, y, z) satisfying z = f(x, y). If we define the three-variable functiong by g(x, y, z) = f(x, y)− z, then the level surface g = 0 is exactly the same as the graph of f(x, y).
54. False. For example, the function g(x, y, z) = x2 +y2 + z2 has level surface g = 1 which is a sphere of radius 1, centeredat the origin. This surface cannot be the graph of any function f(x, y), since a vertical line intersects it in more than oneplace.
55. True. The level surfaces are of the form x+ 2y + z = k, or z = k− x− 2y. These are the graphs of the linear functionsf(x, y) = k − x− 2y, each of which has x-slope of −1 and y-slope equal to −2. Thus they form parallel planes.
56. False. The level surfaces are of the form x2 + y + z2 = k, or y = k − x2 − z2. These are paraboloids centered on they-axis, not cylinders.
57. False. The level surface g = 0 of the function g(x, y, z) = x2 + y2 + z2 consists of only the origin.
58. True. The level surfaces g = k are of the form ax+ by + cz + d = k, or
z =1
c(−ax− by + (k − d)).
Thus z is a linear function of x and y, whose graph is a plane.
59. False. For example, the function g(x, y, z) = sin(x + y + z) has level surfaces of the form x + y + z = k, wherek = arcsin(c) + nπ, for n = 0,±1,±2, . . .. These surfaces are planes (for −1 ≤ c ≤ 1).
60. True. If there is a point (a, b, c) lying on both g(x, y, z) = k1 and g(x, y, z) = k2, then we must have g(a, b, c) = k1
and g(a, b, c) = k2. Since g is a function, it can only have a single value at a point, so k1 = k2.
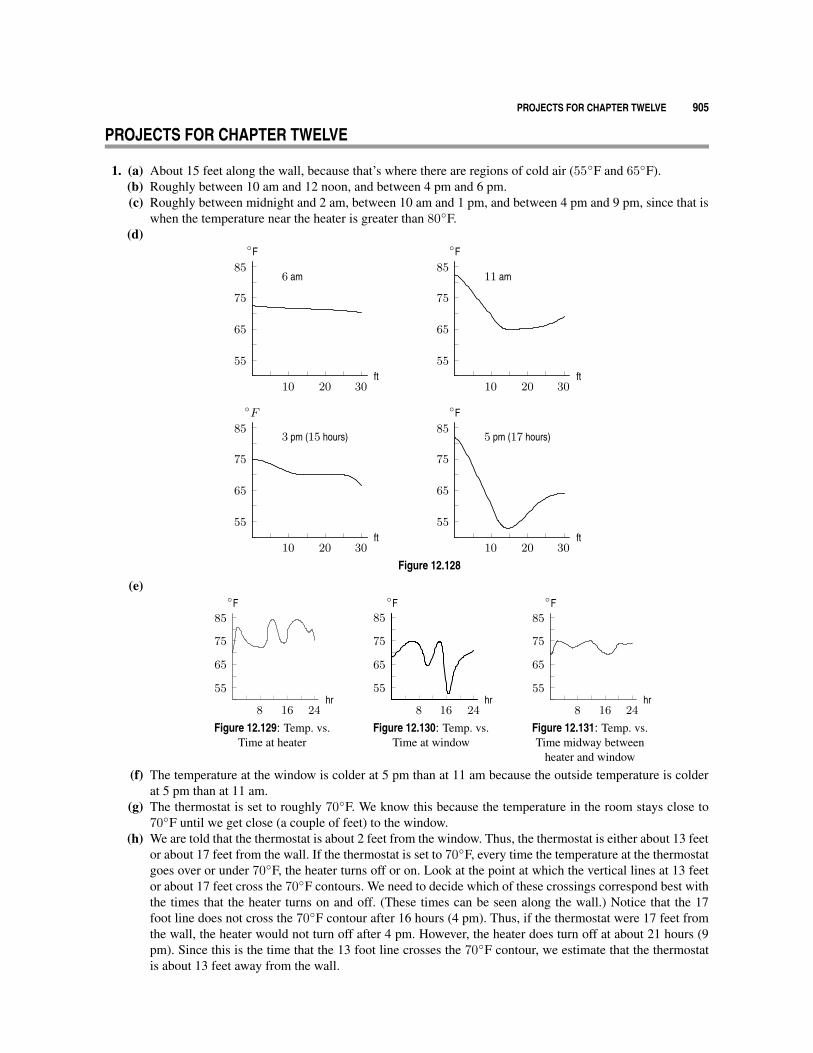
PROJECTS FOR CHAPTER TWELVE 905
PROJECTS FOR CHAPTER TWELVE
1. (a) About 15 feet along the wall, because that’s where there are regions of cold air (55◦F and 65◦F).(b) Roughly between 10 am and 12 noon, and between 4 pm and 6 pm.(c) Roughly between midnight and 2 am, between 10 am and 1 pm, and between 4 pm and 9 pm, since that is
when the temperature near the heater is greater than 80◦F.(d)
10 20 30
55
65
75
856 am
◦F
ft10 20 30
55
65
75
8511 am
◦F
ft
10 20 30
55
65
75
853 pm (15 hours)
◦F
ft10 20 30
55
65
75
855 pm (17 hours)
◦F
ft
Figure 12.128
(e)
8 16 24
55
65
75
85
◦F
hr
Figure 12.129: Temp. vs.Time at heater
8 16 24
55
65
75
85
hr
◦F
Figure 12.130: Temp. vs.Time at window
8 16 24
55
65
75
85
◦F
hr
Figure 12.131: Temp. vs.Time midway between
heater and window
(f) The temperature at the window is colder at 5 pm than at 11 am because the outside temperature is colderat 5 pm than at 11 am.
(g) The thermostat is set to roughly 70◦F. We know this because the temperature in the room stays close to70◦F until we get close (a couple of feet) to the window.
(h) We are told that the thermostat is about 2 feet from the window. Thus, the thermostat is either about 13 feetor about 17 feet from the wall. If the thermostat is set to 70◦F, every time the temperature at the thermostatgoes over or under 70◦F, the heater turns off or on. Look at the point at which the vertical lines at 13 feetor about 17 feet cross the 70◦F contours. We need to decide which of these crossings correspond best withthe times that the heater turns on and off. (These times can be seen along the wall.) Notice that the 17foot line does not cross the 70◦F contour after 16 hours (4 pm). Thus, if the thermostat were 17 feet fromthe wall, the heater would not turn off after 4 pm. However, the heater does turn off at about 21 hours (9pm). Since this is the time that the 13 foot line crosses the 70◦F contour, we estimate that the thermostatis about 13 feet away from the wall.
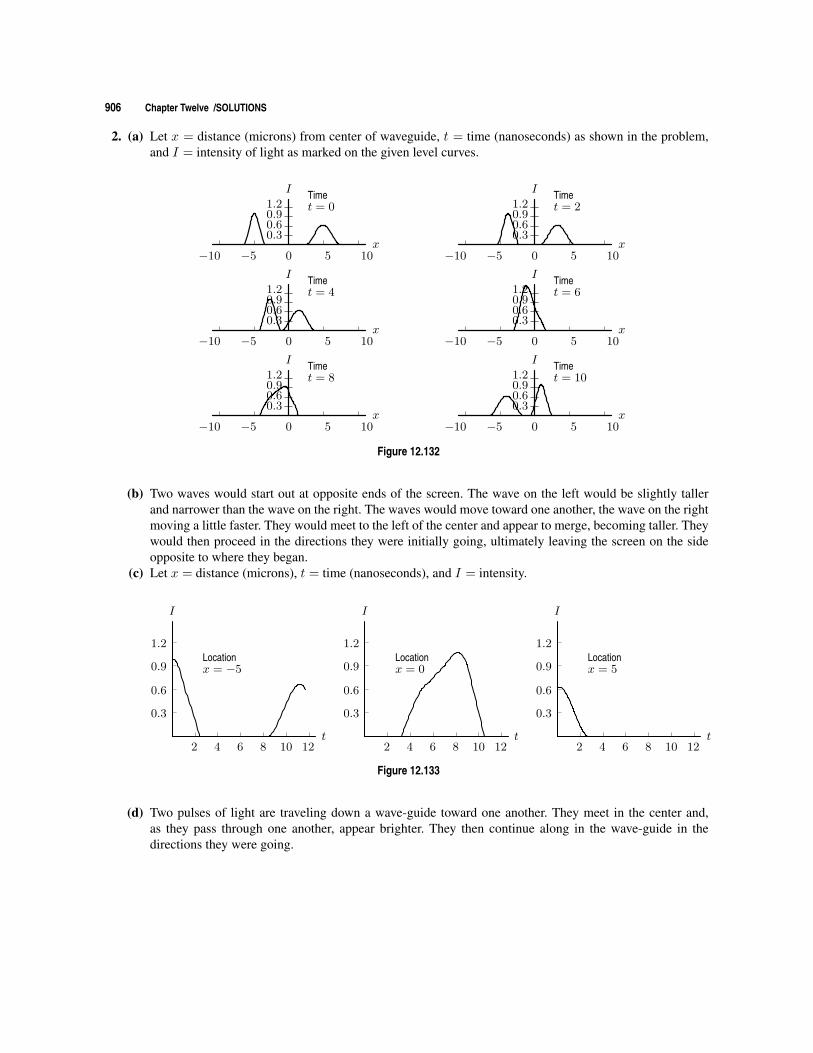
906 Chapter Twelve /SOLUTIONS
2. (a) Let x = distance (microns) from center of waveguide, t = time (nanoseconds) as shown in the problem,and I = intensity of light as marked on the given level curves.
−10 −5 0 5 10
0.30.60.91.2
I
x
Timet = 0
−10 −5 0 5 10
0.30.60.91.2
I
x
Timet = 2
−10 −5 0 5 10
0.30.60.91.2
I
x
Timet = 4
−10 −5 0 5 10
0.30.60.91.2
I
x
Timet = 6
−10 −5 0 5 10
0.30.60.91.2
I
x
Timet = 8
−10 −5 0 5 10
0.30.60.91.2
I
x
Timet = 10
Figure 12.132
(b) Two waves would start out at opposite ends of the screen. The wave on the left would be slightly tallerand narrower than the wave on the right. The waves would move toward one another, the wave on the rightmoving a little faster. They would meet to the left of the center and appear to merge, becoming taller. Theywould then proceed in the directions they were initially going, ultimately leaving the screen on the sideopposite to where they began.
(c) Let x = distance (microns), t = time (nanoseconds), and I = intensity.
2 4 6 8 10 12
0.3
0.6
0.9
1.2
I
t
Locationx = −5
2 4 6 8 10 12
0.3
0.6
0.9
1.2
I
t
Locationx = 0
2 4 6 8 10 12
0.3
0.6
0.9
1.2
I
t
Locationx = 5
Figure 12.133
(d) Two pulses of light are traveling down a wave-guide toward one another. They meet in the center and,as they pass through one another, appear brighter. They then continue along in the wave-guide in thedirections they were going.