$120K incremental revenue potential identified with 2...
7
© Aryng LLC 2011-2013. All Rights Reserved. $120K incremental revenue potential identified with 2 hours of analysis! We did it, so can you! Using BADIR™, Aryng’s Data to Decisions™ analytics framework The amount of information available to business professionals these days is overwhelming (Big Data), often making it nearly impossible to parse what information is relevant, is actionable for your business, and what is merely interesting, perhaps even worth knowing, but ultimately irrelevant to your business decision making. When you are trying to tackle a problem for your business, do you know what questions to ask? Do you know how to arrive at answers that will empower you to act? Do you know how to evaluate your actions? BADIR, Aryng’s Data to Decisions™ framework is a recipe to allow you to do just that. The five- step process takes you from determining what questions to ask through the design of your analysis, collection of data, and analysis of data all the way to recommendations for actions that help drive impact on your business. BADIR is an acronym for the five steps of the Data to Decisions™ framework. Case Study: Winery and Wedding Event Company The following case study illustrates in some detail how the method works in a real life situation by looking at the online marketing budget of an Oregon winery and identifying a way to increase its revenue by 12% or $120,000 without incremental marketing spend. The Winery and Wedding Event Company hosts weddings on its beautiful Oregon estate, marketing its services through a variety of means, but relying heavily on Internet traffic to its site to attract clients from around the country. The company has online marketing budget of roughly $27,000, and its owners wanted to look at maximizing their return on investment by spending their marketing budget more intelligently. We followed the 5-step Data to Decisions™ framework on their data and within 2 hours of systematic approach, identified areas to defocus spend and refocus those budgets in higher return sources. Step One: Business Question Have you ever identified a problem in your business, but been at the loss what to do next? Have you ever tried to solve a problem, but discovered that your approach to the problem was flawed because you had not worked your way to essential question of the problem, the questions that really identified what it was you needed to solve? BADIR™: Framework to get from Data to Decisions™ STEPS 2. Analysis Plan 3. Data Collection 4. Derive Insights 5.Recomm endations 1. Business Question
Transcript of $120K incremental revenue potential identified with 2...

© Aryng LLC 2011-2013. All Rights Reserved.
$120K incremental revenue potential identified with 2 hours of analysis! We did it, so can you! Using BADIR™, Aryng’s Data to Decisions™ analytics framework The amount of information available to business professionals these days is overwhelming (Big Data), often making it nearly impossible to parse what information is relevant, is actionable for your business, and what is merely interesting, perhaps even worth knowing, but ultimately irrelevant to your business decision making. When you are trying to tackle a problem for your business, do you know what questions to ask? Do you know how to arrive at answers that will empower you to act? Do you know how to evaluate your actions? BADIR, Aryng’s Data to Decisions™ framework is a recipe to allow you to do just that. The five-step process takes you from determining what questions to ask through the design of your analysis, collection of data, and analysis of data all the way to recommendations for actions that help drive impact on your business. BADIR is an acronym for the five steps of the Data to Decisions™ framework.
Case Study: Winery and Wedding Event Company
The following case study illustrates in some detail how the method works in a real life situation by looking at the online marketing budget of an Oregon winery and identifying a way to increase its revenue by 12% or $120,000 without incremental marketing spend. The Winery and Wedding Event Company hosts weddings on its beautiful Oregon estate, marketing its services through a variety of means, but relying heavily on Internet traffic to its site to attract clients from around the country. The company has online marketing budget of roughly $27,000, and its owners wanted to look at maximizing their return on investment by spending their marketing budget more intelligently. We followed the 5-step Data to Decisions™ framework on their data and within 2 hours of systematic approach, identified areas to defocus spend and refocus those budgets in higher return sources. Step One: Business Question Have you ever identified a problem in your business, but been at the loss what to do next? Have you ever tried to solve a problem, but discovered that your approach to the problem was flawed because you had not worked your way to essential question of the problem, the questions that really identified what it was you needed to solve?
BADIR™: Framework to get from Data to Decisions™
STEPS 2. Analysis
Plan 3. Data
Collection 4. Derive Insights
5.Recommendations
1. Business Question

© Aryng LLC 2011-2013. All Rights Reserved.
Our first step was to identify the real business questions behind their preliminary inquiries about where good leads come from. Upon using a detailed framework, we arrived at the real business questions to be: Where do good leads come from? How do we get more of those good leads? Step Two: Analysis Plan Having identified what questions we needed to answer, we used hypothesis driven planning to limit the scope of our analysis to only the core questions at hand. This allowed us to choose the appropriate data and the correct analysis techniques.
In consultation with the company, we defined “good” leads using two conversion metrics:
• Awareness: meaning visitors who clicked through to the company’s event page • Inquiry: meaning visitors to the site who submitted an event inquiry form
Because the final conversion, the actual booking of an event, is done offline, we used these proxies with appropriate ratios (1% of Awareness and 10% of Inquiry; finally converts to an Event worth $5K) for quantifying the impact. Additionally, we identified four hypotheses based on the initial inquiry and follow on consultation:
• Traffic from different sources converts differently. • Mobile access results in better conversion. • Visiting the pricing page is detrimental to conversion.
Awareness: Visit Event Page
Inquiry: Submit Form
Convert: book an
event
Google Analytics

© Aryng LLC 2011-2013. All Rights Reserved.
• The local Oregon area has better conversion. Based on these hypotheses and goal, we determined the appropriate GA data needed and identified correlation analysis to be the appropriate methodology to look at this data. Step Three: Data Collection Having applied the first two steps of the BADIR method to our case study, meant that we were on solid footing to keep our data collection focused on the real business question and on the analysis plan we had developed. After defining the time period for which data would be collected and downloading the appropriate data, we then applied the 80/20 rule to shunt the long tail in the data and performed a data audit. Step Four: Derive Insights Now we were ready to analyze the data to gain insights into their significance as they related to the four hypotheses that we established in the analysis plan. Hypothesis No. 1: Traffic from different sources converts differently.
Conversion
Source/Medium Visits % Visits Wedding Page Form Submit google / organic 14,440 36% 53% 4% google / cpc 7,224 18% 92% 4% Bing / cpc 4,360 11% 100% 1% (direct) / (none) 3,651 9% 35% 2% myportlandwedding.com / referral 2,546 6% 70% 5% facebook.com / referral 1,505 4% 36% 0% bing / organic 962 2% 57% 4% yahoo / organic 628 2% 53% 5% stinnocentwine.com / referral 488 1% 95% 4% wineryweddingguide.com / referral 437 1% 81% 10% weddingwire.com / referral 381 1% 74% 11% eolaamityhills.com / referral 370 1% 5% 0% apps.facebook.com / referral 256 1% 16% 0% vibranttable.com / referral 146 0% 64% 8% google.com / referral 138 0% 58% 7% Others-long tail 2,641 7% 3% Average 40,174 64% 3% Univariate and bivariate analysis of this hypothesis showed that 65% of traffic is driven by organic/paid searches and that certain winery/wedding guides are better at driving traffic and conversion than others. Hypothesis No. 1 is proved. Hypothesis No. 2: Mobile access results in better conversion
© Aryng LLC 2011-2013. All Rights Reserved.
Conversion
Mobile Visits Wedding Page Form Submit
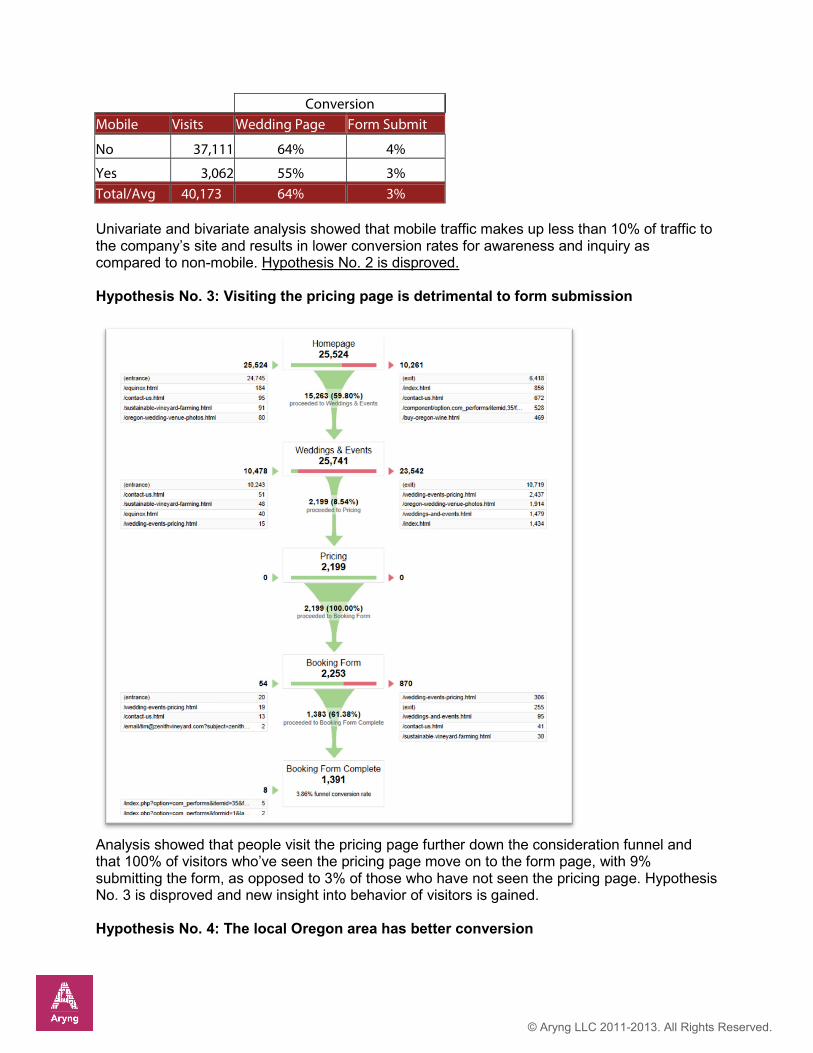
No 37,111 64% 4% Yes 3,062 55% 3% Total/Avg 40,173 64% 3% Univariate and bivariate analysis showed that mobile traffic makes up less than 10% of traffic to the company’s site and results in lower conversion rates for awareness and inquiry as compared to non-mobile. Hypothesis No. 2 is disproved. Hypothesis No. 3: Visiting the pricing page is detrimental to form submission
Analysis showed that people visit the pricing page further down the consideration funnel and that 100% of visitors who’ve seen the pricing page move on to the form page, with 9% submitting the form, as opposed to 3% of those who have not seen the pricing page. Hypothesis No. 3 is disproved and new insight into behavior of visitors is gained. Hypothesis No. 4: The local Oregon area has better conversion

© Aryng LLC 2011-2013. All Rights Reserved.
Conversion
Region Visits % Visits Wedding Page
Form Submit
Oregon 23,222 58% 60% 4% Washington 5,616 14% 70% 3% California 2,550 6% 62% 2% Texas 949 2% 80% 1% Average 64% 3% Analysis of the regional data showed that 72% of traffic is from Oregon and Washington, and further look into cities identified Corvallis as amongst the cities with higher form submission. Step Five: Recommendations In many ways, this is the most important step of the BADIR framework, because without taking this step and implementing what it learned, the Winery and Wedding Event Company could not realize the full impact of the analysis. Changes to the budget needed to be made to monetize what the company learned. So we quantified the impact of the winery’s spending on revenue and ROI, which made it easy for us to identify “good” vs “bad” lead sources and their relative impact. Based on current investment levels and on the company’s ability to affect these levels, the Winery and Wedding Event Company could now make sound choices about where to invest more money and where to invest less or withdraw investment completely.
Impact Recommendation
Source/Medium Cost Revenue ROI New Budget Expected Revenue google / organic $3,600 $ 679,619 188 $3,600 $676,019 google / cpc $10,836 $ 146,647 13 $15,500 $194,267 Bing / cpc $4,360 $ 18,094 3 $0 $0 (direct) / (none) $1,200 $ 37,058 30 $1,200 $35,858 myportlandwedding.com/referral $500 $ 65,560 130 $1,000 $130,119 facebook.com / referral $600 $ 2,483 3 $0 $0 bing / organic $1,200 $ 16,979 13 $1,200 $15,779
So two hypotheses have proved right and two proved wrong, but what action could we suggest to Winery and Wedding
Event Company based on these insights?
© Aryng LLC 2011-2013. All Rights Reserved.
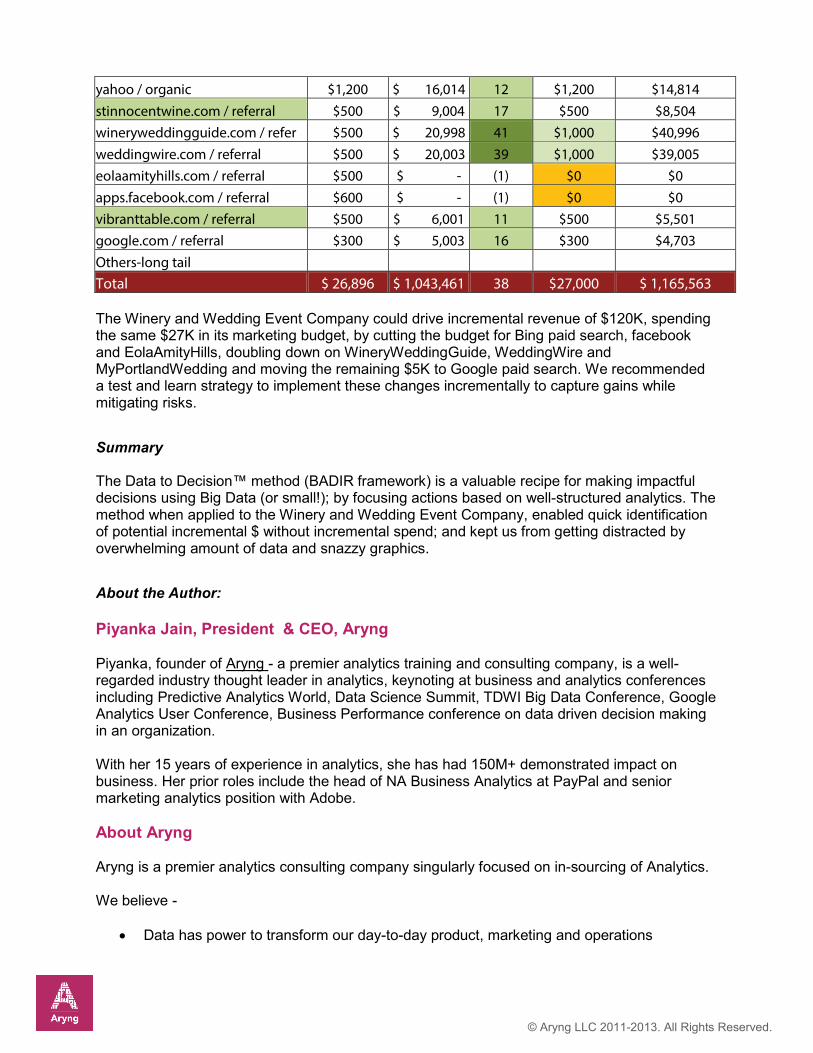
yahoo / organic $1,200 $ 16,014 12 $1,200 $14,814 stinnocentwine.com / referral $500 $ 9,004 17 $500 $8,504 wineryweddingguide.com / refer $500 $ 20,998 41 $1,000 $40,996 weddingwire.com / referral $500 $ 20,003 39 $1,000 $39,005 eolaamityhills.com / referral $500 $ - (1) $0 $0 apps.facebook.com / referral $600 $ - (1) $0 $0 vibranttable.com / referral $500 $ 6,001 11 $500 $5,501 google.com / referral $300 $ 5,003 16 $300 $4,703 Others-long tail
Total $ 26,896 $ 1,043,461 38 $27,000 $ 1,165,563 The Winery and Wedding Event Company could drive incremental revenue of $120K, spending the same $27K in its marketing budget, by cutting the budget for Bing paid search, facebook and EolaAmityHills, doubling down on WineryWeddingGuide, WeddingWire and MyPortlandWedding and moving the remaining $5K to Google paid search. We recommended a test and learn strategy to implement these changes incrementally to capture gains while mitigating risks.
Summary The Data to Decision™ method (BADIR framework) is a valuable recipe for making impactful decisions using Big Data (or small!); by focusing actions based on well-structured analytics. The method when applied to the Winery and Wedding Event Company, enabled quick identification of potential incremental $ without incremental spend; and kept us from getting distracted by overwhelming amount of data and snazzy graphics.
About the Author: Piyanka Jain, President & CEO, Aryng Piyanka, founder of Aryng - a premier analytics training and consulting company, is a well-regarded industry thought leader in analytics, keynoting at business and analytics conferences including Predictive Analytics World, Data Science Summit, TDWI Big Data Conference, Google Analytics User Conference, Business Performance conference on data driven decision making in an organization. With her 15 years of experience in analytics, she has had 150M+ demonstrated impact on business. Her prior roles include the head of NA Business Analytics at PayPal and senior marketing analytics position with Adobe. About Aryng Aryng is a premier analytics consulting company singularly focused on in-sourcing of Analytics. We believe -
• Data has power to transform our day-to-day product, marketing and operations

© Aryng LLC 2011-2013. All Rights Reserved.
decisions. • The people, who are most well placed to extract insights from the data, are those who
are working within the organization in the respective product, marketing, sales and operations role.
• 80% of business problems can be solved using simpler techniques, which can be learnt by business professionals with no statistical background and can be performed in Microsoft Excel.
• Timely and relevant insight from data holds the key to drive up revenue and growth, and reduce cost and loss.
Aryng is about building Organization’s capability – people, process, and tool, so the organizations can leverage data for smarter decision making. We do that through systematic analytics maturity assessment and then addressing the gaps through-
1. Analytics training for business professionals, 2. Setting up decision making processes, 3. Executing analytics projects while teaching and mentoring, 4. Executive coaching and 5. Enabling right data tools.


![CASE STUDIES · 1/10/2015 · case study: $125m+ ch aritable foundation challenge solution result [+ ] $120k x + x = 25 x [+ $90k ] + 20 x $40k = $6m $120k x + x = 25 x [+ $90k ]](https://static.fdocuments.us/doc/165x107/5fd19c406e2b2c5b1c191d92/case-studies-1102015-case-study-125m-ch-aritable-foundation-challenge-solution.jpg)