120814 Eramosa Quarry Report - wellington.ca · Proposed Hidden Quarry Report # 1201429 September...
80
Tel:519.823.1311 Fax: 519.823.1316 RWDI AIR Inc. 650 Woodlawn Road West Guelph, Ontario, Canada N1K 1B8 Email: [email protected] Reputation Resources Results Canada | USA | UK | UAE | India | China www.rwdiair.com Proposed Hidden Quarry Township of Guelph-Eramosa, Wellington County Final Report Air Quality Assessment RWDI # 1201429 September 6, 2012 SUBMITTED TO Greg Sweetnam, B.Sc. Vice President, Resources James Dick Construction Limited P.O. Box 470 Bolton, Ontario Canada, L7E 5T4 SUBMITTED BY Michael Lepage, M.Sc., ACM, CCM Project Director/Principal [email protected] Sharon Schajnoha, P.Eng. Senior Project Manager, Associate [email protected] Brian Sulley, B.A. Sc., P.Eng. Air Quality Specialist [email protected] Ahammad Ali, M.Sc., P.Eng. Intermediate Engineer [email protected]
Transcript of 120814 Eramosa Quarry Report - wellington.ca · Proposed Hidden Quarry Report # 1201429 September...
Tel:519.823.1311Fax: 519.823.1316
RWDI AIR Inc.650 Woodlawn Road WestGuelph, Ontario, CanadaN1K 1B8Email: [email protected]
Reputation Resources Results Canada | USA | UK | UAE | India | China www.rwdiair.com
Proposed Hidden QuarryTownship of Guelph-Eramosa, Wellington County
Final Report
Air Quality AssessmentRWDI # 1201429
September 6, 2012
SUBMITTED TO
Greg Sweetnam, B.Sc.Vice President, Resources
James Dick Construction LimitedP.O. Box 470
Bolton, OntarioCanada, L7E 5T4
SUBMITTED BY
Michael Lepage, M.Sc., ACM, CCMProject Director/[email protected]
Sharon Schajnoha, P.Eng.Senior Project Manager, Associate
Brian Sulley, B.A. Sc., P.Eng.Air Quality Specialist
Ahammad Ali, M.Sc., P.Eng.Intermediate Engineer
Proposed Hidden QuarryReport #1201429September 6, 2012
Reputation Resources Results Canada | USA | UK | UAE | India | China www.rwdiair.com
EXECUTIVE SUMMARY
RWDI AIR Inc. (RWDI) was retained by James Dick Construction Limited (JDCL) to conduct an Air
Quality Assessment for the Proposed Hidden Quarry (the quarry) located in the Township of Guelph-Eramosa, Wellington County (the Proposed Licensed Area), as shown on Figure 5.2. The purpose of this
study was to assess the potential air quality impacts from the quarry and provide recommendations to
ensure compliance with the applicable regulations and guidelines. This assessment conforms to that
required by the MOE when applying for an Environmental Compliance Approval (ECA) (formally known asa Certificate of Approval) under Section 9 of the Ontario Environmental Protection Act, and therefore the
following regulations and guidelines apply to the analysis:
� Ontario Regulation 419/05: Local Air Quality.
� Ministry of the Environment (MOE) Guideline A10: Procedure for Preparing an Emission
Summary and Dispersion Modelling Report.
� MOE Guideline A11: Air Dispersion Modeling Guideline for Ontario.
This report is part of an application by the Proponent for a Class A, Category 2 license for quarry
operations with excavation below the water table under the Aggregate Resources Act (ARA), as well as
for planning amendments under local planning documents in accordance with the Provincial PolicyStatement (PPS) and the Planning Act. This report is intended to be read in conjunction with the Site
Plan (Stovel and Associates Inc., January 19, 2012) and other reports and technical studies submitted as
part of JDCL’s application. The Site Plan is also subject to the prescribed conditions noted in the
Aggregate Resources Act of Ontario Provincial Standards.
The quarry operates with the processing capacity of 500 tonnes per hour and 700,000 tonnes per year offinished aggregate. The operations identified and modelled in this air quality analysis included site
preparation, drilling, blasting, excavation, transportation, aggregate processing, shipping, and
rehabilitation.
For the purposes of estimating emissions from the facility, a maximum operating scenario was
considered. This scenario considered the above-water extraction phase, using the maximum processingand shipping rates that the facility could be expected to achieve. This scenario was used as the basis for
the dispersion modelling analysis, which was conducted for 1-hour and 24-hour averaging times.
Emission rates were determined through published emission factors.
The facility is located on Part of Lot 1, Concession 6, in the Township of Guelph-Eramosa, Ontario, and issurrounded by agricultural and rural industrial land uses under the Township of Guelph-Eramosa Zoning
By-Law, and rural land uses under the Town of Milton Zoning By-Law. The local terrain is relatively flat,
with low hills, and this was considered in the dispersion modelling analysis.
Noting the conservatisms in the analysis, RWDI believes that the predicted frequency of excursions is
within acceptable levels, provided the following recommendations are implemented:
Proposed Hidden QuarryReport #1201429September 6, 2012
Reputation Resources Results Canada | USA | UK | UAE | India | China www.rwdiair.com
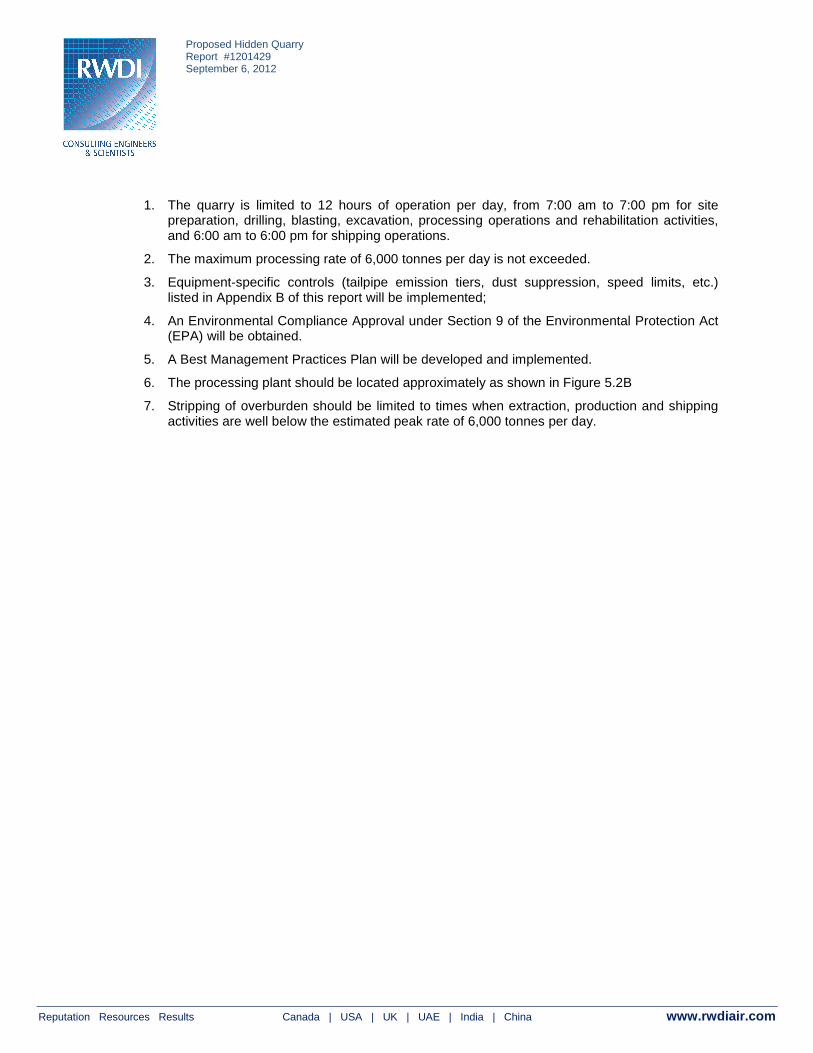
1. The quarry is limited to 12 hours of operation per day, from 7:00 am to 7:00 pm for sitepreparation, drilling, blasting, excavation, processing operations and rehabilitation activities,and 6:00 am to 6:00 pm for shipping operations.
2. The maximum processing rate of 6,000 tonnes per day is not exceeded.
3. Equipment-specific controls (tailpipe emission tiers, dust suppression, speed limits, etc.)listed in Appendix B of this report will be implemented;
4. An Environmental Compliance Approval under Section 9 of the Environmental Protection Act(EPA) will be obtained.
5. A Best Management Practices Plan will be developed and implemented.
6. The processing plant should be located approximately as shown in Figure 5.2B
7. Stripping of overburden should be limited to times when extraction, production and shippingactivities are well below the estimated peak rate of 6,000 tonnes per day.
Proposed Hidden QuarryReport #1201429September 6, 2012
Reputation Resources Results Canada | USA | UK | UAE | India | China www.rwdiair.com
TABLE OF CONTENTS1 INTRODUCTION AND FACILITY DESCRIPTION ................................................................................1
1.1 Purpose and Scope of Report..........................................................................................................11.2 Description of Processes and NAICS Code(s) ................................................................................2
1.3 Description of Products and Raw Materials .....................................................................................2
1.4 Process Flow Diagram.....................................................................................................................2
1.5 Operating Schedule .........................................................................................................................22 INITIAL IDENTIFICATION OF SOURCES AND CONTAMINANTS .....................................................33 CONTAMINANTS AND SOURCES NOT DIRECTLY ASSESSED ......................................................4
3.1 Contaminants Not Directly Assessed...............................................................................................4
3.1.1 Rationale for Assessment......................................................................................................4
3.2 Sources Not Directly Assessed in Cumulative Effects Assessment................................................53.2.1 Rationale for Assessment......................................................................................................5
3.3 Sources Not Directly Assessed in Compliance Assessment ...........................................................6
3.3.1 Sources Not Assessed ..........................................................................................................6
3.3.2 Rationale for Assessment......................................................................................................74 OPERATING CONDITIONS, EMISSION ESTIMATING AND DATA QUALITY...................................8
4.1 Description of Operating Conditions ................................................................................................8
4.1.1 Scenario 1 – Compliance Modelling ......................................................................................8
4.1.2 Scenario 2 – Cumulative Effects Modelling – Conveyors from Face ....................................8
4.1.3 Scenario 3 – Cumulative Effects Modelling – Haul Trucks....................................................84.2 Explanation of Method Used to Calculate the Emission Rate .........................................................9
4.2.1 Haul Truck Loading and Dumping Operations ......................................................................9
4.2.2 Processing Operations ..........................................................................................................9
4.2.3 Shipping Operations ..............................................................................................................9
4.2.4 Fugitive Dust Emissions from Paved Internal Haul Roads..................................................104.2.5 Fugitive Dust Emissions from Unpaved Internal Haul Roads .............................................10
4.2.6 Diesel-Fired Drag Line Emissions .......................................................................................10
4.2.7 Truck and Heavy Equipment Tailpipe Emissions ................................................................11
4.2.8 Shipping Truck Tailpipe Emissions......................................................................................114.3 Sample Calculation for Each Method.............................................................................................11
4.3.1 Haul Truck Loading and Dumping Operations ....................................................................11
4.3.2 Processing Operations ........................................................................................................12
4.3.3 Shipping Operations ............................................................................................................12
4.3.4 Fugitive Dust Emissions from Paved Internal Haul Roads..................................................134.3.5 Fugitive Dust Emissions from Unpaved Internal Haul Roads .............................................14
4.3.6 Diesel-Fired Drag-Line Emissions .......................................................................................15
4.3.7 Truck and Heavy Equipment Tailpipe Emissions ................................................................15
4.3.8 Shipping Truck Tailpipe Emissions......................................................................................154.4 Assessment of Data Quality for each Emission Rate ....................................................................15
5 SOURCE SUMMARY TABLE AND PROPERTY PLAN.....................................................................16
Proposed Hidden QuarryReport #1201429September 6, 2012
Reputation Resources Results Canada | USA | UK | UAE | India | China www.rwdiair.com
5.1 Source Summary Table .................................................................................................................165.2 Site Plan.........................................................................................................................................16
6 DISPERSION MODELLING.................................................................................................................176.1 Dispersion Modelling Input Summary Table ..................................................................................17
6.1.1 Meteorological Conditions ...................................................................................................176.1.2 Area of Modelling Coverage ................................................................................................18
6.1.3 Stack Height for Certain New Sources of Contaminant ......................................................18
6.1.4 Terrain Data.........................................................................................................................18
6.1.5 Averaging Periods Used......................................................................................................18
6.2 Land Use Zoning Designation Plan ...............................................................................................196.3 Criteria............................................................................................................................................19
6.4 Ambient Background Concetrations ..............................................................................................19
6.5 Conversion of NOx to Nitrogen Dioxide .........................................................................................20
6.6 Frequency Analysis........................................................................................................................21
6.7 Dispersion Modelling Input and Output Files .................................................................................217 EMISSION SUMMARY TABLE AND CONCLUSIONS.......................................................................22
7.1 Emission Summary Table ..............................................................................................................22
7.2 Comparison of Modelled and Historical Exceedance Data............................................................22
7.2.1 Secnario 1 – Compliance Modelling ....................................................................................227.2.2 Scenario 2 – Cumulative Effects Modelling – Conveyors from Face ..................................22
7.2.3 Scenario 3 – Cumulative Effects Modelling – Haul Trucks..................................................227.3 Conclusions......................................................................................Error! Bookmark not defined.
TABLESError! Reference source not found. Source and Contaminants Identification Table5.1 Source Summary Table6.1 Dispersion Modelling Input Summary Table7.1 Emission Summary Table
FIGURES1.4 Process Flow Diagram5.2 Site Plan6.1 Wind Roses6.2 Land Use Zoning Designation Plan
APPENDICESAPPENDIX A: Dispersion Modelling Input & Output FilesAPPENDIX B: Emission Estimates, Control Measures and EfficienciesAPPENDIX C Soil Moisture Levels
Proposed Hidden QuarryReport #1201429September 6, 2012 Page 1
Reputation Resources Results Canada | USA | UK | UAE | India | China www.rwdiair.com
1 Introduction and Facility Description
1.1 PURPOSE AND SCOPE OF REPORT
RWDI AIR Inc. (RWDI) was retained by James Dick Construction Limited (JDCL) to conduct an AirQuality Assessment for the Proposed Hidden Quarry (the quarry) located in the Township of Guelph-
Eramosa, Wellington County, as shown on Figure 5.2. The purpose of this study was to assess the
potential air quality impacts from the quarry and provide recommendations to ensure compliance with the
applicable regulations and guidelines. Two levels of assessment were performed:
� A compliance assessment that focused on emission sources that are subject to assessment
when applying for an Environmental Compliance Approval (formally known as a Certificate of
Approval) under Section 9 of the Ontario Environmental Protection Act; and,
� A comprehensive cumulative effects analysis that included all significant sources at the site and
background pollutant levels.
The following regulations and guidelines were applied to the analysis:
� Ontario Regulation 419/05: Local Air Quality.
� Ministry of the Environment (MOE) Guideline A10: Procedure for Preparing an Emission
Summary and Dispersion Modelling Report.
� MOE Guideline A11: Air Dispersion Modeling Guideline for Ontario.
For the cumulative effects analysis, the approach followed widely used practices for land use planning
studies and environmental assessments in Ontario.
This report is part of an application by the Proponent for a Class A, Category 2 license for quarry
operations with excavation below the water table under the Aggregate Resources Act (ARA), as well asfor planning amendments under local planning documents in accordance with the Provincial Policy
Statement (PPS) and the Planning Act. This report is intended to be read in conjunction with the Site
Plan (Stovel and Associates Inc., January 19, 2012) and other reports and technical studies submitted as
part of JDCL’s application.
This air quality assessment consisted of the following tasks:
� Review of the Site Plan, operational plans and data;
� Estimate air quality emissions from on-site operations;
� Estimate background levels of relevant pollutants;
� Estimate potential air quality impacts based on dispersion modelling performed according toOntario Regulation 419/05 requirements and MOE Guidelines;
� Model various air quality controls to obtain effective and practical control measures;
� Recommend appropriate air quality control measures.
Proposed Hidden QuarryReport #1201429September 6, 2012 Page 2
Reputation Resources Results Canada | USA | UK | UAE | India | China www.rwdiair.com
1.2 DESCRIPTION OF PROCESSES AND NAICS CODE(S)
The Hidden Quarry is a proposed aggregate operation, to be operated under a Class A, Category 2
license (quarry operations with excavation below the water table) under the ARA.
Operations at the proposed quarry operation will be conducted in two distinct stages:
� The first stage occurs above water, and involves site preparation, above-water extraction ofaggregate via front-end loader or excavator, transportation, processing, washing, stockpiling and
shipping, with a processing capacity of 500 tonnes per hour and 700,000 tonnes per year.
� The second stage of operations occurs at and below the water table, and involves underwater
drilling, blasting, and extraction of aggregate via dragline, dewatering, transportation, processing,
washing, stockpiling and shipping, also with a processing capacity of 500 tonnes per hour and700,000 tonnes per year.
Ancillary processes at the site include fuel storage for on-site vehicles and shipping and maintenance
welding. The North American Industrial Classification System NAICS code for the facility is 212315,
Dolostone Mining and Quarrying.
1.3 DESCRIPTION OF PRODUCTS AND RAW MATERIALS
The quarry will produce finished aggregate products for asphalt, ready-mix and road base applications.
The raw material used by the quarry is dolostone obtained from the excavation operations. The initial
phase of the quarry will involve extraction, processing and shipping of sand and gravel from above the
dolostone formation.
Diesel fuel will be required for diesel-fired generating equipment.
1.4 PROCESS FLOW DIAGRAM
The typical process flow diagram for the processing plant is shown on Figure 1.4. It should be noted that
at any time, the precise flow of material may change between different pieces of processing equipment,but the overall maximum processing rate remains constant.
1.5 OPERATING SCHEDULE
For purposes of this assessment, a full capacity, worst-case operating scenario was used as follows:
� Site preparation and rehabilitation activities occur from 7:00 am to 7:00 pm.
� Drilling, blasting, excavation and processing operations occur from 7:00 am to 7:00 pm; and,
� Shipping operations will occur from 6:00 am to 6:00 pm.
� The site will operate generally from April 1 to December 24.
Proposed Hidden QuarryReport #1201429September 6, 2012 Page 3
Reputation Resources Results Canada | USA | UK | UAE | India | China www.rwdiair.com
2 Initial Identification of Sources and Contaminants
Table 2.1 provides the Sources and Contaminants Identification Table for the quarry operations. The
term particulate matter (PM) refers to airborne dust and other particles less than 44 microns in diameter,which can remain suspended in the air over relatively long distances. PM is further divided into size
fractions of interest, including total suspended particulate (TSP), suspended particulate matter with a
diameter of less than 10 microns (PM10), also known as inhalable PM, and suspended particulate matter
with a diameter of less than 2.5 microns (PM2.5), also known as respirable PM.
Proposed Hidden QuarryReport #1201429September 6, 2012 Page 4
Reputation Resources Results Canada | USA | UK | UAE | India | China www.rwdiair.com
3 Contaminants and Sources Not Directly Assessed
3.1 CONTAMINANTS NOT DIRECTLY ASSESSED
The following are potential contaminants that were not directly assessed:
� Crystalline Silica;
� Trace metals; and,
� Combustion by-products other than oxides of nitrogen (NOX) and PM.
3.1.1 RATIONALE FOR ASSESSMENT
3.1.1.1 Crystalline Silica
The quarry will process dolostone. Dolotsone dust consists of a mixture of calcium and magnesium
carbonates, which do not have any specification limitations under the O. Reg. 419/05. Dolostone dust
may include small amounts of other non-metallic materials introduced from other aggregates contained asanomalies in the rock. Of these materials, crystalline silica is of most interest with respect to air quality.
O Reg. 419/05 does not define a standard for crystalline silica by itself. However, the MOE does have a
24-hour guideline value for crystalline silica in PM10 of 5 µg/m³. This equates to 10% of the Interim
Ambient Air Quality Criteria for PM10. Therefore, if the silica concentration in the dolostone excavated and
processed at the quarry is below 10%, the guideline value will also be met. Based upon the chemicalanalysis of the quarry, the average concentration of crystalline silica is well below the 10% threshold.
Therefore crystalline silica is expected to be adequately represented by PM10. To ensure this aspect of air
quality standard is met, the silica content will be monitored as part of the normal chemical analysis of
particulate matter at the site.
3.1.1.2 Trace Metals
With regard to trace metals and other possible contaminants contained within dust generated at a
dolostone quarry operation, the MOE’s guidance in its “Procedure for Preparing an Emission Summary
and Dispersion Modelling Report, Version 3” was followed. Table 7-3 of the procedure document
identifies non-metallic mineral mining and quarrying operations as sectors where metals in the fugitiveparticulate matter are generally not anticipated. Based on this guidance, trace metals were not assessed
explicitly.
3.1.1.3 Combustion By-Products
With respect to emissions of combustion by-products from on-site mobile equipment and the drag-line,the principal contaminants of interest are typically nitrogen oxides (NOx), PM2.5, PM10, and TSP and these
are used as surrogates for all products of combustion.
Proposed Hidden QuarryReport #1201429September 6, 2012 Page 5
Reputation Resources Results Canada | USA | UK | UAE | India | China www.rwdiair.com
3.2 SOURCES NOT DIRECTLY ASSESSED IN CUMULATIVE EFFECTS ASSESSMENT
The following sources were not directly assessed:
� Overburden stripping and rehabilitation operations;
� Below water drilling and blasting operations;
� Extraction and stockpiling of shot rock from below water operations;
� Wash plant;
� Wind erosion of aggregate storage piles;
� On-site storage tanks and facilities used for fuelling on-site vehicles; and,
3.2.1 RATIONALE FOR ASSESSMENT
3.2.1.1 Emissions from Overburden Stripping & Rehabilitation
Removal and hauling of overburden is expected to occur only at times when extraction, production andshipping of aggregate are relatively low. The total on-site level of activity is expected to be lower than
that during peak extraction, production and shipping. As such, peak extraction, production and shipping,
with no coincident overburden removal represents the worst-case operating scenario to be assessed as
required under Section 10 of O. Reg. 419/05. Removal of overburden does not represent the worst-caseoperating scenario and therefore was not assessed.
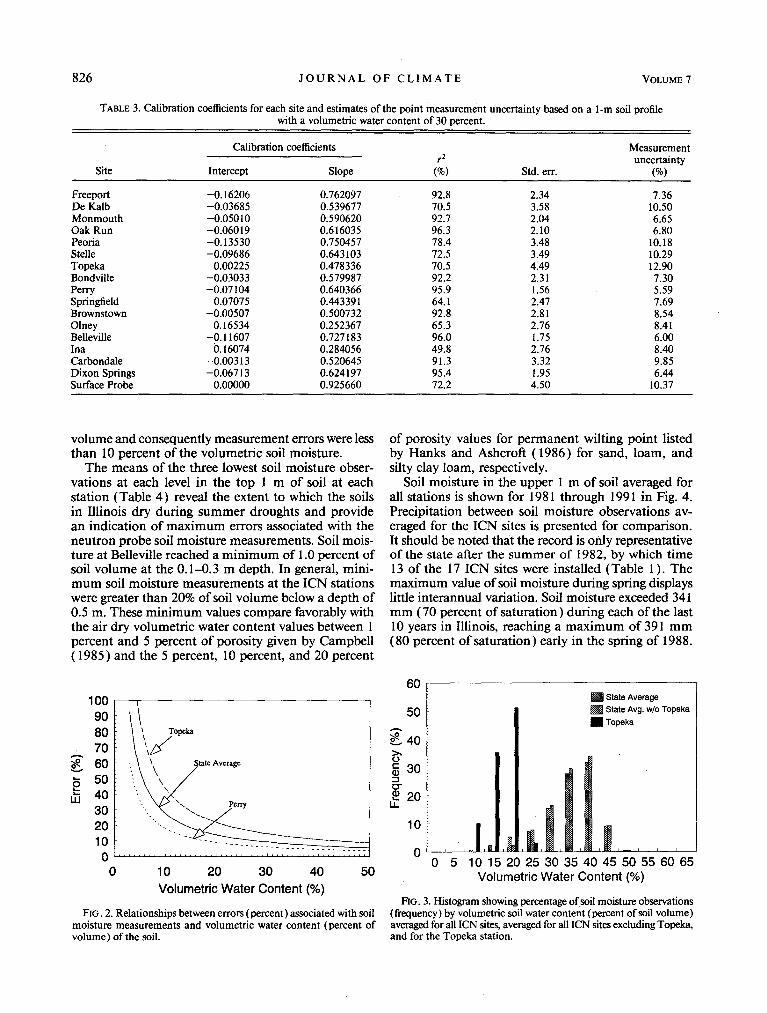
In addition, stripping of overburden normally involves material that has inherently high moisture content.
A review of literature on continuous soil measurements, included in Appendix C, indicates that the 95th
percentile low soil moisture level was 20% by volume (approximately 13% by mass). These values are
from a study done in Illinois; however RWDI believes that the measurements provide a suitable surrogatefor soils in south-western Ontario. Given the moist, organic, loam nature of the material, a review of the
emission factors provided in U.S. EPA AP-42 Chapter 13.2.4: Aggregate Handling and Storage Piles for
these activities suggest that with elevated moisture content (in this case greater than 13%), the potential
emissions of particulate matter are insignificant compared to site-wide emissions during peak extraction,production and shipping.
3.2.1.2 Below-Water Blasting and Extraction Operations;
Once the initial above-water phase of the quarry is complete, blasting, extraction and temporary
stockpiling (for initial dewatering) activities will be performed below water. As a result, emissions of
particulate are considered to be insignificant, as they will be conducted in a saturated environment.Emissions from the dragline would consist of products of combustion from the on-board engine, which
were included in the modelling of NOx emissions, but particulate emissions would not be significant as
the material handled would be saturated with water. Combustion by-product emissions from the dragline
were included in the assessment of nitrogen oxides.
Proposed Hidden QuarryReport #1201429September 6, 2012 Page 6
Reputation Resources Results Canada | USA | UK | UAE | India | China www.rwdiair.com
3.2.1.3 Wash Plants
The wash plant and associated stackers are saturated with water, therefore are not considered to be
significant sources of PM emissions.
3.2.1.4 Aggregate Storage Piles
Wind erosion from exposed pit faces and stockpile areas is relatively infrequent, occurring only when thewind is high and conditions are dry. Wind erosion begins to occur when the wind gusts exceed 15 to 20
km/h and becomes significant when the gusts exceed about 30 km/h. As discussed in Section 6.1.1,
winds above 30 km/h occur less than 2% of the time during the summer. If surfaces are wet due to
rainfall or other precipitation, then wind erosion will not occur. Overall, wind erosion is expected to occur
less than 2% of time.
Furthermore, the aggregate produced at the quarry will be washed. As a result, emission of particulate
matter due to wind erosion of aggregate storage piles is expected to be insignificant.
JDCL will also develop a Best Management Practice Plan (BMPP), which will serve as a guideline for dust
management practices at the facility. As Section 7.4.1 of MOE Guideline A10 allows for the exclusion ofstockpiles when a BMPP is in place, and given the washed nature of the aggregate, emissions from the
aggregate stockpiles are expected to be insignificant.
3.2.1.5 On-Site Fuel Storage Tanks and Facilities Used for Fuelling On-Site Vehicles;
Table B-3 of MOE Guideline A10, Procedure for Preparing an ESDM Report, Version 2.0, July 2005, lists
specific examples of sources that emit contaminants in negligible amounts. On-site storage tanks andfacilities used for fuelling on-site vehicles are listed on Table B-3 and were deemed to be negligible for
the purposes of this assessment.
3.3 SOURCES NOT DIRECTLY ASSESSED IN COMPLIANCE ASSESSMENT
3.3.1 SOURCES NOT ASSESSED
For the compliance assessment, several additional sources were not directly assessed. These sources
include:
� Fugitive dust emissions from paved and unpaved internal haul roads;
� Fugitive dust emissions from unpaved internal haul roads;
� Haul truck and mobile equipment tailpipe emissions; and,
� Shipping truck tailpipe emissions.
Proposed Hidden QuarryReport #1201429September 6, 2012 Page 7
Reputation Resources Results Canada | USA | UK | UAE | India | China www.rwdiair.com
3.3.2 RATIONALE FOR ASSESSMENT
3.3.2.1 Fugitive Dust Emissions from Paved and Unpaved Internal Haul Roads
JDCL will develop a Best Management Practice Plan, which will serve as a guideline for dust
management practices at the facility. With the implementation of this plan, the facility is exempt from
assessing particulate emissions from paved roadways, unpaved roadways, and aggregate storage pileslocated on-site, as per guidance in Section 7.4.1 of MOE Guideline A10.
3.3.2.2 Tailpipe Emissions from Trucks and Mobile Equipment
On-site mobile equipment contributes combustion by-product emissions but is not subject to the
compliance assessment, as Section 5 of Regulation 419/05 states that “this Regulation does not apply todischarges of contaminants from motor vehicles”. Motor vehicle engine exhaust emissions are addressed
through federal regulations that have resulted in declining exhaust emissions over the past few decades
and will result in continued declines in the coming years.
Proposed Hidden QuarryReport #1201429September 6, 2012 Page 8
Reputation Resources Results Canada | USA | UK | UAE | India | China www.rwdiair.com
4 Operating Conditions, Emission Estimating and Data Quality
4.1 DESCRIPTION OF OPERATING CONDITIONS
Section 10 of O. Reg. 419/05 states that, for the purposes of an air quality assessment, an acceptableoperating scenario to consider is one that would result, for a given contaminant, in the highest
concentration of that contaminant at a point of impingement that the facility is capable of causing. To
satisfy this requirement, a worst-case production scenario was developed for the quarry. This scenario,
described in Section 1.2, and shown on Figure 1.4, represents the maximum processing and shippingrates that the facility could be expected to achieve.
As noted in Section 3.2.2.2, once the initial above-water stage of the quarry is complete, blasting,
extraction and temporary stockpiling (for initial dewatering) activities will be performed below water. As a
result, emissions of particulate matter from these activities are considered to be insignificant, as they will
be conducted in a water-saturated environment. Therefore, the maximum operating scenario consideredthe maximum processing and shipping rates that the facility could be expected to achieve, including
extraction, handling, hauling, processing and shipping of aggregate during above-water operations. The
quarry operations were then broken down into three emission scenarios.
4.1.1 SCENARIO 1 – COMPLIANCE MODELLING
A compliance model run was performed to determine whether the quarry would be able to obtain an
Environmental Compliance Approval. This scenario does not include fugitive dust from paved and
unpaved haul routes, as well as tailpipe emissions from trucks and heavy equipment, as discussed in
Section 3.3.
The option exists to use conveyors to move material from working face to the processing plant,
4.1.2 SCENARIO 2 – CUMULATIVE EFFECTS MODELLING – CONVEYORS FROM FACE
This scenario included fugitive dust and tail pipe emissions from mobile equipment at the site, and
considers the use of conveyors for transporting raw material from the working face to the primary crusher.
As a conservative simplification, emissions from the transfer of the material onto the conveyor wererepresented by the same haul truck loading emission estimate of the third scenario, while emissions from
the conveyor drop into the primary crusher are represented by the emission estimate from the third
scenario for trucks dumping into the grizzly feeder at the primary crusher.
4.1.3 SCENARIO 3 – CUMULATIVE EFFECTS MODELLING – HAUL TRUCKS
This scenario includes fugitive dust and tail pipe emissions from mobile equipment at the site, and
considers on-site haul trucks to transport raw material from the working face to the primary crusher.
Proposed Hidden QuarryReport #1201429September 6, 2012 Page 9
Reputation Resources Results Canada | USA | UK | UAE | India | China www.rwdiair.com
4.2 EXPLANATION OF METHOD USED TO CALCULATE THE EMISSION RATE
Emission rates from sources included in this assessment were estimated using the methodologies
discussed in the following sections. Information supporting these estimates is provided in Appendix B.
4.2.1 HAUL TRUCK LOADING AND DUMPING OPERATIONS
PM emissions from loading of haul trucks and dumping at the grizzly were estimated using emissionfactors from the U.S. EPA Compilation of Air Pollutant Emission Factors (AP-42) Chapter 13.2.4:
Aggregate Handling and Storage Piles. A moisture value of 5% was used to reflect the high moisture
content of material taken directly from the working face. This is consistent with RWDI’s experience at
sand and gravel operations in Southern Ontario.
The amount of aggregate material handled at any given location was assumed to be equivalent to theanticipated maximum hourly extraction rate for the site.
Truck loading and dumping emissions vary with wind speed, and were calculated on an hourly basis
using the meteorological data set processed for use with the AERMOD dispersion model. For the
purposes of the tables included in this report, a range of wind speeds were used to provide representativevalues for reporting purposes.
Appendix B provides a summary of the sources, emission factors, and control measures applied to each
material handling source.
4.2.2 PROCESSING OPERATIONS
PM emissions from processing operations were estimated using emission factors from the U.S. EPA AP-42 Chapter 11.19.2: Crushed Stone Processing and Pulverized Mineral Processing. Processing
operations at the quarry include crushing, screening, conveying and loading of trucks via front end loader.
For the primary and secondary crushers, AP-42 does not provide an emission factor for TPM emissions.
Thus, the emission factor for tertiary crushing was used. This is considered to be a conservativeassumption, since tertiary crushing involves crushing of smaller stone-sizes, which typically generates
more dust than primary and secondary crushing.
The material being processed will have high inherent moisture content. Water sprays will be utilized for
supplemental moisture if required. Therefore the “controlled” emission factors provided in AP-42 have
been used.
Appendix B provides a summary of the sources, emission factors, and control measures applied to each
processing source.
4.2.3 SHIPPING OPERATIONS
PM emissions from loading of shipping trucks were estimated using emission factors from AP-42 Chapter13.2.4: Aggregate Handling and Storage Piles. The moisture values for the material handled were based
on the mean values provided in Chapter 13.2.4 for limestone products.
Proposed Hidden QuarryReport #1201429September 6, 2012 Page 10
Reputation Resources Results Canada | USA | UK | UAE | India | China www.rwdiair.com
The amount of aggregate material handled at each location was assumed to be equivalent to theproduction rate of the material stockpiled at that location. A supplemental control efficiency of 90% was
applied to reflect the washed nature of the aggregate.
Truck loading emissions vary with wind speed, and were calculated on an hourly basis using the
meteorological data set processed for use with the AERMOD dispersion model. For the purposes of thetables included in this report, a range of wind speeds were used to provide representative values for
reporting purposes.
Appendix B provides a summary of the sources, emission factors, and control measures applied to each
material handling source.
4.2.4 FUGITIVE DUST EMISSIONS FROM PAVED INTERNAL HAUL ROADS
Emission factors from Chapter 13.2.1 of AP-42 were used to predict the emission rates shipping truck
traffic on the paved internal haul roads. These roads consist of a paved site entrance, a paved loop
around the processing plant.
The paved section was estimated to have average silt loading of 1.2 g/m², which is lower than the meanvalue for quarry sites provided on Table 13.2.1-3 of AP-42. Past experience indicates that this is
achievable on industrial paved roads using intensive flushing / sweeping programs.
Appendix B provides a summary of the sources, emission factors, and control measures applied to each
internal haul road.
4.2.5 FUGITIVE DUST EMISSIONS FROM UNPAVED INTERNAL HAUL ROADS
Emission factors from Chapter 13.2.2 of AP-42 were used to predict the emission rates from quarry truck
traffic on the unpaved internal haul roads. These roads consist of unpaved quarry truck haul routes
between the working faces and the processing plant.
The silt loading values were based on values provided in AP-42, and is supported by studies done byRWDI at various sites across Ontario. The unpaved haul routes were estimated to have an average silt
loading of approximately 8.3%.
In addition, watering of the unpaved haul routes, combined with a posted and monitored speed limit of 25
km/h, was estimated to provide 95% control of emissions compared to a dry haul route with no speed
limit, based on information provided in AP-42 and in literature supporting AP-42. These values reflect theimplementation of the Best Management Practices Plan.
Appendix B provides a summary of the sources, emission factors, and control measures applied to each
internal haul road.
4.2.6 Diesel-Fired Drag Line Emissions
Emissions from the diesel-fired drag-line unit were estimated using emissions factors from Chapter 3.3 of
AP-42: Gasoline and Diesel Industrial Engines. The drag-line engine is a 500 hp unit, and operates at a
Proposed Hidden QuarryReport #1201429September 6, 2012 Page 11
Reputation Resources Results Canada | USA | UK | UAE | India | China www.rwdiair.com
load factor of 53%, which accounts for the fact that the unit does not operate at maximum power outputfor an entire hour. The load factor is based on information contained in the supporting documentation for
the U.S. EPA NONROAD emission model.1
4.2.7 TRUCK AND HEAVY EQUIPMENT TAILPIPE EMISSIONS
Emissions from the loaders and quarry haul trucks were estimated using Tier 3 emission limits from theU.S. EPA. New loaders and haul trucks already meet the Tier 3 standards, thus by the time operations at
the proposed quarry commence, it is assumed that equipment at the site will comply with the Tier 3
standards. The loaders at the working face and at the plant are assumed to be similar to a Caterpillar
988, with a rated power output of 414 kW. The quarry haul trucks are assumed to be similar to a
Caterpillar 770 class off-highway truck, with a rated power output of 381 kW. A load factor of 48% wasapplied to the loaders, while a load factor of 58% was applied to the quarry haul trucks. The load factors
are representative values, based on information contained in the supporting documentation for the U.S.
EPA NONROAD emission model.1
4.2.8 SHIPPING TRUCK TAILPIPE EMISSIONS
Tailpipe emissions from shipping trucks were estimated using short-haul truck emission factors from the
U.S. EPA MOVES emission model. This model provides emissions on a gram per vehicle kilometer
travelled basis. A shipping truck traffic volume of 13round trips (26 passes) per hour was used, which is
consistent with the peak hour indicated in the Cole Engineering Draft Traffic Impact Study. The haul
route length is based on the distance between the processing plant and various working faces in severallocations within each operating phases.
4.3 SAMPLE CALCULATION FOR EACH METHOD
4.3.1 HAUL TRUCK LOADING AND DUMPING OPERATIONS
The equations from Chapter 13.2.4 are used to estimate potential emissions of material handlingoperations related to material handling at the working face during above-water extraction. For this
sample calculation of TSP emissions, the appropriate particle size multiplier is 0.74. The moisture value
was set at 5%, which is characteristic of material being taken directly from the working face. The hourly
handling rate was assumed to be 500 tonnes per hour, which is equivalent to the maximum hourly
production rate for the quarry. For this sample calculation, a sample wind speed of 5 m/s was chosen.Refer to Appendix B for a summary of emission rate calculations for material handling operations.
1."Median Life, Annual Activity, and Load Factor Values for Nonroad Engine Emissions Modeling" EPA-420-R-10-016, NR-005d, July 2010.
Proposed Hidden QuarryReport #1201429September 6, 2012 Page 12
Reputation Resources Results Canada | USA | UK | UAE | India | China www.rwdiair.com
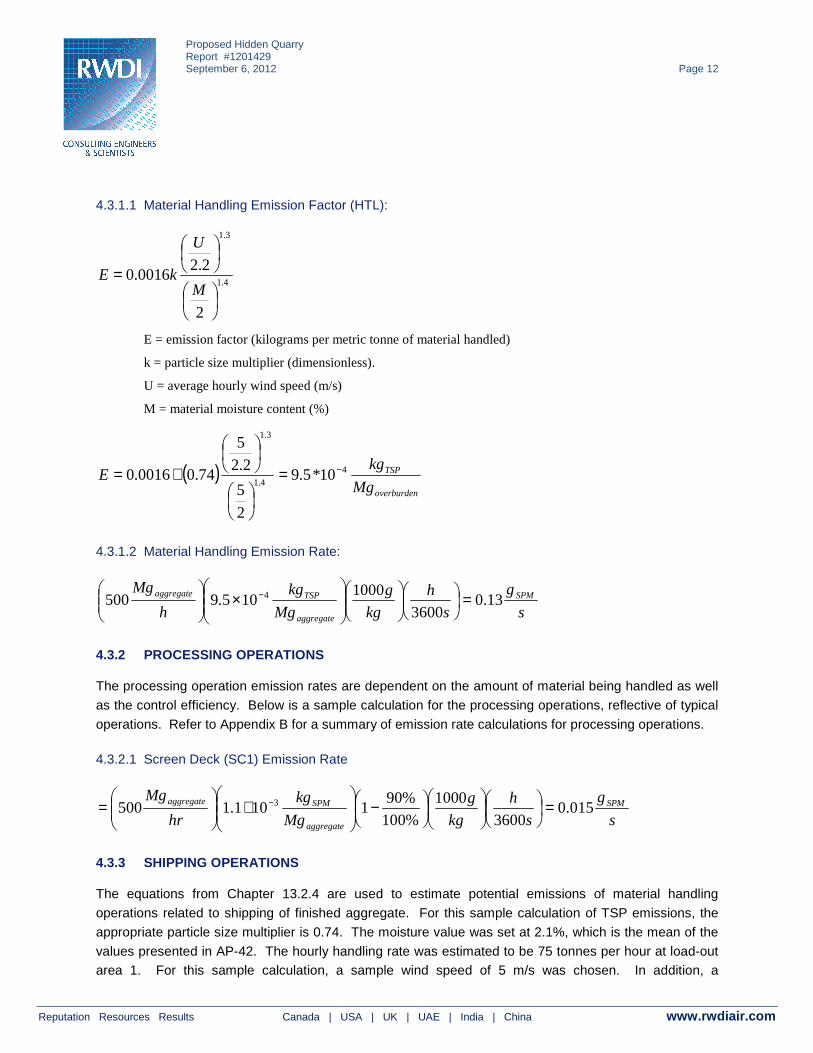
4.3.1.1 Material Handling Emission Factor (HTL):
4.1
3.1
2
2.20016.0
=M
U
kE
E = emission factor (kilograms per metric tonne of material handled)
k = particle size multiplier (dimensionless).
U = average hourly wind speed (m/s)
M = material moisture content (%)
( )overburden
TSP
Mg
kgE 4
4.1
3.1
10*5.9
2
5
2.2
5
74.00016.0 −=
∗=
4.3.1.2 Material Handling Emission Rate:
s
g
s
h
kg
g
Mg
kg
h
MgSPM
aggregate
TSPaggregate 13.03600
1000105.9500 4 =
×
−
4.3.2 PROCESSING OPERATIONS
The processing operation emission rates are dependent on the amount of material being handled as well
as the control efficiency. Below is a sample calculation for the processing operations, reflective of typical
operations. Refer to Appendix B for a summary of emission rate calculations for processing operations.
4.3.2.1 Screen Deck (SC1) Emission Rate
s
g
s
h
kg
g
Mg
kg
hr
MgSPM
aggregate
SPMaggregate 015.03600
1000
%100
%901101.1500 3 =
−
∗
= −
4.3.3 SHIPPING OPERATIONS
The equations from Chapter 13.2.4 are used to estimate potential emissions of material handling
operations related to shipping of finished aggregate. For this sample calculation of TSP emissions, the
appropriate particle size multiplier is 0.74. The moisture value was set at 2.1%, which is the mean of the
values presented in AP-42. The hourly handling rate was estimated to be 75 tonnes per hour at load-outarea 1. For this sample calculation, a sample wind speed of 5 m/s was chosen. In addition, a
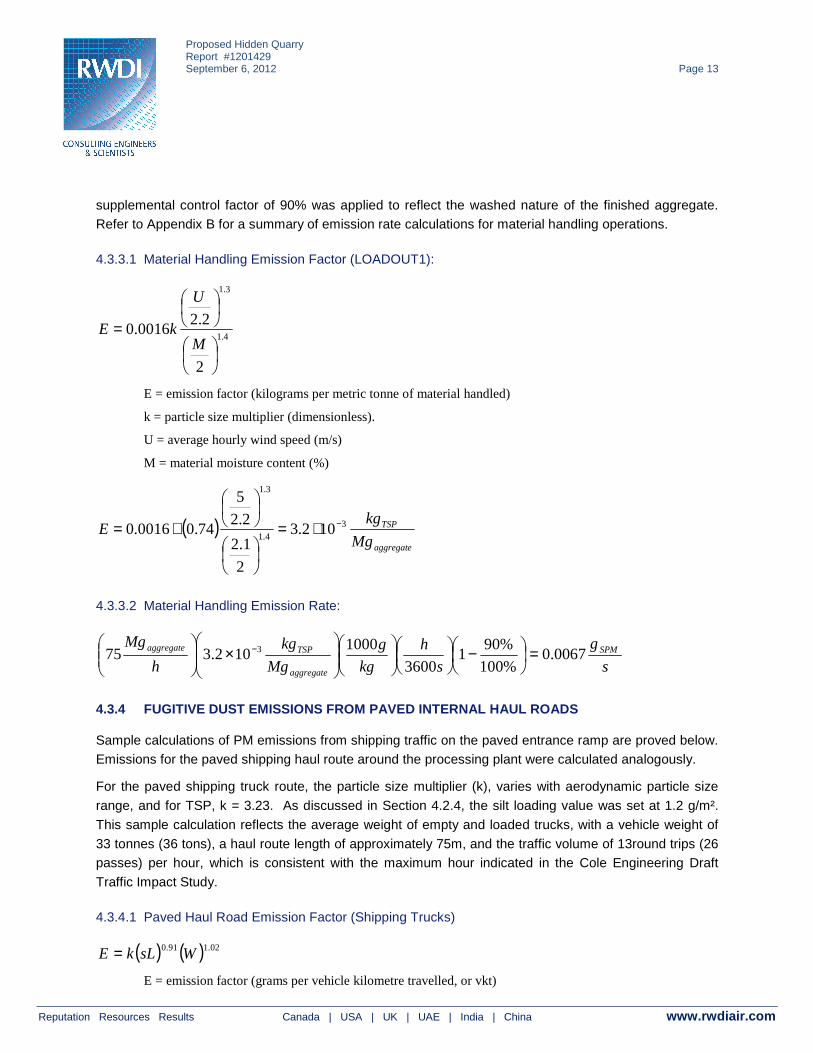
Proposed Hidden QuarryReport #1201429September 6, 2012 Page 13
Reputation Resources Results Canada | USA | UK | UAE | India | China www.rwdiair.com
supplemental control factor of 90% was applied to reflect the washed nature of the finished aggregate.Refer to Appendix B for a summary of emission rate calculations for material handling operations.
4.3.3.1 Material Handling Emission Factor (LOADOUT1):
4.1
3.1
2
2.20016.0
=M
U
kE
E = emission factor (kilograms per metric tonne of material handled)
k = particle size multiplier (dimensionless).
U = average hourly wind speed (m/s)
M = material moisture content (%)
( )aggregate
TSP
Mg
kgE 3
4.1
3.1
102.3
2
1.2
2.2
5
74.00016.0 −∗=
∗=
4.3.3.2 Material Handling Emission Rate:
s
g
s
h
kg
g
Mg
kg
h
MgSPM
aggregate
TSPaggregate 0067.0%100
%901
3600
1000102.375 3 =
−
×
−
4.3.4 FUGITIVE DUST EMISSIONS FROM PAVED INTERNAL HAUL ROADS
Sample calculations of PM emissions from shipping traffic on the paved entrance ramp are proved below.Emissions for the paved shipping haul route around the processing plant were calculated analogously.
For the paved shipping truck route, the particle size multiplier (k), varies with aerodynamic particle size
range, and for TSP, k = 3.23. As discussed in Section 4.2.4, the silt loading value was set at 1.2 g/m².
This sample calculation reflects the average weight of empty and loaded trucks, with a vehicle weight of
33 tonnes (36 tons), a haul route length of approximately 75m, and the traffic volume of 13round trips (26passes) per hour, which is consistent with the maximum hour indicated in the Cole Engineering Draft
Traffic Impact Study.
4.3.4.1 Paved Haul Road Emission Factor (Shipping Trucks)
( ) ( ) 02.191.0 WsLkE =
E = emission factor (grams per vehicle kilometre travelled, or vkt)
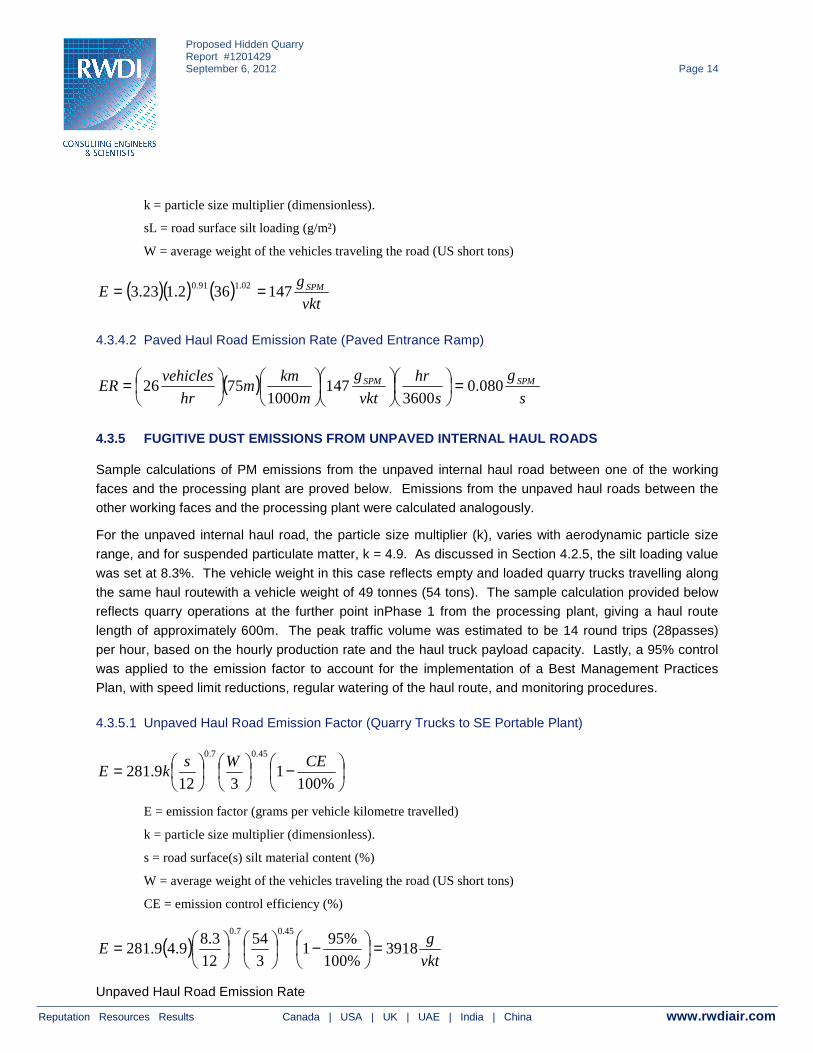
Proposed Hidden QuarryReport #1201429September 6, 2012 Page 14
Reputation Resources Results Canada | USA | UK | UAE | India | China www.rwdiair.com
k = particle size multiplier (dimensionless).
sL = road surface silt loading (g/m²)
W = average weight of the vehicles traveling the road (US short tons)
( )( ) ( )vkt
gE SPM147362.123.3 02.191.0 ==
4.3.4.2 Paved Haul Road Emission Rate (Paved Entrance Ramp)
( )s
g
s
hr
vkt
g
m
kmm
hr
vehiclesER SPMSPM 080.0
3600147
10007526 =
=
4.3.5 FUGITIVE DUST EMISSIONS FROM UNPAVED INTERNAL HAUL ROADS
Sample calculations of PM emissions from the unpaved internal haul road between one of the working
faces and the processing plant are proved below. Emissions from the unpaved haul roads between theother working faces and the processing plant were calculated analogously.
For the unpaved internal haul road, the particle size multiplier (k), varies with aerodynamic particle size
range, and for suspended particulate matter, k = 4.9. As discussed in Section 4.2.5, the silt loading value
was set at 8.3%. The vehicle weight in this case reflects empty and loaded quarry trucks travelling along
the same haul routewith a vehicle weight of 49 tonnes (54 tons). The sample calculation provided belowreflects quarry operations at the further point inPhase 1 from the processing plant, giving a haul route
length of approximately 600m. The peak traffic volume was estimated to be 14 round trips (28passes)
per hour, based on the hourly production rate and the haul truck payload capacity. Lastly, a 95% control
was applied to the emission factor to account for the implementation of a Best Management PracticesPlan, with speed limit reductions, regular watering of the haul route, and monitoring procedures.
4.3.5.1 Unpaved Haul Road Emission Factor (Quarry Trucks to SE Portable Plant)
E = emission factor (grams per vehicle kilometre travelled)
k = particle size multiplier (dimensionless).
s = road surface(s) silt material content (%)
W = average weight of the vehicles traveling the road (US short tons)
CE = emission control efficiency (%)
( )vkt
gE 3918
%100
%951
3
54
12
3.89.49.281
45.07.0
=
−
=
Unpaved Haul Road Emission Rate
−
=
%1001
3129.281
45.07.0CEWs
kE
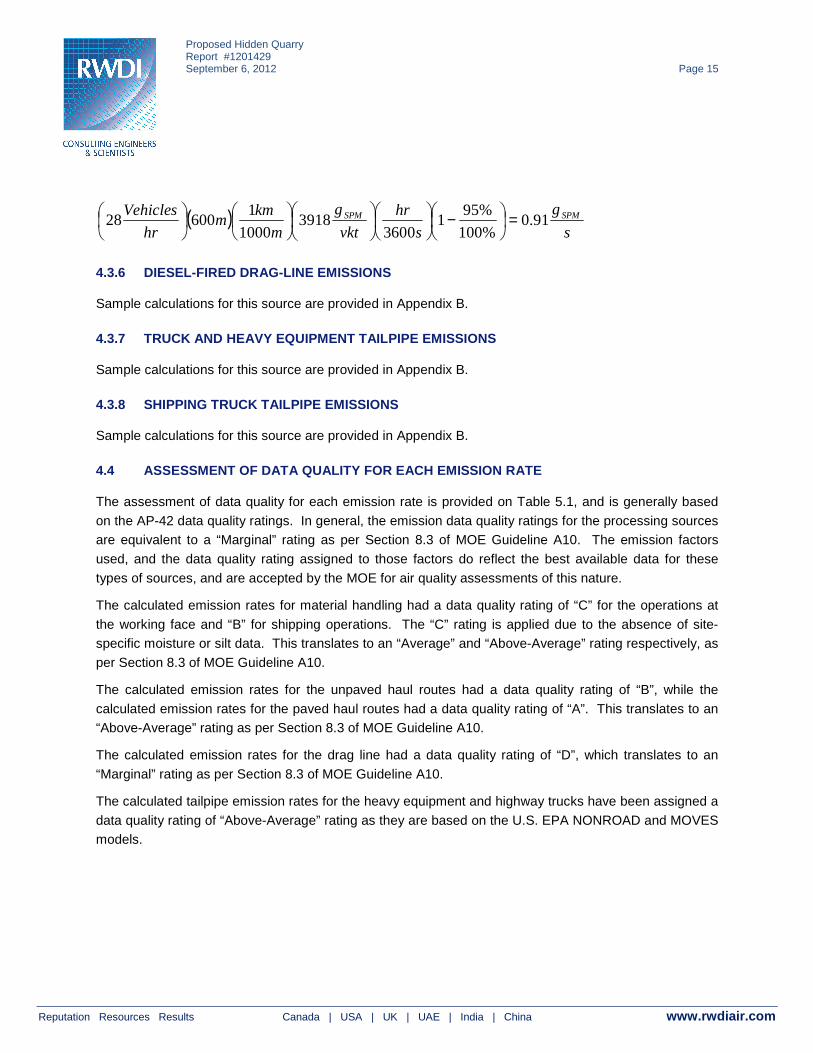
Proposed Hidden QuarryReport #1201429September 6, 2012 Page 15
Reputation Resources Results Canada | USA | UK | UAE | India | China www.rwdiair.com
( )s
g
s
hr
vkt
g
m
kmm
hr
Vehicles SPMSPM 91.0%100
%951
36003918
1000
160028 =
−
4.3.6 DIESEL-FIRED DRAG-LINE EMISSIONS
Sample calculations for this source are provided in Appendix B.
4.3.7 TRUCK AND HEAVY EQUIPMENT TAILPIPE EMISSIONS
Sample calculations for this source are provided in Appendix B.
4.3.8 SHIPPING TRUCK TAILPIPE EMISSIONS
Sample calculations for this source are provided in Appendix B.
4.4 ASSESSMENT OF DATA QUALITY FOR EACH EMISSION RATE
The assessment of data quality for each emission rate is provided on Table 5.1, and is generally based
on the AP-42 data quality ratings. In general, the emission data quality ratings for the processing sourcesare equivalent to a “Marginal” rating as per Section 8.3 of MOE Guideline A10. The emission factors
used, and the data quality rating assigned to those factors do reflect the best available data for these
types of sources, and are accepted by the MOE for air quality assessments of this nature.
The calculated emission rates for material handling had a data quality rating of “C” for the operations at
the working face and “B” for shipping operations. The “C” rating is applied due to the absence of site-specific moisture or silt data. This translates to an “Average” and “Above-Average” rating respectively, as
per Section 8.3 of MOE Guideline A10.
The calculated emission rates for the unpaved haul routes had a data quality rating of “B”, while the
calculated emission rates for the paved haul routes had a data quality rating of “A”. This translates to an“Above-Average” rating as per Section 8.3 of MOE Guideline A10.
The calculated emission rates for the drag line had a data quality rating of “D”, which translates to an
“Marginal” rating as per Section 8.3 of MOE Guideline A10.
The calculated tailpipe emission rates for the heavy equipment and highway trucks have been assigned a
data quality rating of “Above-Average” rating as they are based on the U.S. EPA NONROAD and MOVESmodels.
Proposed Hidden QuarryReport #1201429September 6, 2012 Page 16
Reputation Resources Results Canada | USA | UK | UAE | India | China www.rwdiair.com
5 Source Summary Table and Property Plan
5.1 SOURCE SUMMARY TABLE
Table 5.1 in the Tables Section provides the Source Summary Table for the quarry.
5.2 SITE PLAN
Figure 5.2 provides an overview of operational areas and potential receptors at the quarry.
905-
Proposed Hidden QuarryReport #1201429September 6, 2012 Page 17
Reputation Resources Results Canada | USA | UK | UAE | India | China www.rwdiair.com
6 Dispersion Modelling
Dispersion modelling for the facility was conducted using the estimated emission rates discussed in the
preceding section in conjunction with the AERMOD dispersion model to predict concentrations of allcontaminants at points of impingement along the property line and beyond. This modelling was
conducted for the three scenarios described in Section 4.1.
Sources were modelled as a series of volume sources with parameters based on information obtained
from the Site Plan and typical dimensions of processing equipment and vehicles used at other facilities ofthis nature. The modelled source parameters are consistent with guidance from the NSSGA2. Internal
haul roads were modelled as adjacent volume sources, also in accordance with guidance from the
National Sand Stone and Gravel Association and the U.S. EPA.
6.1 DISPERSION MODELLING INPUT SUMMARY TABLE
Table 6.1 in the Tables Section provides the Dispersion Modelling Input Summary Table for the facility.Additional information on specific elements of the modelling analysis is provided in the following sections.
6.1.1 METEOROLOGICAL CONDITIONS
Under O. Reg. 419/05 the MOE provides a series of pre-processed meteorological data sets for use in
dispersion modelling assessments in Ontario. These data sets use surface observations and upper airdata from airports that represent major geographical areas of Ontario. While these data sets are the
MOE’s preferred option for conducting dispersion modelling assessments, they do not necessarily reflect
localized conditions, and therefore a discussion of the dispersion modelling data sets and a discussion of
more localized meteorological conditions is provided here. For this assessment, the meteorological data
from London shows good agreement with the local data, as discussed below.
The quarry is located in the Township of Eramosa and, therefore, the West Central Region meteorological
data set is recommended by the MOE for use at this site. This includes surface(s) data from London,
Ontario and upper air data from White Lake, Michigan. Within each region, the MOE provides alternative
data sets with the choice of data set depending on the character of the terrain at the study site. The areasurrounding the quarry is typically agricultural with some wooded areas and residences in the vicinity of
the site. The default data set for “crops” was used based on the land use patterns surrounding the site,
as this data set is expected to produce more conservative estimates.
To get information on wind climate at the study site, historical data reported by Environment Canada were
examined for the Guelph Turfgrass Institute and the Region of Waterloo International Airport. Windroses, and the relative location of these stations to the quarry, are shown on Figure 6.1.
Data from the Guelph Turfgrass Institute is not complete for the period of record, so data from the Region
of Waterloo International Airport were used to determine the potential for wind erosion, and to
characterize the wind climate for the area. Data from the Guelph Turfgrass Institute is useful however, inthat it shows a general tendency towards lower average wind speeds than observed at the Region of
2“Modelling Fugitive Dust Sources”, National Stone, Sand & Gravel Association, Alexandria, VA., 2004.
Proposed Hidden QuarryReport #1201429September 6, 2012 Page 18
Reputation Resources Results Canada | USA | UK | UAE | India | China www.rwdiair.com
Waterloo International Airport, which in turn shows lower average wind speeds than observed at theLondon International Airport. This suggests that using the Region of Waterloo International Airport data
to discuss the potential for wind erosion is conservative, and that using the data from London
International Airport for the modelling assessment is also appropriate.
During the summer season, corresponding to the peak production period for the quarry, the wind mostoften comes from the west, west-northwest and northwest (about 26% of the time in total). Winds from
the south through west-southwest are also relatively common (about 25% of the time). The least
common winds are from south easterly and north easterly directions.
Strong winds (greater than 30 km/h) are predominantly from the west during the summer, but also come
from the southwest, west-southwest and west-northwest. Altogether, winds above 30 km/h occur only1.7% of the time during the summer.
6.1.2 AREA OF MODELLING COVERAGE
The area of modelling coverage was designed to meet the requirements outlined in O. Reg. 419/05,
section 14. A multi-tiered receptor grid was developed with reference to Section 7.2 of the Air DispersionModelling Guideline for Ontario, Version 2.0, March, 2009; therefore, interval spacing was dependent on
the receptor distance from on-site sources. Meteorological anomalies were removed as per Section 6.6
of MOE Guideline A11.
In addition, 18 discrete receptor locations were included in the assessment. These receptors represent
residences near the quarry.
6.1.3 STACK HEIGHT FOR CERTAIN NEW SOURCES OF CONTAMINANT
On-site emissions are not routed through stacks; therefore, this section of Reg. 419/05 does not apply to
this report.
6.1.4 TERRAIN DATA
Terrain information for the area surrounding the facility was obtained from the MOE Ontario Digital
Elevation Model Data web site. The terrain data is based on the North American Datum 1983 (NAD83)
horizontal reference datum. These data were run through the AERMAP terrain pre-processor to estimate
base elevations for receptors and to help the model account for changes in elevation of the surrounding
terrain. Base elevations for sources are based on information contained on the Site Plan and areassumed to be at the elevation of the first lift.
6.1.5 AVERAGING PERIODS USED
Ontario’s regulation on Local Air Quality (Reg. 419/05) uses a phased approach to implementation of
contaminant standards. Originally, the regulation had three schedules of standards, with the first twobeing applicable during interim phase-in periods (up to 2010 for Schedule 1 and 2010 to 2013 for
Schedule 2, for most types of facilities). For this study, the fully phased-in contaminant standards
(Schedule 3) have been used. The relevant averaging time for the Schedule 3 standard for TSP is 24-
Proposed Hidden QuarryReport #1201429September 6, 2012 Page 19
Reputation Resources Results Canada | USA | UK | UAE | India | China www.rwdiair.com
hours. The relevant averaging times for the Schedule 3 standard for NOx are 1-hour and 24-hours.PM10 and PM2.5 do not currently have standards in O. Reg. 419/05, but they do have air quality criteria
that, like TSP, are based on an averaging time of 24 hours.
6.2 LAND USE ZONING DESIGNATION PLAN
The quarry is located on Part of Lot 1, Concession 6, in the Township of Guelph-Eramosa, in the Countyof Wellington. The property is bordered to the south by Highway 7, which forms the boundary between
the Township of Guelph-Eramosa and the Town of Milton. The site is presently zoned Agricultural. The
Proponent is filing applications for the appropriate Official Plan and Zoning By-Law Amendments. The
neighbouring land uses include agricultural and rural industrial, under the Township of Guelph-Eramosa
Zoning By-Law, and Rural under the Town of Milton Zoning By-Law.
6.3 CRITERIA
Table 6.3 in the Tables Section provides the criteria used in the compliance assessment and cumulative
effects assessments.
6.4 AMBIENT CONCETRATIONS
The compliance assessment predicted the impact of the quarry emission sources at and beyond the
property boundary of the facility. The comprehensive cumulative effects assessment went a step further
and considered how predicted impacts from the quarry sources would combine with ambient air pollutant
levels to produce an overall impact at sensitive off-site receptors. Pollutant concentrations in ambient air
can be attributed to two distinct elements:
1. Non-Background (locally significant emissions sources): Emissions from large industrial
sources, mobile sources, and other miscellaneous sources that result in acute spatial
variation of in-air pollutant concentrations on a local scale (e.g., large combustion sources,
industrial process emissions, major highways).
2. Miscellaneous other sources, including smaller industries; agricultural activities, residential
and commercial sources; traffic on the local road network; rail traffic; and long-range
transport of pollutants from other regions. These sources can be approximated by spatially
uniform in-air pollutant concentrations on a local scale.
With respect to non-background sources, there are no such sources within 5 kilometres of the quarry.Therefore the primary contributors to the ambient air pollutant levels are the more ubiquitous sources,
including vehicle traffic on Highway 7, rail traffic on the line to the north of the quarry, agricultural activities
and emissions from residential and commercial sources in Rockwood and the surrounding areas. Long
range transport of fine particulate (PM2.5) also contributes to the ambient air pollutant levels.
Therefore, estimating the overall impact at sensitive off-site receptors required an estimate of background
pollutant levels, which was based on historical monitoring data from a representative monitoring site.
Although the monitoring site in Guelph is located in a more urbanized environment, with some non-
background sources located within several kilometers of the monitor, this provides a more conservative
Proposed Hidden QuarryReport #1201429September 6, 2012 Page 20
Reputation Resources Results Canada | USA | UK | UAE | India | China www.rwdiair.com
estimate of ambient air pollutant levels. Given the proximity of the station to the quarry, and theconservativeness of the data, it is a suitable site for this assessment.
The cumulative effects assessment used a simplified approach to estimating the credible worst-case
cumulative concentration at off-site locations. In this approach the maximum modelled contribution from
quarry emission sources was added to an estimate of the maximum coincident background concentration.Consistent with widespread practice in Ontario, the 90th percentile level from the historical monitoring data
was used to represent the maximum coincident background level. This excludes the upper 10thpercentile
of background data, which are related to events that are unlikely to occur at the same time as the
predicted maximum contribution from the quarry sources under worst-case weather conditions.
Background PM2.5 levels were based on a 5-year average of the annual 90th percentile hourlyconcentration measured at the MOE monitoring station in Guelph (14.8 µg/m³). The Guelph monitoring
station is located less than 15km upwind of the site, and as it is located in a more urban setting, it is
expected to provide a more conservative estimate of background concentrations.
Background TSP was derived from the PM2.5 data for Guelph, based on an estimated PM2.5/ TSP ratio of
0.30. This value came from a published study of 500 monitoring sites in the US.3 The resulting 90th
percentile background concentration is 49 µg/m³.
Background PM10 was also derived from the PM2.5 data for the Guelph, based on an estimated PM2.5/
PM10 ratio of 0.54 from the study noted above. The resulting 90th percentile background concentration is
27 µg/m³.
Background O3 concentrations were obtained from the MOE monitoring station in Guelph. A 5-year
average of the annual 90th percentile hourly and daily concentrations was adopted.
NO2 concentrations were not measured at the Guelph station prior to 2010, so data from the MOE
monitoring station in Kitchener were used for the years prior to 2010. NO2 levels in Kitchener in 2010
were similar to but slightly higher than in Guelph, and therefore it is expected that using NO2 data fromKitchener will be conservative, and is therefore appropriate. The MOE does not provide 90th percentile
values of the 24-hour average concentrations, therefore, as a conservative simplification, the 90th
percentile 1-hour average concentration was used as the 24-hour value.
The data used in this assessment has been summarized on Table 6.4.
6.5 CONVERSION OF NOX TO NITROGEN DIOXIDE
NOX in diesel exhaust is composed primarily of nitric oxide (NO) and nitrogen dioxide (NO2). The
composition of diesel exhaust shortly after combustion is dominated by nitric oxide (NO). However, once
the exhaust is emitted to the atmosphere and begins to mix with outside air, some of the NO is oxidized in
reactions with other pollutants (principally ground-level ozone, O3) to produce NO2.
3Ramona Lali, Michaela Kendall, Kazuhiko Ito, and George D. Thurston, “Estimation of historical annual PM2.5exposures for health effects assessments “, Atmospheric Environment, Volume 38, Issue 31, October 2004, Pages5217-5226
Proposed Hidden QuarryReport #1201429September 6, 2012 Page 21
Reputation Resources Results Canada | USA | UK | UAE | India | China www.rwdiair.com
For the purposes of this assessment, the Ozone Limiting Method (OLM) was used to estimate themaximum short-term NO2 concentrations resulting from emissions of NOX. The 1-hour and 24-hr
concentrations of NOX predicted by AERMOD were compared to the average 90th percentile measured
ambient ozone concentration for years 2006-2010 from the MOE ambient monitoring station in Guelph.
A factor of 0.10 was assumed for the thermal conversion of NOX to NO2 for combustion sources. If theremaining concentration of NOX was less than the 90th percentile O3 concentration, then it was assumed
that 100% of the NOX is converted to NO2 according to the following equation:
If 0.9NOX < O3, then NO2 = NOX
However, if the concentration of NOX is greater than the 90th percentile O3 concentration, then O3 is the
limiting factor and the following relationship will be applied:
If 0.9NOX > O3, then NO2 = 0.1NOX + O3
It should be noted that this method assumes that the peak NO2 concentrations and elevated ozone
concentrations occur simultaneously, which may be a conservative assumption. The OLM has gained
acceptance by regulatory agencies in Ontario for the purpose of conducting environmental assessments.
6.6 FREQUENCY ANALYSIS
As part of the cumulative effects analysis, a frequency analysis was conducted to estimate the frequency
of exceeding the relevant criteria at the identified receptor locations. The frequency analysis presents the
number of predicted excursions above the relevant criteria at off-site receptors for the entire modelling
period of 5 years. This can also be expressed as a percentage of time during the modelling period duringwhich predicted concentrations are above the relevant criteria. This was conducted for both modelled
scenarios, and with and without ambient background concentrations.
6.7 DISPERSION MODELLING INPUT AND OUTPUT FILES
Appendix A provides a CD with the AERMOD input, output and supporting files for both of the dispersionmodelling scenarios assessed.
Proposed Hidden QuarryReport #1201429September 6, 2012 Page 22
Reputation Resources Results Canada | USA | UK | UAE | India | China www.rwdiair.com
7 Emission Summary Table and Conclusions
7.1 EMISSION SUMMARY TABLE
Results from the dispersion modelling model run are summarized in Table 7.1A for the complianceassessment, Table 7.1B for the cumulative effects assessment (conveyor scenario), and 7.1C for the
cumulative effects assessment (haul truck scenario). These tables summarize maximum predicted
concentrations of each contaminant at the receptor locations identified on Figure 5.2.
7.2 COMPARISON OF MODELLED AND HISTORICAL EXCEEDANCE DATA
7.2.1 SECNARIO 1 – COMPLIANCE MODELLING
The results of the dispersion modelling analysis indicate that the facility is in compliance with the relevant
criteria at the property line and at all receptor locations, with the exception of PM10 along the property line.
Compliance with the PM10 criteria at the property line is not required to demonstrate compliance with therequirements of O. Reg. 419/05, and therefore the facility would be eligible to obtain an Environmental
Compliance Approval for the proposed operations.
7.2.2 SCENARIO 2 – CUMULATIVE EFFECTS MODELLING – CONVEYORS FROM FACE
The results of the dispersion modelling analysis indicate that with the inclusion of background air quality
data, predicted concentrations of NO2 and PM2.5 are below the relevant criteria at all receptors.
Predicted concentrations of TSP and PM10 exceed the relevant criteria at several locations, but the
predicted frequency of excursions above the relevant criteria remains low, at 1.5% of the time at the most
impacted receptor, and below 1% at all other locations.
7.2.3 SCENARIO 3 – CUMULATIVE EFFECTS MODELLING – HAUL TRUCKS
The results of the dispersion modelling analysis indicate that without the inclusion of background air
quality data, predicted concentrations of NO2 and PM2.5 are below the relevant criteria at all receptors.
Predicted concentrations of TSP and PM10 exceed the relevant criteria at several locations, but the
predicted frequency of excursions above the relevant criteria is higher than for Scenario 1, but remains
low, at less than 2.7% of the time at the most impacted receptor and below 1.2% at all other locations.
7.3 CONCLUSIONS
This assessment includes several significant conservative modelling assumptions, which are important
when considering the dispersion model predictions. These include:
� The maximum operating scenario is applied to every day during the operating season for the5-year simulation period, resulting in a coincidence of maximum operations and worst-caseweather conditions which, in reality, will be a rare occurrence; and,
� Assumption of dry weather every day of the 5-year simulation period.
Proposed Hidden QuarryReport #1201429September 6, 2012 Page 23
Reputation Resources Results Canada | USA | UK | UAE | India | China www.rwdiair.com
Noting these conservatisms, RWDI believes that the predicted frequency of excursions from thedispersion modelling analysis is within acceptable levels, provided the following recommendations are
implemented:
1. The quarry is limited to 12 hours of operation per day, from 7:00 am to 7:00 pm for sitepreparation, drilling, blasting, excavation, processing operations and rehabilitation activities,and 6:00 am to 6:00 pm for shipping operations.
2. The maximum processing rate of 6,000 tonnes per day is not exceeded.
3. Equipment-specific controls (tailpipe emission tiers, dust suppression, speed limits, etc.)listed in Appendix B of this report will be implemented;
4. An Environmental Compliance Approval under Section 9 of the Environmental Protection Act(EPA) will be obtained.
5. A Best Management Practices Plan will be developed and implemented.
6. The processing plant should be located approximately as shown in Figure 5.2B
7. Stripping of overburden should be limited to times when extraction, production and shippingactivities are well below the estimated peak rate of 6,000 tonnes per day.

Employee Job Title
TABLESTABLES
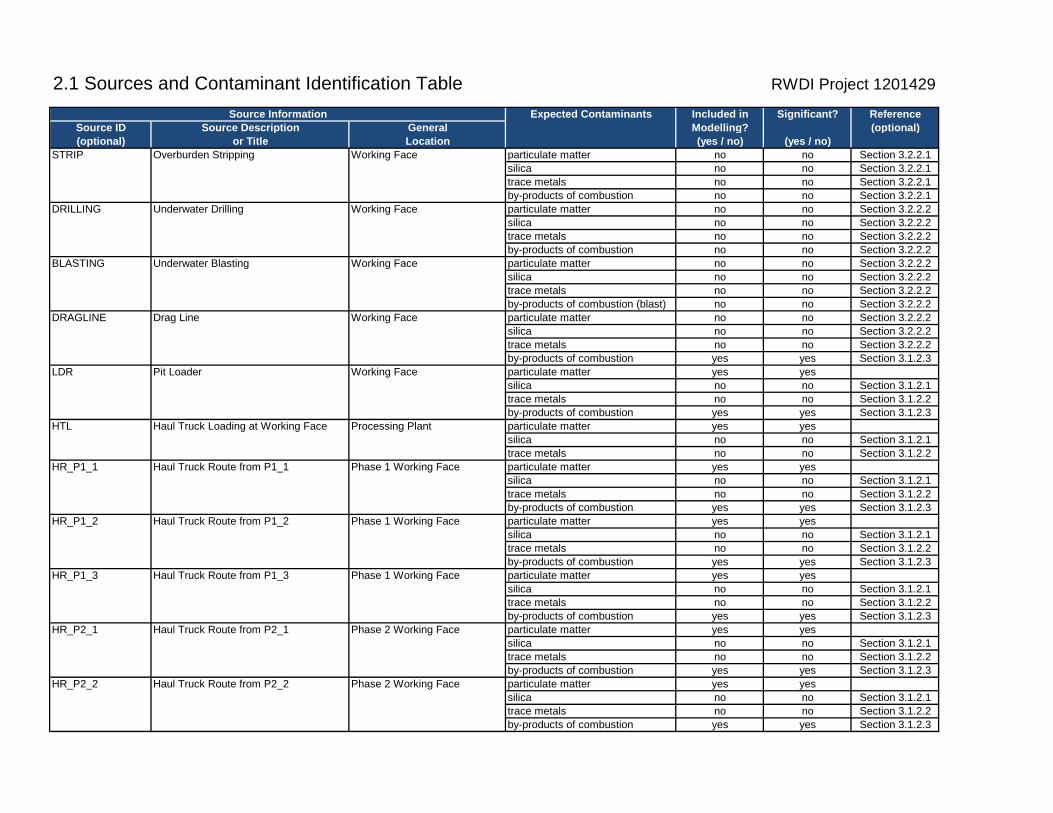
2.1 Sources and Contaminant Identification Table RWDI Project 1201429
Source Information Expected Contaminants Included in Significant? ReferenceSource ID Source Description General Modelling? (optional)(optional) or Title Location (yes / no) (yes / no)
STRIP Overburden Stripping Working Face particulate matter no no Section 3.2.2.1silica no no Section 3.2.2.1trace metals no no Section 3.2.2.1by-products of combustion no no Section 3.2.2.1
DRILLING Underwater Drilling Working Face particulate matter no no Section 3.2.2.2silica no no Section 3.2.2.2trace metals no no Section 3.2.2.2by-products of combustion no no Section 3.2.2.2
BLASTING Underwater Blasting Working Face particulate matter no no Section 3.2.2.2silica no no Section 3.2.2.2trace metals no no Section 3.2.2.2by-products of combustion (blast) no no Section 3.2.2.2
DRAGLINE Drag Line Working Face particulate matter no no Section 3.2.2.2silica no no Section 3.2.2.2trace metals no no Section 3.2.2.2by-products of combustion yes yes Section 3.1.2.3
LDR Pit Loader Working Face particulate matter yes yessilica no no Section 3.1.2.1trace metals no no Section 3.1.2.2by-products of combustion yes yes Section 3.1.2.3
HTL Haul Truck Loading at Working Face Processing Plant particulate matter yes yessilica no no Section 3.1.2.1trace metals no no Section 3.1.2.2
HR_P1_1 Haul Truck Route from P1_1 Phase 1 Working Face particulate matter yes yessilica no no Section 3.1.2.1trace metals no no Section 3.1.2.2by-products of combustion yes yes Section 3.1.2.3
HR_P1_2 Haul Truck Route from P1_2 Phase 1 Working Face particulate matter yes yessilica no no Section 3.1.2.1trace metals no no Section 3.1.2.2by-products of combustion yes yes Section 3.1.2.3
HR_P1_3 Haul Truck Route from P1_3 Phase 1 Working Face particulate matter yes yessilica no no Section 3.1.2.1trace metals no no Section 3.1.2.2by-products of combustion yes yes Section 3.1.2.3
HR_P2_1 Haul Truck Route from P2_1 Phase 2 Working Face particulate matter yes yessilica no no Section 3.1.2.1trace metals no no Section 3.1.2.2by-products of combustion yes yes Section 3.1.2.3
HR_P2_2 Haul Truck Route from P2_2 Phase 2 Working Face particulate matter yes yessilica no no Section 3.1.2.1trace metals no no Section 3.1.2.2by-products of combustion yes yes Section 3.1.2.3
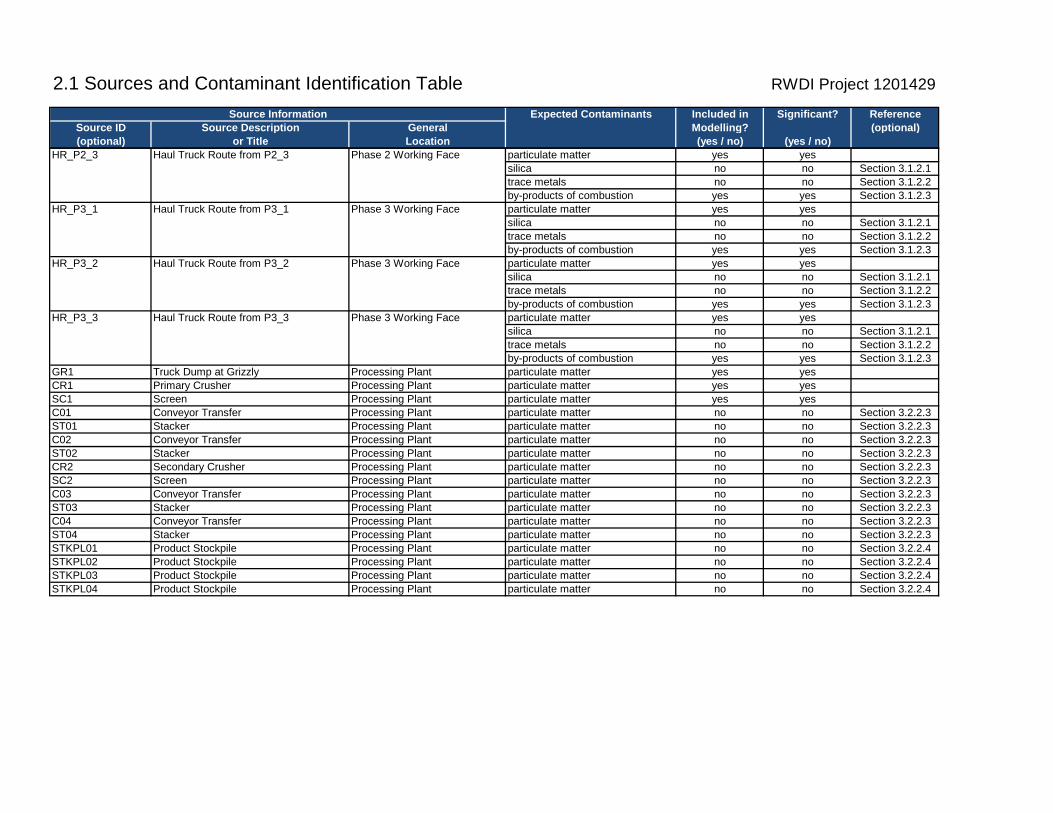
2.1 Sources and Contaminant Identification Table RWDI Project 1201429
Source Information Expected Contaminants Included in Significant? ReferenceSource ID Source Description General Modelling? (optional)(optional) or Title Location (yes / no) (yes / no)
HR_P2_3 Haul Truck Route from P2_3 Phase 2 Working Face particulate matter yes yessilica no no Section 3.1.2.1trace metals no no Section 3.1.2.2by-products of combustion yes yes Section 3.1.2.3
HR_P3_1 Haul Truck Route from P3_1 Phase 3 Working Face particulate matter yes yessilica no no Section 3.1.2.1trace metals no no Section 3.1.2.2by-products of combustion yes yes Section 3.1.2.3
HR_P3_2 Haul Truck Route from P3_2 Phase 3 Working Face particulate matter yes yessilica no no Section 3.1.2.1trace metals no no Section 3.1.2.2by-products of combustion yes yes Section 3.1.2.3
HR_P3_3 Haul Truck Route from P3_3 Phase 3 Working Face particulate matter yes yessilica no no Section 3.1.2.1trace metals no no Section 3.1.2.2by-products of combustion yes yes Section 3.1.2.3
GR1 Truck Dump at Grizzly Processing Plant particulate matter yes yesCR1 Primary Crusher Processing Plant particulate matter yes yesSC1 Screen Processing Plant particulate matter yes yesC01 Conveyor Transfer Processing Plant particulate matter no no Section 3.2.2.3ST01 Stacker Processing Plant particulate matter no no Section 3.2.2.3C02 Conveyor Transfer Processing Plant particulate matter no no Section 3.2.2.3ST02 Stacker Processing Plant particulate matter no no Section 3.2.2.3CR2 Secondary Crusher Processing Plant particulate matter no no Section 3.2.2.3SC2 Screen Processing Plant particulate matter no no Section 3.2.2.3C03 Conveyor Transfer Processing Plant particulate matter no no Section 3.2.2.3ST03 Stacker Processing Plant particulate matter no no Section 3.2.2.3C04 Conveyor Transfer Processing Plant particulate matter no no Section 3.2.2.3ST04 Stacker Processing Plant particulate matter no no Section 3.2.2.3STKPL01 Product Stockpile Processing Plant particulate matter no no Section 3.2.2.4STKPL02 Product Stockpile Processing Plant particulate matter no no Section 3.2.2.4STKPL03 Product Stockpile Processing Plant particulate matter no no Section 3.2.2.4STKPL04 Product Stockpile Processing Plant particulate matter no no Section 3.2.2.4
2.1 Sources and Contaminant Identification Table RWDI Project 1201429
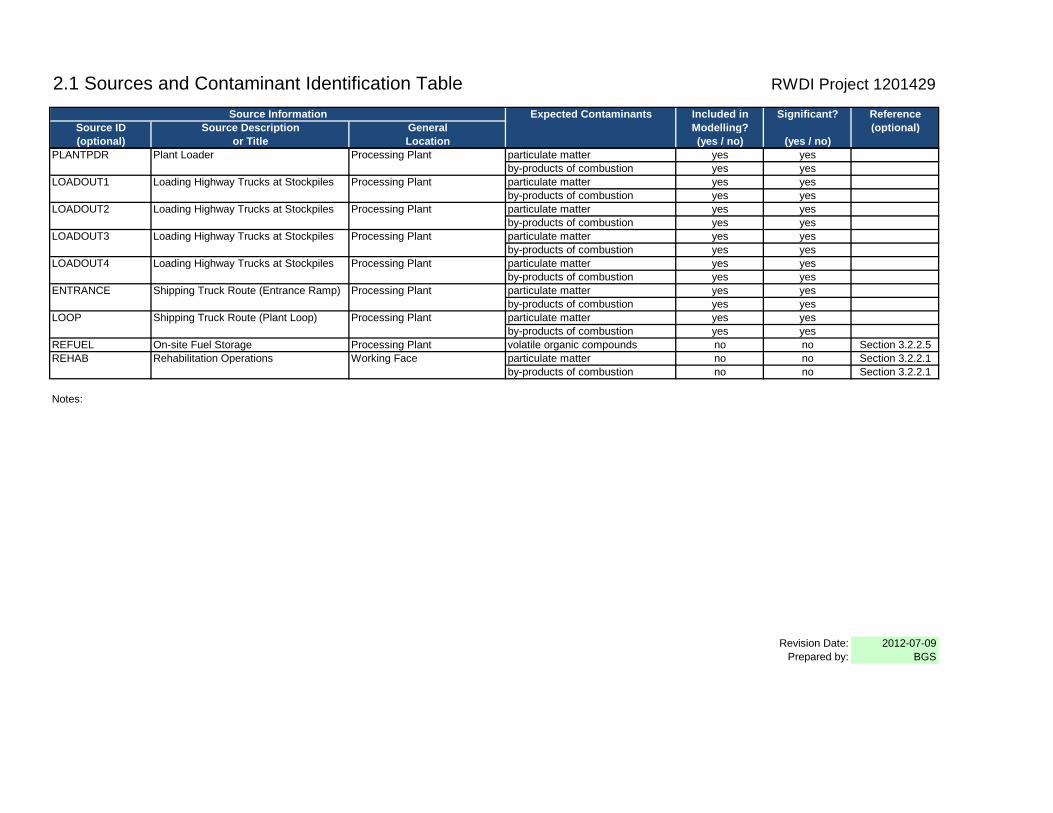
Source Information Expected Contaminants Included in Significant? ReferenceSource ID Source Description General Modelling? (optional)(optional) or Title Location (yes / no) (yes / no)
PLANTPDR Plant Loader Processing Plant particulate matter yes yesby-products of combustion yes yes
LOADOUT1 Loading Highway Trucks at Stockpiles Processing Plant particulate matter yes yesby-products of combustion yes yes
LOADOUT2 Loading Highway Trucks at Stockpiles Processing Plant particulate matter yes yesby-products of combustion yes yes
LOADOUT3 Loading Highway Trucks at Stockpiles Processing Plant particulate matter yes yesby-products of combustion yes yes
LOADOUT4 Loading Highway Trucks at Stockpiles Processing Plant particulate matter yes yesby-products of combustion yes yes
ENTRANCE Shipping Truck Route (Entrance Ramp) Processing Plant particulate matter yes yesby-products of combustion yes yes
LOOP Shipping Truck Route (Plant Loop) Processing Plant particulate matter yes yesby-products of combustion yes yes
REFUEL On-site Fuel Storage Processing Plant volatile organic compounds no no Section 3.2.2.5REHAB Rehabilitation Operations Working Face particulate matter no no Section 3.2.2.1
by-products of combustion no no Section 3.2.2.1
Notes:
Revision Date: 2012-07-09Prepared by: BGS
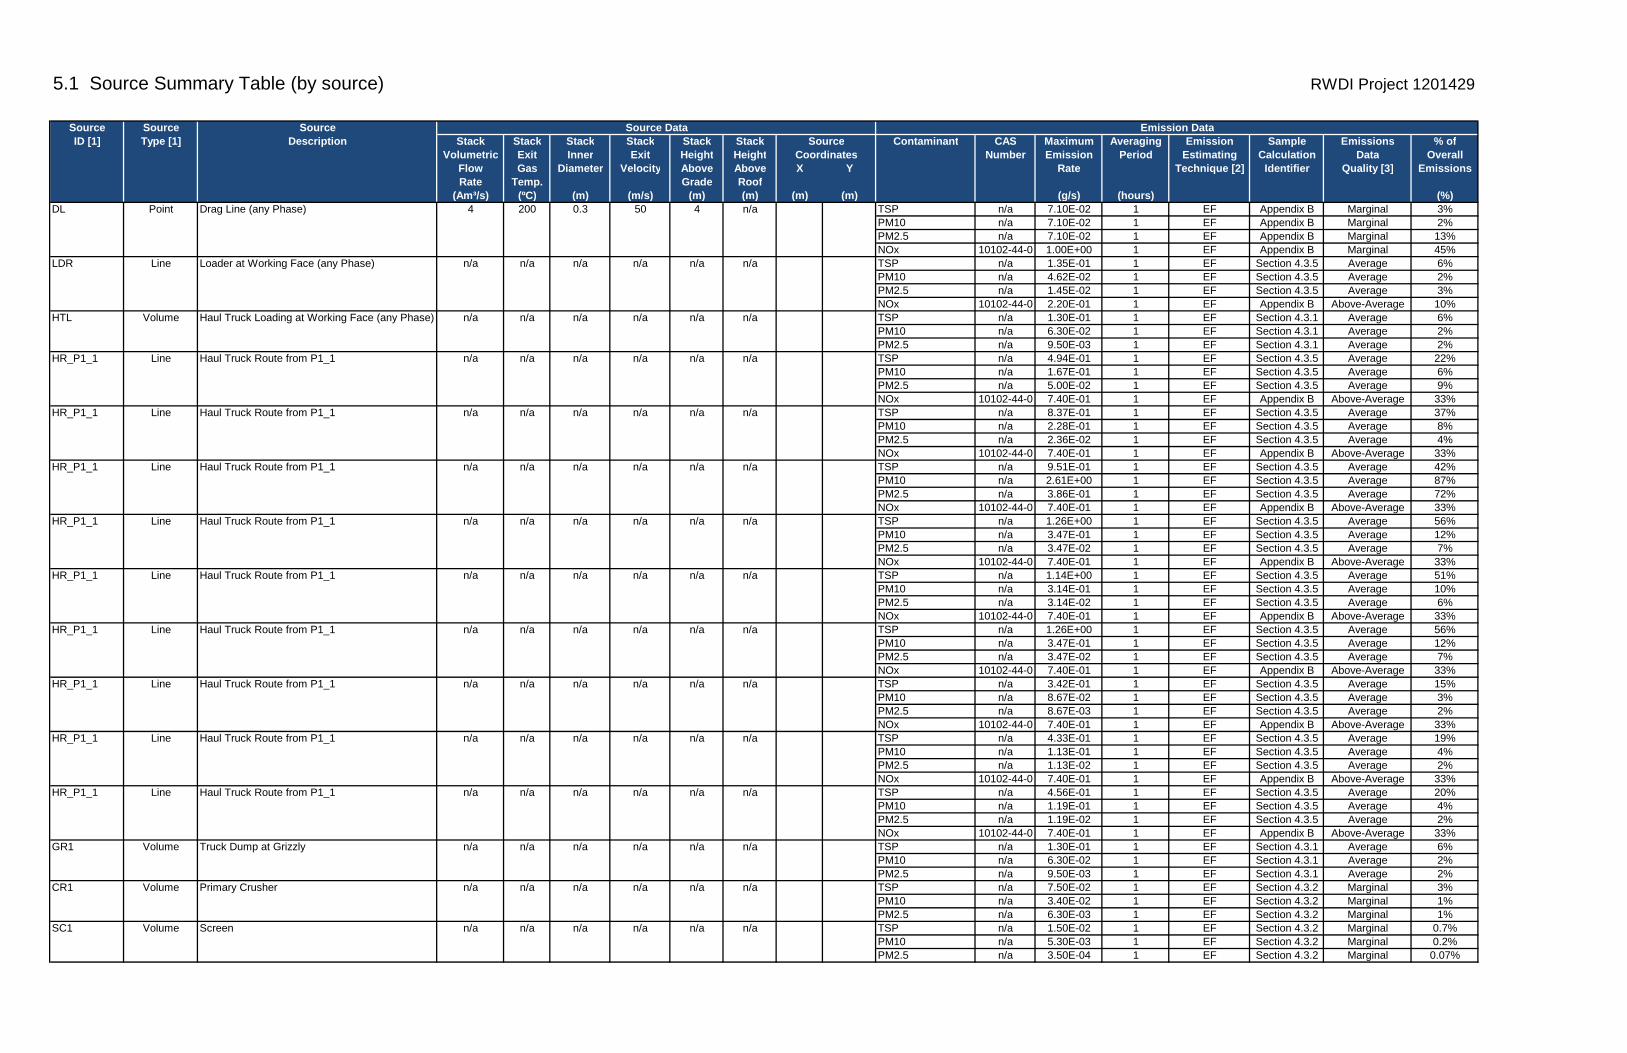
5.1 Source Summary Table (by source) RWDI Project 1201429
Source Source Source Source Data Emission DataID [1] Type [1] Description Stack Stack Stack Stack Stack Stack Source Contaminant CAS Maximum Averaging Emission Sample Emissions % of
Volumetric Exit Inner Exit Height Height Coordinates Number Emission Period Estimating Calculation Data OverallFlow Gas Diameter Velocity Above Above X Y Rate Technique [2] Identifier Quality [3] EmissionsRate Temp. Grade Roof
(Am³/s) (ºC) (m) (m/s) (m) (m) (m) (m) (g/s) (hours) (%)DL Point Drag Line (any Phase) 4 200 0.3 50 4 n/a TSP n/a 7.10E-02 1 EF Appendix B Marginal 3%
PM10 n/a 7.10E-02 1 EF Appendix B Marginal 2%PM2.5 n/a 7.10E-02 1 EF Appendix B Marginal 13%NOx 10102-44-0 1.00E+00 1 EF Appendix B Marginal 45%
LDR Line Loader at Working Face (any Phase) n/a n/a n/a n/a n/a n/a TSP n/a 1.35E-01 1 EF Section 4.3.5 Average 6%PM10 n/a 4.62E-02 1 EF Section 4.3.5 Average 2%PM2.5 n/a 1.45E-02 1 EF Section 4.3.5 Average 3%NOx 10102-44-0 2.20E-01 1 EF Appendix B Above-Average 10%
HTL Volume Haul Truck Loading at Working Face (any Phase) n/a n/a n/a n/a n/a n/a TSP n/a 1.30E-01 1 EF Section 4.3.1 Average 6%PM10 n/a 6.30E-02 1 EF Section 4.3.1 Average 2%PM2.5 n/a 9.50E-03 1 EF Section 4.3.1 Average 2%
HR_P1_1 Line Haul Truck Route from P1_1 n/a n/a n/a n/a n/a n/a TSP n/a 4.94E-01 1 EF Section 4.3.5 Average 22%PM10 n/a 1.67E-01 1 EF Section 4.3.5 Average 6%PM2.5 n/a 5.00E-02 1 EF Section 4.3.5 Average 9%NOx 10102-44-0 7.40E-01 1 EF Appendix B Above-Average 33%
HR_P1_1 Line Haul Truck Route from P1_1 n/a n/a n/a n/a n/a n/a TSP n/a 8.37E-01 1 EF Section 4.3.5 Average 37%PM10 n/a 2.28E-01 1 EF Section 4.3.5 Average 8%PM2.5 n/a 2.36E-02 1 EF Section 4.3.5 Average 4%NOx 10102-44-0 7.40E-01 1 EF Appendix B Above-Average 33%
HR_P1_1 Line Haul Truck Route from P1_1 n/a n/a n/a n/a n/a n/a TSP n/a 9.51E-01 1 EF Section 4.3.5 Average 42%PM10 n/a 2.61E+00 1 EF Section 4.3.5 Average 87%PM2.5 n/a 3.86E-01 1 EF Section 4.3.5 Average 72%NOx 10102-44-0 7.40E-01 1 EF Appendix B Above-Average 33%
HR_P1_1 Line Haul Truck Route from P1_1 n/a n/a n/a n/a n/a n/a TSP n/a 1.26E+00 1 EF Section 4.3.5 Average 56%PM10 n/a 3.47E-01 1 EF Section 4.3.5 Average 12%PM2.5 n/a 3.47E-02 1 EF Section 4.3.5 Average 7%NOx 10102-44-0 7.40E-01 1 EF Appendix B Above-Average 33%
HR_P1_1 Line Haul Truck Route from P1_1 n/a n/a n/a n/a n/a n/a TSP n/a 1.14E+00 1 EF Section 4.3.5 Average 51%PM10 n/a 3.14E-01 1 EF Section 4.3.5 Average 10%PM2.5 n/a 3.14E-02 1 EF Section 4.3.5 Average 6%NOx 10102-44-0 7.40E-01 1 EF Appendix B Above-Average 33%
HR_P1_1 Line Haul Truck Route from P1_1 n/a n/a n/a n/a n/a n/a TSP n/a 1.26E+00 1 EF Section 4.3.5 Average 56%PM10 n/a 3.47E-01 1 EF Section 4.3.5 Average 12%PM2.5 n/a 3.47E-02 1 EF Section 4.3.5 Average 7%NOx 10102-44-0 7.40E-01 1 EF Appendix B Above-Average 33%
HR_P1_1 Line Haul Truck Route from P1_1 n/a n/a n/a n/a n/a n/a TSP n/a 3.42E-01 1 EF Section 4.3.5 Average 15%PM10 n/a 8.67E-02 1 EF Section 4.3.5 Average 3%PM2.5 n/a 8.67E-03 1 EF Section 4.3.5 Average 2%NOx 10102-44-0 7.40E-01 1 EF Appendix B Above-Average 33%
HR_P1_1 Line Haul Truck Route from P1_1 n/a n/a n/a n/a n/a n/a TSP n/a 4.33E-01 1 EF Section 4.3.5 Average 19%PM10 n/a 1.13E-01 1 EF Section 4.3.5 Average 4%PM2.5 n/a 1.13E-02 1 EF Section 4.3.5 Average 2%NOx 10102-44-0 7.40E-01 1 EF Appendix B Above-Average 33%
HR_P1_1 Line Haul Truck Route from P1_1 n/a n/a n/a n/a n/a n/a TSP n/a 4.56E-01 1 EF Section 4.3.5 Average 20%PM10 n/a 1.19E-01 1 EF Section 4.3.5 Average 4%PM2.5 n/a 1.19E-02 1 EF Section 4.3.5 Average 2%NOx 10102-44-0 7.40E-01 1 EF Appendix B Above-Average 33%
GR1 Volume Truck Dump at Grizzly n/a n/a n/a n/a n/a n/a TSP n/a 1.30E-01 1 EF Section 4.3.1 Average 6%PM10 n/a 6.30E-02 1 EF Section 4.3.1 Average 2%PM2.5 n/a 9.50E-03 1 EF Section 4.3.1 Average 2%
CR1 Volume Primary Crusher n/a n/a n/a n/a n/a n/a TSP n/a 7.50E-02 1 EF Section 4.3.2 Marginal 3%PM10 n/a 3.40E-02 1 EF Section 4.3.2 Marginal 1%PM2.5 n/a 6.30E-03 1 EF Section 4.3.2 Marginal 1%
SC1 Volume Screen n/a n/a n/a n/a n/a n/a TSP n/a 1.50E-02 1 EF Section 4.3.2 Marginal 0.7%PM10 n/a 5.30E-03 1 EF Section 4.3.2 Marginal 0.2%PM2.5 n/a 3.50E-04 1 EF Section 4.3.2 Marginal 0.07%
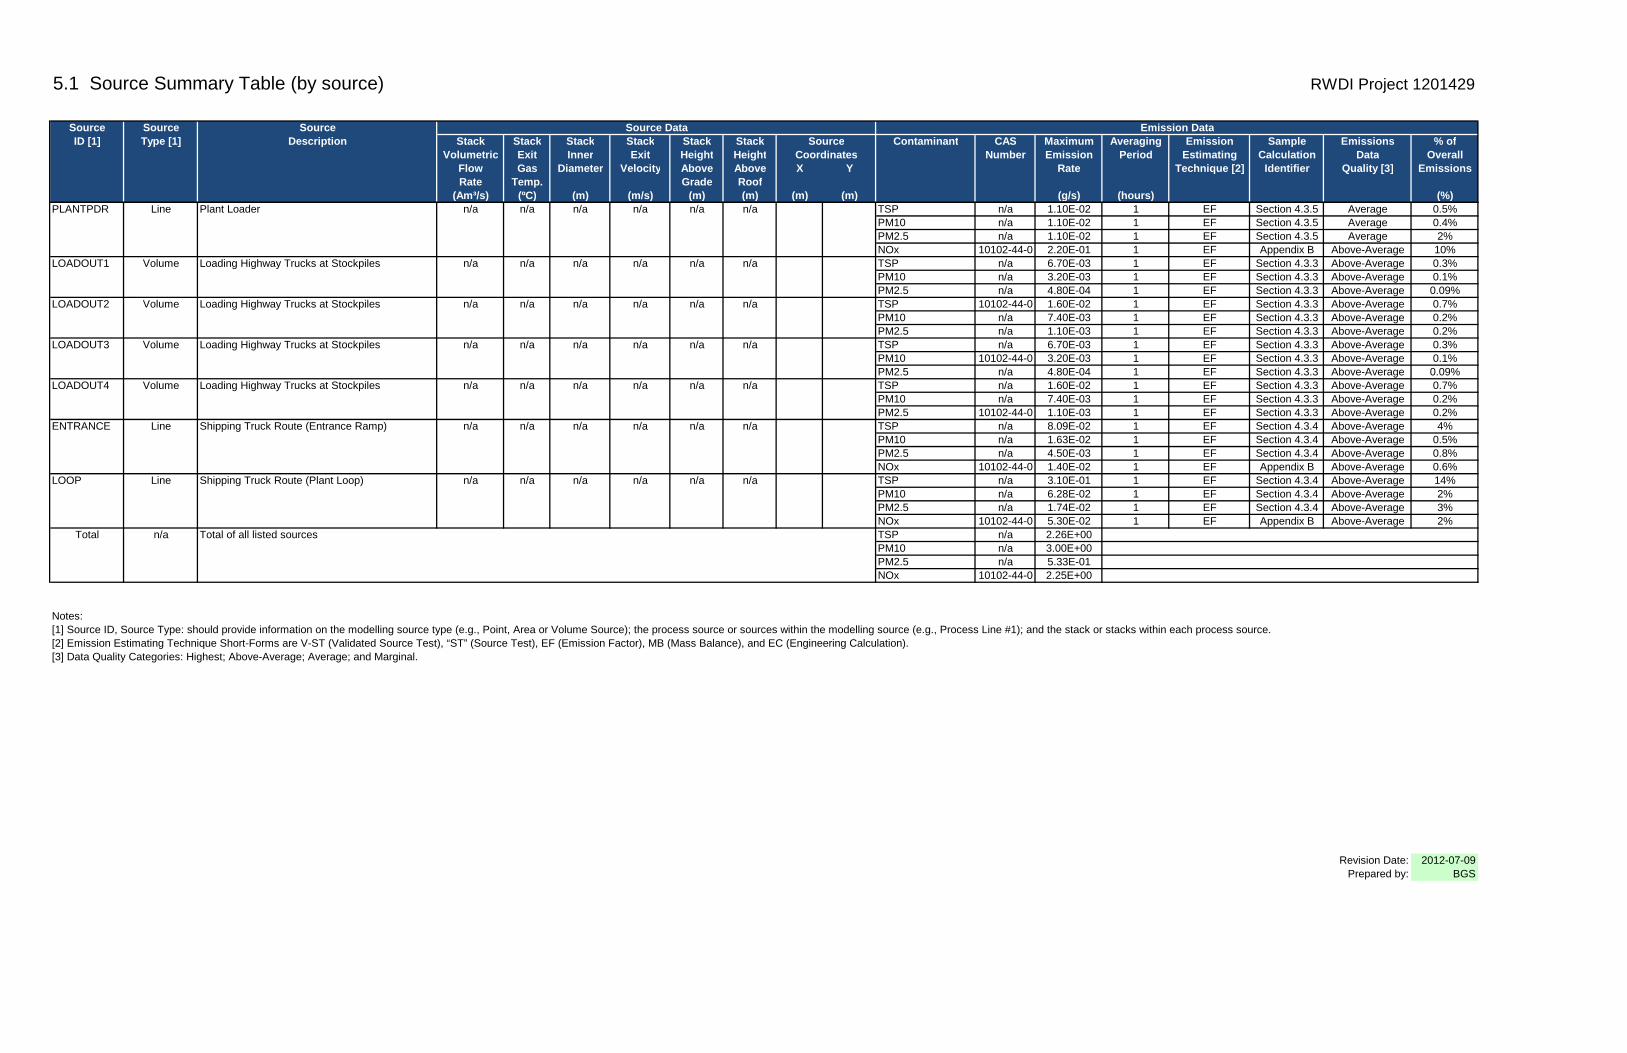
5.1 Source Summary Table (by source) RWDI Project 1201429
Source Source Source Source Data Emission DataID [1] Type [1] Description Stack Stack Stack Stack Stack Stack Source Contaminant CAS Maximum Averaging Emission Sample Emissions % of
Volumetric Exit Inner Exit Height Height Coordinates Number Emission Period Estimating Calculation Data OverallFlow Gas Diameter Velocity Above Above X Y Rate Technique [2] Identifier Quality [3] EmissionsRate Temp. Grade Roof
(Am³/s) (ºC) (m) (m/s) (m) (m) (m) (m) (g/s) (hours) (%)PLANTPDR Line Plant Loader n/a n/a n/a n/a n/a n/a TSP n/a 1.10E-02 1 EF Section 4.3.5 Average 0.5%
PM10 n/a 1.10E-02 1 EF Section 4.3.5 Average 0.4%PM2.5 n/a 1.10E-02 1 EF Section 4.3.5 Average 2%NOx 10102-44-0 2.20E-01 1 EF Appendix B Above-Average 10%
LOADOUT1 Volume Loading Highway Trucks at Stockpiles n/a n/a n/a n/a n/a n/a TSP n/a 6.70E-03 1 EF Section 4.3.3 Above-Average 0.3%PM10 n/a 3.20E-03 1 EF Section 4.3.3 Above-Average 0.1%PM2.5 n/a 4.80E-04 1 EF Section 4.3.3 Above-Average 0.09%
LOADOUT2 Volume Loading Highway Trucks at Stockpiles n/a n/a n/a n/a n/a n/a TSP 10102-44-0 1.60E-02 1 EF Section 4.3.3 Above-Average 0.7%PM10 n/a 7.40E-03 1 EF Section 4.3.3 Above-Average 0.2%PM2.5 n/a 1.10E-03 1 EF Section 4.3.3 Above-Average 0.2%
LOADOUT3 Volume Loading Highway Trucks at Stockpiles n/a n/a n/a n/a n/a n/a TSP n/a 6.70E-03 1 EF Section 4.3.3 Above-Average 0.3%PM10 10102-44-0 3.20E-03 1 EF Section 4.3.3 Above-Average 0.1%PM2.5 n/a 4.80E-04 1 EF Section 4.3.3 Above-Average 0.09%
LOADOUT4 Volume Loading Highway Trucks at Stockpiles n/a n/a n/a n/a n/a n/a TSP n/a 1.60E-02 1 EF Section 4.3.3 Above-Average 0.7%PM10 n/a 7.40E-03 1 EF Section 4.3.3 Above-Average 0.2%PM2.5 10102-44-0 1.10E-03 1 EF Section 4.3.3 Above-Average 0.2%
ENTRANCE Line Shipping Truck Route (Entrance Ramp) n/a n/a n/a n/a n/a n/a TSP n/a 8.09E-02 1 EF Section 4.3.4 Above-Average 4%PM10 n/a 1.63E-02 1 EF Section 4.3.4 Above-Average 0.5%PM2.5 n/a 4.50E-03 1 EF Section 4.3.4 Above-Average 0.8%NOx 10102-44-0 1.40E-02 1 EF Appendix B Above-Average 0.6%
LOOP Line Shipping Truck Route (Plant Loop) n/a n/a n/a n/a n/a n/a TSP n/a 3.10E-01 1 EF Section 4.3.4 Above-Average 14%PM10 n/a 6.28E-02 1 EF Section 4.3.4 Above-Average 2%PM2.5 n/a 1.74E-02 1 EF Section 4.3.4 Above-Average 3%NOx 10102-44-0 5.30E-02 1 EF Appendix B Above-Average 2%
Total n/a Total of all listed sources TSP n/a 2.26E+00PM10 n/a 3.00E+00PM2.5 n/a 5.33E-01NOx 10102-44-0 2.25E+00
Notes:[1] Source ID, Source Type: should provide information on the modelling source type (e.g., Point, Area or Volume Source); the process source or sources within the modelling source (e.g., Process Line #1); and the stack or stacks within each process source.[2] Emission Estimating Technique Short-Forms are V-ST (Validated Source Test), “ST” (Source Test), EF (Emission Factor), MB (Mass Balance), and EC (Engineering Calculation).[3] Data Quality Categories: Highest; Above-Average; Average; and Marginal.
Revision Date: 2012-07-09Prepared by: BGS
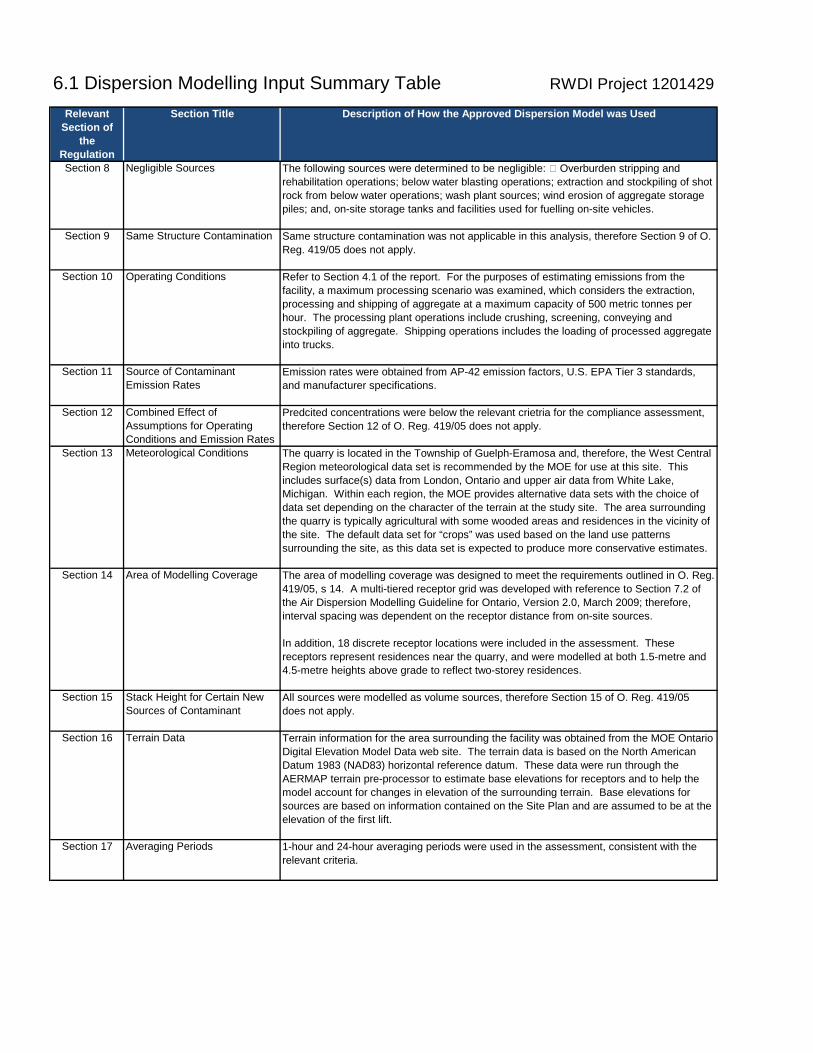
6.1 Dispersion Modelling Input Summary Table RWDI Project 1201429
Relevant Section Title Description of How the Approved Dispersion Model was UsedSection of
theRegulationSection 8 Negligible Sources
Section 9 Same Structure Contamination
Section 10 Operating Conditions
Section 11 Source of ContaminantEmission Rates
Section 12 Combined Effect ofAssumptions for OperatingConditions and Emission Rates
Section 13 Meteorological Conditions
Section 14 Area of Modelling Coverage
Section 15 Stack Height for Certain NewSources of Contaminant
Section 16 Terrain Data
Section 17 Averaging Periods
The area of modelling coverage was designed to meet the requirements outlined in O. Reg. 419/05, s 14. A multi-tiered receptor grid was developed with reference to Section 7.2 of the Air Dispersion Modelling Guideline for Ontario, Version 2.0, March 2009; therefore, interval spacing was dependent on the receptor distance from on-site sources.
In addition, 18 discrete receptor locations were included in the assessment. These receptors represent residences near the quarry, and were modelled at both 1.5-metre and 4.5-metre heights above grade to reflect two-storey residences.
All sources were modelled as volume sources, therefore Section 15 of O. Reg. 419/05 does not apply.
Terrain information for the area surrounding the facility was obtained from the MOE Ontario Digital Elevation Model Data web site. The terrain data is based on the North American Datum 1983 (NAD83) horizontal reference datum. These data were run through the AERMAP terrain pre-processor to estimate base elevations for receptors and to help the model account for changes in elevation of the surrounding terrain. Base elevations for sources are based on information contained on the Site Plan and are assumed to be at the elevation of the first lift.
1-hour and 24-hour averaging periods were used in the assessment, consistent with the relevant criteria.
The following sources were determined to be negligible: � Overburden stripping and rehabilitation operations; below water blasting operations; extraction and stockpiling of shot rock from below water operations; wash plant sources; wind erosion of aggregate storage piles; and, on-site storage tanks and facilities used for fuelling on-site vehicles.
Same structure contamination was not applicable in this analysis, therefore Section 9 of O. Reg. 419/05 does not apply.
Refer to Section 4.1 of the report. For the purposes of estimating emissions from the facility, a maximum processing scenario was examined, which considers the extraction, processing and shipping of aggregate at a maximum capacity of 500 metric tonnes per hour. The processing plant operations include crushing, screening, conveying and stockpiling of aggregate. Shipping operations includes the loading of processed aggregate into trucks.
Emission rates were obtained from AP-42 emission factors, U.S. EPA Tier 3 standards, and manufacturer specifications.
Predcited concentrations were below the relevant crietria for the compliance assessment, therefore Section 12 of O. Reg. 419/05 does not apply.
The quarry is located in the Township of Guelph-Eramosa and, therefore, the West Central Region meteorological data set is recommended by the MOE for use at this site. This includes surface(s) data from London, Ontario and upper air data from White Lake, Michigan. Within each region, the MOE provides alternative data sets with the choice of data set depending on the character of the terrain at the study site. The area surrounding the quarry is typically agricultural with some wooded areas and residences in the vicinity of the site. The default data set for “crops” was used based on the land use patterns surrounding the site, as this data set is expected to produce more conservative estimates.
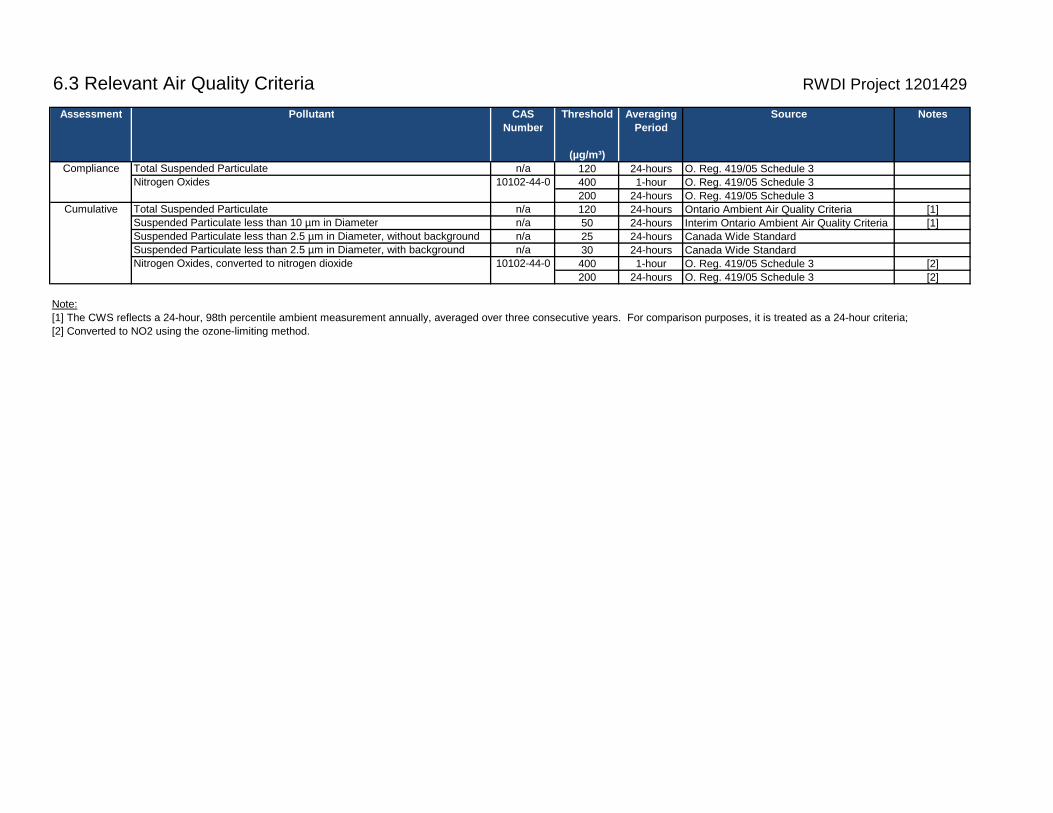
6.3 Relevant Air Quality Criteria RWDI Project 1201429
Assessment Pollutant CAS Threshold Averaging Source NotesNumber Period
(µg/m³)Compliance Total Suspended Particulate n/a 120 24-hours O. Reg. 419/05 Schedule 3
Nitrogen Oxides 10102-44-0 400 1-hour O. Reg. 419/05 Schedule 3200 24-hours O. Reg. 419/05 Schedule 3
Cumulative Total Suspended Particulate n/a 120 24-hours Ontario Ambient Air Quality Criteria [1]Suspended Particulate less than 10 µm in Diameter n/a 50 24-hours Interim Ontario Ambient Air Quality Criteria [1]Suspended Particulate less than 2.5 µm in Diameter, without background n/a 25 24-hours Canada Wide StandardSuspended Particulate less than 2.5 µm in Diameter, with background n/a 30 24-hours Canada Wide StandardNitrogen Oxides, converted to nitrogen dioxide 10102-44-0 400 1-hour O. Reg. 419/05 Schedule 3 [2]
200 24-hours O. Reg. 419/05 Schedule 3 [2]
Note:[1] The CWS reflects a 24-hour, 98th percentile ambient measurement annually, averaged over three consecutive years. For comparison purposes, it is treated as a 24-hour criteria;[2] Converted to NO2 using the ozone-limiting method.
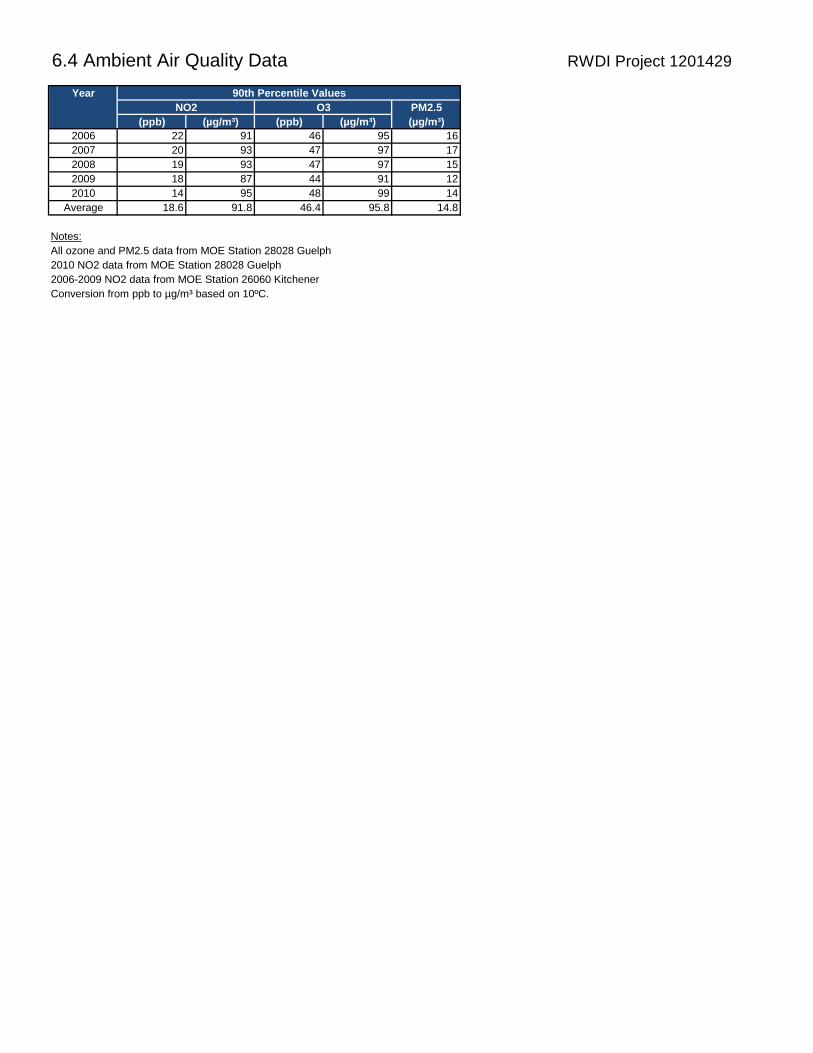
6.4 Ambient Air Quality Data RWDI Project 1201429
Year 90th Percentile ValuesNO2 O3 PM2.5
(ppb) (µg/m³) (ppb) (µg/m³) (µg/m³)2006 22 91 46 95 162007 20 93 47 97 172008 19 93 47 97 152009 18 87 44 91 122010 14 95 48 99 14
Average 18.6 91.8 46.4 95.8 14.8
Notes:All ozone and PM2.5 data from MOE Station 28028 Guelph2010 NO2 data from MOE Station 28028 Guelph2006-2009 NO2 data from MOE Station 26060 KitchenerConversion from ppb to µg/m³ based on 10ºC.
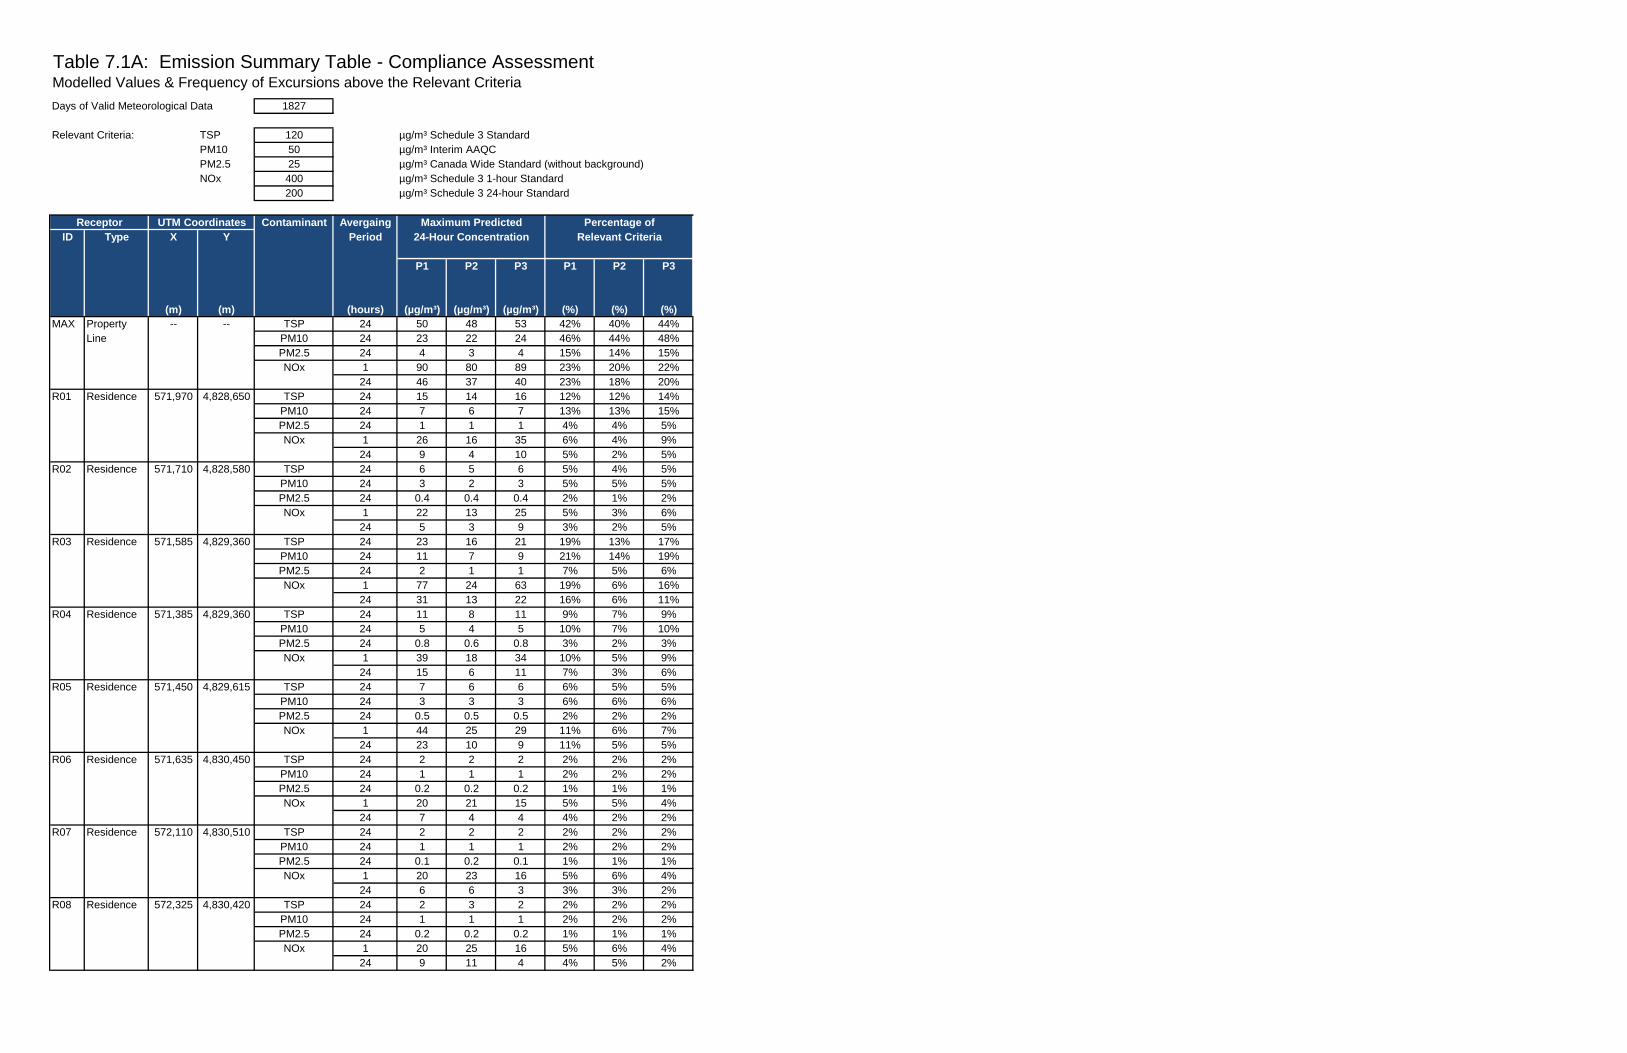
Table 7.1A: Emission Summary Table - Compliance AssessmentModelled Values & Frequency of Excursions above the Relevant Criteria
Days of Valid Meteorological Data 1827
Relevant Criteria: TSP 120 µg/m³ Schedule 3 StandardPM10 50 µg/m³ Interim AAQCPM2.5 25 µg/m³ Canada Wide Standard (without background)NOx 400 µg/m³ Schedule 3 1-hour Standard
200 µg/m³ Schedule 3 24-hour Standard
Receptor UTM Coordinates Contaminant Avergaing Maximum Predicted Percentage ofID Type X Y Period 24-Hour Concentration Relevant Criteria
P1 P2 P3 P1 P2 P3
(m) (m) (hours) (µg/m³) (µg/m³) (µg/m³) (%) (%) (%)MAX Property -- -- TSP 24 50 48 53 42% 40% 44%
Line -- -- PM10 24 23 22 24 46% 44% 48%-- -- PM2.5 24 4 3 4 15% 14% 15%
NOx 1 90 80 89 23% 20% 22%24 46 37 40 23% 18% 20%
R01 Residence 571,970 4,828,650 TSP 24 15 14 16 12% 12% 14%571,970 4,828,650 PM10 24 7 6 7 13% 13% 15%571,970 4,828,650 PM2.5 24 1 1 1 4% 4% 5%571,970 4,828,650 NOx 1 26 16 35 6% 4% 9%571,970 4,828,650 24 9 4 10 5% 2% 5%
R02 Residence 571,710 4,828,580 TSP 24 6 5 6 5% 4% 5%571,710 4,828,580 PM10 24 3 2 3 5% 5% 5%571,710 4,828,580 PM2.5 24 0.4 0.4 0.4 2% 1% 2%571,710 4,828,580 NOx 1 22 13 25 5% 3% 6%571,710 4,828,580 24 5 3 9 3% 2% 5%
R03 Residence 571,585 4,829,360 TSP 24 23 16 21 19% 13% 17%571,585 4,829,360 PM10 24 11 7 9 21% 14% 19%571,585 4,829,360 PM2.5 24 2 1 1 7% 5% 6%571,585 4,829,360 NOx 1 77 24 63 19% 6% 16%571,585 4,829,360 24 31 13 22 16% 6% 11%
R04 Residence 571,385 4,829,360 TSP 24 11 8 11 9% 7% 9%571,385 4,829,360 PM10 24 5 4 5 10% 7% 10%571,385 4,829,360 PM2.5 24 0.8 0.6 0.8 3% 2% 3%571,385 4,829,360 NOx 1 39 18 34 10% 5% 9%571,385 4,829,360 24 15 6 11 7% 3% 6%
R05 Residence 571,450 4,829,615 TSP 24 7 6 6 6% 5% 5%571,450 4,829,615 PM10 24 3 3 3 6% 6% 6%571,450 4,829,615 PM2.5 24 0.5 0.5 0.5 2% 2% 2%571,450 4,829,615 NOx 1 44 25 29 11% 6% 7%571,450 4,829,615 24 23 10 9 11% 5% 5%
R06 Residence 571,635 4,830,450 TSP 24 2 2 2 2% 2% 2%571,635 4,830,450 PM10 24 1 1 1 2% 2% 2%571,635 4,830,450 PM2.5 24 0.2 0.2 0.2 1% 1% 1%571,635 4,830,450 NOx 1 20 21 15 5% 5% 4%571,635 4,830,450 24 7 4 4 4% 2% 2%
R07 Residence 572,110 4,830,510 TSP 24 2 2 2 2% 2% 2%572,110 4,830,510 PM10 24 1 1 1 2% 2% 2%572,110 4,830,510 PM2.5 24 0.1 0.2 0.1 1% 1% 1%572,110 4,830,510 NOx 1 20 23 16 5% 6% 4%572,110 4,830,510 24 6 6 3 3% 3% 2%
R08 Residence 572,325 4,830,420 TSP 24 2 3 2 2% 2% 2%572,325 4,830,420 PM10 24 1 1 1 2% 2% 2%572,325 4,830,420 PM2.5 24 0.2 0.2 0.2 1% 1% 1%572,325 4,830,420 NOx 1 20 25 16 5% 6% 4%572,325 4,830,420 24 9 11 4 4% 5% 2%
Table 7.1A: Emission Summary Table - Compliance AssessmentModelled Values & Frequency of Excursions above the Relevant Criteria
Days of Valid Meteorological Data 1827
Relevant Criteria: TSP 120 µg/m³ Schedule 3 StandardPM10 50 µg/m³ Interim AAQCPM2.5 25 µg/m³ Canada Wide Standard (without background)NOx 400 µg/m³ Schedule 3 1-hour Standard
200 µg/m³ Schedule 3 24-hour Standard
Receptor UTM Coordinates Contaminant Avergaing Maximum Predicted Percentage ofID Type X Y Period 24-Hour Concentration Relevant Criteria
P1 P2 P3 P1 P2 P3
(m) (m) (hours) (µg/m³) (µg/m³) (µg/m³) (%) (%) (%)R09 Residence 572,420 4,830,320 TSP 24 3 3 3 2% 2% 2%
572,420 4,830,320 PM10 24 1 1 1 2% 3% 2%572,420 4,830,320 PM2.5 24 0.2 0.2 0.2 1% 1% 1%572,420 4,830,320 NOx 1 22 26 16 5% 7% 4%572,420 4,830,320 24 8 10 5 4% 5% 2%
R10 Residence 572,515 4,829,590 TSP 24 8 9 9 7% 7% 8%572,515 4,829,590 PM10 24 4 4 4 8% 8% 9%572,515 4,829,590 PM2.5 24 1 1 1 2% 3% 3%572,515 4,829,590 NOx 1 29 72 35 7% 18% 9%572,515 4,829,590 24 13 37 24 6% 18% 12%
R12 Residence 572,310 4,829,420 TSP 24 14 14 16 12% 12% 13%572,310 4,829,420 PM10 24 7 7 7 13% 13% 15%572,310 4,829,420 PM2.5 24 1 1 1 4% 4% 5%572,310 4,829,420 NOx 1 36 80 71 9% 20% 18%572,310 4,829,420 24 14 33 36 7% 16% 18%
R13 Residence 572,295 4,829,365 TSP 24 19 19 20 16% 16% 17%572,295 4,829,365 PM10 24 9 9 9 18% 18% 18%572,295 4,829,365 PM2.5 24 1 1 1 6% 6% 6%572,295 4,829,365 NOx 1 34 70 89 8% 18% 22%572,295 4,829,365 24 16 26 40 8% 13% 20%
R14 Residence 572,510 4,829,410 TSP 24 10 10 11 9% 8% 10%572,510 4,829,410 PM10 24 5 4 5 9% 9% 11%572,510 4,829,410 PM2.5 24 1 1 1 3% 3% 3%572,510 4,829,410 NOx 1 22 46 35 6% 11% 9%572,510 4,829,410 24 10 18 15 5% 9% 7%
R15 Residence 572,245 4,828,855 TSP 24 26 25 27 22% 21% 22%572,245 4,828,855 PM10 24 12 11 12 24% 23% 24%572,245 4,828,855 PM2.5 24 2 2 2 8% 7% 8%572,245 4,828,855 NOx 1 25 18 37 6% 5% 9%572,245 4,828,855 24 9 6 14 5% 3% 7%
R16 Residence 572,195 4,829,050 TSP 24 50 48 53 42% 40% 44%572,195 4,829,050 PM10 24 23 22 24 46% 44% 48%572,195 4,829,050 PM2.5 24 4 3 4 15% 14% 15%572,195 4,829,050 NOx 1 36 25 58 9% 6% 14%572,195 4,829,050 24 13 7 26 6% 3% 13%
R17 Residence 572,430 4,828,585 TSP 24 10 9 10 8% 8% 8%572,430 4,828,585 PM10 24 5 4 5 9% 9% 9%572,430 4,828,585 PM2.5 24 1 1 1 3% 3% 3%572,430 4,828,585 NOx 1 14 14 18 4% 3% 4%572,430 4,828,585 24 6 4 8 3% 2% 4%
R18 Residence 572,125 4,828,655 TSP 24 27 26 27 22% 22% 22%572,125 4,828,655 PM10 24 12 12 12 24% 24% 24%572,125 4,828,655 PM2.5 24 2 2 2 8% 8% 8%572,125 4,828,655 NOx 1 23 17 33 6% 4% 8%572,125 4,828,655 24 8 4 13 4% 2% 7%
Table 7.1A: Emission Summary Table - Compliance AssessmentModelled Values & Frequency of Excursions above the Relevant Criteria
Days of Valid Meteorological Data 1827
Relevant Criteria: TSP 120 µg/m³ Schedule 3 StandardPM10 50 µg/m³ Interim AAQCPM2.5 25 µg/m³ Canada Wide Standard (without background)NOx 400 µg/m³ Schedule 3 1-hour Standard
200 µg/m³ Schedule 3 24-hour Standard
Receptor UTM Coordinates Contaminant Avergaing Maximum Predicted Percentage ofID Type X Y Period 24-Hour Concentration Relevant Criteria
P1 P2 P3 P1 P2 P3
(m) (m) (hours) (µg/m³) (µg/m³) (µg/m³) (%) (%) (%)R19 Residence 571,645 4,829,520 TSP 24 12 9 8 10% 7% 7%
571,645 4,829,520 PM10 24 5 4 4 11% 8% 7%571,645 4,829,520 PM2.5 24 1 1 1 3% 3% 2%571,645 4,829,520 NOx 1 90 31 50 23% 8% 12%571,645 4,829,520 24 46 15 14 23% 7% 7%
Notes:Shaded values in bold indicate excursions above the relevant crtieria
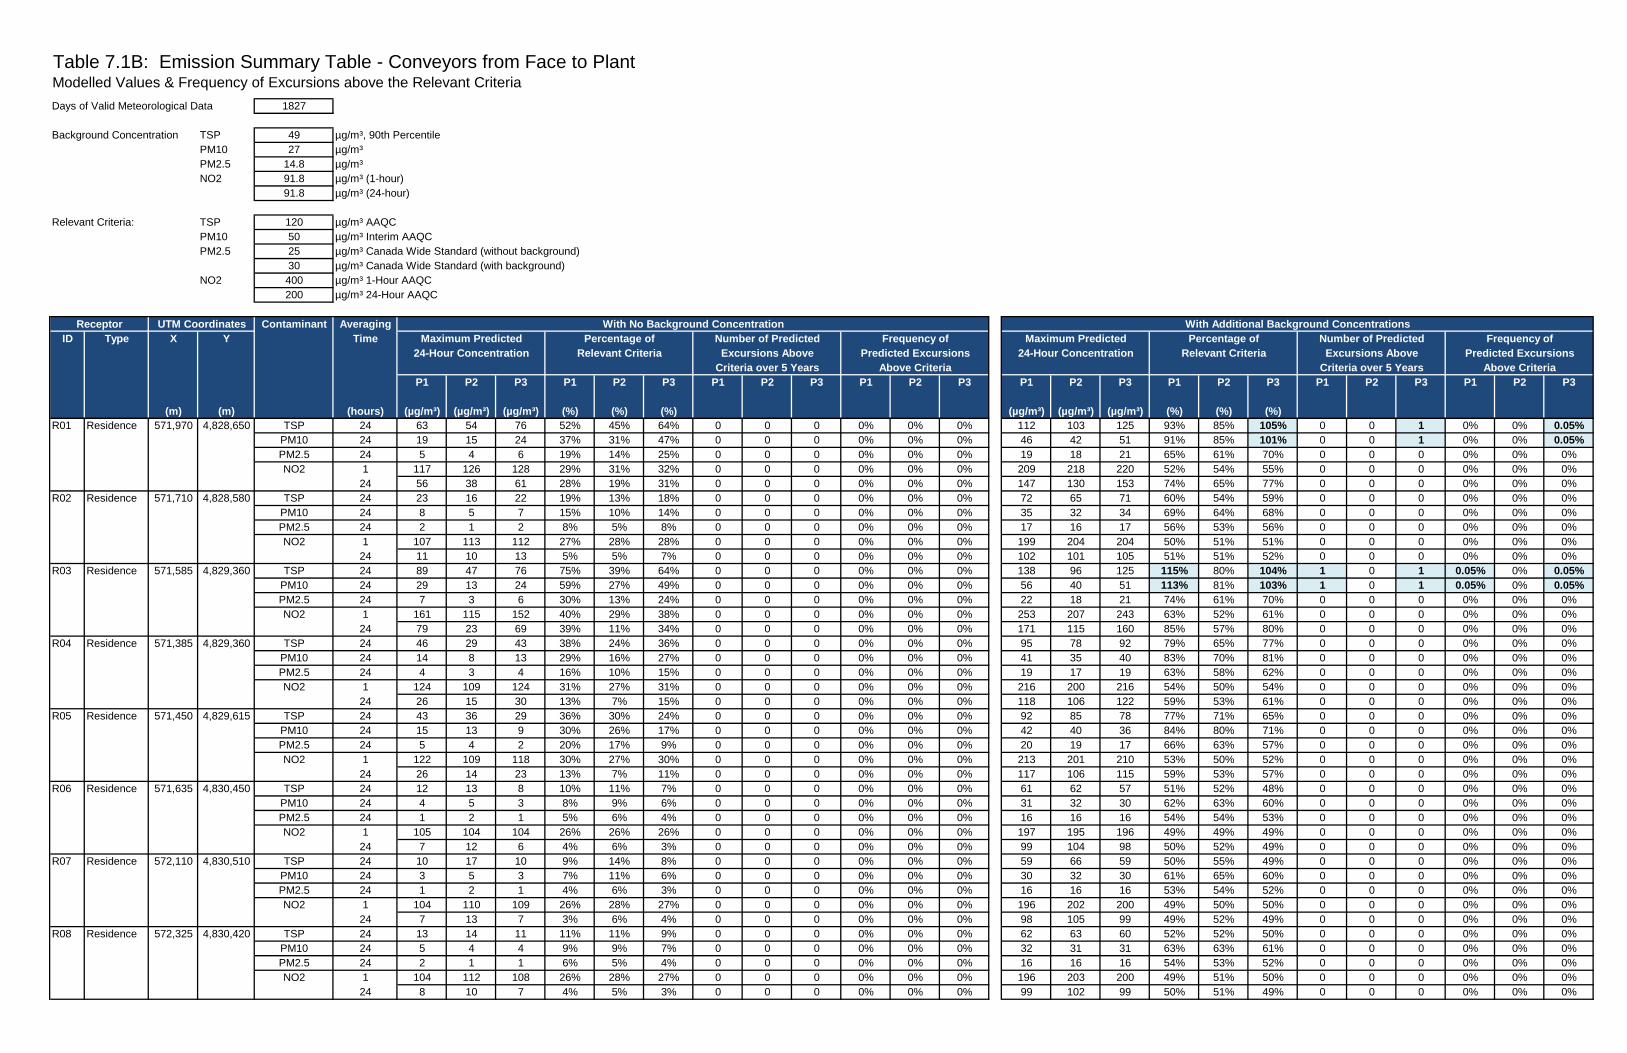
Table 7.1B: Emission Summary Table - Conveyors from Face to PlantModelled Values & Frequency of Excursions above the Relevant Criteria
Days of Valid Meteorological Data 1827
Background Concentration TSP 49 µg/m³, 90th Percentile PM10 27 µg/m³PM2.5 14.8 µg/m³NO2 91.8 µg/m³ (1-hour)
91.8 µg/m³ (24-hour)
Relevant Criteria: TSP 120 µg/m³ AAQCPM10 50 µg/m³ Interim AAQCPM2.5 25 µg/m³ Canada Wide Standard (without background)
30 µg/m³ Canada Wide Standard (with background)NO2 400 µg/m³ 1-Hour AAQC
200 µg/m³ 24-Hour AAQC
Receptor UTM Coordinates Contaminant Averaging With No Background Concentration With Additional Background ConcentrationsID Type X Y Time Maximum Predicted Percentage of Number of Predicted Frequency of Maximum Predicted Percentage of Number of Predicted Frequency of
24-Hour Concentration Relevant Criteria Excursions Above Predicted Excursions 24-Hour Concentration Relevant Criteria Excursions Above Predicted ExcursionsCriteria over 5 Years Above Criteria Criteria over 5 Years Above Criteria
P1 P2 P3 P1 P2 P3 P1 P2 P3 P1 P2 P3 P1 P2 P3 P1 P2 P3 P1 P2 P3 P1 P2 P3
(m) (m) (hours) (µg/m³) (µg/m³) (µg/m³) (%) (%) (%) (µg/m³) (µg/m³) (µg/m³) (%) (%) (%)R01 Residence 571,970 4,828,650 TSP 24 63 54 76 52% 45% 64% 0 0 0 0% 0% 0% 112 103 125 93% 85% 105% 0 0 1 0% 0% 0.05%
571,970 4,828,650 PM10 24 19 15 24 37% 31% 47% 0 0 0 0% 0% 0% 46 42 51 91% 85% 101% 0 0 1 0% 0% 0.05%571,970 4,828,650 PM2.5 24 5 4 6 19% 14% 25% 0 0 0 0% 0% 0% 19 18 21 65% 61% 70% 0 0 0 0% 0% 0%571,970 4,828,650 NO2 1 117 126 128 29% 31% 32% 0 0 0 0% 0% 0% 209 218 220 52% 54% 55% 0 0 0 0% 0% 0%571,970 4,828,650 24 56 38 61 28% 19% 31% 0 0 0 0% 0% 0% 147 130 153 74% 65% 77% 0 0 0 0% 0% 0%
R02 Residence 571,710 4,828,580 TSP 24 23 16 22 19% 13% 18% 0 0 0 0% 0% 0% 72 65 71 60% 54% 59% 0 0 0 0% 0% 0%571,710 4,828,580 PM10 24 8 5 7 15% 10% 14% 0 0 0 0% 0% 0% 35 32 34 69% 64% 68% 0 0 0 0% 0% 0%571,710 4,828,580 PM2.5 24 2 1 2 8% 5% 8% 0 0 0 0% 0% 0% 17 16 17 56% 53% 56% 0 0 0 0% 0% 0%571,710 4,828,580 NO2 1 107 113 112 27% 28% 28% 0 0 0 0% 0% 0% 199 204 204 50% 51% 51% 0 0 0 0% 0% 0%571,710 4,828,580 24 11 10 13 5% 5% 7% 0 0 0 0% 0% 0% 102 101 105 51% 51% 52% 0 0 0 0% 0% 0%
R03 Residence 571,585 4,829,360 TSP 24 89 47 76 75% 39% 64% 0 0 0 0% 0% 0% 138 96 125 115% 80% 104% 1 0 1 0.05% 0% 0.05%571,585 4,829,360 PM10 24 29 13 24 59% 27% 49% 0 0 0 0% 0% 0% 56 40 51 113% 81% 103% 1 0 1 0.05% 0% 0.05%571,585 4,829,360 PM2.5 24 7 3 6 30% 13% 24% 0 0 0 0% 0% 0% 22 18 21 74% 61% 70% 0 0 0 0% 0% 0%571,585 4,829,360 NO2 1 161 115 152 40% 29% 38% 0 0 0 0% 0% 0% 253 207 243 63% 52% 61% 0 0 0 0% 0% 0%571,585 4,829,360 24 79 23 69 39% 11% 34% 0 0 0 0% 0% 0% 171 115 160 85% 57% 80% 0 0 0 0% 0% 0%
R04 Residence 571,385 4,829,360 TSP 24 46 29 43 38% 24% 36% 0 0 0 0% 0% 0% 95 78 92 79% 65% 77% 0 0 0 0% 0% 0%571,385 4,829,360 PM10 24 14 8 13 29% 16% 27% 0 0 0 0% 0% 0% 41 35 40 83% 70% 81% 0 0 0 0% 0% 0%571,385 4,829,360 PM2.5 24 4 3 4 16% 10% 15% 0 0 0 0% 0% 0% 19 17 19 63% 58% 62% 0 0 0 0% 0% 0%571,385 4,829,360 NO2 1 124 109 124 31% 27% 31% 0 0 0 0% 0% 0% 216 200 216 54% 50% 54% 0 0 0 0% 0% 0%571,385 4,829,360 24 26 15 30 13% 7% 15% 0 0 0 0% 0% 0% 118 106 122 59% 53% 61% 0 0 0 0% 0% 0%
R05 Residence 571,450 4,829,615 TSP 24 43 36 29 36% 30% 24% 0 0 0 0% 0% 0% 92 85 78 77% 71% 65% 0 0 0 0% 0% 0%571,450 4,829,615 PM10 24 15 13 9 30% 26% 17% 0 0 0 0% 0% 0% 42 40 36 84% 80% 71% 0 0 0 0% 0% 0%571,450 4,829,615 PM2.5 24 5 4 2 20% 17% 9% 0 0 0 0% 0% 0% 20 19 17 66% 63% 57% 0 0 0 0% 0% 0%571,450 4,829,615 NO2 1 122 109 118 30% 27% 30% 0 0 0 0% 0% 0% 213 201 210 53% 50% 52% 0 0 0 0% 0% 0%571,450 4,829,615 24 26 14 23 13% 7% 11% 0 0 0 0% 0% 0% 117 106 115 59% 53% 57% 0 0 0 0% 0% 0%
R06 Residence 571,635 4,830,450 TSP 24 12 13 8 10% 11% 7% 0 0 0 0% 0% 0% 61 62 57 51% 52% 48% 0 0 0 0% 0% 0%571,635 4,830,450 PM10 24 4 5 3 8% 9% 6% 0 0 0 0% 0% 0% 31 32 30 62% 63% 60% 0 0 0 0% 0% 0%571,635 4,830,450 PM2.5 24 1 2 1 5% 6% 4% 0 0 0 0% 0% 0% 16 16 16 54% 54% 53% 0 0 0 0% 0% 0%571,635 4,830,450 NO2 1 105 104 104 26% 26% 26% 0 0 0 0% 0% 0% 197 195 196 49% 49% 49% 0 0 0 0% 0% 0%571,635 4,830,450 24 7 12 6 4% 6% 3% 0 0 0 0% 0% 0% 99 104 98 50% 52% 49% 0 0 0 0% 0% 0%
R07 Residence 572,110 4,830,510 TSP 24 10 17 10 9% 14% 8% 0 0 0 0% 0% 0% 59 66 59 50% 55% 49% 0 0 0 0% 0% 0%572,110 4,830,510 PM10 24 3 5 3 7% 11% 6% 0 0 0 0% 0% 0% 30 32 30 61% 65% 60% 0 0 0 0% 0% 0%572,110 4,830,510 PM2.5 24 1 2 1 4% 6% 3% 0 0 0 0% 0% 0% 16 16 16 53% 54% 52% 0 0 0 0% 0% 0%572,110 4,830,510 NO2 1 104 110 109 26% 28% 27% 0 0 0 0% 0% 0% 196 202 200 49% 50% 50% 0 0 0 0% 0% 0%572,110 4,830,510 24 7 13 7 3% 6% 4% 0 0 0 0% 0% 0% 98 105 99 49% 52% 49% 0 0 0 0% 0% 0%
R08 Residence 572,325 4,830,420 TSP 24 13 14 11 11% 11% 9% 0 0 0 0% 0% 0% 62 63 60 52% 52% 50% 0 0 0 0% 0% 0%572,325 4,830,420 PM10 24 5 4 4 9% 9% 7% 0 0 0 0% 0% 0% 32 31 31 63% 63% 61% 0 0 0 0% 0% 0%572,325 4,830,420 PM2.5 24 2 1 1 6% 5% 4% 0 0 0 0% 0% 0% 16 16 16 54% 53% 52% 0 0 0 0% 0% 0%572,325 4,830,420 NO2 1 104 112 108 26% 28% 27% 0 0 0 0% 0% 0% 196 203 200 49% 51% 50% 0 0 0 0% 0% 0%572,325 4,830,420 24 8 10 7 4% 5% 3% 0 0 0 0% 0% 0% 99 102 99 50% 51% 49% 0 0 0 0% 0% 0%
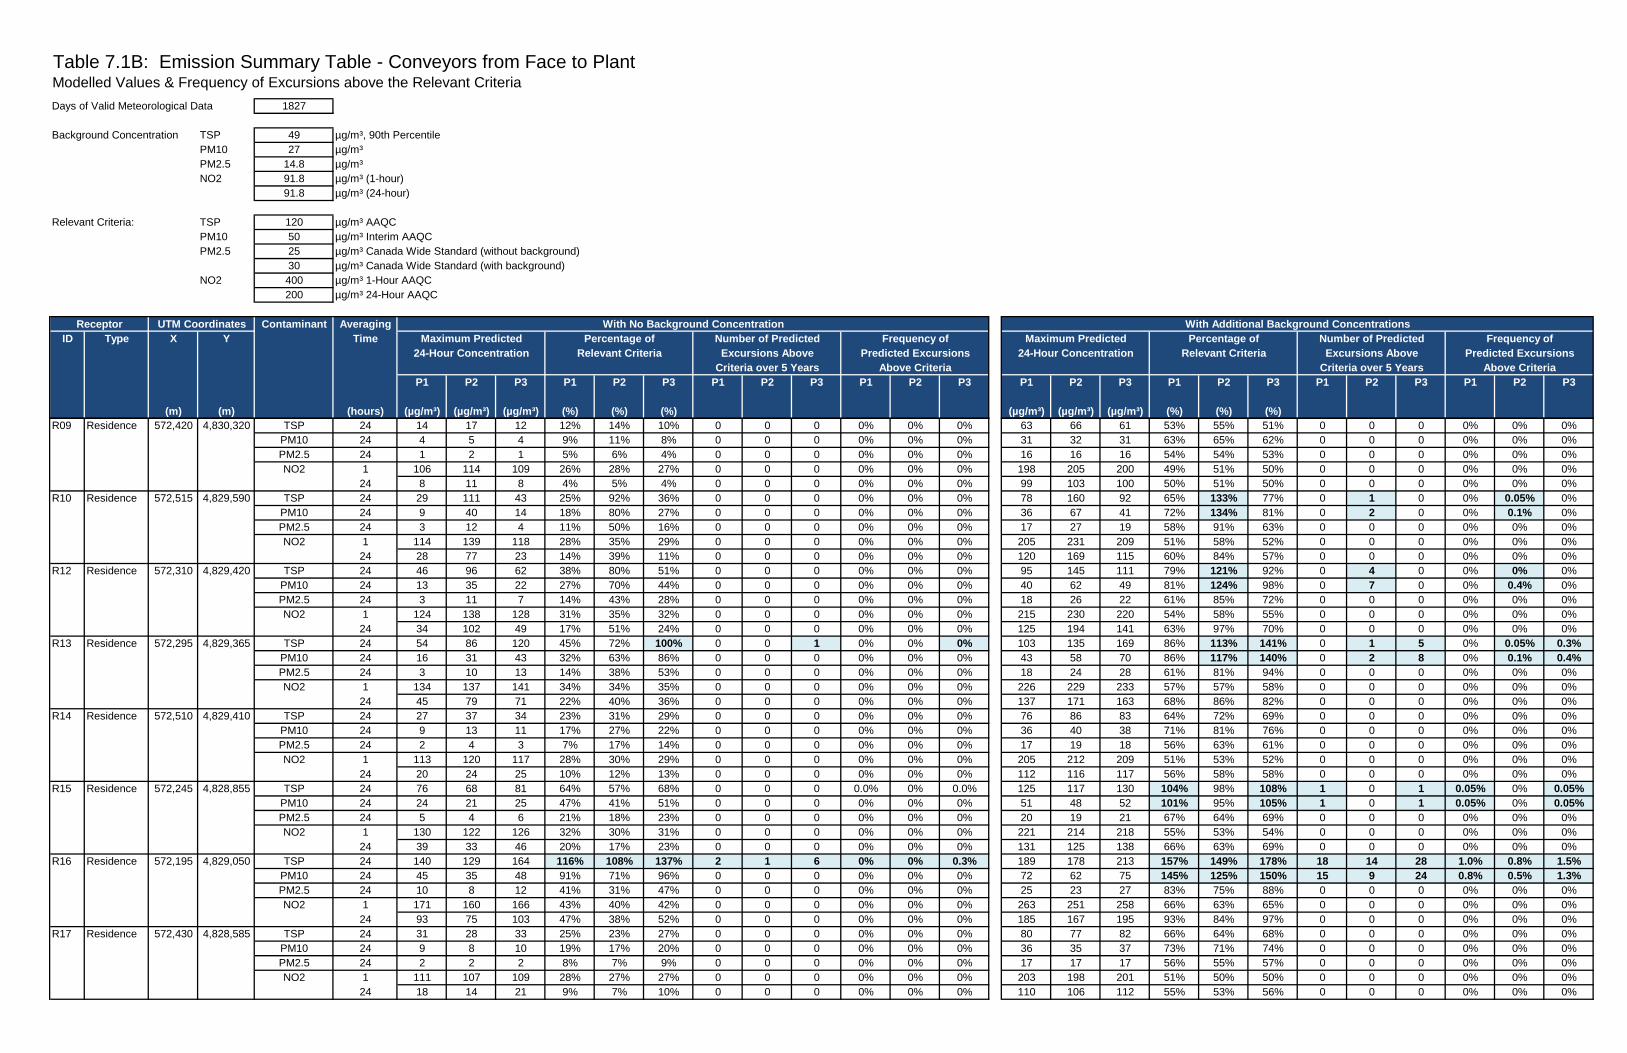
Table 7.1B: Emission Summary Table - Conveyors from Face to PlantModelled Values & Frequency of Excursions above the Relevant Criteria
Days of Valid Meteorological Data 1827
Background Concentration TSP 49 µg/m³, 90th Percentile PM10 27 µg/m³PM2.5 14.8 µg/m³NO2 91.8 µg/m³ (1-hour)
91.8 µg/m³ (24-hour)
Relevant Criteria: TSP 120 µg/m³ AAQCPM10 50 µg/m³ Interim AAQCPM2.5 25 µg/m³ Canada Wide Standard (without background)
30 µg/m³ Canada Wide Standard (with background)NO2 400 µg/m³ 1-Hour AAQC
200 µg/m³ 24-Hour AAQC
Receptor UTM Coordinates Contaminant Averaging With No Background Concentration With Additional Background ConcentrationsID Type X Y Time Maximum Predicted Percentage of Number of Predicted Frequency of Maximum Predicted Percentage of Number of Predicted Frequency of
24-Hour Concentration Relevant Criteria Excursions Above Predicted Excursions 24-Hour Concentration Relevant Criteria Excursions Above Predicted ExcursionsCriteria over 5 Years Above Criteria Criteria over 5 Years Above Criteria
P1 P2 P3 P1 P2 P3 P1 P2 P3 P1 P2 P3 P1 P2 P3 P1 P2 P3 P1 P2 P3 P1 P2 P3
(m) (m) (hours) (µg/m³) (µg/m³) (µg/m³) (%) (%) (%) (µg/m³) (µg/m³) (µg/m³) (%) (%) (%)R09 Residence 572,420 4,830,320 TSP 24 14 17 12 12% 14% 10% 0 0 0 0% 0% 0% 63 66 61 53% 55% 51% 0 0 0 0% 0% 0%
572,420 4,830,320 PM10 24 4 5 4 9% 11% 8% 0 0 0 0% 0% 0% 31 32 31 63% 65% 62% 0 0 0 0% 0% 0%572,420 4,830,320 PM2.5 24 1 2 1 5% 6% 4% 0 0 0 0% 0% 0% 16 16 16 54% 54% 53% 0 0 0 0% 0% 0%572,420 4,830,320 NO2 1 106 114 109 26% 28% 27% 0 0 0 0% 0% 0% 198 205 200 49% 51% 50% 0 0 0 0% 0% 0%572,420 4,830,320 24 8 11 8 4% 5% 4% 0 0 0 0% 0% 0% 99 103 100 50% 51% 50% 0 0 0 0% 0% 0%
R10 Residence 572,515 4,829,590 TSP 24 29 111 43 25% 92% 36% 0 0 0 0% 0% 0% 78 160 92 65% 133% 77% 0 1 0 0% 0.05% 0%572,515 4,829,590 PM10 24 9 40 14 18% 80% 27% 0 0 0 0% 0% 0% 36 67 41 72% 134% 81% 0 2 0 0% 0.1% 0%572,515 4,829,590 PM2.5 24 3 12 4 11% 50% 16% 0 0 0 0% 0% 0% 17 27 19 58% 91% 63% 0 0 0 0% 0% 0%572,515 4,829,590 NO2 1 114 139 118 28% 35% 29% 0 0 0 0% 0% 0% 205 231 209 51% 58% 52% 0 0 0 0% 0% 0%572,515 4,829,590 24 28 77 23 14% 39% 11% 0 0 0 0% 0% 0% 120 169 115 60% 84% 57% 0 0 0 0% 0% 0%
R12 Residence 572,310 4,829,420 TSP 24 46 96 62 38% 80% 51% 0 0 0 0% 0% 0% 95 145 111 79% 121% 92% 0 4 0 0% 0% 0%572,310 4,829,420 PM10 24 13 35 22 27% 70% 44% 0 0 0 0% 0% 0% 40 62 49 81% 124% 98% 0 7 0 0% 0.4% 0%572,310 4,829,420 PM2.5 24 3 11 7 14% 43% 28% 0 0 0 0% 0% 0% 18 26 22 61% 85% 72% 0 0 0 0% 0% 0%572,310 4,829,420 NO2 1 124 138 128 31% 35% 32% 0 0 0 0% 0% 0% 215 230 220 54% 58% 55% 0 0 0 0% 0% 0%572,310 4,829,420 24 34 102 49 17% 51% 24% 0 0 0 0% 0% 0% 125 194 141 63% 97% 70% 0 0 0 0% 0% 0%
R13 Residence 572,295 4,829,365 TSP 24 54 86 120 45% 72% 100% 0 0 1 0% 0% 0% 103 135 169 86% 113% 141% 0 1 5 0% 0.05% 0.3%572,295 4,829,365 PM10 24 16 31 43 32% 63% 86% 0 0 0 0% 0% 0% 43 58 70 86% 117% 140% 0 2 8 0% 0.1% 0.4%572,295 4,829,365 PM2.5 24 3 10 13 14% 38% 53% 0 0 0 0% 0% 0% 18 24 28 61% 81% 94% 0 0 0 0% 0% 0%572,295 4,829,365 NO2 1 134 137 141 34% 34% 35% 0 0 0 0% 0% 0% 226 229 233 57% 57% 58% 0 0 0 0% 0% 0%572,295 4,829,365 24 45 79 71 22% 40% 36% 0 0 0 0% 0% 0% 137 171 163 68% 86% 82% 0 0 0 0% 0% 0%
R14 Residence 572,510 4,829,410 TSP 24 27 37 34 23% 31% 29% 0 0 0 0% 0% 0% 76 86 83 64% 72% 69% 0 0 0 0% 0% 0%572,510 4,829,410 PM10 24 9 13 11 17% 27% 22% 0 0 0 0% 0% 0% 36 40 38 71% 81% 76% 0 0 0 0% 0% 0%572,510 4,829,410 PM2.5 24 2 4 3 7% 17% 14% 0 0 0 0% 0% 0% 17 19 18 56% 63% 61% 0 0 0 0% 0% 0%572,510 4,829,410 NO2 1 113 120 117 28% 30% 29% 0 0 0 0% 0% 0% 205 212 209 51% 53% 52% 0 0 0 0% 0% 0%572,510 4,829,410 24 20 24 25 10% 12% 13% 0 0 0 0% 0% 0% 112 116 117 56% 58% 58% 0 0 0 0% 0% 0%
R15 Residence 572,245 4,828,855 TSP 24 76 68 81 64% 57% 68% 0 0 0 0.0% 0% 0.0% 125 117 130 104% 98% 108% 1 0 1 0.05% 0% 0.05%572,245 4,828,855 PM10 24 24 21 25 47% 41% 51% 0 0 0 0% 0% 0% 51 48 52 101% 95% 105% 1 0 1 0.05% 0% 0.05%572,245 4,828,855 PM2.5 24 5 4 6 21% 18% 23% 0 0 0 0% 0% 0% 20 19 21 67% 64% 69% 0 0 0 0% 0% 0%572,245 4,828,855 NO2 1 130 122 126 32% 30% 31% 0 0 0 0% 0% 0% 221 214 218 55% 53% 54% 0 0 0 0% 0% 0%572,245 4,828,855 24 39 33 46 20% 17% 23% 0 0 0 0% 0% 0% 131 125 138 66% 63% 69% 0 0 0 0% 0% 0%
R16 Residence 572,195 4,829,050 TSP 24 140 129 164 116% 108% 137% 2 1 6 0% 0% 0.3% 189 178 213 157% 149% 178% 18 14 28 1.0% 0.8% 1.5%572,195 4,829,050 PM10 24 45 35 48 91% 71% 96% 0 0 0 0% 0% 0% 72 62 75 145% 125% 150% 15 9 24 0.8% 0.5% 1.3%572,195 4,829,050 PM2.5 24 10 8 12 41% 31% 47% 0 0 0 0% 0% 0% 25 23 27 83% 75% 88% 0 0 0 0% 0% 0%572,195 4,829,050 NO2 1 171 160 166 43% 40% 42% 0 0 0 0% 0% 0% 263 251 258 66% 63% 65% 0 0 0 0% 0% 0%572,195 4,829,050 24 93 75 103 47% 38% 52% 0 0 0 0% 0% 0% 185 167 195 93% 84% 97% 0 0 0 0% 0% 0%
R17 Residence 572,430 4,828,585 TSP 24 31 28 33 25% 23% 27% 0 0 0 0% 0% 0% 80 77 82 66% 64% 68% 0 0 0 0% 0% 0%572,430 4,828,585 PM10 24 9 8 10 19% 17% 20% 0 0 0 0% 0% 0% 36 35 37 73% 71% 74% 0 0 0 0% 0% 0%572,430 4,828,585 PM2.5 24 2 2 2 8% 7% 9% 0 0 0 0% 0% 0% 17 17 17 56% 55% 57% 0 0 0 0% 0% 0%572,430 4,828,585 NO2 1 111 107 109 28% 27% 27% 0 0 0 0% 0% 0% 203 198 201 51% 50% 50% 0 0 0 0% 0% 0%572,430 4,828,585 24 18 14 21 9% 7% 10% 0 0 0 0% 0% 0% 110 106 112 55% 53% 56% 0 0 0 0% 0% 0%

Table 7.1B: Emission Summary Table - Conveyors from Face to PlantModelled Values & Frequency of Excursions above the Relevant Criteria
Days of Valid Meteorological Data 1827
Background Concentration TSP 49 µg/m³, 90th Percentile PM10 27 µg/m³PM2.5 14.8 µg/m³NO2 91.8 µg/m³ (1-hour)
91.8 µg/m³ (24-hour)
Relevant Criteria: TSP 120 µg/m³ AAQCPM10 50 µg/m³ Interim AAQCPM2.5 25 µg/m³ Canada Wide Standard (without background)
30 µg/m³ Canada Wide Standard (with background)NO2 400 µg/m³ 1-Hour AAQC
200 µg/m³ 24-Hour AAQC
Receptor UTM Coordinates Contaminant Averaging With No Background Concentration With Additional Background ConcentrationsID Type X Y Time Maximum Predicted Percentage of Number of Predicted Frequency of Maximum Predicted Percentage of Number of Predicted Frequency of
24-Hour Concentration Relevant Criteria Excursions Above Predicted Excursions 24-Hour Concentration Relevant Criteria Excursions Above Predicted ExcursionsCriteria over 5 Years Above Criteria Criteria over 5 Years Above Criteria
P1 P2 P3 P1 P2 P3 P1 P2 P3 P1 P2 P3 P1 P2 P3 P1 P2 P3 P1 P2 P3 P1 P2 P3
(m) (m) (hours) (µg/m³) (µg/m³) (µg/m³) (%) (%) (%) (µg/m³) (µg/m³) (µg/m³) (%) (%) (%)R18 Residence 572,125 4,828,655 TSP 24 75 72 82 62% 60% 68% 0 0 0 0% 0% 0% 124 121 131 103% 101% 109% 1 1 1 0.05% 0.05% 0.05%
572,125 4,828,655 PM10 24 23 22 26 46% 44% 51% 0 0 0 0% 0% 0% 50 49 53 100% 98% 105% 1 0 1 0.05% 0% 0.05%572,125 4,828,655 PM2.5 24 5 5 6 21% 19% 24% 0 0 0 0% 0% 0% 20 20 21 67% 65% 69% 0 0 0 0% 0% 0%572,125 4,828,655 NO2 1 123 125 132 31% 31% 33% 0 0 0 0% 0% 0% 214 217 224 54% 54% 56% 0 0 0 0% 0% 0%572,125 4,828,655 24 45 39 49 23% 19% 25% 0 0 0 0% 0% 0% 137 130 141 69% 65% 70% 0 0 0 0% 0% 0%
R19 Residence 571,645 4,829,520 TSP 24 158 44 48 132% 37% 40% 1 0 0 0% 0% 0% 207 93 97 173% 77% 81% 3 0 0 0.2% 0% 0%571,645 4,829,520 PM10 24 56 16 15 112% 31% 29% 1 0 0 0% 0% 0% 83 43 42 166% 85% 83% 4 0 0 0.2% 0% 0%571,645 4,829,520 PM2.5 24 18 5 4 73% 20% 17% 0 0 0 0% 0% 0% 33 20 19 110% 66% 64% 1 0 0 0.05% 0% 0%571,645 4,829,520 NO2 1 145 112 125 36% 28% 31% 0 0 0 0% 0% 0% 237 204 217 59% 51% 54% 0 0 0 0% 0% 0%571,645 4,829,520 24 51 21 39 26% 10% 20% 0 0 0 0% 0% 0% 143 113 131 71% 56% 66% 0 0 0 0% 0% 0%
Notes:Shaded values in bold indicate excursions above the relevant crtieria
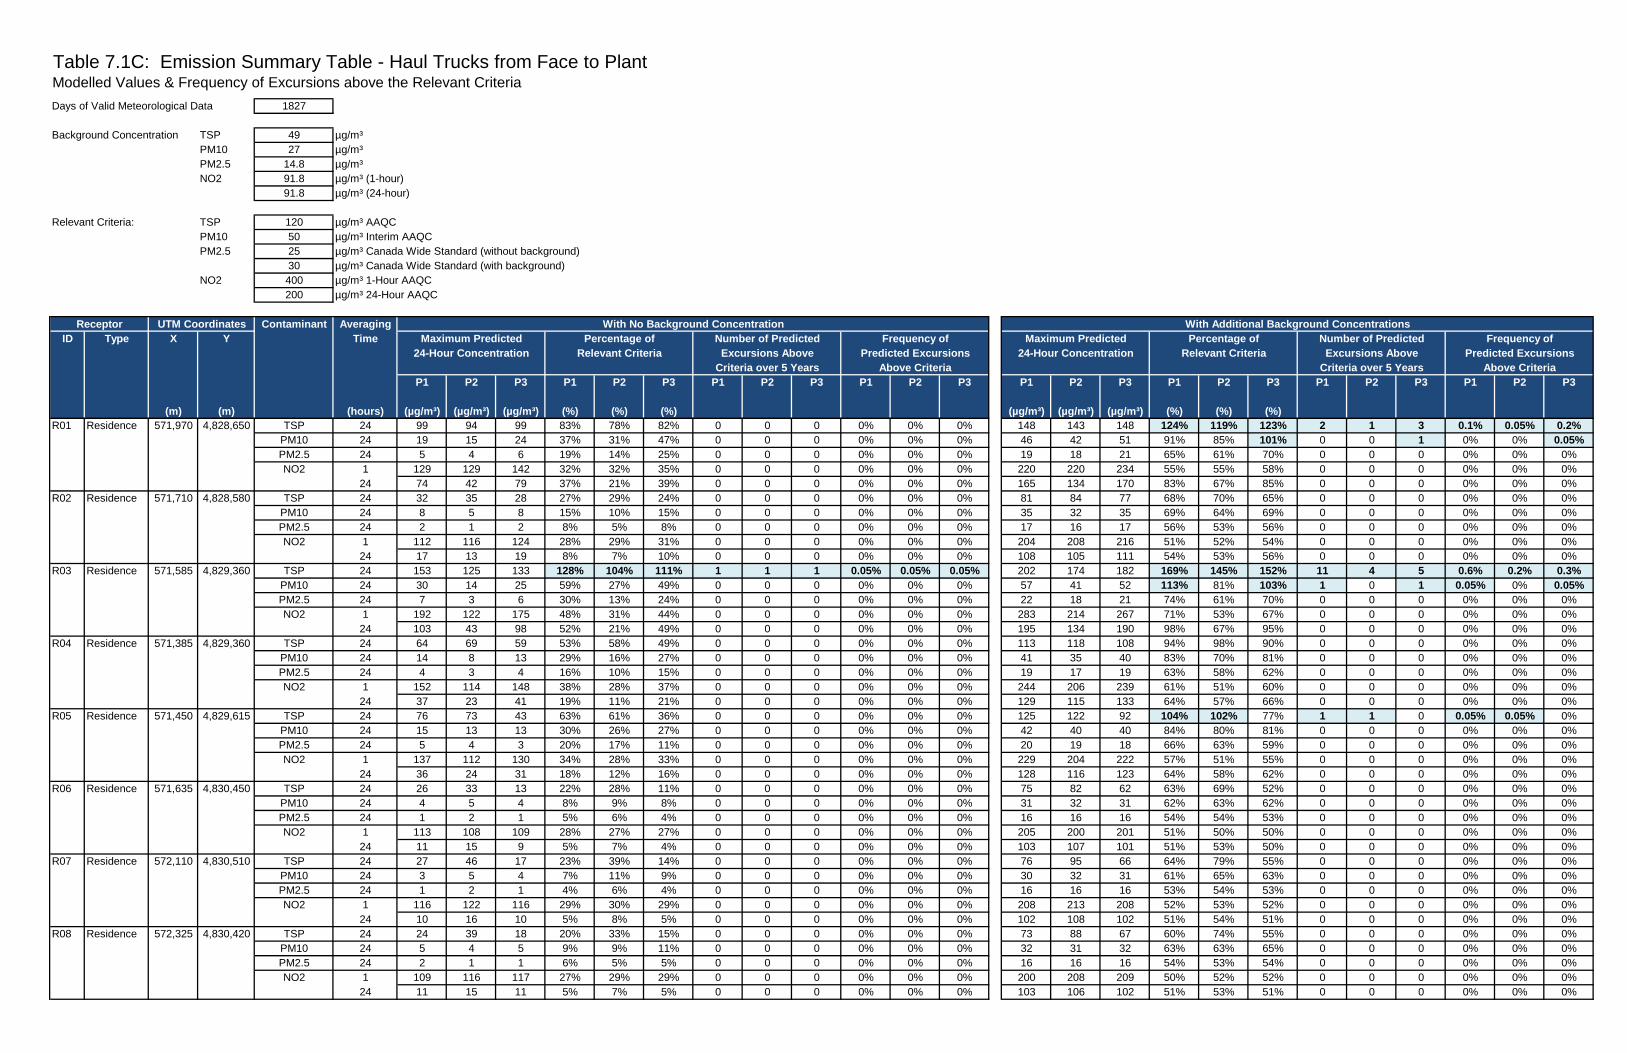
Table 7.1C: Emission Summary Table - Haul Trucks from Face to PlantModelled Values & Frequency of Excursions above the Relevant Criteria
Days of Valid Meteorological Data 1827
Background Concentration TSP 49 µg/m³PM10 27 µg/m³PM2.5 14.8 µg/m³NO2 91.8 µg/m³ (1-hour)
91.8 µg/m³ (24-hour)
Relevant Criteria: TSP 120 µg/m³ AAQCPM10 50 µg/m³ Interim AAQCPM2.5 25 µg/m³ Canada Wide Standard (without background)
30 µg/m³ Canada Wide Standard (with background)NO2 400 µg/m³ 1-Hour AAQC
200 µg/m³ 24-Hour AAQC
Receptor UTM Coordinates Contaminant Averaging With No Background Concentration With Additional Background ConcentrationsID Type X Y Time Maximum Predicted Percentage of Number of Predicted Frequency of Maximum Predicted Percentage of Number of Predicted Frequency of
24-Hour Concentration Relevant Criteria Excursions Above Predicted Excursions 24-Hour Concentration Relevant Criteria Excursions Above Predicted ExcursionsCriteria over 5 Years Above Criteria Criteria over 5 Years Above Criteria
P1 P2 P3 P1 P2 P3 P1 P2 P3 P1 P2 P3 P1 P2 P3 P1 P2 P3 P1 P2 P3 P1 P2 P3
(m) (m) (hours) (µg/m³) (µg/m³) (µg/m³) (%) (%) (%) (µg/m³) (µg/m³) (µg/m³) (%) (%) (%)R01 Residence 571,970 4,828,650 TSP 24 99 94 99 83% 78% 82% 0 0 0 0% 0% 0% 148 143 148 124% 119% 123% 2 1 3 0.1% 0.05% 0.2%
571,970 4,828,650 PM10 24 19 15 24 37% 31% 47% 0 0 0 0% 0% 0% 46 42 51 91% 85% 101% 0 0 1 0% 0% 0.05%571,970 4,828,650 PM2.5 24 5 4 6 19% 14% 25% 0 0 0 0% 0% 0% 19 18 21 65% 61% 70% 0 0 0 0% 0% 0%571,970 4,828,650 NO2 1 129 129 142 32% 32% 35% 0 0 0 0% 0% 0% 220 220 234 55% 55% 58% 0 0 0 0% 0% 0%571,970 4,828,650 24 74 42 79 37% 21% 39% 0 0 0 0% 0% 0% 165 134 170 83% 67% 85% 0 0 0 0% 0% 0%
R02 Residence 571,710 4,828,580 TSP 24 32 35 28 27% 29% 24% 0 0 0 0% 0% 0% 81 84 77 68% 70% 65% 0 0 0 0% 0% 0%571,710 4,828,580 PM10 24 8 5 8 15% 10% 15% 0 0 0 0% 0% 0% 35 32 35 69% 64% 69% 0 0 0 0% 0% 0%571,710 4,828,580 PM2.5 24 2 1 2 8% 5% 8% 0 0 0 0% 0% 0% 17 16 17 56% 53% 56% 0 0 0 0% 0% 0%571,710 4,828,580 NO2 1 112 116 124 28% 29% 31% 0 0 0 0% 0% 0% 204 208 216 51% 52% 54% 0 0 0 0% 0% 0%571,710 4,828,580 24 17 13 19 8% 7% 10% 0 0 0 0% 0% 0% 108 105 111 54% 53% 56% 0 0 0 0% 0% 0%
R03 Residence 571,585 4,829,360 TSP 24 153 125 133 128% 104% 111% 1 1 1 0.05% 0.05% 0.05% 202 174 182 169% 145% 152% 11 4 5 0.6% 0.2% 0.3%571,585 4,829,360 PM10 24 30 14 25 59% 27% 49% 0 0 0 0% 0% 0% 57 41 52 113% 81% 103% 1 0 1 0.05% 0% 0.05%571,585 4,829,360 PM2.5 24 7 3 6 30% 13% 24% 0 0 0 0% 0% 0% 22 18 21 74% 61% 70% 0 0 0 0% 0% 0%571,585 4,829,360 NO2 1 192 122 175 48% 31% 44% 0 0 0 0% 0% 0% 283 214 267 71% 53% 67% 0 0 0 0% 0% 0%571,585 4,829,360 24 103 43 98 52% 21% 49% 0 0 0 0% 0% 0% 195 134 190 98% 67% 95% 0 0 0 0% 0% 0%
R04 Residence 571,385 4,829,360 TSP 24 64 69 59 53% 58% 49% 0 0 0 0% 0% 0% 113 118 108 94% 98% 90% 0 0 0 0% 0% 0%571,385 4,829,360 PM10 24 14 8 13 29% 16% 27% 0 0 0 0% 0% 0% 41 35 40 83% 70% 81% 0 0 0 0% 0% 0%571,385 4,829,360 PM2.5 24 4 3 4 16% 10% 15% 0 0 0 0% 0% 0% 19 17 19 63% 58% 62% 0 0 0 0% 0% 0%571,385 4,829,360 NO2 1 152 114 148 38% 28% 37% 0 0 0 0% 0% 0% 244 206 239 61% 51% 60% 0 0 0 0% 0% 0%571,385 4,829,360 24 37 23 41 19% 11% 21% 0 0 0 0% 0% 0% 129 115 133 64% 57% 66% 0 0 0 0% 0% 0%
R05 Residence 571,450 4,829,615 TSP 24 76 73 43 63% 61% 36% 0 0 0 0% 0% 0% 125 122 92 104% 102% 77% 1 1 0 0.05% 0.05% 0%571,450 4,829,615 PM10 24 15 13 13 30% 26% 27% 0 0 0 0% 0% 0% 42 40 40 84% 80% 81% 0 0 0 0% 0% 0%571,450 4,829,615 PM2.5 24 5 4 3 20% 17% 11% 0 0 0 0% 0% 0% 20 19 18 66% 63% 59% 0 0 0 0% 0% 0%571,450 4,829,615 NO2 1 137 112 130 34% 28% 33% 0 0 0 0% 0% 0% 229 204 222 57% 51% 55% 0 0 0 0% 0% 0%571,450 4,829,615 24 36 24 31 18% 12% 16% 0 0 0 0% 0% 0% 128 116 123 64% 58% 62% 0 0 0 0% 0% 0%
R06 Residence 571,635 4,830,450 TSP 24 26 33 13 22% 28% 11% 0 0 0 0% 0% 0% 75 82 62 63% 69% 52% 0 0 0 0% 0% 0%571,635 4,830,450 PM10 24 4 5 4 8% 9% 8% 0 0 0 0% 0% 0% 31 32 31 62% 63% 62% 0 0 0 0% 0% 0%571,635 4,830,450 PM2.5 24 1 2 1 5% 6% 4% 0 0 0 0% 0% 0% 16 16 16 54% 54% 53% 0 0 0 0% 0% 0%571,635 4,830,450 NO2 1 113 108 109 28% 27% 27% 0 0 0 0% 0% 0% 205 200 201 51% 50% 50% 0 0 0 0% 0% 0%571,635 4,830,450 24 11 15 9 5% 7% 4% 0 0 0 0% 0% 0% 103 107 101 51% 53% 50% 0 0 0 0% 0% 0%
R07 Residence 572,110 4,830,510 TSP 24 27 46 17 23% 39% 14% 0 0 0 0% 0% 0% 76 95 66 64% 79% 55% 0 0 0 0% 0% 0%572,110 4,830,510 PM10 24 3 5 4 7% 11% 9% 0 0 0 0% 0% 0% 30 32 31 61% 65% 63% 0 0 0 0% 0% 0%572,110 4,830,510 PM2.5 24 1 2 1 4% 6% 4% 0 0 0 0% 0% 0% 16 16 16 53% 54% 53% 0 0 0 0% 0% 0%572,110 4,830,510 NO2 1 116 122 116 29% 30% 29% 0 0 0 0% 0% 0% 208 213 208 52% 53% 52% 0 0 0 0% 0% 0%572,110 4,830,510 24 10 16 10 5% 8% 5% 0 0 0 0% 0% 0% 102 108 102 51% 54% 51% 0 0 0 0% 0% 0%
R08 Residence 572,325 4,830,420 TSP 24 24 39 18 20% 33% 15% 0 0 0 0% 0% 0% 73 88 67 60% 74% 55% 0 0 0 0% 0% 0%572,325 4,830,420 PM10 24 5 4 5 9% 9% 11% 0 0 0 0% 0% 0% 32 31 32 63% 63% 65% 0 0 0 0% 0% 0%572,325 4,830,420 PM2.5 24 2 1 1 6% 5% 5% 0 0 0 0% 0% 0% 16 16 16 54% 53% 54% 0 0 0 0% 0% 0%572,325 4,830,420 NO2 1 109 116 117 27% 29% 29% 0 0 0 0% 0% 0% 200 208 209 50% 52% 52% 0 0 0 0% 0% 0%572,325 4,830,420 24 11 15 11 5% 7% 5% 0 0 0 0% 0% 0% 103 106 102 51% 53% 51% 0 0 0 0% 0% 0%
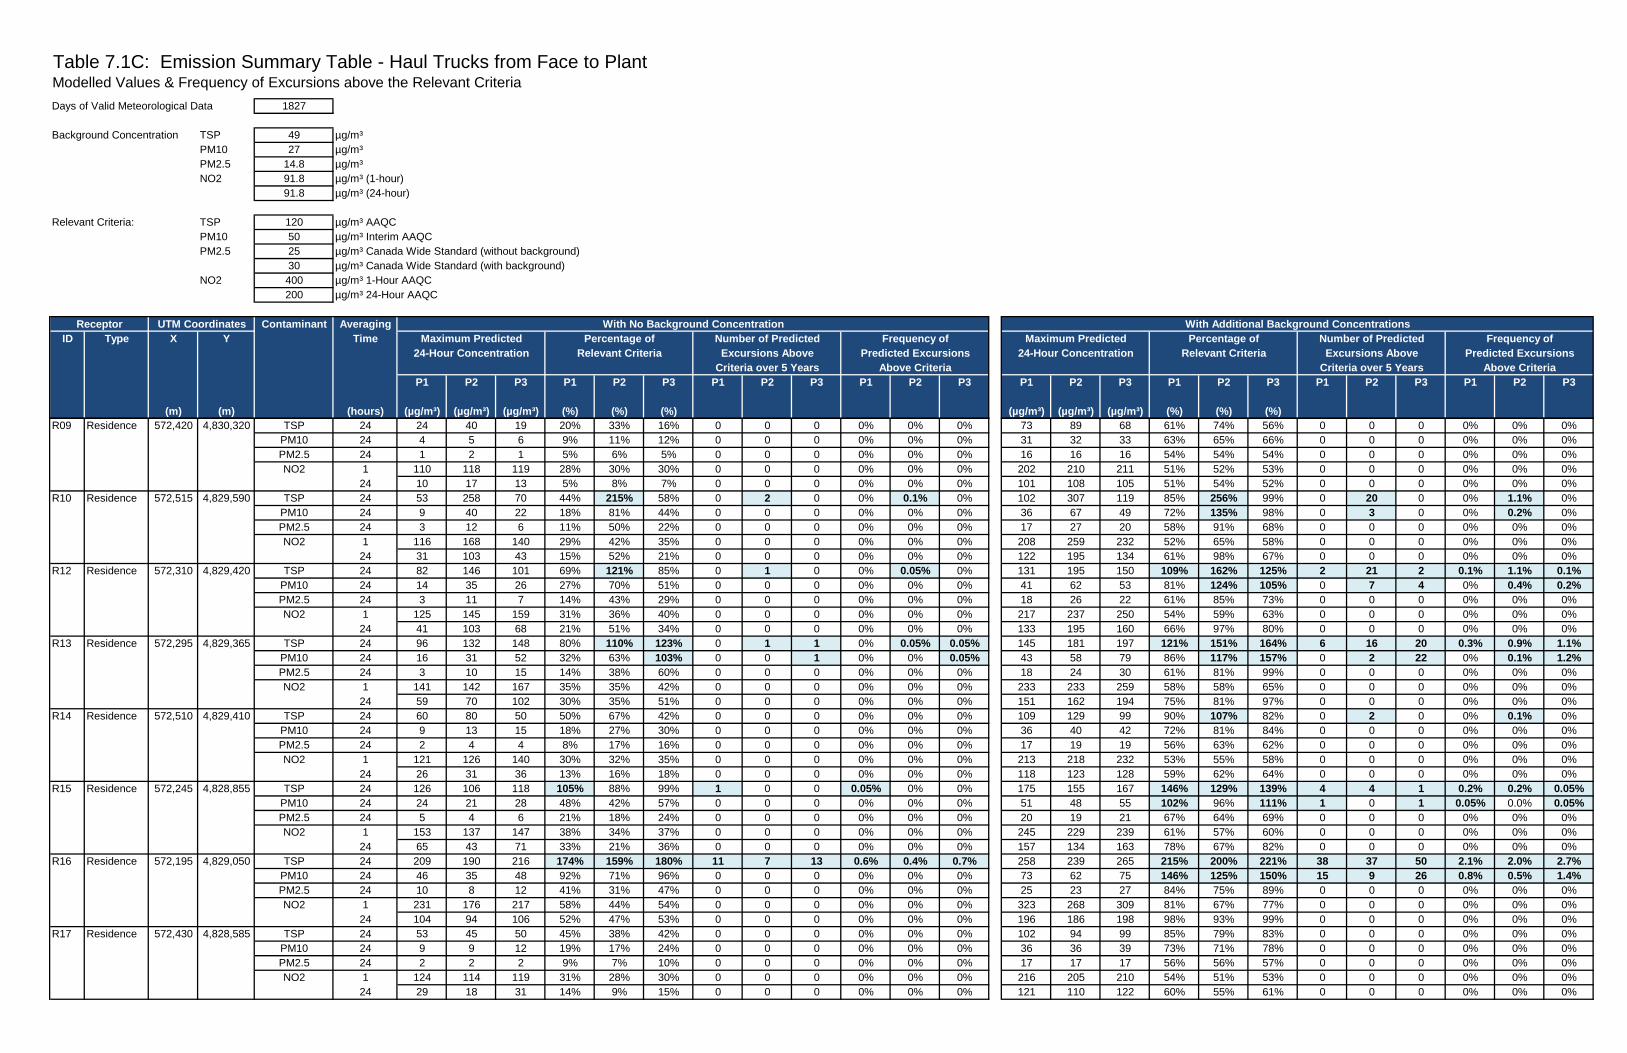
Table 7.1C: Emission Summary Table - Haul Trucks from Face to PlantModelled Values & Frequency of Excursions above the Relevant Criteria
Days of Valid Meteorological Data 1827
Background Concentration TSP 49 µg/m³PM10 27 µg/m³PM2.5 14.8 µg/m³NO2 91.8 µg/m³ (1-hour)
91.8 µg/m³ (24-hour)
Relevant Criteria: TSP 120 µg/m³ AAQCPM10 50 µg/m³ Interim AAQCPM2.5 25 µg/m³ Canada Wide Standard (without background)
30 µg/m³ Canada Wide Standard (with background)NO2 400 µg/m³ 1-Hour AAQC
200 µg/m³ 24-Hour AAQC
Receptor UTM Coordinates Contaminant Averaging With No Background Concentration With Additional Background ConcentrationsID Type X Y Time Maximum Predicted Percentage of Number of Predicted Frequency of Maximum Predicted Percentage of Number of Predicted Frequency of
24-Hour Concentration Relevant Criteria Excursions Above Predicted Excursions 24-Hour Concentration Relevant Criteria Excursions Above Predicted ExcursionsCriteria over 5 Years Above Criteria Criteria over 5 Years Above Criteria
P1 P2 P3 P1 P2 P3 P1 P2 P3 P1 P2 P3 P1 P2 P3 P1 P2 P3 P1 P2 P3 P1 P2 P3
(m) (m) (hours) (µg/m³) (µg/m³) (µg/m³) (%) (%) (%) (µg/m³) (µg/m³) (µg/m³) (%) (%) (%)R09 Residence 572,420 4,830,320 TSP 24 24 40 19 20% 33% 16% 0 0 0 0% 0% 0% 73 89 68 61% 74% 56% 0 0 0 0% 0% 0%
572,420 4,830,320 PM10 24 4 5 6 9% 11% 12% 0 0 0 0% 0% 0% 31 32 33 63% 65% 66% 0 0 0 0% 0% 0%572,420 4,830,320 PM2.5 24 1 2 1 5% 6% 5% 0 0 0 0% 0% 0% 16 16 16 54% 54% 54% 0 0 0 0% 0% 0%572,420 4,830,320 NO2 1 110 118 119 28% 30% 30% 0 0 0 0% 0% 0% 202 210 211 51% 52% 53% 0 0 0 0% 0% 0%572,420 4,830,320 24 10 17 13 5% 8% 7% 0 0 0 0% 0% 0% 101 108 105 51% 54% 52% 0 0 0 0% 0% 0%
R10 Residence 572,515 4,829,590 TSP 24 53 258 70 44% 215% 58% 0 2 0 0% 0.1% 0% 102 307 119 85% 256% 99% 0 20 0 0% 1.1% 0%572,515 4,829,590 PM10 24 9 40 22 18% 81% 44% 0 0 0 0% 0% 0% 36 67 49 72% 135% 98% 0 3 0 0% 0.2% 0%572,515 4,829,590 PM2.5 24 3 12 6 11% 50% 22% 0 0 0 0% 0% 0% 17 27 20 58% 91% 68% 0 0 0 0% 0% 0%572,515 4,829,590 NO2 1 116 168 140 29% 42% 35% 0 0 0 0% 0% 0% 208 259 232 52% 65% 58% 0 0 0 0% 0% 0%572,515 4,829,590 24 31 103 43 15% 52% 21% 0 0 0 0% 0% 0% 122 195 134 61% 98% 67% 0 0 0 0% 0% 0%
R12 Residence 572,310 4,829,420 TSP 24 82 146 101 69% 121% 85% 0 1 0 0% 0.05% 0% 131 195 150 109% 162% 125% 2 21 2 0.1% 1.1% 0.1%572,310 4,829,420 PM10 24 14 35 26 27% 70% 51% 0 0 0 0% 0% 0% 41 62 53 81% 124% 105% 0 7 4 0% 0.4% 0.2%572,310 4,829,420 PM2.5 24 3 11 7 14% 43% 29% 0 0 0 0% 0% 0% 18 26 22 61% 85% 73% 0 0 0 0% 0% 0%572,310 4,829,420 NO2 1 125 145 159 31% 36% 40% 0 0 0 0% 0% 0% 217 237 250 54% 59% 63% 0 0 0 0% 0% 0%572,310 4,829,420 24 41 103 68 21% 51% 34% 0 0 0 0% 0% 0% 133 195 160 66% 97% 80% 0 0 0 0% 0% 0%
R13 Residence 572,295 4,829,365 TSP 24 96 132 148 80% 110% 123% 0 1 1 0% 0.05% 0.05% 145 181 197 121% 151% 164% 6 16 20 0.3% 0.9% 1.1%572,295 4,829,365 PM10 24 16 31 52 32% 63% 103% 0 0 1 0% 0% 0.05% 43 58 79 86% 117% 157% 0 2 22 0% 0.1% 1.2%572,295 4,829,365 PM2.5 24 3 10 15 14% 38% 60% 0 0 0 0% 0% 0% 18 24 30 61% 81% 99% 0 0 0 0% 0% 0%572,295 4,829,365 NO2 1 141 142 167 35% 35% 42% 0 0 0 0% 0% 0% 233 233 259 58% 58% 65% 0 0 0 0% 0% 0%572,295 4,829,365 24 59 70 102 30% 35% 51% 0 0 0 0% 0% 0% 151 162 194 75% 81% 97% 0 0 0 0% 0% 0%
R14 Residence 572,510 4,829,410 TSP 24 60 80 50 50% 67% 42% 0 0 0 0% 0% 0% 109 129 99 90% 107% 82% 0 2 0 0% 0.1% 0%572,510 4,829,410 PM10 24 9 13 15 18% 27% 30% 0 0 0 0% 0% 0% 36 40 42 72% 81% 84% 0 0 0 0% 0% 0%572,510 4,829,410 PM2.5 24 2 4 4 8% 17% 16% 0 0 0 0% 0% 0% 17 19 19 56% 63% 62% 0 0 0 0% 0% 0%572,510 4,829,410 NO2 1 121 126 140 30% 32% 35% 0 0 0 0% 0% 0% 213 218 232 53% 55% 58% 0 0 0 0% 0% 0%572,510 4,829,410 24 26 31 36 13% 16% 18% 0 0 0 0% 0% 0% 118 123 128 59% 62% 64% 0 0 0 0% 0% 0%
R15 Residence 572,245 4,828,855 TSP 24 126 106 118 105% 88% 99% 1 0 0 0.05% 0% 0% 175 155 167 146% 129% 139% 4 4 1 0.2% 0.2% 0.05%572,245 4,828,855 PM10 24 24 21 28 48% 42% 57% 0 0 0 0% 0% 0% 51 48 55 102% 96% 111% 1 0 1 0.05% 0.0% 0.05%572,245 4,828,855 PM2.5 24 5 4 6 21% 18% 24% 0 0 0 0% 0% 0% 20 19 21 67% 64% 69% 0 0 0 0% 0% 0%572,245 4,828,855 NO2 1 153 137 147 38% 34% 37% 0 0 0 0% 0% 0% 245 229 239 61% 57% 60% 0 0 0 0% 0% 0%572,245 4,828,855 24 65 43 71 33% 21% 36% 0 0 0 0% 0% 0% 157 134 163 78% 67% 82% 0 0 0 0% 0% 0%
R16 Residence 572,195 4,829,050 TSP 24 209 190 216 174% 159% 180% 11 7 13 0.6% 0.4% 0.7% 258 239 265 215% 200% 221% 38 37 50 2.1% 2.0% 2.7%572,195 4,829,050 PM10 24 46 35 48 92% 71% 96% 0 0 0 0% 0% 0% 73 62 75 146% 125% 150% 15 9 26 0.8% 0.5% 1.4%572,195 4,829,050 PM2.5 24 10 8 12 41% 31% 47% 0 0 0 0% 0% 0% 25 23 27 84% 75% 89% 0 0 0 0% 0% 0%572,195 4,829,050 NO2 1 231 176 217 58% 44% 54% 0 0 0 0% 0% 0% 323 268 309 81% 67% 77% 0 0 0 0% 0% 0%572,195 4,829,050 24 104 94 106 52% 47% 53% 0 0 0 0% 0% 0% 196 186 198 98% 93% 99% 0 0 0 0% 0% 0%
R17 Residence 572,430 4,828,585 TSP 24 53 45 50 45% 38% 42% 0 0 0 0% 0% 0% 102 94 99 85% 79% 83% 0 0 0 0% 0% 0%572,430 4,828,585 PM10 24 9 9 12 19% 17% 24% 0 0 0 0% 0% 0% 36 36 39 73% 71% 78% 0 0 0 0% 0% 0%572,430 4,828,585 PM2.5 24 2 2 2 9% 7% 10% 0 0 0 0% 0% 0% 17 17 17 56% 56% 57% 0 0 0 0% 0% 0%572,430 4,828,585 NO2 1 124 114 119 31% 28% 30% 0 0 0 0% 0% 0% 216 205 210 54% 51% 53% 0 0 0 0% 0% 0%572,430 4,828,585 24 29 18 31 14% 9% 15% 0 0 0 0% 0% 0% 121 110 122 60% 55% 61% 0 0 0 0% 0% 0%
Table 7.1C: Emission Summary Table - Haul Trucks from Face to PlantModelled Values & Frequency of Excursions above the Relevant Criteria
Days of Valid Meteorological Data 1827
Background Concentration TSP 49 µg/m³PM10 27 µg/m³PM2.5 14.8 µg/m³NO2 91.8 µg/m³ (1-hour)
91.8 µg/m³ (24-hour)
Relevant Criteria: TSP 120 µg/m³ AAQCPM10 50 µg/m³ Interim AAQCPM2.5 25 µg/m³ Canada Wide Standard (without background)
30 µg/m³ Canada Wide Standard (with background)NO2 400 µg/m³ 1-Hour AAQC
200 µg/m³ 24-Hour AAQC
Receptor UTM Coordinates Contaminant Averaging With No Background Concentration With Additional Background ConcentrationsID Type X Y Time Maximum Predicted Percentage of Number of Predicted Frequency of Maximum Predicted Percentage of Number of Predicted Frequency of
24-Hour Concentration Relevant Criteria Excursions Above Predicted Excursions 24-Hour Concentration Relevant Criteria Excursions Above Predicted ExcursionsCriteria over 5 Years Above Criteria Criteria over 5 Years Above Criteria
P1 P2 P3 P1 P2 P3 P1 P2 P3 P1 P2 P3 P1 P2 P3 P1 P2 P3 P1 P2 P3 P1 P2 P3
(m) (m) (hours) (µg/m³) (µg/m³) (µg/m³) (%) (%) (%) (µg/m³) (µg/m³) (µg/m³) (%) (%) (%)R18 Residence 572,125 4,828,655 TSP 24 179 171 130 150% 142% 108% 1 1 1 0.05% 0.05% 0.05% 228 220 179 190% 183% 149% 1 1 1 0.05% 0.05% 0.05%
572,125 4,828,655 PM10 24 23 22 39 46% 44% 77% 0 0 0 0% 0% 0% 50 49 66 100% 98% 131% 1 0 1 0.05% 0% 0.05%572,125 4,828,655 PM2.5 24 5 5 8 21% 19% 32% 0 0 0 0% 0% 0% 20 20 23 67% 65% 76% 0 0 0 0% 0% 0%572,125 4,828,655 NO2 1 135 132 144 34% 33% 36% 0 0 0 0% 0% 0% 227 224 236 57% 56% 59% 0 0 0 0% 0% 0%572,125 4,828,655 24 72 60 81 36% 30% 40% 0 0 0 0% 0% 0% 164 152 172 82% 76% 86% 0 0 0 0% 0% 0%
R19 Residence 571,645 4,829,520 TSP 24 158 87 74 132% 73% 61% 3 0 0 0.16% 0% 0% 207 136 123 173% 114% 102% 13 4 1 0.7% 0.2% 0.05%571,645 4,829,520 PM10 24 56 16 18 112% 31% 36% 1 0 0 0.05% 0% 0% 83 43 45 166% 85% 90% 4 0 0 0.2% 0% 0%571,645 4,829,520 PM2.5 24 18 5 4 73% 20% 17% 0 0 0 0% 0% 0% 33 20 19 110% 66% 64% 1 0 0 0.05% 0% 0%571,645 4,829,520 NO2 1 158 128 142 39% 32% 36% 0 0 0 0% 0% 0% 250 220 234 62% 55% 58% 0 0 0 0% 0% 0%571,645 4,829,520 24 72 30 61 36% 15% 30% 0 0 0 0% 0% 0% 164 122 153 82% 61% 76% 0 0 0 0% 0% 0%
Notes:Shaded values in bold indicate excursions above the relevant crtieria

Employee Job Title
FIGURESFIGURES
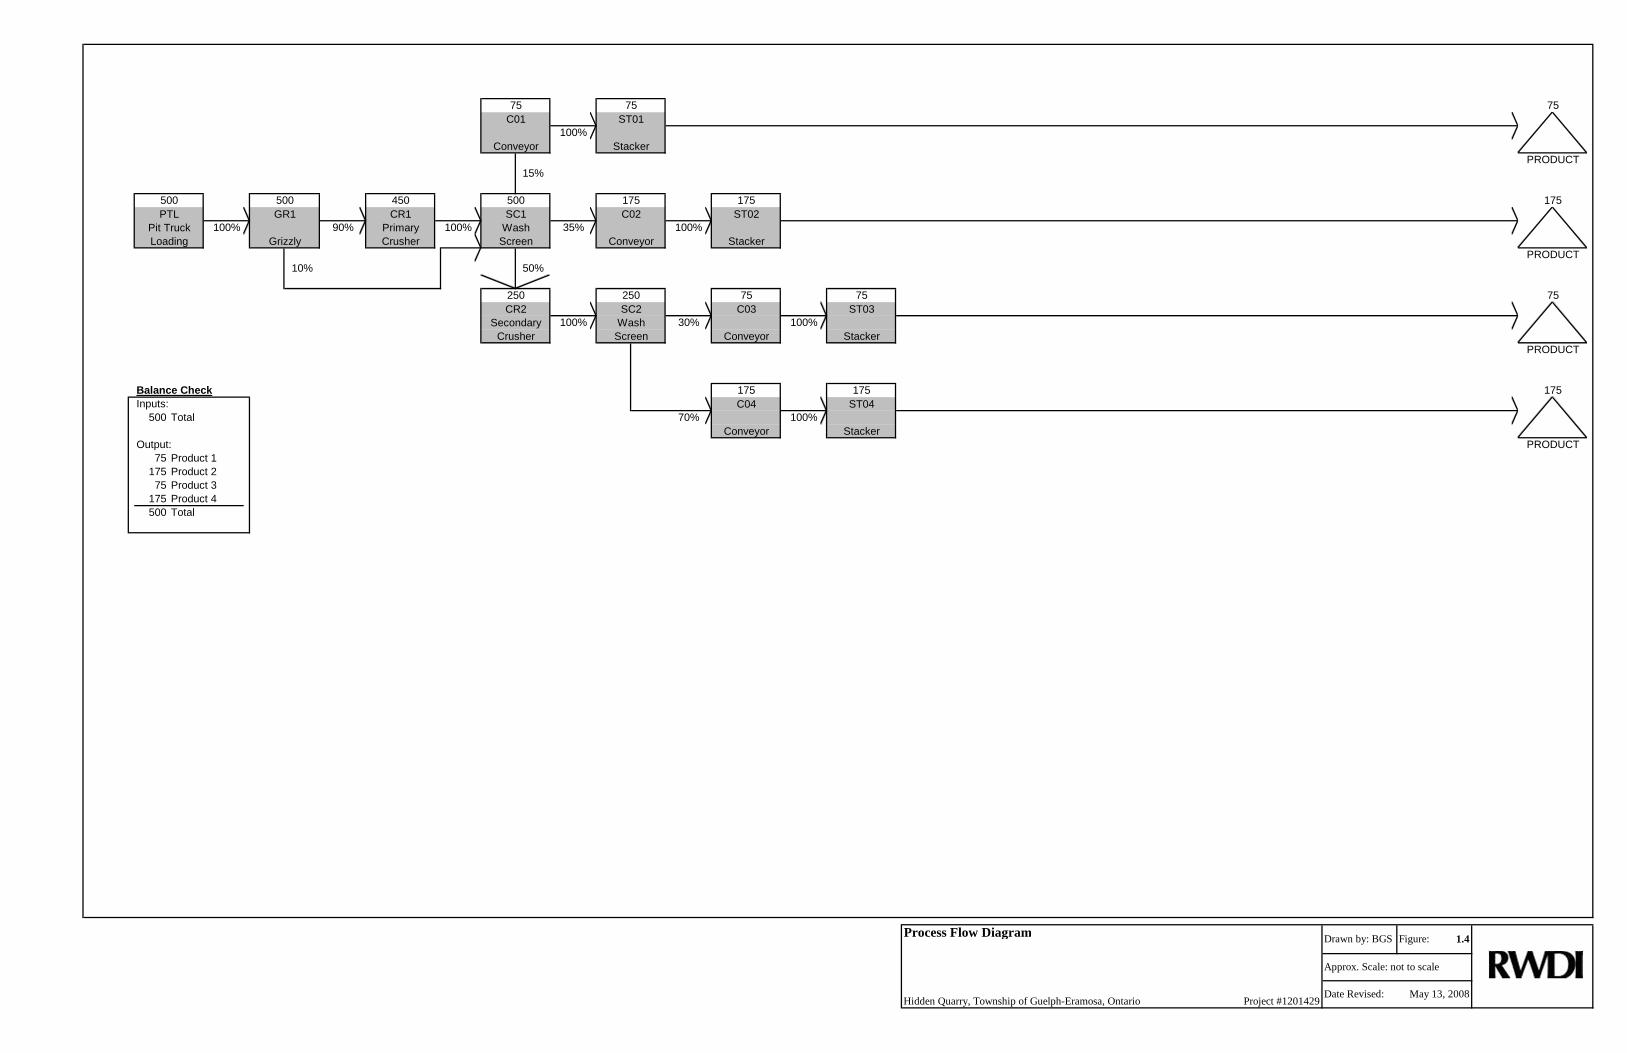
75 75 75C01 ST01
100%Conveyor Stacker
PRODUCT15%
500 500 450 500 175 175 175PTL GR1 CR1 SC1 C02 ST02
Pit Truck 100% 90% Primary 100% Wash 35% 100%Loading Grizzly Crusher Screen Conveyor Stacker
PRODUCT10% 50%
250 250 75 75 75CR2 SC2 C03 ST03
Secondary 100% Wash 30% 100%Crusher Screen Conveyor Stacker
PRODUCT
Balance Check 175 175 175Inputs: C04 ST04
500 Total 70% 100%Conveyor Stacker
Output: PRODUCT75 Product 1
175 Product 275 Product 3
175 Product 4500 Total
Process Flow Diagram
Hidden Quarry, Township of Guelph-Eramosa, Ontario Project #1201429Date Revised: May 13, 2008
Drawn by: BGS Figure: 1.4
Approx. Scale: not to scale
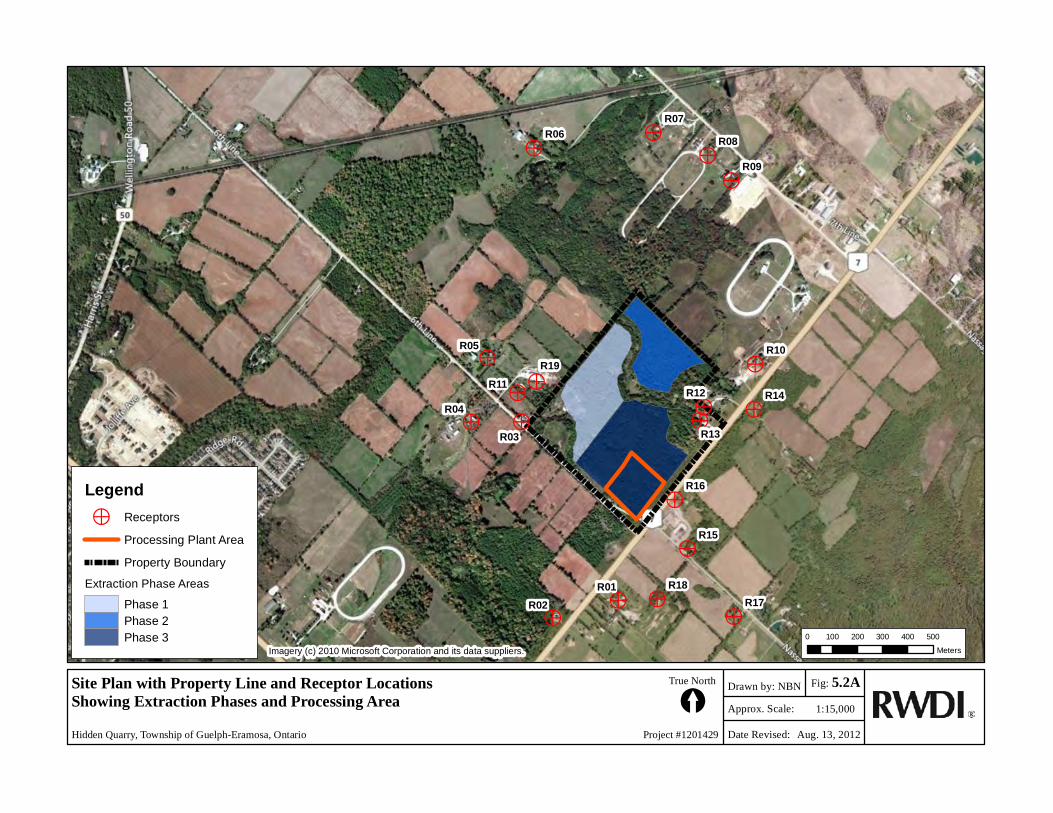
>>
>>
>
>>
>
>
>
>>>
>
>
>
>>
>R19
R18R17
R16
R15
R14
R13
R12R11
R10
R09R08
R07R06
R05
R04
R03
R02R01
Imagery (c) 2010 Microsoft Corporation and its data suppliers.0 100 200 300 400 500
Meters
Site Plan with Property Line and Receptor LocationsShowing Extraction Phases and Processing AreaHidden Quarry, Township of Guelph-Eramosa, Ontario Project #1201429
[True North
Date Revised: Aug. 13, 2012
Approx. Scale:
Fig:Drawn by: NBN1:15,000
5.2A
Legend> Receptors
Processing Plant AreaProperty Boundary
Extraction Phase AreasPhase 1Phase 2Phase 3
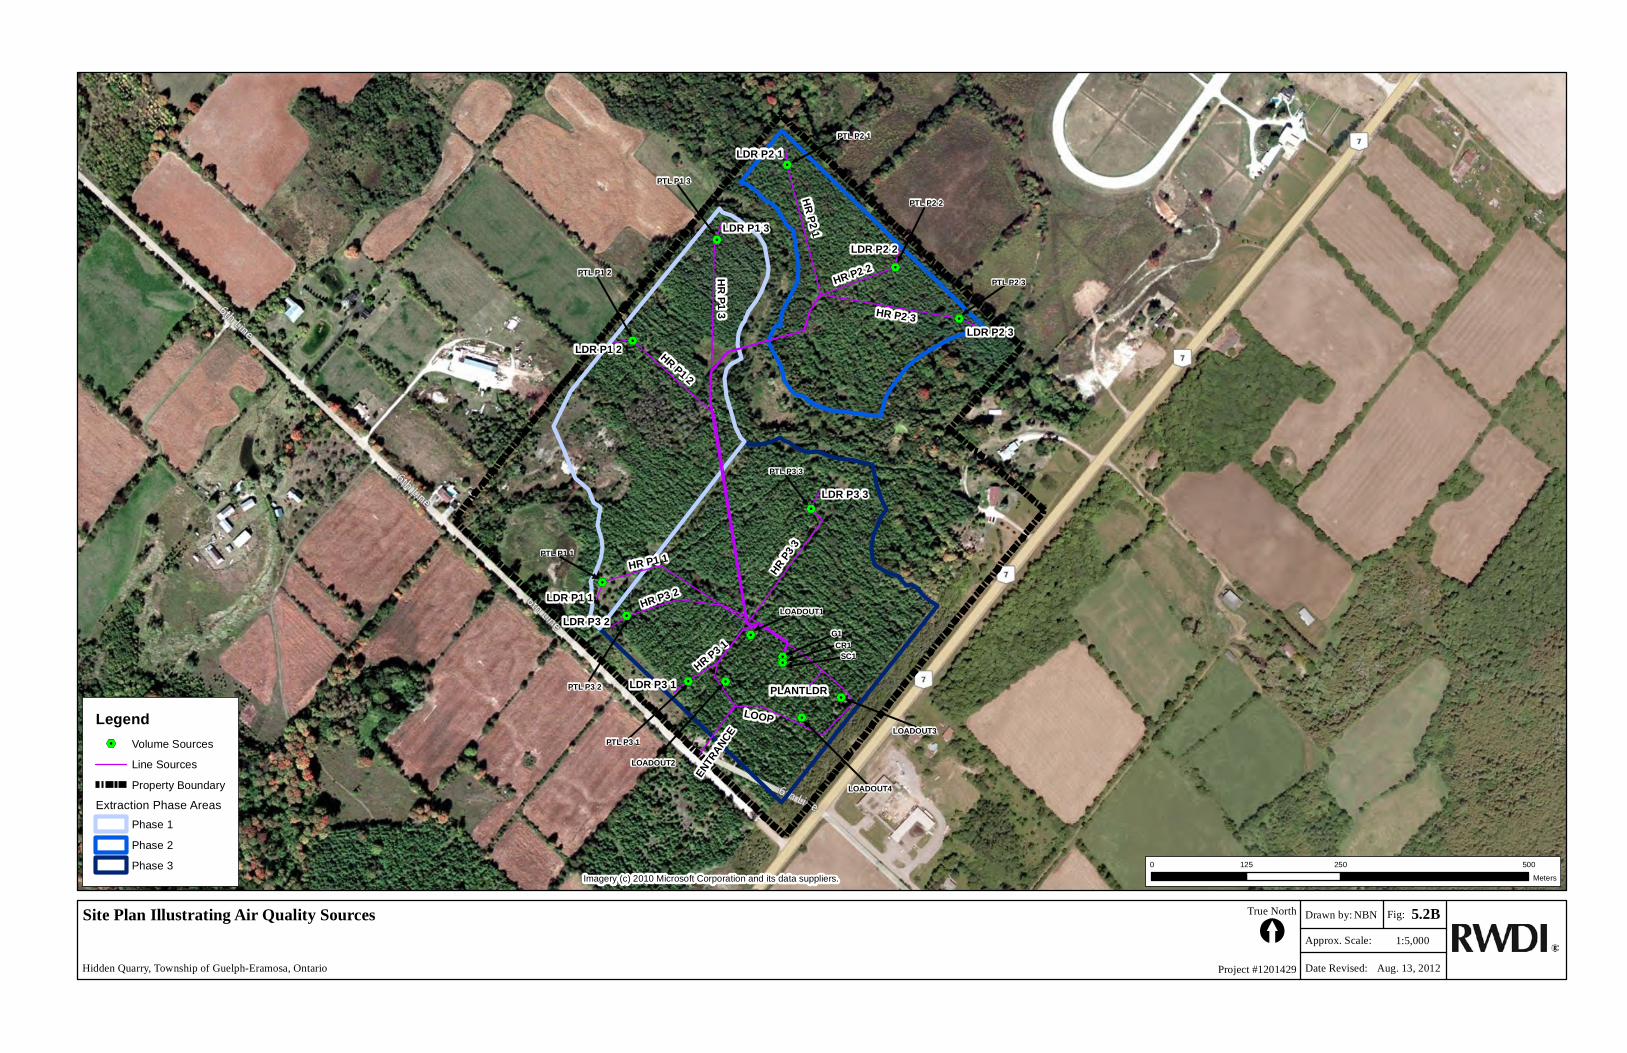
%2%2
%2
%2
%2
%2
%2
%2
%2
%2
%2
%2
%2
%2
%2
%2
HR P2 3
HR P2 1
LOOP
HR P2 2HR P1 3
HR P1 2
HR P1 1
HR P3 3
HR P3 2
HR P3 1
ENTR
ANCE
LDR P2 2
LDR P2 1
LDR P3 2
LDR P1 3
LDR P1 1
LDR P2 3
LDR P3 3
LDR P3 1
LDR P1 2
PLANTLDR
G1
SC1CR1
PTL P3 3
PTL P3 2
PTL P3 1
PTL P2 3
PTL P2 2
PTL P2 1
PTL P1 3
PTL P1 2
PTL P1 1
LOADOUT4
LOADOUT3
LOADOUT2
LOADOUT1
Site Plan Illustrating Air Quality Sources
Hidden Quarry, Township of Guelph-Eramosa, Ontario Project #1201429
[True North
Date Revised: Aug. 13, 2012
Approx. Scale:
Fig:Drawn by: NBN
1:5,0005.2B
Imagery (c) 2010 Microsoft Corporation and its data suppliers.0 250 500125
Meters
Legend%2 Volume Sources
Line SourcesProperty Boundary
Extraction Phase AreasPhase 1Phase 2Phase 3
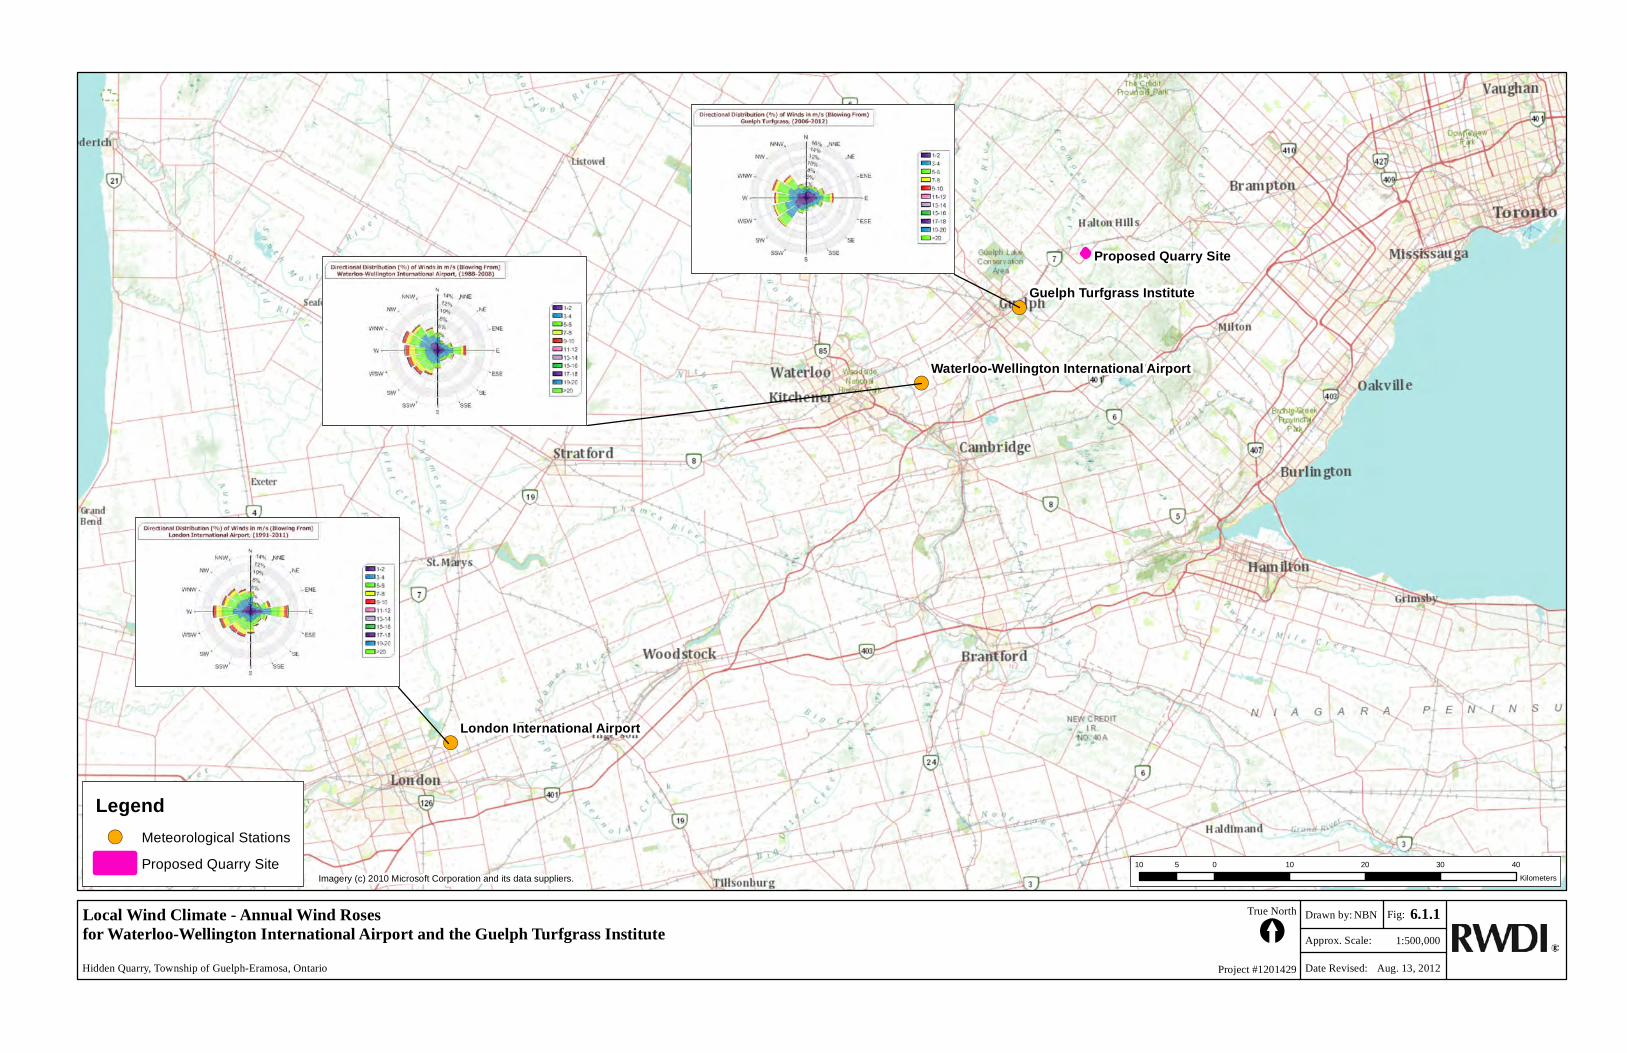
!(
!(
!(
Proposed Quarry Site
Guelph Turfgrass Institute
London International Airport
Waterloo-Wellington International Airport
Local Wind Climate - Annual Wind Rosesfor Waterloo-Wellington International Airport and the Guelph Turfgrass InstituteHidden Quarry, Township of Guelph-Eramosa, Ontario Project #1201429
[True North
Date Revised: Aug. 13, 2012
Approx. Scale:
Fig:Drawn by: NBN
1:500,0006.1.1
Imagery (c) 2010 Microsoft Corporation and its data suppliers.10 0 10 20 30 405
Kilometers
Legend!( Meteorological Stations
Proposed Quarry Site
FIGURE 6.2
15
1
2
3
4
5
6
7
8
9
10
11
12
13
14
15
16
17
18
19
20
21
22
23
24
25
26
27
28
29
30
31
Town
ship
of Pu
slinch
11
Derry Road
City of Burlington11
12
13
14
15
Highway 401
2
1
3
4
5
6
7
8
9
10
Bell S
choo
l Line
3 352 1 34 33
Main Street
Township of Eramosa
10 Side Road
15 Side Road
20 Side Road (RR 34)
III
12
13
14
16
15
17
18
19
20
21
First
Line N
assa
gawe
ya
22
23
25
24
26
Nass
agaw
eya/P
uslin
ch To
wn Li
ne
27
28
29
30
31
25 Side Road Seco
nd Li
ne N
assa
gawe
ya
32
I II
30 Side Road
Fourt
h Line
Nas
saga
weya
Fifth
Line N
assa
gawe
ya
Town
of H
alton
Hills
Nass
agaw
eya/E
sque
sing T
own L
ineSixth
Line N
assa
gawe
ya
IVHighway 7
V VI VII
12
Town of Oakville
3032 311721 20 19 18 16 15 14 13
Third
Line
Fourt
h Line
7
Lower Base Line
11 10 9 8 6
Eighth
Line
6
City
of M
ississ
auga
2
1
3
4
5
7
8
9
11
10
12
13
14
Town
of Fl
ambo
rough
I II IV V
VI VIIV VIII IX
32 Side Road (RR32)
Milbu
rough
Line
Cany
on R
oad
Midw
ay La
ne
Bron
te St
reet S
Arkell Road
Darkw
ood R
oad
No 2 Side Road
Burnhamthorpe Road WNo 1 Side Road
Hend
erson
Roa
d
32
Sixth
Line
Fifth
Line
No 5 Side Road
Highway 401
Campbellville Road
First
Line
Conservation Road
III
Regio
nal R
oad #
25
Limestone Road
Guelp
h Line
(RR
1)
McNiv
en R
oad
Guelp
h Line
(RR
1)
Jame
s Sno
w Pa
rkway
(RR
4)
Highw
ay 40
7
Twiss
Roa
d
No 3 Side Road
Steeles Avenue
Campbellville Road
Apple
by Li
ne
Trafal
gar R
oad (
RR3)
Britannia Road (RR6)
Derry Road (RR 7)
Ninth
Line (
RR 13
)
Trema
ine R
oad (
RR 22
)J03 J07J06J02J01I03 I06 I07I01 I02
F03F01
L07L05
F02 F04
L06L03
A01 A02 A03 A04
L04
E01 E03 E04E02
C04D04
B04C03C02
K05
C01D03
H02
K06
D02
B03
K03 K04
H01
D01
B01 B02
H03
K07
G03G02G01 G04 G05
M05 M06M04M03
see URBAN maps
Town of Milton - Zoning By-Law 144-2003RURAL AREA
Consolidated June 2009
DISCLAIMER: The following map sheets provide a representation of Schedule 'A'to By-law 144-2003 and have been produced for the convenienceof the reader. While efforts are made to ensure that these map sheets are up to date, in order to ensure accuracy, official zoninginformation should always be confirmed with the Town's Zoning Officer.Further, these maps should be read in conjunction with the document "The Town of Milton Comprehensive Zoning By-law 144-2003",as amended from time to time.
Last Mapping Updates: July 19, 2010
A01
RE
NASS
A GA W
EYA P
USLIN
CH T O
WNLIN
E
ARKELL ROAD
SheetDISCLAIMER: The following map sheets provide a representation of Schedule 'A'to By-law 144-2003 and have been produced for the convenienceof the reader. While efforts are made to ensure that these map sheets are up to date, in order to ensure accuracy, official zoninginformation should always be confirmed with the Town's Zoning Officer.Further, these maps should be read in conjunction with the document "The Town of Milton Comprehensive Zoning By-law 144-2003",as amended from time to time.
A01 A02 A03 A04
E01 E02
B04C03C02C01
D02
B03
D01
B01 B02
C2C3C4C5C6
RERHDRLD
RMD2RORV
RMD1
I-AI-BM1
OS
M2MX
EMP
GAGBGC
FDA2C1-AC1-BC1-CC1-DC1-EC1-F
A1Railline
Site Specific Zone*GA_spaNEC Development Control Area
Special Provisions, Holding Provisions,Temporary Use Zones, and Interim Control ZonesUnder AppealA1
Municipal BoundaryTown of Milton - Zoning By-Law 144-2003RURAL AREA
Consolidated June 2009Date of Last Revision: July 19, 2010
0 100 200 300 400 50050Metres
4
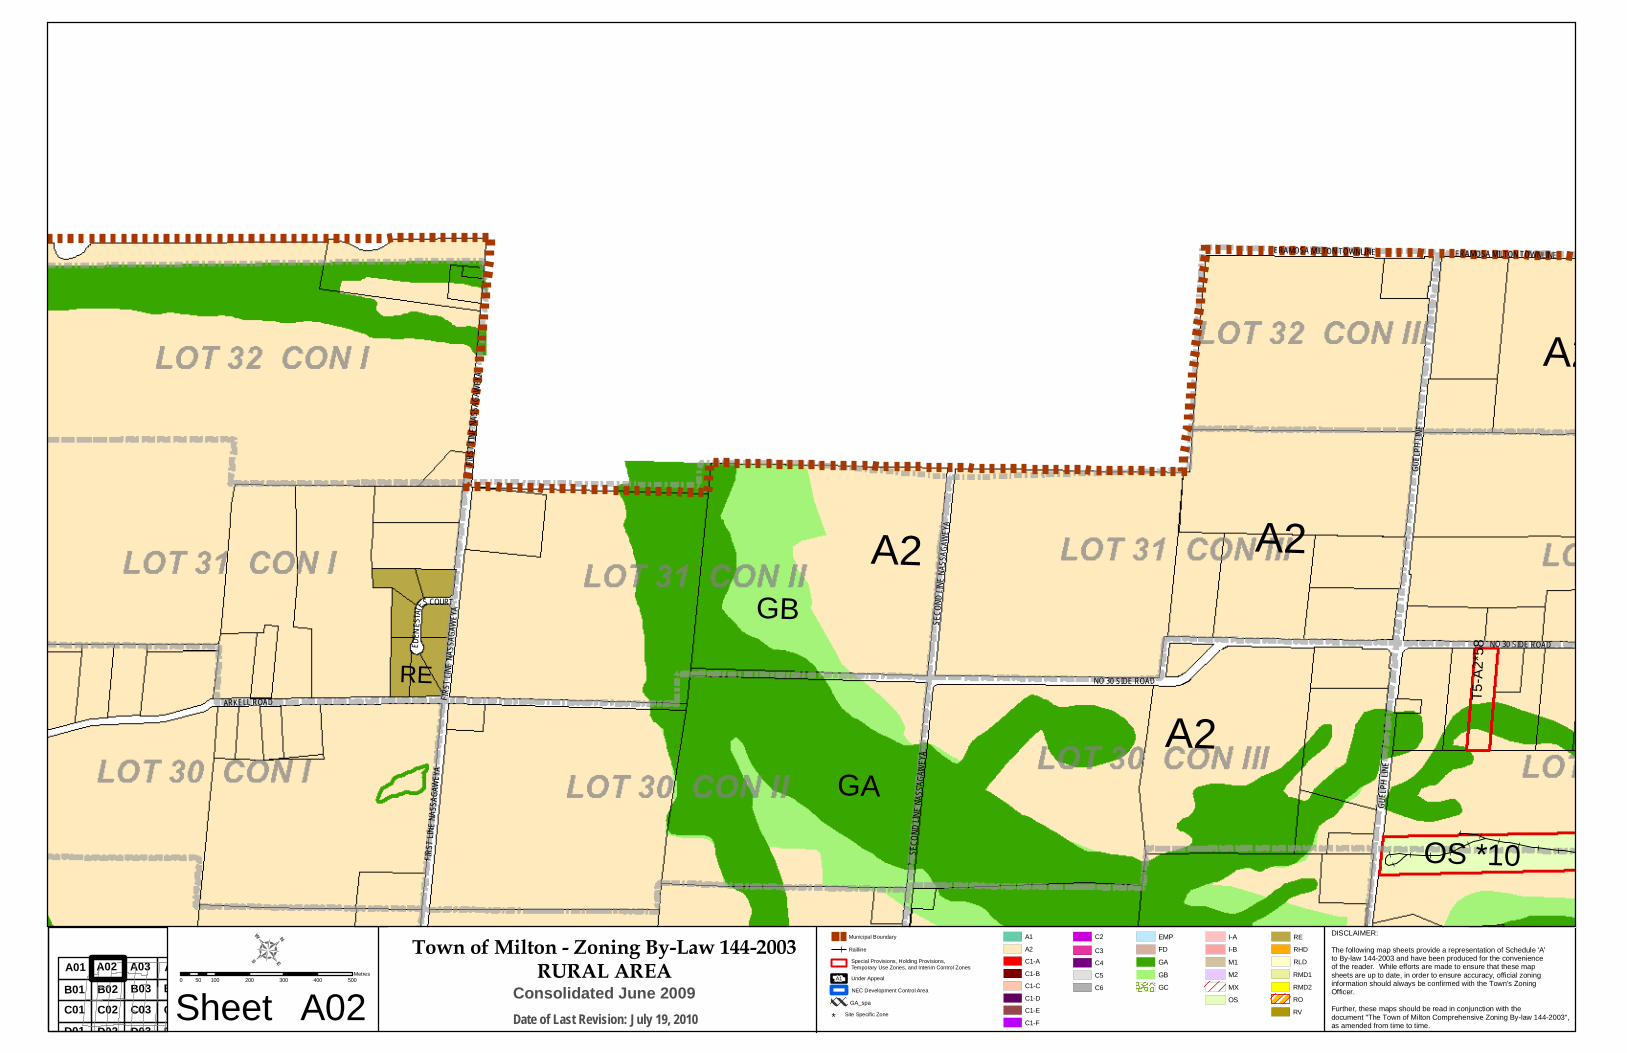
A02
A2
A2
A2
A2
T5-A
2*58
A2
GA
RE
GBA2
GAA2
A2
OS *10
F IRST
LINE N
A SS A
GAWE
Y A
EDEN
ESTAT
ES COURT
FIRST
LINE N
A SSA
GAWE
YA
ERAMOSA MILTON TOWNLINE
NO 30 SIDE ROAD
SECO
ND L IN
E NAS
SAGA
WEY A
ERAMOSA MILTON TOWNLINE
FIRST
LI NE N
A SS A
GAWE
YA
S ECO
ND L IN
E NAS
SAGA
WEY A
GUE L
P H LIN
E
GUE L
PH LIN
E
ARKELL ROAD
NO 30 SIDE ROAD
SheetDISCLAIMER: The following map sheets provide a representation of Schedule 'A'to By-law 144-2003 and have been produced for the convenienceof the reader. While efforts are made to ensure that these map sheets are up to date, in order to ensure accuracy, official zoninginformation should always be confirmed with the Town's Zoning Officer.Further, these maps should be read in conjunction with the document "The Town of Milton Comprehensive Zoning By-law 144-2003",as amended from time to time.
F01 F02
A01 A02 A03 A04
E01 E03E02
C04D04
B04C03C02C01D03D02
B03
D01
B01 B02
C2C3C4C5C6
RERHDRLD
RMD2RORV
RMD1
I-AI-BM1
OS
M2MX
EMP
GAGBGC
FDA2C1-AC1-BC1-CC1-DC1-EC1-F
A1Railline
Site Specific Zone*GA_spaNEC Development Control Area
Special Provisions, Holding Provisions,Temporary Use Zones, and Interim Control ZonesUnder AppealA1
Municipal BoundaryTown of Milton - Zoning By-Law 144-2003RURAL AREA
Consolidated June 2009Date of Last Revision: July 19, 2010
0 100 200 300 400 50050Metres
4
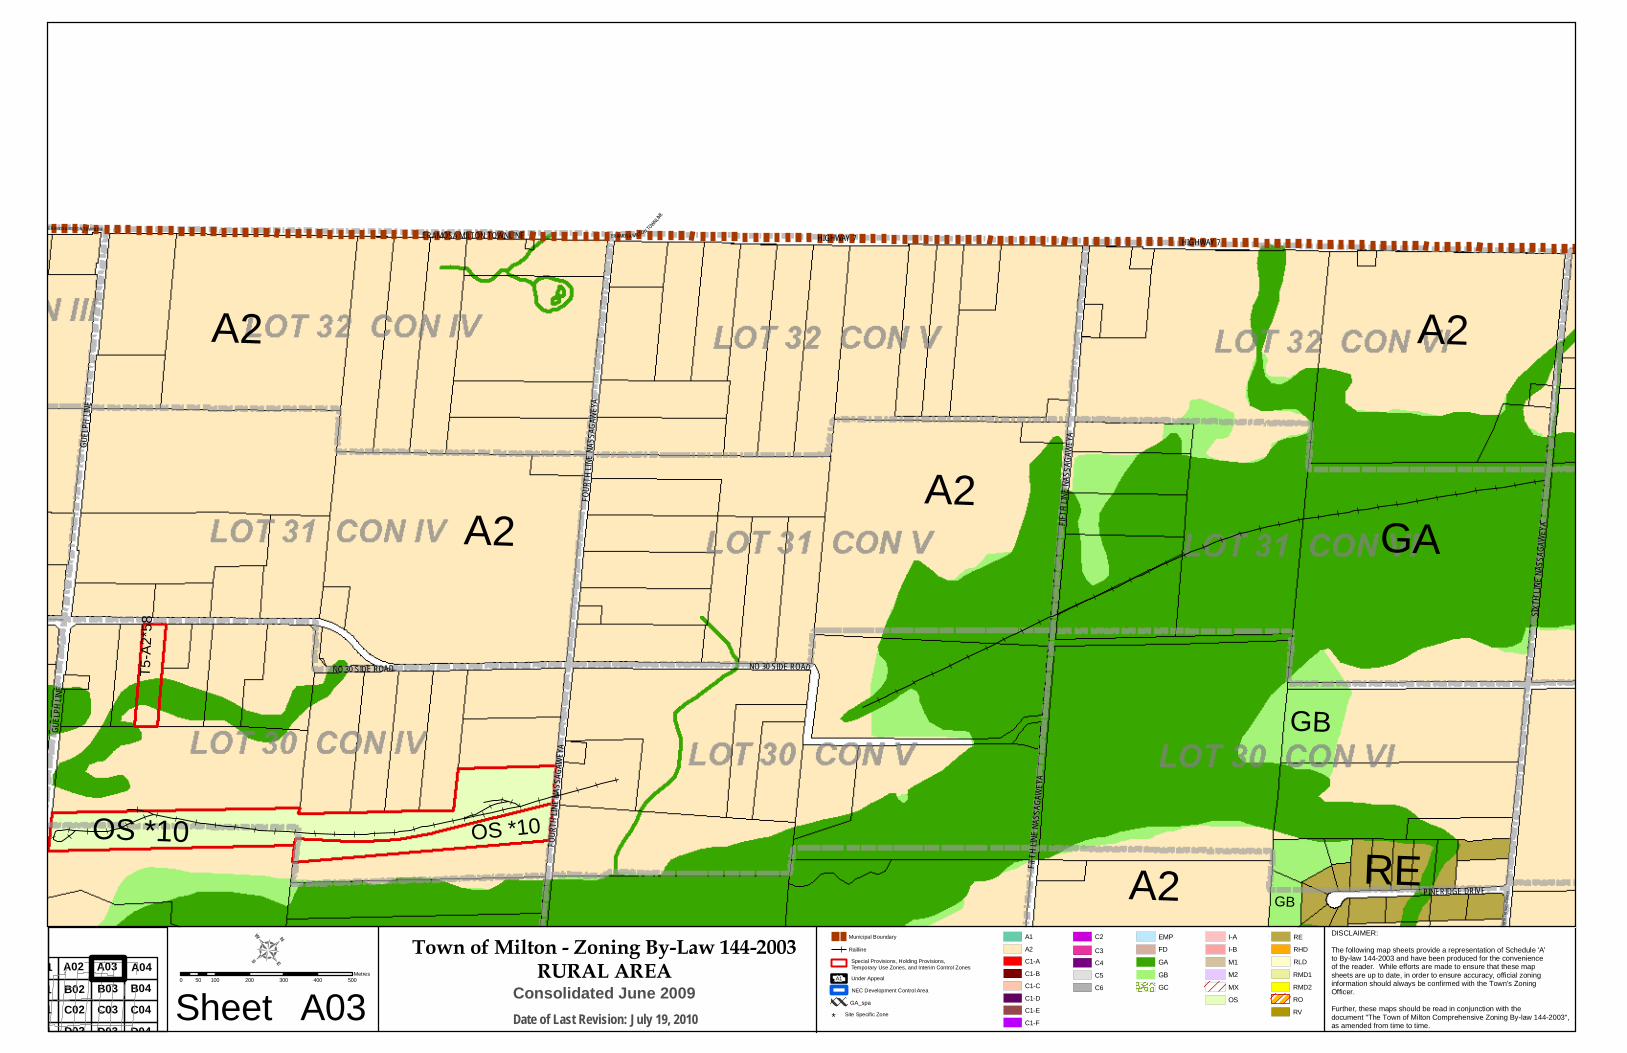
A03
A2
A2
A2A2
A2
A2
GB
A2A2
A2
T5-A
2*58
GA
GA
OS *10
GAGBRE
RE
GB
GB
A2
A2
OS *10
GA
HIGHWAY 7
NO 30 SIDE ROAD
HIGHWAY 7ERAMOSA MILTON TOWNLINE
HIGHWAY 7
SIXTH
L INE N
A SS A
G AWE
YA
ERAMOSA MILTON TOWNLINE
PINERIDGE DRIVE
GUEL
PH LIN
E
FI FT H
LI NE N
ASSA
GAWE
YA
F OU R
TH LI N
E NAS
SAGA
WEYA
GUE L
PH LIN
E
FOU R
T H LI N
E NAS
SAGA
WEYA
FIFTH
LINE N
ASSA
G AWE
YA
ERAMOSA MILTON TOWNLINE
NO 30 SIDE ROAD NO 30 SIDE ROAD
SIXTH
LI NE N
ASSA
GAWE
Y A
SheetDISCLAIMER: The following map sheets provide a representation of Schedule 'A'to By-law 144-2003 and have been produced for the convenienceof the reader. While efforts are made to ensure that these map sheets are up to date, in order to ensure accuracy, official zoninginformation should always be confirmed with the Town's Zoning Officer.Further, these maps should be read in conjunction with the document "The Town of Milton Comprehensive Zoning By-law 144-2003",as amended from time to time.
F03F02
A01 A02 A03 A04
E03 E04E02
C04D04
B04C03C02C01D03D02
B03
D01
B01 B02
C2C3C4C5C6
RERHDRLD
RMD2RORV
RMD1
I-AI-BM1
OS
M2MX
EMP
GAGBGC
FDA2C1-AC1-BC1-CC1-DC1-EC1-F
A1Railline
Site Specific Zone*GA_spaNEC Development Control Area
Special Provisions, Holding Provisions,Temporary Use Zones, and Interim Control ZonesUnder AppealA1
Municipal BoundaryTown of Milton - Zoning By-Law 144-2003RURAL AREA
Consolidated June 2009Date of Last Revision: July 19, 2010
0 100 200 300 400 50050Metres
4
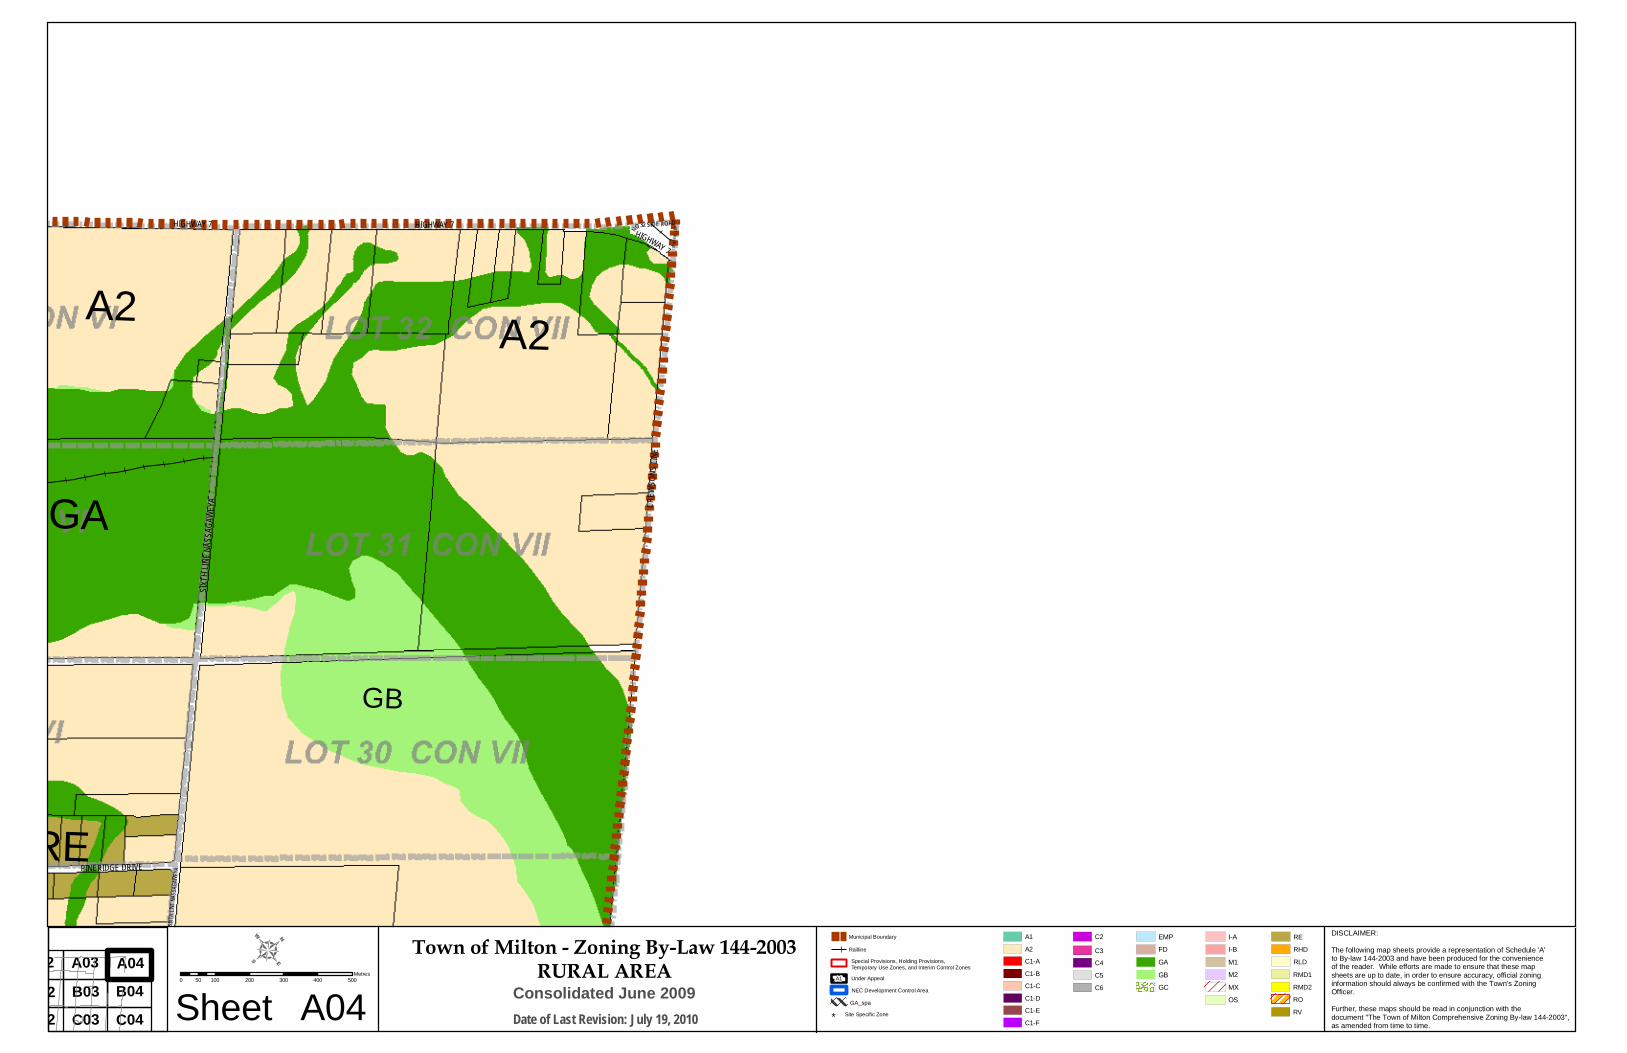
A04
A2
A2
GB
A2A2
GA
GA
RE
GB
GB
CRE W
SON S
LINEHIGHWAY 7
HIGHWAY 7
NO 32 SIDE ROAD
SI XTH
L INE N
ASSA
GAWE
YAPINERIDGE DRIVE
HIGHWAY 7
CREW
S ONS
LINE
SI XTH
L INE N
ASSA
G AWE
YA
SheetDISCLAIMER: The following map sheets provide a representation of Schedule 'A'to By-law 144-2003 and have been produced for the convenienceof the reader. While efforts are made to ensure that these map sheets are up to date, in order to ensure accuracy, official zoninginformation should always be confirmed with the Town's Zoning Officer.Further, these maps should be read in conjunction with the document "The Town of Milton Comprehensive Zoning By-law 144-2003",as amended from time to time.
A01 A02 A03 A04
E03 E04
C04D04
B04C03C02D03
B03B01 B02
C2C3C4C5C6
RERHDRLD
RMD2RORV
RMD1
I-AI-BM1
OS
M2MX
EMP
GAGBGC
FDA2C1-AC1-BC1-CC1-DC1-EC1-F
A1Railline
Site Specific Zone*GA_spaNEC Development Control Area
Special Provisions, Holding Provisions,Temporary Use Zones, and Interim Control ZonesUnder AppealA1
Municipal BoundaryTown of Milton - Zoning By-Law 144-2003RURAL AREA
Consolidated June 2009Date of Last Revision: July 19, 2010
0 100 200 300 400 50050Metres
4

Employee Job Title
APPENDIX APPENDIX A

Employee Job Title
APPENDIX APPENDIX B
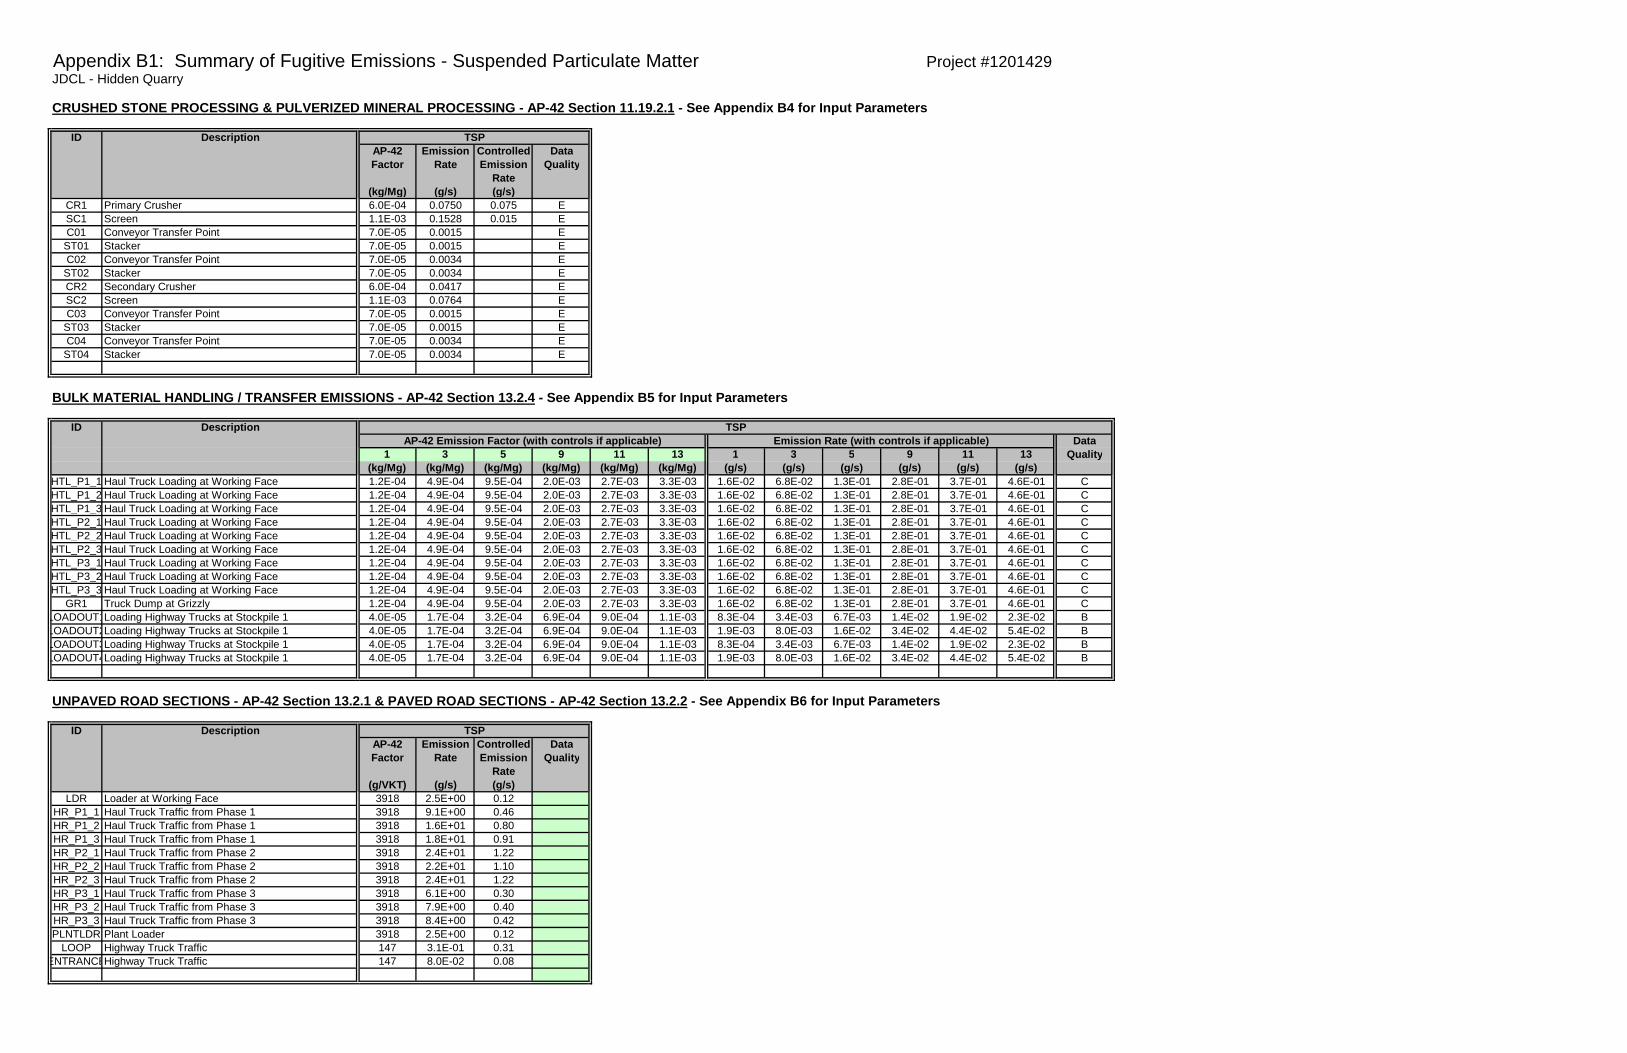
Appendix B1: Summary of Fugitive Emissions - Suspended Particulate Matter Project #1201429JDCL - Hidden Quarry
CRUSHED STONE PROCESSING & PULVERIZED MINERAL PROCESSING - AP-42 Section 11.19.2.1 - See Appendix B4 for Input Parameters
ID Description TSPAP-42 Emission Controlled DataFactor Rate Emission Quality
Rate(kg/Mg) (g/s) (g/s)
CR1 Primary Crusher 6.0E-04 0.0750 0.075 ESC1 Screen 1.1E-03 0.1528 0.015 EC01 Conveyor Transfer Point 7.0E-05 0.0015 E
ST01 Stacker 7.0E-05 0.0015 EC02 Conveyor Transfer Point 7.0E-05 0.0034 E
ST02 Stacker 7.0E-05 0.0034 ECR2 Secondary Crusher 6.0E-04 0.0417 ESC2 Screen 1.1E-03 0.0764 EC03 Conveyor Transfer Point 7.0E-05 0.0015 E
ST03 Stacker 7.0E-05 0.0015 EC04 Conveyor Transfer Point 7.0E-05 0.0034 E
ST04 Stacker 7.0E-05 0.0034 E
BULK MATERIAL HANDLING / TRANSFER EMISSIONS - AP-42 Section 13.2.4 - See Appendix B5 for Input Parameters
ID Description TSPAP-42 Emission Factor (with controls if applicable) Emission Rate (with controls if applicable) Data
1 3 5 9 11 13 1 3 5 9 11 13 Quality(kg/Mg) (kg/Mg) (kg/Mg) (kg/Mg) (kg/Mg) (kg/Mg) (g/s) (g/s) (g/s) (g/s) (g/s) (g/s)
HTL_P1_1 Haul Truck Loading at Working Face 1.2E-04 4.9E-04 9.5E-04 2.0E-03 2.7E-03 3.3E-03 1.6E-02 6.8E-02 1.3E-01 2.8E-01 3.7E-01 4.6E-01 CHTL_P1_2 Haul Truck Loading at Working Face 1.2E-04 4.9E-04 9.5E-04 2.0E-03 2.7E-03 3.3E-03 1.6E-02 6.8E-02 1.3E-01 2.8E-01 3.7E-01 4.6E-01 CHTL_P1_3 Haul Truck Loading at Working Face 1.2E-04 4.9E-04 9.5E-04 2.0E-03 2.7E-03 3.3E-03 1.6E-02 6.8E-02 1.3E-01 2.8E-01 3.7E-01 4.6E-01 CHTL_P2_1 Haul Truck Loading at Working Face 1.2E-04 4.9E-04 9.5E-04 2.0E-03 2.7E-03 3.3E-03 1.6E-02 6.8E-02 1.3E-01 2.8E-01 3.7E-01 4.6E-01 CHTL_P2_2 Haul Truck Loading at Working Face 1.2E-04 4.9E-04 9.5E-04 2.0E-03 2.7E-03 3.3E-03 1.6E-02 6.8E-02 1.3E-01 2.8E-01 3.7E-01 4.6E-01 CHTL_P2_3 Haul Truck Loading at Working Face 1.2E-04 4.9E-04 9.5E-04 2.0E-03 2.7E-03 3.3E-03 1.6E-02 6.8E-02 1.3E-01 2.8E-01 3.7E-01 4.6E-01 CHTL_P3_1 Haul Truck Loading at Working Face 1.2E-04 4.9E-04 9.5E-04 2.0E-03 2.7E-03 3.3E-03 1.6E-02 6.8E-02 1.3E-01 2.8E-01 3.7E-01 4.6E-01 CHTL_P3_2 Haul Truck Loading at Working Face 1.2E-04 4.9E-04 9.5E-04 2.0E-03 2.7E-03 3.3E-03 1.6E-02 6.8E-02 1.3E-01 2.8E-01 3.7E-01 4.6E-01 CHTL_P3_3 Haul Truck Loading at Working Face 1.2E-04 4.9E-04 9.5E-04 2.0E-03 2.7E-03 3.3E-03 1.6E-02 6.8E-02 1.3E-01 2.8E-01 3.7E-01 4.6E-01 C
GR1 Truck Dump at Grizzly 1.2E-04 4.9E-04 9.5E-04 2.0E-03 2.7E-03 3.3E-03 1.6E-02 6.8E-02 1.3E-01 2.8E-01 3.7E-01 4.6E-01 CLOADOUT1Loading Highway Trucks at Stockpile 1 4.0E-05 1.7E-04 3.2E-04 6.9E-04 9.0E-04 1.1E-03 8.3E-04 3.4E-03 6.7E-03 1.4E-02 1.9E-02 2.3E-02 BLOADOUT2Loading Highway Trucks at Stockpile 1 4.0E-05 1.7E-04 3.2E-04 6.9E-04 9.0E-04 1.1E-03 1.9E-03 8.0E-03 1.6E-02 3.4E-02 4.4E-02 5.4E-02 BLOADOUT3Loading Highway Trucks at Stockpile 1 4.0E-05 1.7E-04 3.2E-04 6.9E-04 9.0E-04 1.1E-03 8.3E-04 3.4E-03 6.7E-03 1.4E-02 1.9E-02 2.3E-02 BLOADOUT4Loading Highway Trucks at Stockpile 1 4.0E-05 1.7E-04 3.2E-04 6.9E-04 9.0E-04 1.1E-03 1.9E-03 8.0E-03 1.6E-02 3.4E-02 4.4E-02 5.4E-02 B
UNPAVED ROAD SECTIONS - AP-42 Section 13.2.1 & PAVED ROAD SECTIONS - AP-42 Section 13.2.2 - See Appendix B6 for Input Parameters
ID Description TSPAP-42 Emission Controlled DataFactor Rate Emission Quality
Rate(g/VKT) (g/s) (g/s)
LDR Loader at Working Face 3918 2.5E+00 0.12HR_P1_1 Haul Truck Traffic from Phase 1 3918 9.1E+00 0.46HR_P1_2 Haul Truck Traffic from Phase 1 3918 1.6E+01 0.80HR_P1_3 Haul Truck Traffic from Phase 1 3918 1.8E+01 0.91HR_P2_1 Haul Truck Traffic from Phase 2 3918 2.4E+01 1.22HR_P2_2 Haul Truck Traffic from Phase 2 3918 2.2E+01 1.10HR_P2_3 Haul Truck Traffic from Phase 2 3918 2.4E+01 1.22HR_P3_1 Haul Truck Traffic from Phase 3 3918 6.1E+00 0.30HR_P3_2 Haul Truck Traffic from Phase 3 3918 7.9E+00 0.40HR_P3_3 Haul Truck Traffic from Phase 3 3918 8.4E+00 0.42PLNTLDR Plant Loader 3918 2.5E+00 0.12
LOOP Highway Truck Traffic 147 3.1E-01 0.31ENTRANCEHighway Truck Traffic 147 8.0E-02 0.08
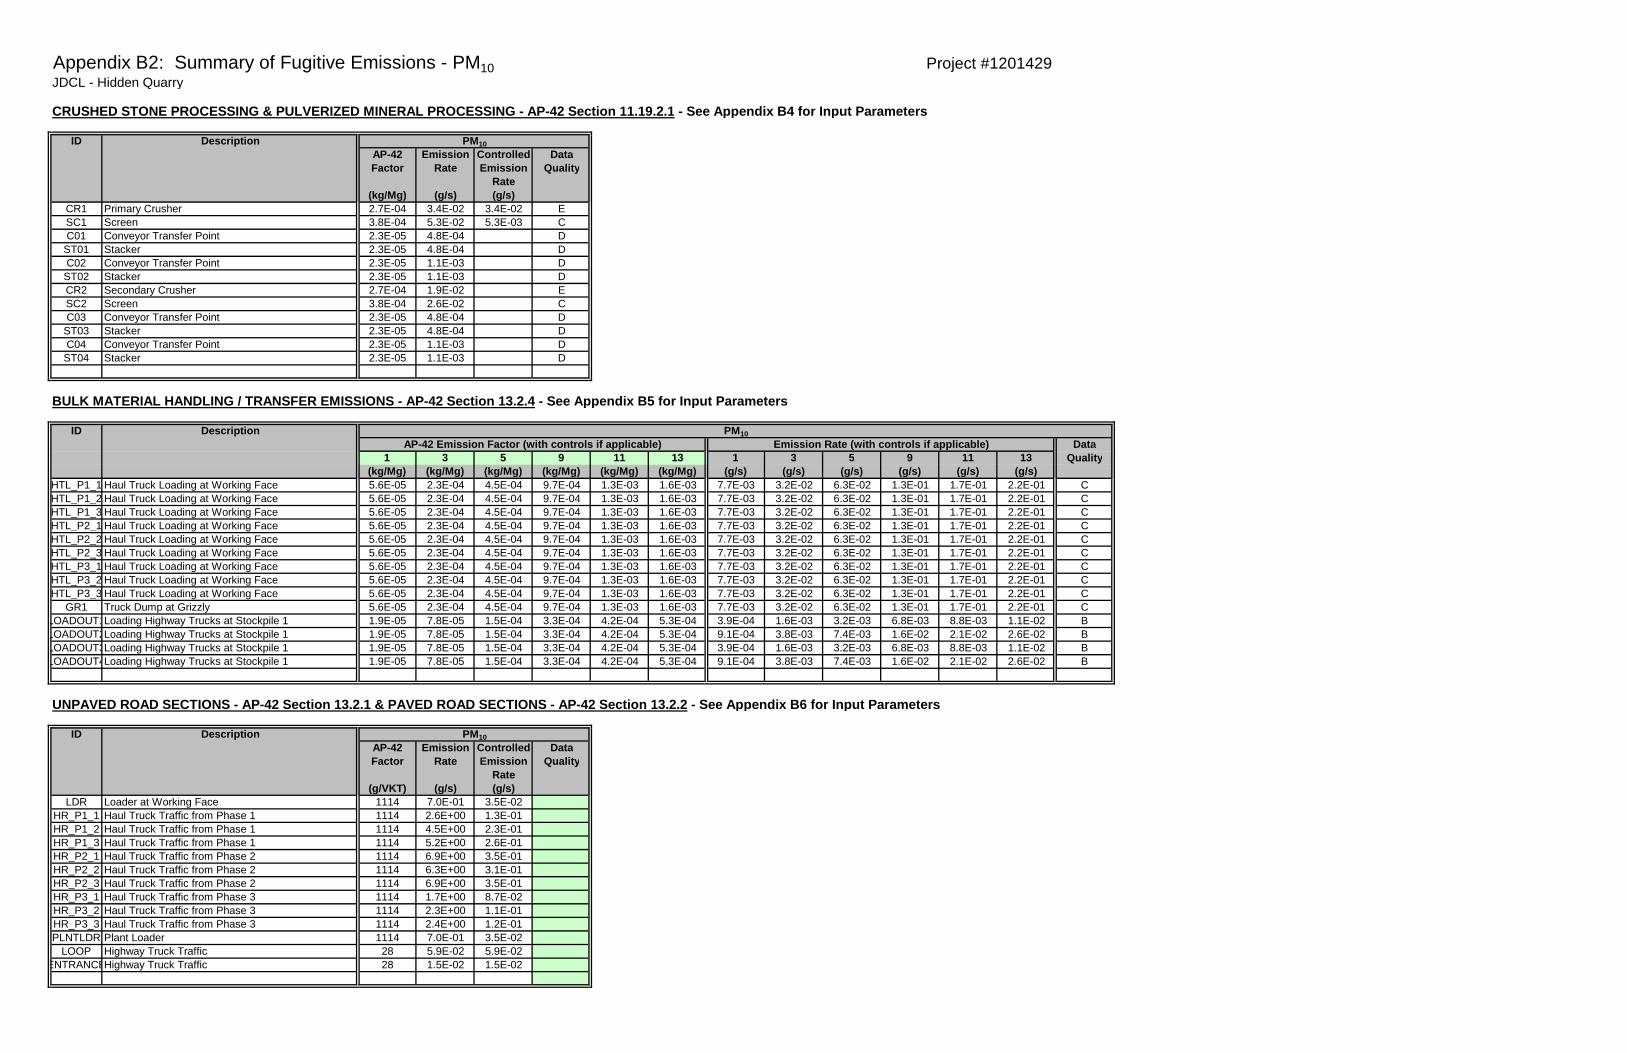
Appendix B2: Summary of Fugitive Emissions - PM10 Project #1201429JDCL - Hidden Quarry
CRUSHED STONE PROCESSING & PULVERIZED MINERAL PROCESSING - AP-42 Section 11.19.2.1 - See Appendix B4 for Input Parameters
ID Description PM10
AP-42 Emission Controlled DataFactor Rate Emission Quality
Rate(kg/Mg) (g/s) (g/s)
CR1 Primary Crusher 2.7E-04 3.4E-02 3.4E-02 ESC1 Screen 3.8E-04 5.3E-02 5.3E-03 CC01 Conveyor Transfer Point 2.3E-05 4.8E-04 D
ST01 Stacker 2.3E-05 4.8E-04 DC02 Conveyor Transfer Point 2.3E-05 1.1E-03 D
ST02 Stacker 2.3E-05 1.1E-03 DCR2 Secondary Crusher 2.7E-04 1.9E-02 ESC2 Screen 3.8E-04 2.6E-02 CC03 Conveyor Transfer Point 2.3E-05 4.8E-04 D
ST03 Stacker 2.3E-05 4.8E-04 DC04 Conveyor Transfer Point 2.3E-05 1.1E-03 D
ST04 Stacker 2.3E-05 1.1E-03 D
BULK MATERIAL HANDLING / TRANSFER EMISSIONS - AP-42 Section 13.2.4 - See Appendix B5 for Input Parameters
ID Description PM10
AP-42 Emission Factor (with controls if applicable) Emission Rate (with controls if applicable) Data1 3 5 9 11 13 1 3 5 9 11 13 Quality
(kg/Mg) (kg/Mg) (kg/Mg) (kg/Mg) (kg/Mg) (kg/Mg) (g/s) (g/s) (g/s) (g/s) (g/s) (g/s)HTL_P1_1 Haul Truck Loading at Working Face 5.6E-05 2.3E-04 4.5E-04 9.7E-04 1.3E-03 1.6E-03 7.7E-03 3.2E-02 6.3E-02 1.3E-01 1.7E-01 2.2E-01 CHTL_P1_2 Haul Truck Loading at Working Face 5.6E-05 2.3E-04 4.5E-04 9.7E-04 1.3E-03 1.6E-03 7.7E-03 3.2E-02 6.3E-02 1.3E-01 1.7E-01 2.2E-01 CHTL_P1_3 Haul Truck Loading at Working Face 5.6E-05 2.3E-04 4.5E-04 9.7E-04 1.3E-03 1.6E-03 7.7E-03 3.2E-02 6.3E-02 1.3E-01 1.7E-01 2.2E-01 CHTL_P2_1 Haul Truck Loading at Working Face 5.6E-05 2.3E-04 4.5E-04 9.7E-04 1.3E-03 1.6E-03 7.7E-03 3.2E-02 6.3E-02 1.3E-01 1.7E-01 2.2E-01 CHTL_P2_2 Haul Truck Loading at Working Face 5.6E-05 2.3E-04 4.5E-04 9.7E-04 1.3E-03 1.6E-03 7.7E-03 3.2E-02 6.3E-02 1.3E-01 1.7E-01 2.2E-01 CHTL_P2_3 Haul Truck Loading at Working Face 5.6E-05 2.3E-04 4.5E-04 9.7E-04 1.3E-03 1.6E-03 7.7E-03 3.2E-02 6.3E-02 1.3E-01 1.7E-01 2.2E-01 CHTL_P3_1 Haul Truck Loading at Working Face 5.6E-05 2.3E-04 4.5E-04 9.7E-04 1.3E-03 1.6E-03 7.7E-03 3.2E-02 6.3E-02 1.3E-01 1.7E-01 2.2E-01 CHTL_P3_2 Haul Truck Loading at Working Face 5.6E-05 2.3E-04 4.5E-04 9.7E-04 1.3E-03 1.6E-03 7.7E-03 3.2E-02 6.3E-02 1.3E-01 1.7E-01 2.2E-01 CHTL_P3_3 Haul Truck Loading at Working Face 5.6E-05 2.3E-04 4.5E-04 9.7E-04 1.3E-03 1.6E-03 7.7E-03 3.2E-02 6.3E-02 1.3E-01 1.7E-01 2.2E-01 C
GR1 Truck Dump at Grizzly 5.6E-05 2.3E-04 4.5E-04 9.7E-04 1.3E-03 1.6E-03 7.7E-03 3.2E-02 6.3E-02 1.3E-01 1.7E-01 2.2E-01 CLOADOUT1Loading Highway Trucks at Stockpile 1 1.9E-05 7.8E-05 1.5E-04 3.3E-04 4.2E-04 5.3E-04 3.9E-04 1.6E-03 3.2E-03 6.8E-03 8.8E-03 1.1E-02 BLOADOUT2Loading Highway Trucks at Stockpile 1 1.9E-05 7.8E-05 1.5E-04 3.3E-04 4.2E-04 5.3E-04 9.1E-04 3.8E-03 7.4E-03 1.6E-02 2.1E-02 2.6E-02 BLOADOUT3Loading Highway Trucks at Stockpile 1 1.9E-05 7.8E-05 1.5E-04 3.3E-04 4.2E-04 5.3E-04 3.9E-04 1.6E-03 3.2E-03 6.8E-03 8.8E-03 1.1E-02 BLOADOUT4Loading Highway Trucks at Stockpile 1 1.9E-05 7.8E-05 1.5E-04 3.3E-04 4.2E-04 5.3E-04 9.1E-04 3.8E-03 7.4E-03 1.6E-02 2.1E-02 2.6E-02 B
UNPAVED ROAD SECTIONS - AP-42 Section 13.2.1 & PAVED ROAD SECTIONS - AP-42 Section 13.2.2 - See Appendix B6 for Input Parameters
ID Description PM10
AP-42 Emission Controlled DataFactor Rate Emission Quality
Rate(g/VKT) (g/s) (g/s)
LDR Loader at Working Face 1114 7.0E-01 3.5E-02HR_P1_1 Haul Truck Traffic from Phase 1 1114 2.6E+00 1.3E-01HR_P1_2 Haul Truck Traffic from Phase 1 1114 4.5E+00 2.3E-01HR_P1_3 Haul Truck Traffic from Phase 1 1114 5.2E+00 2.6E-01HR_P2_1 Haul Truck Traffic from Phase 2 1114 6.9E+00 3.5E-01HR_P2_2 Haul Truck Traffic from Phase 2 1114 6.3E+00 3.1E-01HR_P2_3 Haul Truck Traffic from Phase 2 1114 6.9E+00 3.5E-01HR_P3_1 Haul Truck Traffic from Phase 3 1114 1.7E+00 8.7E-02HR_P3_2 Haul Truck Traffic from Phase 3 1114 2.3E+00 1.1E-01HR_P3_3 Haul Truck Traffic from Phase 3 1114 2.4E+00 1.2E-01PLNTLDR Plant Loader 1114 7.0E-01 3.5E-02
LOOP Highway Truck Traffic 28 5.9E-02 5.9E-02ENTRANCEHighway Truck Traffic 28 1.5E-02 1.5E-02
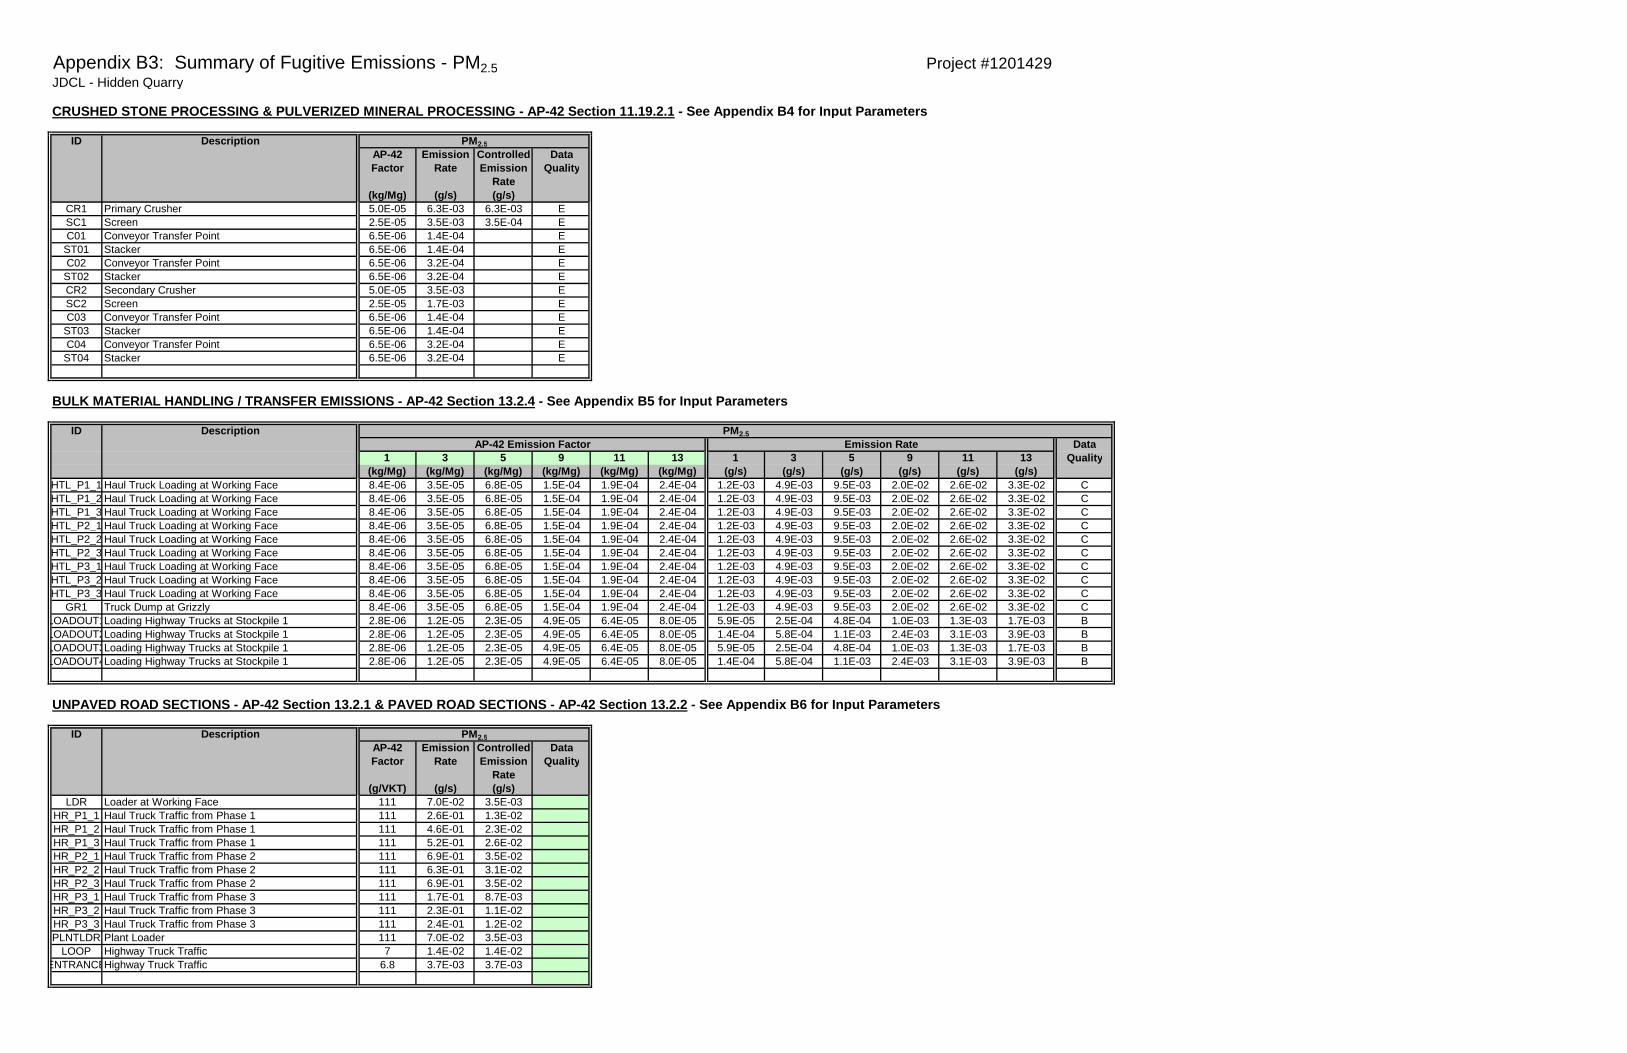
Appendix B3: Summary of Fugitive Emissions - PM2.5 Project #1201429JDCL - Hidden Quarry
CRUSHED STONE PROCESSING & PULVERIZED MINERAL PROCESSING - AP-42 Section 11.19.2.1 - See Appendix B4 for Input Parameters
ID Description PM2.5
AP-42 Emission Controlled DataFactor Rate Emission Quality
Rate(kg/Mg) (g/s) (g/s)
CR1 Primary Crusher 5.0E-05 6.3E-03 6.3E-03 ESC1 Screen 2.5E-05 3.5E-03 3.5E-04 EC01 Conveyor Transfer Point 6.5E-06 1.4E-04 E
ST01 Stacker 6.5E-06 1.4E-04 EC02 Conveyor Transfer Point 6.5E-06 3.2E-04 E
ST02 Stacker 6.5E-06 3.2E-04 ECR2 Secondary Crusher 5.0E-05 3.5E-03 ESC2 Screen 2.5E-05 1.7E-03 EC03 Conveyor Transfer Point 6.5E-06 1.4E-04 E
ST03 Stacker 6.5E-06 1.4E-04 EC04 Conveyor Transfer Point 6.5E-06 3.2E-04 E
ST04 Stacker 6.5E-06 3.2E-04 E
BULK MATERIAL HANDLING / TRANSFER EMISSIONS - AP-42 Section 13.2.4 - See Appendix B5 for Input Parameters
ID Description PM2.5
AP-42 Emission Factor Emission Rate Data1 3 5 9 11 13 1 3 5 9 11 13 Quality
(kg/Mg) (kg/Mg) (kg/Mg) (kg/Mg) (kg/Mg) (kg/Mg) (g/s) (g/s) (g/s) (g/s) (g/s) (g/s)HTL_P1_1 Haul Truck Loading at Working Face 8.4E-06 3.5E-05 6.8E-05 1.5E-04 1.9E-04 2.4E-04 1.2E-03 4.9E-03 9.5E-03 2.0E-02 2.6E-02 3.3E-02 CHTL_P1_2 Haul Truck Loading at Working Face 8.4E-06 3.5E-05 6.8E-05 1.5E-04 1.9E-04 2.4E-04 1.2E-03 4.9E-03 9.5E-03 2.0E-02 2.6E-02 3.3E-02 CHTL_P1_3 Haul Truck Loading at Working Face 8.4E-06 3.5E-05 6.8E-05 1.5E-04 1.9E-04 2.4E-04 1.2E-03 4.9E-03 9.5E-03 2.0E-02 2.6E-02 3.3E-02 CHTL_P2_1 Haul Truck Loading at Working Face 8.4E-06 3.5E-05 6.8E-05 1.5E-04 1.9E-04 2.4E-04 1.2E-03 4.9E-03 9.5E-03 2.0E-02 2.6E-02 3.3E-02 CHTL_P2_2 Haul Truck Loading at Working Face 8.4E-06 3.5E-05 6.8E-05 1.5E-04 1.9E-04 2.4E-04 1.2E-03 4.9E-03 9.5E-03 2.0E-02 2.6E-02 3.3E-02 CHTL_P2_3 Haul Truck Loading at Working Face 8.4E-06 3.5E-05 6.8E-05 1.5E-04 1.9E-04 2.4E-04 1.2E-03 4.9E-03 9.5E-03 2.0E-02 2.6E-02 3.3E-02 CHTL_P3_1 Haul Truck Loading at Working Face 8.4E-06 3.5E-05 6.8E-05 1.5E-04 1.9E-04 2.4E-04 1.2E-03 4.9E-03 9.5E-03 2.0E-02 2.6E-02 3.3E-02 CHTL_P3_2 Haul Truck Loading at Working Face 8.4E-06 3.5E-05 6.8E-05 1.5E-04 1.9E-04 2.4E-04 1.2E-03 4.9E-03 9.5E-03 2.0E-02 2.6E-02 3.3E-02 CHTL_P3_3 Haul Truck Loading at Working Face 8.4E-06 3.5E-05 6.8E-05 1.5E-04 1.9E-04 2.4E-04 1.2E-03 4.9E-03 9.5E-03 2.0E-02 2.6E-02 3.3E-02 C
GR1 Truck Dump at Grizzly 8.4E-06 3.5E-05 6.8E-05 1.5E-04 1.9E-04 2.4E-04 1.2E-03 4.9E-03 9.5E-03 2.0E-02 2.6E-02 3.3E-02 CLOADOUT1Loading Highway Trucks at Stockpile 1 2.8E-06 1.2E-05 2.3E-05 4.9E-05 6.4E-05 8.0E-05 5.9E-05 2.5E-04 4.8E-04 1.0E-03 1.3E-03 1.7E-03 BLOADOUT2Loading Highway Trucks at Stockpile 1 2.8E-06 1.2E-05 2.3E-05 4.9E-05 6.4E-05 8.0E-05 1.4E-04 5.8E-04 1.1E-03 2.4E-03 3.1E-03 3.9E-03 BLOADOUT3Loading Highway Trucks at Stockpile 1 2.8E-06 1.2E-05 2.3E-05 4.9E-05 6.4E-05 8.0E-05 5.9E-05 2.5E-04 4.8E-04 1.0E-03 1.3E-03 1.7E-03 BLOADOUT4Loading Highway Trucks at Stockpile 1 2.8E-06 1.2E-05 2.3E-05 4.9E-05 6.4E-05 8.0E-05 1.4E-04 5.8E-04 1.1E-03 2.4E-03 3.1E-03 3.9E-03 B
UNPAVED ROAD SECTIONS - AP-42 Section 13.2.1 & PAVED ROAD SECTIONS - AP-42 Section 13.2.2 - See Appendix B6 for Input Parameters
ID Description PM2.5
AP-42 Emission Controlled DataFactor Rate Emission Quality
Rate(g/VKT) (g/s) (g/s)
LDR Loader at Working Face 111 7.0E-02 3.5E-03HR_P1_1 Haul Truck Traffic from Phase 1 111 2.6E-01 1.3E-02HR_P1_2 Haul Truck Traffic from Phase 1 111 4.6E-01 2.3E-02HR_P1_3 Haul Truck Traffic from Phase 1 111 5.2E-01 2.6E-02HR_P2_1 Haul Truck Traffic from Phase 2 111 6.9E-01 3.5E-02HR_P2_2 Haul Truck Traffic from Phase 2 111 6.3E-01 3.1E-02HR_P2_3 Haul Truck Traffic from Phase 2 111 6.9E-01 3.5E-02HR_P3_1 Haul Truck Traffic from Phase 3 111 1.7E-01 8.7E-03HR_P3_2 Haul Truck Traffic from Phase 3 111 2.3E-01 1.1E-02HR_P3_3 Haul Truck Traffic from Phase 3 111 2.4E-01 1.2E-02PLNTLDR Plant Loader 111 7.0E-02 3.5E-03
LOOP Highway Truck Traffic 7 1.4E-02 1.4E-02ENTRANCEHighway Truck Traffic 6.8 3.7E-03 3.7E-03
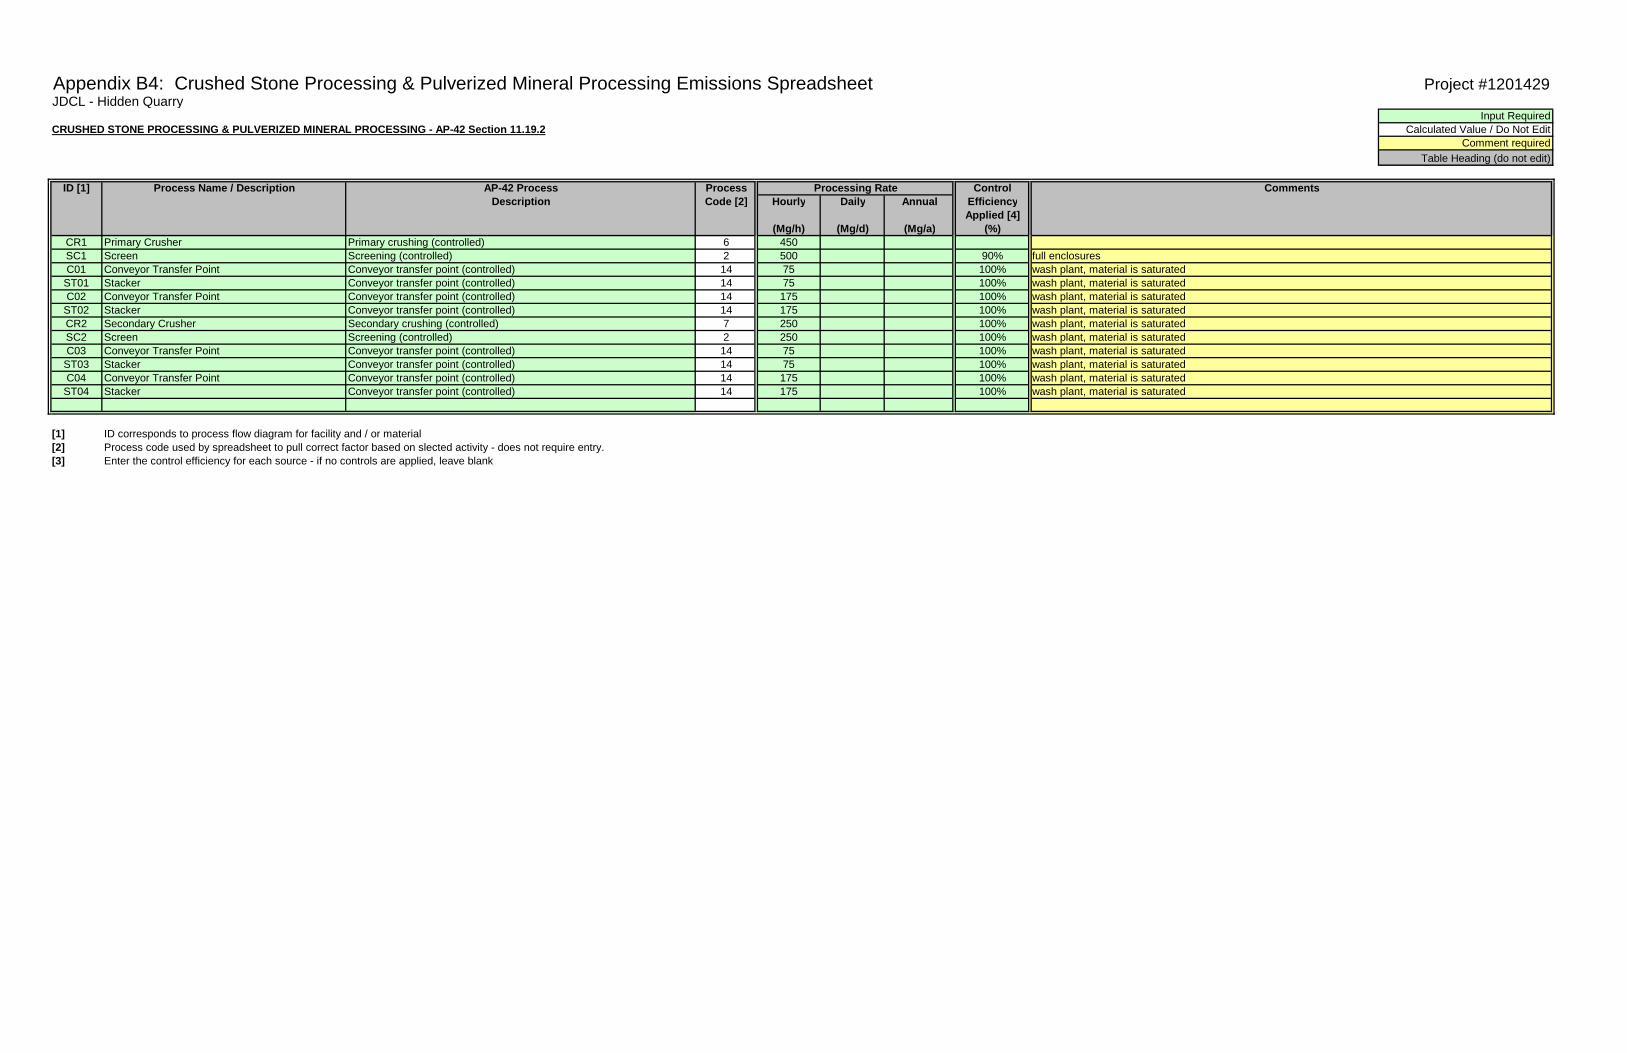
Appendix B4: Crushed Stone Processing & Pulverized Mineral Processing Emissions Spreadsheet Project #1201429JDCL - Hidden Quarry
Input RequiredCRUSHED STONE PROCESSING & PULVERIZED MINERAL PROCESSING - AP-42 Section 11.19.2 Calculated Value / Do Not Edit
Comment requiredTable Heading (do not edit)
ID [1] Process Name / Description AP-42 Process Process Processing Rate Control CommentsDescription Code [2] Hourly Daily Annual Efficiency
Applied [4](Mg/h) (Mg/d) (Mg/a) (%)
CR1 Primary Crusher 6 450SC1 Screen 2 500 90% full enclosuresC01 Conveyor Transfer Point 14 75 100% wash plant, material is saturated
ST01 Stacker 14 75 100% wash plant, material is saturatedC02 Conveyor Transfer Point 14 175 100% wash plant, material is saturated
ST02 Stacker 14 175 100% wash plant, material is saturatedCR2 Secondary Crusher 7 250 100% wash plant, material is saturatedSC2 Screen 2 250 100% wash plant, material is saturatedC03 Conveyor Transfer Point Conveyor transfer point (controlled) 14 75 100% wash plant, material is saturated
ST03 Stacker Conveyor transfer point (controlled) 14 75 100% wash plant, material is saturatedC04 Conveyor Transfer Point Conveyor transfer point (controlled) 14 175 100% wash plant, material is saturated
ST04 Stacker 14 175 100% wash plant, material is saturated
[1] ID corresponds to process flow diagram for facility and / or material[2] Process code used by spreadsheet to pull correct factor based on slected activity - does not require entry.[3] Enter the control efficiency for each source - if no controls are applied, leave blank
Conveyor transfer point (controlled)
Conveyor transfer point (controlled)
Primary crushing (controlled)Screening (controlled)Conveyor transfer point (controlled)
Screening (controlled)Secondary crushing (controlled)Conveyor transfer point (controlled)Conveyor transfer point (controlled)
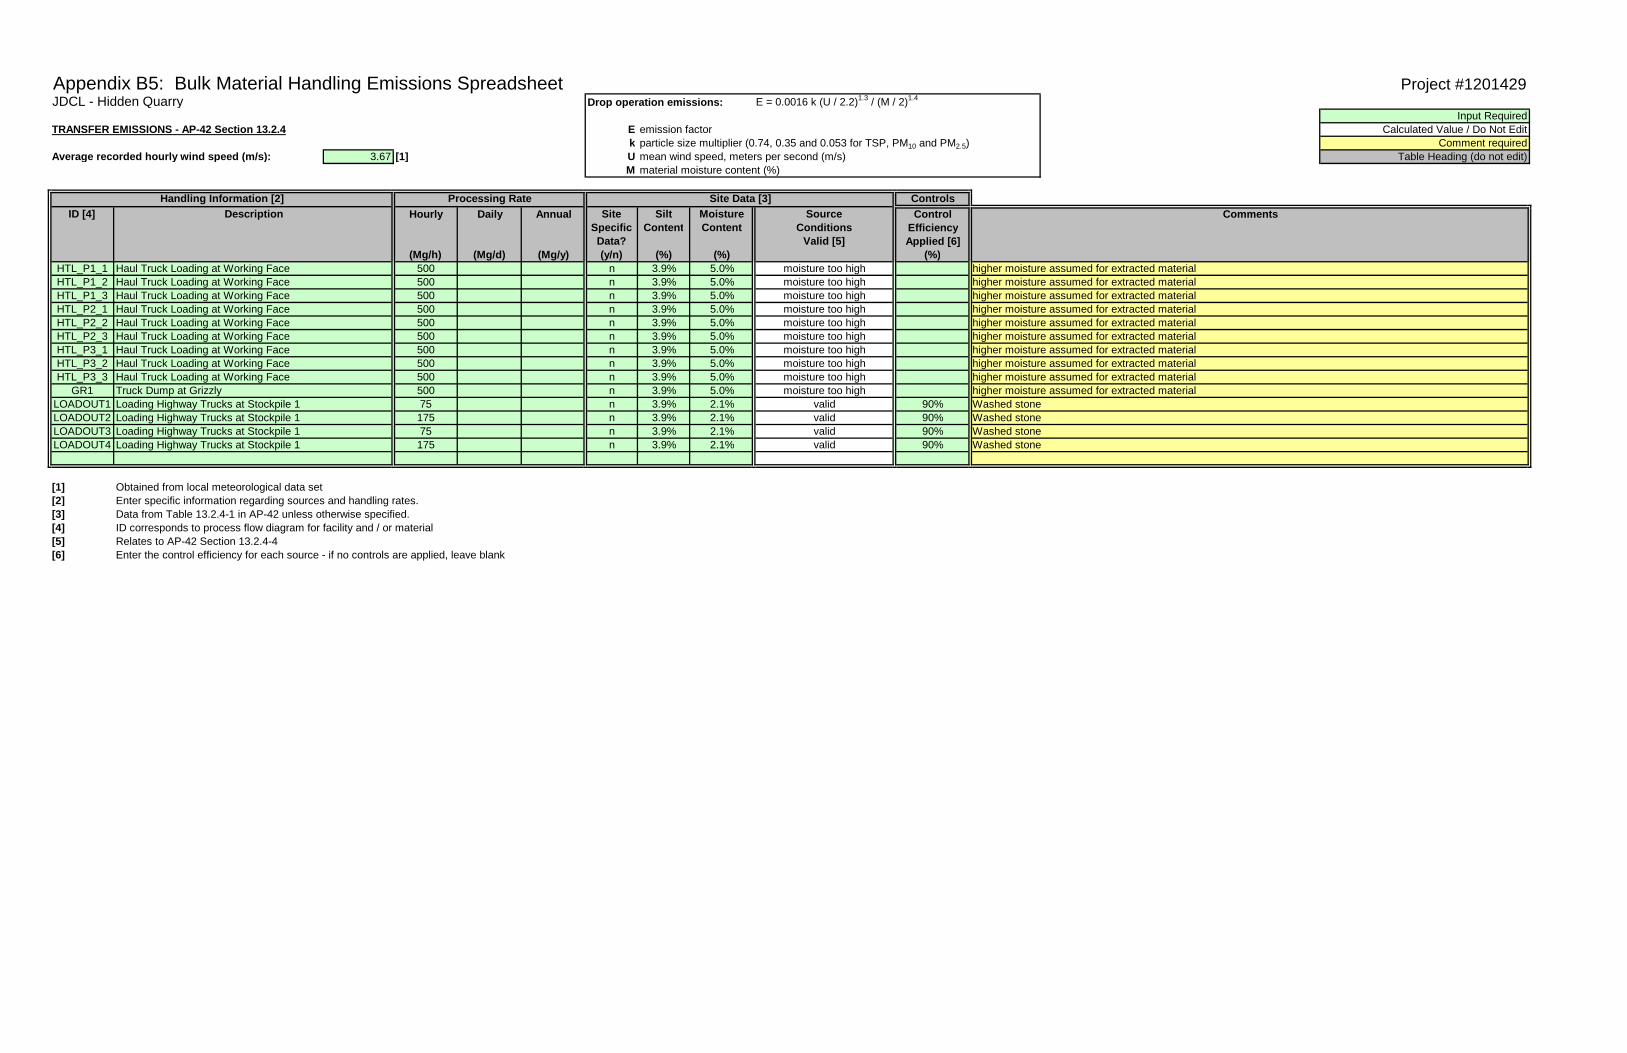
Appendix B5: Bulk Material Handling Emissions Spreadsheet Project #1201429JDCL - Hidden Quarry Drop operation emissions: E = 0.0016 k (U / 2.2)1.3 / (M / 2)1.4
Input RequiredTRANSFER EMISSIONS - AP-42 Section 13.2.4 E emission factor Calculated Value / Do Not Edit
k particle size multiplier (0.74, 0.35 and 0.053 for TSP, PM10 and PM2.5) Comment requiredAverage recorded hourly wind speed (m/s): 3.67 [1] U mean wind speed, meters per second (m/s) Table Heading (do not edit)
M material moisture content (%)
Handling Information [2] Processing Rate Site Data [3] ControlsID [4] Description Hourly Daily Annual Site Silt Moisture Source Control Comments
Specific Content Content Conditions EfficiencyData? Valid [5] Applied [6]
(Mg/h) (Mg/d) (Mg/y) (y/n) (%) (%) (%)HTL_P1_1 Haul Truck Loading at Working Face 500 n 3.9% 5.0% moisture too high higher moisture assumed for extracted materialHTL_P1_2 Haul Truck Loading at Working Face 500 n 3.9% 5.0% moisture too high higher moisture assumed for extracted materialHTL_P1_3 Haul Truck Loading at Working Face 500 n 3.9% 5.0% moisture too high higher moisture assumed for extracted materialHTL_P2_1 Haul Truck Loading at Working Face 500 n 3.9% 5.0% moisture too high higher moisture assumed for extracted materialHTL_P2_2 Haul Truck Loading at Working Face 500 n 3.9% 5.0% moisture too high higher moisture assumed for extracted materialHTL_P2_3 Haul Truck Loading at Working Face 500 n 3.9% 5.0% moisture too high higher moisture assumed for extracted materialHTL_P3_1 Haul Truck Loading at Working Face 500 n 3.9% 5.0% moisture too high higher moisture assumed for extracted materialHTL_P3_2 Haul Truck Loading at Working Face 500 n 3.9% 5.0% moisture too high higher moisture assumed for extracted materialHTL_P3_3 Haul Truck Loading at Working Face 500 n 3.9% 5.0% moisture too high higher moisture assumed for extracted material
GR1 Truck Dump at Grizzly 500 n 3.9% 5.0% moisture too high higher moisture assumed for extracted materialLOADOUT1 Loading Highway Trucks at Stockpile 1 75 n 3.9% 2.1% valid 90% Washed stoneLOADOUT2 Loading Highway Trucks at Stockpile 1 175 n 3.9% 2.1% valid 90% Washed stoneLOADOUT3 Loading Highway Trucks at Stockpile 1 75 n 3.9% 2.1% valid 90% Washed stoneLOADOUT4 Loading Highway Trucks at Stockpile 1 175 n 3.9% 2.1% valid 90% Washed stone
[1] Obtained from local meteorological data set[2] Enter specific information regarding sources and handling rates.[3] Data from Table 13.2.4-1 in AP-42 unless otherwise specified.[4] ID corresponds to process flow diagram for facility and / or material[5] Relates to AP-42 Section 13.2.4-4[6] Enter the control efficiency for each source - if no controls are applied, leave blank
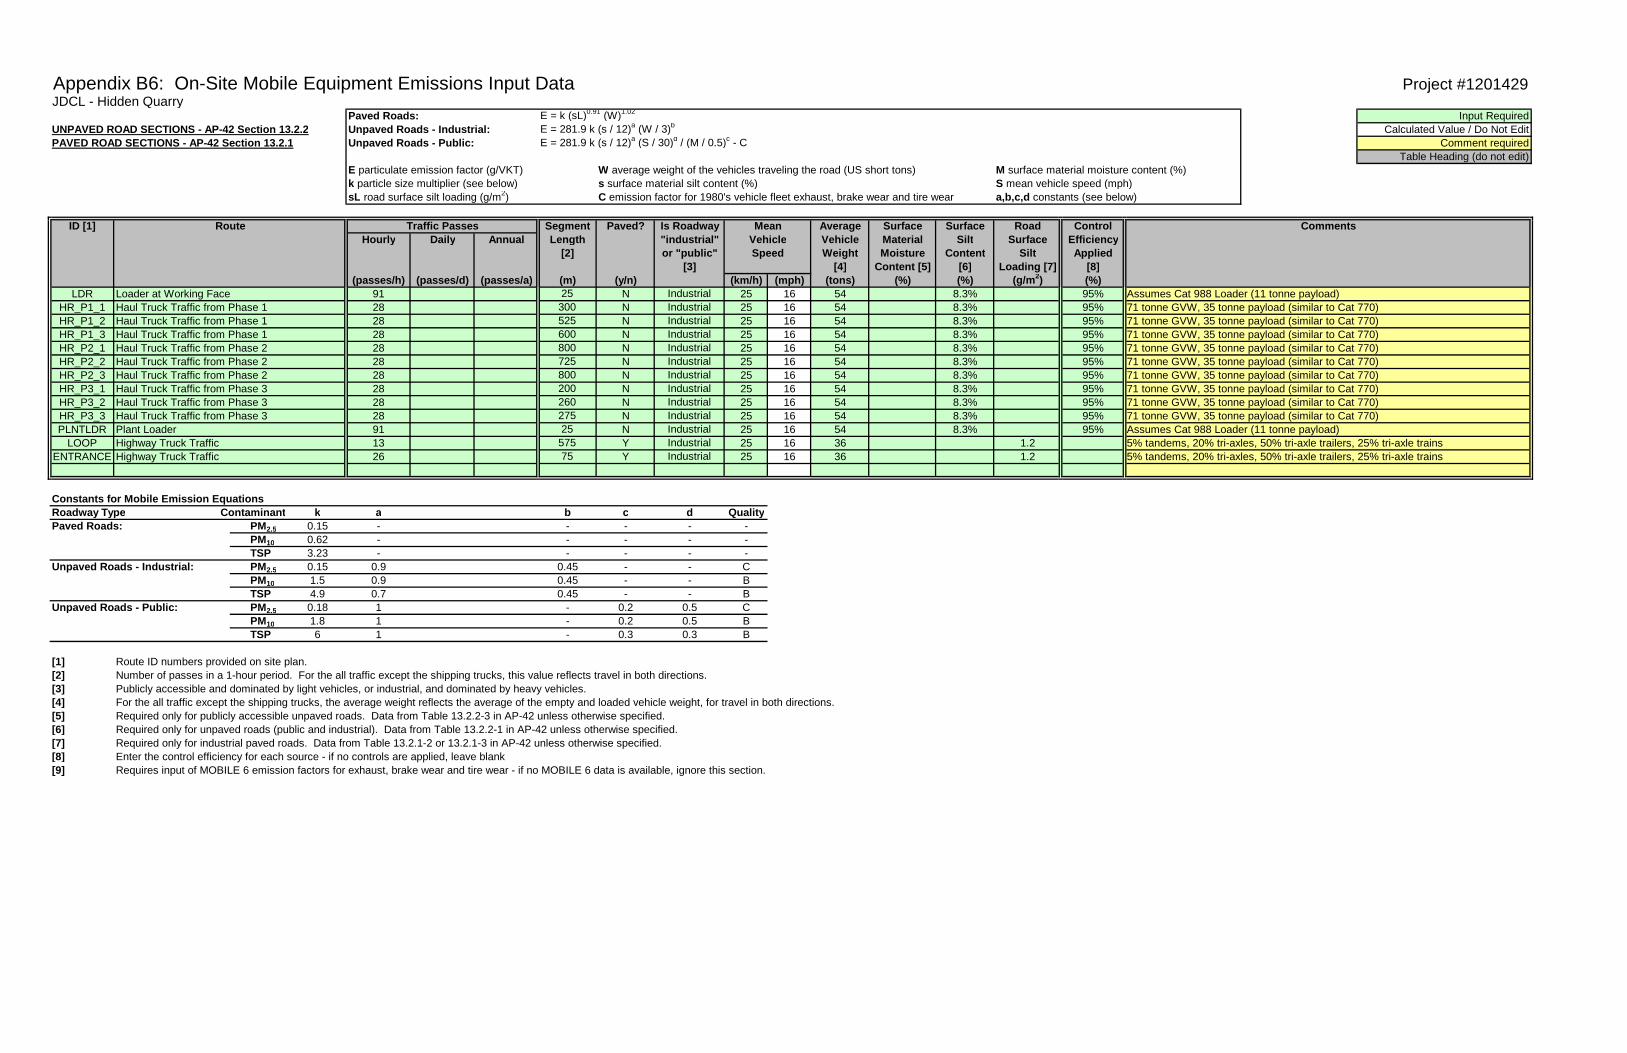
Appendix B6: On-Site Mobile Equipment Emissions Input Data Project #1201429JDCL - Hidden Quarry
Paved Roads: E = k (sL)0.91 (W)1.02 Input RequiredUNPAVED ROAD SECTIONS - AP-42 Section 13.2.2 Unpaved Roads - Industrial: E = 281.9 k (s / 12)a (W / 3)b Calculated Value / Do Not EditPAVED ROAD SECTIONS - AP-42 Section 13.2.1 Unpaved Roads - Public: E = 281.9 k (s / 12)a (S / 30)d / (M / 0.5)c - C Comment required
Table Heading (do not edit)E particulate emission factor (g/VKT) W average weight of the vehicles traveling the road (US short tons) M surface material moisture content (%)k particle size multiplier (see below) s surface material silt content (%) S mean vehicle speed (mph)sL road surface silt loading (g/m2) C emission factor for 1980's vehicle fleet exhaust, brake wear and tire wear a,b,c,d constants (see below)
ID [1] Route Traffic Passes Segment Paved? Is Roadway Mean Average Surface Surface Road Control CommentsHourly Daily Annual Length "industrial" Vehicle Vehicle Material Silt Surface Efficiency
[2] or "public" Speed Weight Moisture Content Silt Applied[3] [4] Content [5] [6] Loading [7] [8]
(passes/h) (passes/d) (passes/a) (m) (y/n) (km/h) (mph) (tons) (%) (%) (g/m2) (%)LDR Loader at Working Face 91 25 N Industrial 25 16 54 8.3% 95% Assumes Cat 988 Loader (11 tonne payload)
HR_P1_1 Haul Truck Traffic from Phase 1 28 300 N Industrial 25 16 54 8.3% 95% 71 tonne GVW, 35 tonne payload (similar to Cat 770)HR_P1_2 Haul Truck Traffic from Phase 1 28 525 N Industrial 25 16 54 8.3% 95% 71 tonne GVW, 35 tonne payload (similar to Cat 770)HR_P1_3 Haul Truck Traffic from Phase 1 28 600 N Industrial 25 16 54 8.3% 95% 71 tonne GVW, 35 tonne payload (similar to Cat 770)HR_P2_1 Haul Truck Traffic from Phase 2 28 800 N Industrial 25 16 54 8.3% 95% 71 tonne GVW, 35 tonne payload (similar to Cat 770)HR_P2_2 Haul Truck Traffic from Phase 2 28 725 N Industrial 25 16 54 8.3% 95% 71 tonne GVW, 35 tonne payload (similar to Cat 770)HR_P2_3 Haul Truck Traffic from Phase 2 28 800 N Industrial 25 16 54 8.3% 95% 71 tonne GVW, 35 tonne payload (similar to Cat 770)HR_P3_1 Haul Truck Traffic from Phase 3 28 200 N Industrial 25 16 54 8.3% 95% 71 tonne GVW, 35 tonne payload (similar to Cat 770)HR_P3_2 Haul Truck Traffic from Phase 3 28 260 N Industrial 25 16 54 8.3% 95% 71 tonne GVW, 35 tonne payload (similar to Cat 770)HR_P3_3 Haul Truck Traffic from Phase 3 28 275 N Industrial 25 16 54 8.3% 95% 71 tonne GVW, 35 tonne payload (similar to Cat 770)PLNTLDR Plant Loader 91 25 N Industrial 25 16 54 8.3% 95% Assumes Cat 988 Loader (11 tonne payload)
LOOP Highway Truck Traffic 13 575 Y Industrial 25 16 36 1.2 5% tandems, 20% tri-axles, 50% tri-axle trailers, 25% tri-axle trainsENTRANCE Highway Truck Traffic 26 75 Y Industrial 25 16 36 1.2 5% tandems, 20% tri-axles, 50% tri-axle trailers, 25% tri-axle trains
Constants for Mobile Emission EquationsRoadway Type Contaminant k a b c d QualityPaved Roads: PM2.5 0.15 - - - - -
PM10 0.62 - - - - -TSP 3.23 - - - - -
Unpaved Roads - Industrial: PM2.5 0.15 0.9 0.45 - - CPM10 1.5 0.9 0.45 - - BTSP 4.9 0.7 0.45 - - B
Unpaved Roads - Public: PM2.5 0.18 1 - 0.2 0.5 CPM10 1.8 1 - 0.2 0.5 BTSP 6 1 - 0.3 0.3 B
[1] Route ID numbers provided on site plan.[2] Number of passes in a 1-hour period. For the all traffic except the shipping trucks, this value reflects travel in both directions.[3] Publicly accessible and dominated by light vehicles, or industrial, and dominated by heavy vehicles.[4] For the all traffic except the shipping trucks, the average weight reflects the average of the empty and loaded vehicle weight, for travel in both directions.[5] Required only for publicly accessible unpaved roads. Data from Table 13.2.2-3 in AP-42 unless otherwise specified.[6] Required only for unpaved roads (public and industrial). Data from Table 13.2.2-1 in AP-42 unless otherwise specified.[7] Required only for industrial paved roads. Data from Table 13.2.1-2 or 13.2.1-3 in AP-42 unless otherwise specified.[8] Enter the control efficiency for each source - if no controls are applied, leave blank[9] Requires input of MOBILE 6 emission factors for exhaust, brake wear and tire wear - if no MOBILE 6 data is available, ignore this section.
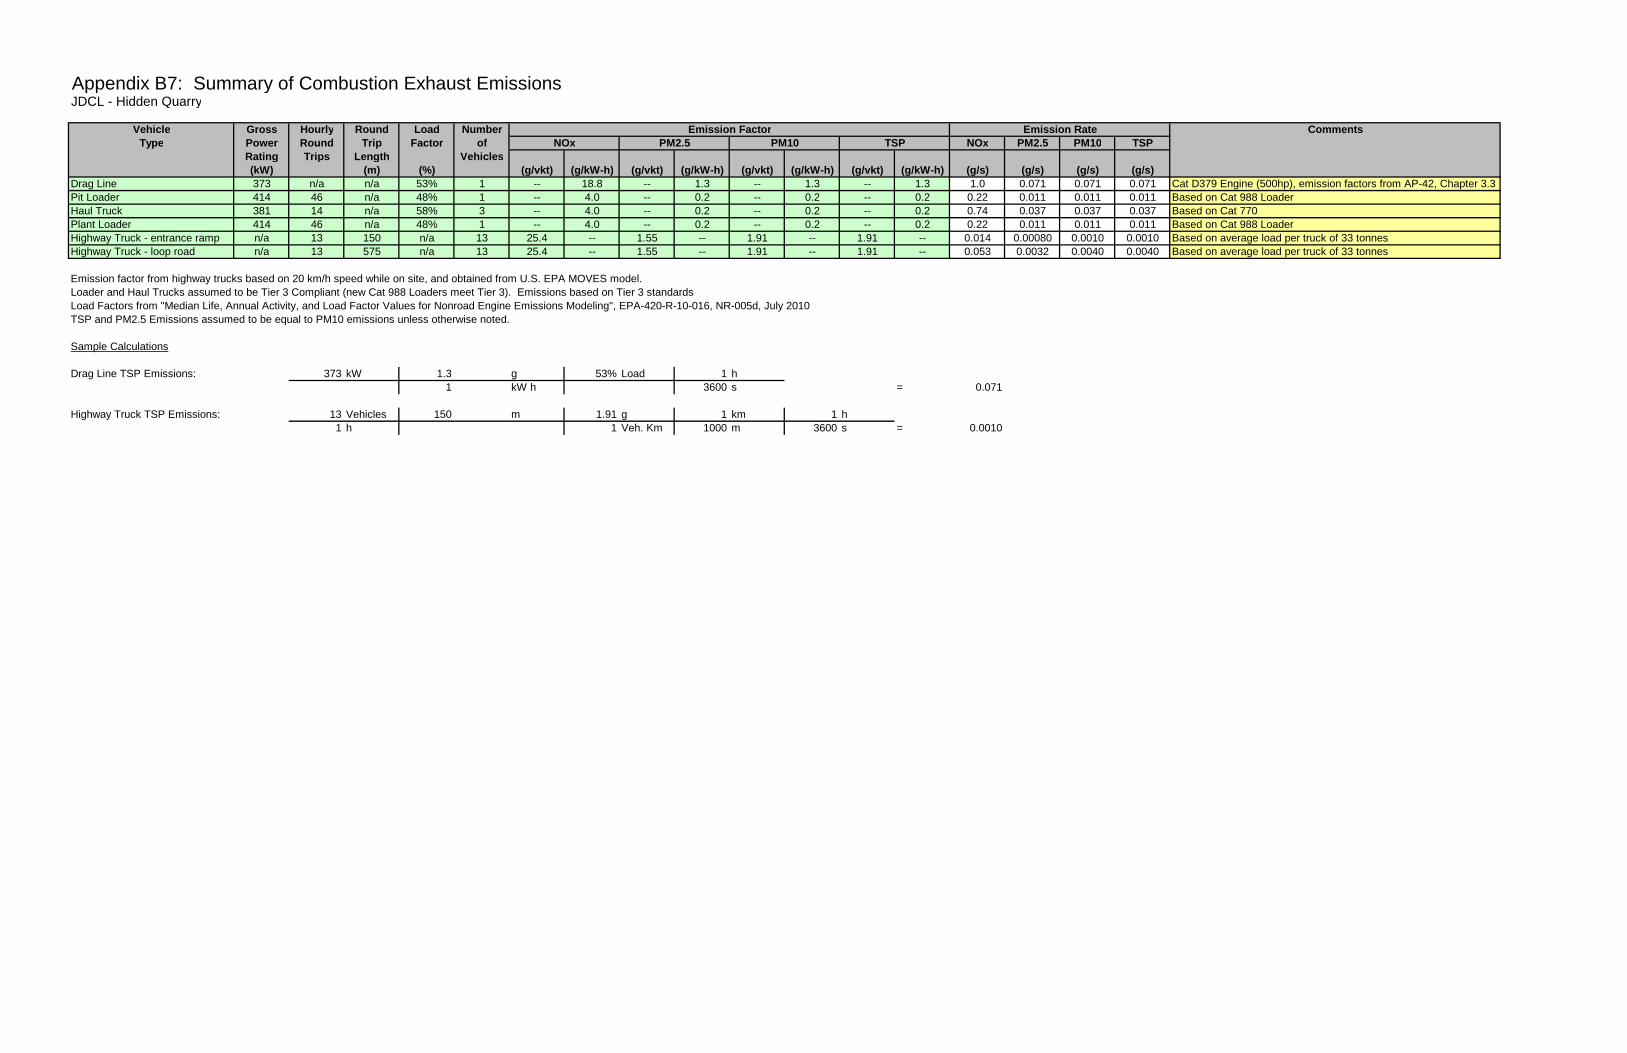
Appendix B7: Summary of Combustion Exhaust EmissionsJDCL - Hidden Quarry
Vehicle Gross Hourly Round Load Number Emission Factor Emission Rate CommentsType Power Round Trip Factor of NOx PM2.5 PM10 TSP NOx PM2.5 PM10 TSP
Rating Trips Length Vehicles(kW) (m) (%) (g/vkt) (g/kW-h) (g/vkt) (g/kW-h) (g/vkt) (g/kW-h) (g/vkt) (g/kW-h) (g/s) (g/s) (g/s) (g/s)
Drag Line 373 n/a n/a 53% 1 -- 18.8 -- 1.3 -- 1.3 -- 1.3 1.0 0.071 0.071 0.071 Cat D379 Engine (500hp), emission factors from AP-42, Chapter 3.3Pit Loader 414 46 n/a 48% 1 -- 4.0 -- 0.2 -- 0.2 -- 0.2 0.22 0.011 0.011 0.011 Based on Cat 988 LoaderHaul Truck 381 14 n/a 58% 3 -- 4.0 -- 0.2 -- 0.2 -- 0.2 0.74 0.037 0.037 0.037 Based on Cat 770Plant Loader 414 46 n/a 48% 1 -- 4.0 -- 0.2 -- 0.2 -- 0.2 0.22 0.011 0.011 0.011 Based on Cat 988 LoaderHighway Truck - entrance ramp n/a 13 150 n/a 13 25.4 -- 1.55 -- 1.91 -- 1.91 -- 0.014 0.00080 0.0010 0.0010 Based on average load per truck of 33 tonnesHighway Truck - loop road n/a 13 575 n/a 13 25.4 -- 1.55 -- 1.91 -- 1.91 -- 0.053 0.0032 0.0040 0.0040 Based on average load per truck of 33 tonnes
Emission factor from highway trucks based on 20 km/h speed while on site, and obtained from U.S. EPA MOVES model.Loader and Haul Trucks assumed to be Tier 3 Compliant (new Cat 988 Loaders meet Tier 3). Emissions based on Tier 3 standardsLoad Factors from "Median Life, Annual Activity, and Load Factor Values for Nonroad Engine Emissions Modeling", EPA-420-R-10-016, NR-005d, July 2010TSP and PM2.5 Emissions assumed to be equal to PM10 emissions unless otherwise noted.
Sample Calculations
Drag Line TSP Emissions: 373 kW 1.3 g 53% Load 1 h1 kW h 3600 s = 0.071
Highway Truck TSP Emissions: 13 Vehicles 150 m 1.91 g 1 km 1 h1 h 1 Veh. Km 1000 m 3600 s = 0.0010

APPENDIX
Employee Job Title
APPENDIX C
Employee Job Title