12. LIMALOK GUYOT: DEPOSITIONAL HISTORY OF …...12. LIMALOK GUYOT: DEPOSITIONAL HISTORY OF THE...
21
Haggerty, J.A., Premoli Silva, L, Rack, F., and McNutt, M.K. (Eds.), 1995 Proceedings of the Ocean Drilling Program, Scientific Results, Vol. 144 12. LIMALOK GUYOT: DEPOSITIONAL HISTORY OF THE CARBONATE PLATFORM FROM DOWNHOLE LOGS AT SITE 871 (LAGOON) 1 James G. Ogg, 2 Gilbert F. Camoin, 3 and Annie Arnaud Vanneau 4 ABSTRACT The late Paleocene-middle Eocene platform succession at Site 871 displays four main depositional cycles, culminating in a two-stage final drowning. Sedimentation between each pair of episodes generally consists of a deep-water phase followed by a shoaling into sets of upward-shallowing algal- or microbial-rich parasequences. Some of the parasequences terminate in surfaces of emergence. The thicker depositional cycles also encompass two or more minor episodes of shallowing and deepening. After the initial submergence of the weathered volcanic edifice and an accumulation of algal-rich facies, the upper Paleocene platform succession has a cycle of a protected-lagoon phase followed by an upward shoaling and possible brief emergence. Near the Paleocene/Eocene stage boundary, a second major deepening established a lagoon with episodes of storm reworking. This lower Eocene lagoon facies contains a secondary cycle of shoaling and deepening. Peritidal to emergent conditions were established near the end of the early Eocene by a fall in relative sea levels. This shallow-water facies is terminated by a major transgressive deepening followed by a thin upward-shoaling cycle and brief return to a shallow-water facies. A second major, transgressive pulse permanently drowns the shallow-water platform. The five main deepening events recorded in the Limalok carbonate platform at Site 871 appear to coincide with five major late Paleocene to earliest middle Eocene transgressions recognized on continental margins. The timing of each major transgressive episodes is consistent with a steady seamount subsidence rate of 27 m/m.y. The stratigraphy of the final stages of the platform at Site 871, coupled with the correlation to the eustatic sea-level curve, suggests that the main requirement for guyot drowning is a major eustatic sea-level fall and extended lowstand followed by a rapid major transgressive deepening. However, there appear to be other environmental factors associated with a near-equatorial setting during the middle Eocene that inhibited the ability of the carbonate platform to keep pace with a major eustatic sea-level rise. OVERVIEW Site 871 was positioned to penetrate "lagoonal" sediments of the carbonate platform on Limalok (formerly "Harrie") Guyot at 5.6°N, 172.3°E in the southern Marshall Islands (see site map preceding title page). Hole 871C penetrated approximately 300 m of carbonate plat- form carbonates overlying the volcanic edifice. The top of the plat- form succession is overlain by 100 m of pelagic oozes. A basal trans- gressive marine deposit of early late Paleocene, nannofossil-bearing, organic-rich claystone overlies subaerially weathered basalts. The ini- tial platform facies of late Paleocene age is dominated by bioclastic- rich grainstones characteristic of open-marine to "back-reef condi- tions. In contrast, the overlying lower to middle Eocene lime-mud- rich facies indicates formation of a protected shallow lagoon. Various lagoonal-type environments continued until the final platform drown- ing. The Limalok Guyot carbonate platform is overlain by an iron- manganese oxide and phosphatic crust that incorporates middle Eocene calcareous plankton and contains borings infilled with early Oligocene microfossils. Pelagic sediment accumulation did not begin on this submerged surface until the early Miocene. Integration of logging data and cored lithologies enable a detailed analysis of this general facies development (Fig. 1, back pocket). Logs of different physical parameters, such as resistivity, density, and natu- ral gamma-ray intensity, supplemented by Formation MicroScanner (FMS) imagery indicate a complex stratigraphy of varying grain sizes and cementation. These physical properties and lithologic data have been merged into a meter-by-meter physical lithology column with 1 Haggerty, J.A., Premoli Silva, L, Rack, R, and McNutt, M.K. (Eds.), 1995. Proc. ODP, Sci. Results, 144: College Station, TX (Ocean Drilling Program). 2 Department of Earth and Atmospheric Sciences, Purdue University, West Lafayette, IN 47907, U.S.A. 3 Centre de Sédimentologie et Paléontologie, URA 1208 du CNRS, Université de Provence, 3 Place Victor Hugo, F-13331 Marseille Cedex 3, France. 4 Institut Dolomieu, Université de Grenoble, Rue Maurice Gignoux, F-38031 Greno- ble Cedex, France. associated interpretations of depositional environments and identifi- cation of possible sea-level trends. Four main depositional cycles or sequences of transgressive deepening through progradational shallow- ing could be identified in the carbonate platform succession. INTRODUCTION AND PROCEDURE FOR FACIES ANALYSIS A full suite of geophysical, geochemical, and FMS tools were run from the bottom of the suspended drill pipe at 118.7 meters below seafloor (mbsf) to the base of the carbonate platform facies at 425.7 mbsf. The tool strings were not lowered further to avoid possible problems with sticking within the underlying clay-rich zone above the basalt substrate. The total depth penetration by each tool varies because of the placement of different tools on the strings, and the base of the carbonate platform was not recorded by most of the logging tools. Core recovery within the 289 m of platform carbonates in Hole 871C averaged only 3.5%. Therefore, these logs are invaluable for interpreting the facies succession and sea-level fluctuations within the carbonate platform. In particular, the high-resolution microresistivity borehole-wall imagery from the FMS tool is excellent for determin- ing the thickness and vertical succession of lithologies displaying similar "resistivity textures," which, in turn, can be interpreted as specific carbonate facies. The procedure for interpreting the depositional history of Site 871 from the combination of core recovery and downhole logs consists of the following steps. 1. Depths of logging runs are calibrated to each other and related to coring depths. The FMS logs are graphically displayed in various formats and scales for visual interpretation of resistivity features. The geochemical logs are processed to obtain realistic relative fluctua- tions of each element. 2. Distinct carbonate facies recovered in cores are compared with the logging data to obtain a characteristic logging "signature" so that we can recognize these facies in intervals where core recovery was
Transcript of 12. LIMALOK GUYOT: DEPOSITIONAL HISTORY OF …...12. LIMALOK GUYOT: DEPOSITIONAL HISTORY OF THE...

Haggerty, J.A., Premoli Silva, L, Rack, F., and McNutt, M.K. (Eds.), 1995Proceedings of the Ocean Drilling Program, Scientific Results, Vol. 144
12. LIMALOK GUYOT: DEPOSITIONAL HISTORY OF THE CARBONATE PLATFORMFROM DOWNHOLE LOGS AT SITE 871 (LAGOON)1
James G. Ogg,2 Gilbert F. Camoin,3 and Annie Arnaud Vanneau4
ABSTRACT
The late Paleocene-middle Eocene platform succession at Site 871 displays four main depositional cycles, culminating in atwo-stage final drowning. Sedimentation between each pair of episodes generally consists of a deep-water phase followed by ashoaling into sets of upward-shallowing algal- or microbial-rich parasequences. Some of the parasequences terminate in surfacesof emergence. The thicker depositional cycles also encompass two or more minor episodes of shallowing and deepening.
After the initial submergence of the weathered volcanic edifice and an accumulation of algal-rich facies, the upper Paleoceneplatform succession has a cycle of a protected-lagoon phase followed by an upward shoaling and possible brief emergence. Nearthe Paleocene/Eocene stage boundary, a second major deepening established a lagoon with episodes of storm reworking. Thislower Eocene lagoon facies contains a secondary cycle of shoaling and deepening. Peritidal to emergent conditions wereestablished near the end of the early Eocene by a fall in relative sea levels. This shallow-water facies is terminated by a majortransgressive deepening followed by a thin upward-shoaling cycle and brief return to a shallow-water facies. A second major,transgressive pulse permanently drowns the shallow-water platform.
The five main deepening events recorded in the Limalok carbonate platform at Site 871 appear to coincide with five major latePaleocene to earliest middle Eocene transgressions recognized on continental margins. The timing of each major transgressiveepisodes is consistent with a steady seamount subsidence rate of 27 m/m.y. The stratigraphy of the final stages of the platform atSite 871, coupled with the correlation to the eustatic sea-level curve, suggests that the main requirement for guyot drowning is amajor eustatic sea-level fall and extended lowstand followed by a rapid major transgressive deepening. However, there appear tobe other environmental factors associated with a near-equatorial setting during the middle Eocene that inhibited the ability of thecarbonate platform to keep pace with a major eustatic sea-level rise.
OVERVIEW
Site 871 was positioned to penetrate "lagoonal" sediments of thecarbonate platform on Limalok (formerly "Harrie") Guyot at 5.6°N,172.3°E in the southern Marshall Islands (see site map preceding titlepage). Hole 871C penetrated approximately 300 m of carbonate plat-form carbonates overlying the volcanic edifice. The top of the plat-form succession is overlain by 100 m of pelagic oozes. A basal trans-gressive marine deposit of early late Paleocene, nannofossil-bearing,organic-rich claystone overlies subaerially weathered basalts. The ini-tial platform facies of late Paleocene age is dominated by bioclastic-rich grainstones characteristic of open-marine to "back-reef condi-tions. In contrast, the overlying lower to middle Eocene lime-mud-rich facies indicates formation of a protected shallow lagoon. Variouslagoonal-type environments continued until the final platform drown-ing. The Limalok Guyot carbonate platform is overlain by an iron-manganese oxide and phosphatic crust that incorporates middleEocene calcareous plankton and contains borings infilled with earlyOligocene microfossils. Pelagic sediment accumulation did not beginon this submerged surface until the early Miocene.
Integration of logging data and cored lithologies enable a detailedanalysis of this general facies development (Fig. 1, back pocket). Logsof different physical parameters, such as resistivity, density, and natu-ral gamma-ray intensity, supplemented by Formation MicroScanner(FMS) imagery indicate a complex stratigraphy of varying grain sizesand cementation. These physical properties and lithologic data havebeen merged into a meter-by-meter physical lithology column with
1 Haggerty, J.A., Premoli Silva, L, Rack, R, and McNutt, M.K. (Eds.), 1995. Proc.ODP, Sci. Results, 144: College Station, TX (Ocean Drilling Program).
2 Department of Earth and Atmospheric Sciences, Purdue University, West Lafayette,IN 47907, U.S.A.
3 Centre de Sédimentologie et Paléontologie, URA 1208 du CNRS, Université deProvence, 3 Place Victor Hugo, F-13331 Marseille Cedex 3, France.
4 Institut Dolomieu, Université de Grenoble, Rue Maurice Gignoux, F-38031 Greno-ble Cedex, France.
associated interpretations of depositional environments and identifi-cation of possible sea-level trends. Four main depositional cycles orsequences of transgressive deepening through progradational shallow-ing could be identified in the carbonate platform succession.
INTRODUCTION AND PROCEDUREFOR FACIES ANALYSIS
A full suite of geophysical, geochemical, and FMS tools were runfrom the bottom of the suspended drill pipe at 118.7 meters belowseafloor (mbsf) to the base of the carbonate platform facies at 425.7mbsf. The tool strings were not lowered further to avoid possibleproblems with sticking within the underlying clay-rich zone above thebasalt substrate. The total depth penetration by each tool varies becauseof the placement of different tools on the strings, and the base of thecarbonate platform was not recorded by most of the logging tools.
Core recovery within the 289 m of platform carbonates in Hole871C averaged only 3.5%. Therefore, these logs are invaluable forinterpreting the facies succession and sea-level fluctuations within thecarbonate platform. In particular, the high-resolution microresistivityborehole-wall imagery from the FMS tool is excellent for determin-ing the thickness and vertical succession of lithologies displayingsimilar "resistivity textures," which, in turn, can be interpreted asspecific carbonate facies.
The procedure for interpreting the depositional history of Site 871from the combination of core recovery and downhole logs consists ofthe following steps.
1. Depths of logging runs are calibrated to each other and relatedto coring depths. The FMS logs are graphically displayed in variousformats and scales for visual interpretation of resistivity features. Thegeochemical logs are processed to obtain realistic relative fluctua-tions of each element.
2. Distinct carbonate facies recovered in cores are compared withthe logging data to obtain a characteristic logging "signature" so thatwe can recognize these facies in intervals where core recovery was

J.G. OGG, G.F. CAMOIN, A. ARNAUD VANNEAU
sparse. This "ground-truth" calibration was especially important forthe FMS resistivity imagery.
3. A composite description of logging features and associatedcore recovery is made of the hole, which incorporates preliminaryinterpretation of the vertical succession of facies. The array of high-resolution logging data enabled suites of lithologic subunits to bedefined and parasequence trends to be distinguished.
4. The facies succession is interpreted in terms of shifting deposi-tional environments and relative sea-level fluctuations. At each levelof this chain of interpretations, various assumptions and models needto be incorporated; we will make an effort to clarify most of these steps.
CALIBRATION AND PROCESSING OF KEY LOGS
Depth Shifting
Logging data is initially collected relative to the meters of loggingwire suspended below the drill rig floor and adjusted for the spacing oftools on the particular tool string. However, this initial array of datagenerally does not correspond to the cored intervals within the hole, asmeasured by the lowered pipe during drilling operations. There areseveral factors that contribute to this mismatch, and a series of calibra-tions must be made: first to the position of the drill pipe, then betweenthe different logs. Because of the very poor recovery throughout Hole871C and the inability to uniquely assign any of the few pieces oflithology to the detailed borehole logging, we have used the compen-sated logging depths of the FMS tools as the standard for all descrip-tions and depths of features, rather than the "educated guesses" madeby the shipboard party. Therefore, it is important to summarize howthese depths were derived.
The drill pipe during the logging runs is at a known depth below thedual-elevator stool on the rig floor (in turn, 10.9 m above mean sealevel during the Site 879 drilling), and all cores were drilled with re-spect to this same reference. The initial contact of the drill string withthe seafloor ("bottom felt depth") is then used to convert drilling depthsto "meters below seafloor" (mbsf). This "bottom felt depth" was 1265.5"meters below rig floor" (mbrf) for Hole 879A, implying that the sea-floor was 1254.6 "meters below sea level" (mbsl). Therefore, the drilldepths of cores (mbrf) were converted into depth within Hole 879A(mbsf) by subtracting 1265.5 m (Shipboard Scientific Party, 1993).
The different logging runs have varying degrees of stretch of thewireline. Therefore, a natural gamma tool (NGT) is part of eachlogging tool string, and distinctive natural gamma peaks within therock succession are used to depth shift each log with respect to astandard run. The different logging records were later interactivelydepth shifted by the Lamont-Doherty Earth Observatory BoreholeResearch Group (Lamont-BRG) with reference to the natural gamma-ray record from the geochemical run (ACT/GST/NGT) and to thedepth of the seafloor. Key features on the inter-log NGT records areat nearly identical depths among the various runs.
Calibration of the logging depth scale (meters of wireline below therig floor) to the drill core record was accomplished by Lamont-BRGby identifying the base of the suspended drill pipe (mbrf) in theresponse of the resistivity logs. During all logging runs in Hole 871C,the drill pipe was suspended at 1384.2 mbrf, or 118.7 m below the1265.5 m "bottom felt depth" used to assign core depths, implying thatit was 118.7 m into Hole 879A. However, the response of the resistivitylogs was interpreted by Lamont-BRG to indicate an apparent depth ofthe drill-pipe base at 1264.0 mbrf, which was 1.5 m higher than itsactual depth. Therefore, Lamont-BRG applied a depth correction of1264.0 m, instead of 1265.5 m, to convert mbrf of the wireline loggingdepths of all logs to mbsf within the drill hole. It is important to notethat this new depth correction by Lamont-BRG requires that an aver-age of 0.7 m be added to the depths of logging features cited in thedownhole discussions in the Site 871 chapter of Volume 144 InitialReports (Premoli Silva, Haggerty, Rack, et al., 1993).
There are additional complications, such as deducing the exactbase of the drill pipe in the logging runs or identifying unique sharp
features on the natural gamma traces for precise depth shifting. As aresult, the independent depth calibration of the logs made by theshipboard logging team and by the Lamont-BRG differ by approxi-mately 0.7 m. In addition, the Lamont-BRG internally adjusts the twoFMS runs with respect to each other to match common features towithin a few centimeters. This internal depth shifting of FMS tracesis thought to be necessary because of differential stretching of thewireline during ocean swells or variable friction within the borehole.
In this summary of logging stratigraphy, all features are describedrelative to "corrected" FMS depths processed by Lamont-BRG, whichare the scales for the FMS imagery on the well-log data compact disk(CD-ROM) distributed with the Ocean Drilling Program Initial Re-ports (Premoli Silva, Haggerty, Rack, et al., 1993).
This suite of Lamont-BRG depth adjustments to the FMS runscauses a variance with the depth-corrected scales for the geophysicsand geochemistry logging suites, and position of features may possiblybe slightly different from coring depths of recovered sediments. Ingeneral, the FMS features are approximately 2.0 m below the depth ofthe same feature in the geophysics logs within most of the borehole,and 2.5-3.0 m below the resistivity log in the lower logged interval of415-420 mbsf. Therefore, because the Lamont-BRG FMS depths arethe distributed archive version for FMS features, we have depth shiftedthe resistivity and geochemical logging data downward by approxi-mately 2 m for the display of the combined log-core interpretationsshown in the accompanying diagrams. Other sharp features in the FMSand in the resistivity logs support this general depth correction, al-though minor "tuning" of 10-30 cm was required in some intervals tofurther place the resistivity log into a more exact correspondence withthe FMS log. The natural gamma-ray record used in the accompanyingdiagrams for Site 871 is from the NGT on the same FMS string, so itsdepths should be consistent with depths of the FMS imagery processedby Lamont-BRG. In the few instances where cored lithologic featuresappear to be at variance in depth with the corresponding FMS features,we note the calibration problem in the descriptions.
Regardless of the exact calibration of the various "corrected"depths, the thicknesses and spacing of all features will be identicalamong the borehole, the FMS imagery, and the other downhole logs.
Processing of FMS Resistivity Imagery
The FMS tool creates high-resolution images of the borehole bymeasuring the electrical resistivity contrast across an array of smallelectrodes (Ekstrom et al., 1986; Pezard and Luthi, 1988; Bourke etal., 1989). FMS imagery has been applied in the petroleum industrysince 1986, but it had been previously precluded from use by theOcean Drilling Program (ODP) because of constraints imposed by theinternal diameter (about 10 cm) of the drill pipe. A modified sensorwas consequently developed by Schlumberger for ODP and was firstdeployed during Leg 126 in the western Pacific (Pezard et al., 1990).
The ODP FMS has four orthogonal pads containing 16 pad-mounted button electrodes that are pressed against the borehole. Theresolution of the ODP FMS images is improved by using a smallersize of the electrode arrays than is common for the commercial FMStool. The FMS records an array of current intensity or conductancemeasurements every 0.25 cm and has a vertical resolution of approxi-mately 1 cm. In contrast, typical conventional downhole measure-ments are sampled only every 15 cm and generally have a resolutionof approximately 60 cm; thus, the sampling rate and resolution of theFMS is 60 times finer than for most other logging devices. This fine-scale resolution allows detailed study of subsurface structures andbedding characteristics.
The electrode currents probe the conductivity to a depth of a fewcentimeters into the borehole wall and respond to variations in elec-trolytic conduction or in cation exchange on the surfaces of clays andother conductive minerals (Bourke et al., 1989). The conductivitytraces are presented as microresistivity, although the FMS does notprovide a direct quantitative value of formation resistivity. Variations
234

LIMALOK GUYOT: DEPOSITIONAL HISTORY
on these resistivity images reflect changing physical and chemicalproperties of the rock (such as porosity, mineralogy, cementation, andgrain size) and of the interstitial fluid.
The four orthogonal sets of 16 adjacent traces are coded into eithera gray-scale or a color image. In gray-scale images of this log ofrelative resistivity, white represents the most resistive values andblack the least resistive ones. Magnetometers in the FMS tool stringenable orientation of the set of images relative to the north magneticfield, thereby enabling relative alignment of multiple traces madeduring separate runs and determination of the orientation of dips andsedimentary structures. A single run of the ODP FMS provides ap-proximately 25% coverage of the borehole circumference. Two runswere made in Hole 874B to enable a maximum of 50% coverage ofthe borehole where traces did not overlap.
Calipers on the FMS tool provide precise measurements of bore-hole diameter in two orthogonal directions. The tool string also in-cludes a 3-axis accelerometer for recording variations in verticalspeed that are incorporated in computing FMS pad positions withinthe borehole. This speed correction procedure is very important inODP logging operations as the sampling intervals can be disturbed bythe heave effect of ocean surface waves on the wireline.
The FMS measurements undergo a series of processing steps thatadjust the traces for irregular tool movements, fluctuating operatingvoltages, and response of individual electrodes. The traces are thenconverted into enhanced images of the borehole (see appendix inMolinie and Ogg, 1992a, 1992b). The desired type of interpretationinfluences the window dimensions over which resistivity images arenormalized and the techniques of enhancement. The examples ofFMS images reproduced in the figures in our report have been "staticmode" processed over the entire 296-m interval logged by the FMSin Hole 871C, implying that the 16 shades of gray have been linearlynormalized between the highest value of resistivity (white) to thelowest value (black) occurring within that interval. Within this win-dow, a particular shade of gray corresponds to the same relativeresistivity, but that resistivity level may be represented by a differentgray shade in the adjacent window. We also used "dynamic mode"images, in which the entire gray scale is nonlinearly applied within asliding 1-m window. These dynamic-mode images enhance visibilityof bedding features and details of sedimentary structures.
Interpretations of sedimentological features from FMS imageshave varying degrees of reliability (Bourke et al., 1989; Harker et al.,1990). Stratigraphic contacts, bedding thicknesses and dips, slumps,crossbedding, fractures, and rock textures, such as conglomerates, cangenerally be unambiguously interpreted directly on the FMS imagery.Other downhole logs (such as natural gamma-ray, resistivity, porosity,and geochemical logs) are required for calibration of general compo-sitional and textural trends. However, as noted previously, such logs donot provide the resolution of the FMS, therefore, interpretation offine-scale compositional contrasts, diagenetic variations, and otherdetails noted on the images requires calibration with core data.
Geochemical Log Processing
The geochemical records from the induced-gamma spectrum tool(GST) were converted by Lamont-BRG to relative elemental contri-butions by Fe (assuming an equal contribution by magnetite andhematite), Ca, Cl, Si, Su, Ga, Ti, and H (the last two elements werecomputed during processing), with corrections for hole diameter asrecorded by calipers on the density tool (CALI on the HLDT) and onthe FMS string ("Cl" and "C2"). The relative ratios of these elementalfactors are more useful for lithologic trends than use of the lessaccurate elemental values for direct computation of rock chemistry.
INTERPRETATION OF CARBONATE FACIESFROM DOWNHOLE LOGS
Our goal in analyzing the various logs is to obtain a completerecord of the history of depositional environments. The major car-
bonate textures and composite depositional facies, such as algal-microbial mats, generally could be distinguished by their signatureson a combination of three logs: the spherically focused resistivity log(SFLU), which measures the absolute resistivity of the borehole wallwith a vertical resolution of about 75 cm; the FMS microresistivityimagery, which indicates the "texture" and vertical successions at asubcentimeter scale; and the NGT record of the relative intensity ofuranium concentration. Use of a single type of log yielded moreambiguous interpretations. These log-facies signatures were devel-oped from comparison of logs to intervals having good recovery ofthe lithologies and from application of logical relationships of car-bonate depositional environments. In addition, the recovered sedi-ments in each cored interval, although generally meager, providedimportant controls on the interpretation of the logging signals.
In contrast to surface exposures of carbonate platforms, the major-ity of the Limalok limestone cap has been only partially cemented.Insignificant overburden (maximum of 400 m) and a lack of latermeteoritic influence helped preserve the original granular relation-ships. Indeed, some grainstone intervals were observed to have noapparent cementation, which also caused very low recovery and"washouts" during drilling. Above the basal drowning surface on theunderlying clay weathering zone, there was no noticeable influx ofterrigenous influx; therefore, the downhole logs can be interpretedentirely in terms of pure carbonate facies.
Resistivity Log
Resistivity of carbonate textures progressively increases fromgrainstone to mudstone as the porosity is steadily diminished (e.g.,Asquith, 1979; Dorfman et al., 1990). The recovered core materialsuggests that the initial texture of the limestone also influenced thedegree of diagenetic cementation, with grainstones being less ce-mented than micritic mudstones. As a result, the corresponding re-sponses of the resistivity and density tools are magnified by thesechanges in carbonate textures.
This relationship does not apply when an episode of penetrativeearly cementation has taken place because of possible subaerial expo-sure or hiatus in deposition. Such "surfaces" with underlying partialcementation are common in intervals having pronounced develop-ment of parasequences. In these cases, the shallower depth and pre-sumably higher energy grainstone-packstone facies commonly under-went a greater degree of cementation and, therefore displays an up-ward increase in resistivity. This high-resistivity upper bed of a cycleis overlain by a facies of very low resistivity representing the succeed-ing deepening phase. Another common reversal of the usual relation-ship of grain size and bulk resistivity was observed when thin grain-stone horizons from storm-bed winnowing or redeposition are inter-bedded within wackestone-packstone facies; these grainstone levelsappear to be preferentially cemented during later diagenesis relativeto the adjacent finer grained sediment.
Natural Gamma-ray Log
Natural gamma-ray intensity (NGT or SGR) within the carbonateplatform in Hole 871C is mainly a monitor of the uranium concentra-tion; the influx of clays with thorium or potassium are unimportantabove the weathered volcanics.
Three distinct processes were observed to contribute to the vari-ations in uranium natural gamma-ray intensity.
1. Uranium displays higher relative contentrations in algal-cyanobacterial mats and oncolites because their reducing microenvi-ronments are conducive to redox scavenging of uranium from sea-water. Although this uranium concentration process is most effectivefor algal-cyanobacterial mats, it was also observed to be applicable tored-algal encrustations and concretions (rhodoliths).
2. Uranium is often enriched in limestones deposited in deposi-tional environments in which organic matter or phosphate was origi-
235

J.G. OGG, G.F. CAMOIN, A. ARNAUD VANNEAU
nally present, because uranium from seawater is preferentially pre-cipitated in relatively reducing conditions (Serra, 1985). Quiet-watercarbonate facies, such as wackestone and mudstone, were observedto display a higher natural gamma-ray intensity than such high-energy facies as grainstone. These mud-rich sediments, which arecommonly bioturbated, probably retained a greater initial organiccontent in the buried sediment than the more aerated facies; therefore,uranium would be preferentially concentrated in the mud-rich facies.In this regard, minor peaks in uranium were observed to occur atlevels interpreted as "maximum flooding surfaces," where the con-centration of carbonate mud (and rare pelagic microfossils) and pre-sumably fine organic material was at a maximum.
3. Uranium can be concentrated during later diagenesis at theredox interfaces between relatively oxygenated and relatively reduc-ing interstitial water conditions. This redox enhancement was ob-served at the boundaries between tan- and gray-colored sediments ofthe same facies (such as lagoonal wackestones) and within the car-bonate mud-rich transgressive sediments immediately overlying asurface of emergence or condensation. At these redox levels, theuranium was generally concentrated in a narrow horizon, in contrastto the more dispersed concentrations associated with mud- or algal-cyanobacterial-rich facies.
Formation MicroScanner
The FMS imagery was important to determine the homogeneity ofcarbonate grains and cementation patterns at the centimeter scale andto compare fine-scale vertical trends in relative resistivity.
Grainstone facies typically display a uniform low-resistivity tex-ture, displayed in the gray-scale imagery as a homogeneous darkgray interval.
Packstone to wackestone facies generally had a more unevencentimeter-scale resistivity, presumably resulting from differentialabundances of carbonate mud and the related extent of partial cemen-tation during diagenesis. Therefore, the FMS imagery displays a moremottled appearance with irregular diffuse higher resistivity patches("light-gray mottles"). In some wackestone-packstones, especially inrecovered cores in lagoonal gastropod-pellet facies, significant leach-ing of the larger bioclasts has created a moldic porosity within a po-rous wackestone matrix. The corresponding FMS imagery displays a"medium-gray," moderate-resistivity background with abundant dark(leached) spots and some diffuse patches of preferential cementation.
In facies having algal-enhanced concentrations of carbonate mud,such as algal-flat intervals or red-algal encrustations and coral-algalbanks, horizontal lenses of high-resistivity material are distributedwithin a low-resistivity matrix.
Rudstone (mainly beds of storm-washed rubble) or boundstonebeds (not observed in the FMS logs within this lagoonal setting) dis-play a "blocky" texture of 10-cm-scale, rounded and sharp-borderedpatches of contrasting resistivity. An interpretation of "storm bed"is assigned to distinct higher resistivity or "rubble" beds with sharpbases occurring within an otherwise homogeneous wackestone-packstone facies.
Our independent calibration of carbonate textures to FMS imageryappearance is similar to the relationships observed in the logs in thecarbonate platforms of the guyots drilled on the preceding Leg 143(Cooper et al., 1995); however, there are some minor nomenclature andimplied depositional environment differences. These differences aremainly the result of the calibration of the FMS imagery to shipboarddescriptions of the same sediments. For example, the "mudstone withmoldic porosity" facies of Cooper et al. (1995) displays the same FMStexture as our "bioclastic wackestone-packstone" classification. Thesediments recovered in this facies consist of abundant bioclastic moldsin wackestone-packstone that had undergone extensive diagenetic"chalkification"; therefore, it was not initially a mudstone, and we havetried to maintain the shipboard sedimentological nomenclature of thefacies before extensive diagensis.
Recovered Sediments
Recovery was typically less than 5% of each cored interval. Corerecovery was highest when the cored facies consisted of uniformlymoderate-cemented carbonates. Neither well-cemented beds, whichapparently shattered upon drilling, nor poorly cemented facies, whichdisintegrated under the drill, had significant recovery. Interbeddedwell- and poor-cemented beds, such as occur in the shallow-waterupward-shoaling facies successions or parasequences, had recoverybiased toward the uppermost well-cemented bed. Similar recoverybiases were noted in the Leg 143 drilling of guyots (Cooper et al.,1995). Unfortunately, an implication is that those intervals whichcontain a significant amount of vertical variation (hence of the mostvalue to interpretations of changing depositional environments andpossible sea-level changes) also have the lowest recovery of sedimentsto enable direct sedimentological interpretation of facies trends.
Model of Depositional Facies
The vertical succession of carbonate facies reflect changing depo-sitional environments of wave energy (winnowing or deposition ofcarbonate mud), of ecological zones (algal mat, coral, gastropod,etc.), and of relative water depth (emergent horizons, downslopedebris, etc.). Interpretation of relative shifts of facies (e.g., lagoon-ward versus seaward; upward-shallowing versus deepening) requiresa basic conceptual model of the original distribution and depositionalenvironments of the various carbonate facies (Fig. 2).
Lagoonal facies present a particular problem because of the diffi-culty of identifying episodes of prograding coral-algal production("carbonate factory") creating parasequences or of transgressive back-stepping of seaward facies. Instead, a relative depth-facies interpreta-tion can be made according to the relative proportion of lime-mud, therelative importance of storm events disrupting sedimentation or wash-ing in beds of coarser debris, and the biological assemblages. However,such "deepening" and "shallowing" trends can be obscured by changesin the degree of restriction of the lagoon floor from the open sea. A"quiet" lagoon facies might imply a greater degree of restriction ratherthan a deeper water setting. Also, an increased abundance of storm-bedlayers might reflect a greater proximity of grainstone-rudstone shoalsrather than an upward-shallowing of the lagoon floor.
For placing the cored and logged facies of this Paleocene-Eoceneatoll into a context of adjacent depositional environment belts, weused a simple model that combines relative mud content and biologi-cal assemblages. We used an idealized succession from the deep"lagoon" facies deposited in relatively quiet waters and/or distantfrom reef-shoal barriers through the shallow "lagoon" facies or inter-tidal depths in the lee of barrier shoals to the "island" facies formedby storm accumulations from the seaward active carbonate-sedimentfactory: (1) mudstone to wackestone with small benthic foraminifers;(2) wackestone-packstone with gastropods and miliolid foraminifers;(3) packstone, which may contain layers of storm-redeposited or-winnowed in situ grainstone or rudstone; (4) algal-rich facies, whichmay contain algal-concretions (oncolites or rhodoliths) in packstone-grainstone, and generally has an associated concentration of uraniumproducing an elevated natural gamma-ray intensity; (5) winnowedgrainstone of various bioclasts and foraminifers, or partially cementedpackstone with fenestral features of possible intertidal or algal matorigin; (6) emergent grainstone-rudstone shoal or island with coarsestorm-redeposited debris from the seaward "carbonate factory"; and(7) coral-algal reef flat.
This conceptual model of relative lagoonal depth is partially basedon comparisons with Tertiary atoll lagoon settings. However, the"lagoonal" facies may also be developed in interiors of platforms likethe Bahama Banks which have a partial barrier (reefs and shoals) onlyon the windward side. It is not certain that these Cretaceous guyotshad a true atoll morphology during much of their development. There-

LIMALOK GUYOT: DEPOSITIONAL HISTORY
(emergent only ininitial stages)
Bioclasticgrainstone-rudstone shoal(storm-redeposited debris
Algal-microbial-rich from Coral-Algal shelf)packstone-grainstone /
A ^ > ^ j ( sea levelMudstone to ^ - V ^ ^ > ^ ^ ^ Λ Λ Λ X Coral-Algal shelf
|
%
iPackwith
be
stone,;storm :ds :4-i!ii
i/irinówedyralnstdnè: ] i ] ̂ l ^ T ^ y y ^ * ^ Debris slope fromseritidal to emergent i ' i ' i ' i ' i ' i ' i ' i ' i ' rT^^^coral -a lgal shelf
Figure 2. Idealized model of carbonate facies across a guyot platform. A quiet-water lagoon forms in the lee of shoal deposits of wave-redeposited bioclastic debris.Algal-cyanobacteria features and storm reworking occur preferentially in the shallower depths of the lagoon. A typical transgressive facies succession during initialsubmergence of the former volcanic island is wave-winnowed grainstone, algal-or oncoid-rich packstone, and lime-mud-rich lagoonal sediments.
fore, "lagoon" is used here in a broad sense as a partially protectedinterior of the carbonate bank.
Algal-cyanobacterial mats and oncoids have a wide depth range. InHole 878, these microbial features (often generalized as "algal" in thefollowing descriptions, even though cyanobacteria play the major role)commonly are associated with a packstone-grainstones facies, whichwe generally interpret to represent a shallower depth than a lime-mud-rich facies. However, a transition from a skeletal wackestone with fe-nestrae features to an oncoid packstone would imply a deepening trend.
Carbonate platform facies of all geological ages typically haveupward-shallowing cycles or parasequences superimposed upon largerscale trends. A "parasequence" is defined as "a relatively conformablesuccession of genetically related beds or bed sets bounded by marineflooding surfaces or their correlative surfaces . . . separating youngerstrata from older strata across which there is evidence of an abruptincrease in water depth" (Van Wagoner et al., 1990). These para-sequences or upward-shallowing facies successions are typically ofmeter-scale thicknesses and have recurrence periodicity similar toMilankovitch orbital-climate cycles, although the exact causes of thecyclicity are debated (e.g., reviews in Wilson, 1975; Tucker andWright, 1990; Jones and Desrochers, 1992; Pratt et al., 1992). A fewintervals within Hole 871C were dominated by repetitious, ~5-m-thickcycles of upward-increasing resistivity sharply terminated to the lowerresistivity base of the following cycle. These cycles were dominantwhen the depositional environment was "shallow lagoon to intertidal,"and typically incorporated the upward-shallowing suite of uncementedwackestone-packstone to algal-rich carbonate to relatively well-cemented packstone-grainstone. The associated FMS imagery andnatural gamma-ray characteristics indicated that the uppermost high-resistivity zone of each cycle appeared to be a cemented grainstone,which we interpret as a downward cementation episode associatedwith an emergence or condensation horizon on a shallow shoal ofgrainstone debris. In these cases, the upward-increasing resistivity isnot caused by an increased carbonate mud component but, rather to ananomalous cementation level. However, similar upward-increasingresistivity cycles were interpreted as "upward-fining sequences" in theborehole logs into lagoonal facies of Cretaceous guyots drilled on Leg143 (Cooper et al., 1995).
INTERPRETATION OF DEPOSITIONAL HISTORY
The following depositional history of the carbonate facies inte-grates the independent observations from the cored sediments (typi-cally only 20-50 cm of recovery from each 10-m cored interval), the
quantitative resistivity measurements, the variation in natural gamma-ray intensities and associated uranium/thorium/potassium abundances,and the detailed FMS records of "textures" and vertical successions.Division of the lithologic succession into subunits was based initiallyupon the facies and nomenclature of shipboard-defined lithologicunits. At Site 871, the entire carbonate platform succession was de-noted as lithologic Unit II with six lettered subunits. The continuousdownhole logging records enabled improved resolution of the bounda-ries or transitions between these lithologic subunits (Table 1) andallowed additional subdivisions to be defined as coherent log-faciespackets or as major parasequences (Fig. 1). Summaries of the recov-ered lithologies of these subunits and details of the signatures andinterpretation of possible depositional facies for the associated down-hole logging subdivisions are compiled in the Appendix. Two impor-tant assumptions are required for this interpretation of the depositionalhistory of Site 871. First, it is assumed that the logging characteristicsand associated core recovery are representative of an unambiguousfacies and associated depositional environment. The Shipboard Sci-entific Party (1993) compiled a preliminary depositional history ofLimalok Guyot based mainly on the recovered facies. The broad out-lines of their interpretation are similar to this study, however, the detailsdiffer significantly in many intervals because we have relied heavilyon the high-resolution FMS imagery to identify facies characteristicswhere core recovery is meager or nonexistent.
Second, it is assumed that the facies within Hole 871C reflectlarge-scale trends within the central portion of Limalok Guyot, ratherthan local shifts and isolated patterns of environments. The assumptionof local versus general facies trends is particularly important for theinterpretation that upward-shallowing parasequences reflect eustaticsea-level fluctuations rather than autocyclic behavior of the carbon-ate system. The interpretation of carbonate upward-shallowing cycleswithin isolated outcrops or logging data is debated (e.g., Osleger, 1991;Drummond and Wilkinson, 1993a, 1993b; Goldhammer et al., 1993;Grötsch, 1994). However, most regional studies have concluded thatthe major facies trends and sets of parasequences within a singleoutcrop are indicative of larger scale patterns of facies shifts andcarbonate sequence system tracts, rather than an artifact of random orautocyclic facies changes (e.g., Goldhammer et al., 1990; Van Wagoneret al., 1990; Osleger and Read, 1993; Grafe and Wiedmann, 1993).Therefore, the major deepening or shallowing trends interpreted withinHole 871C are considered to be indicative of broader facies trendswithin the central portion of the Limalok Guyot carbonate platform,and it is assumed that these trends provide a monitor of relativesea-level changes with respect to the platform.
237

J.G. OGG, G.F. CAMOIN, A. ARNAUD VANNEAU
Table 1. Lithologic subunit boundaries of the carbonate platform succession in Hole 871C assigned from FMS imagery and other borehole logs com-pared to shipboard assignments from core recovery.
Unit orsubunit
Lithology(brief summary)
Base inborehole(mbsf)
Thickness(m)
Shipboardassignment
(core, section,interval [in cm])
Shipboardestimateof base(mbsf)
I Pelagic foraminifer oozeIIA Foraminifer packstone-wackestoneIIB Foraminifer wackestone to skeletal grainstoneIIC Composite of lithologies, dominated by foraminifer packstone-wackestoneIID Foraminifer packstone and algal-coral grainstoneHE Algal- and rhodolith-rich grainstone-packstone; cyclicIIF Gray foraminifer-mollusk packstone-grainstone with pyrite and organic carbonIII Claystone formed from weathered volcanic brecciaIV Basalt flows and volcanic breccia
139.5161.72182.92320.3387.7421.9425.7451.6
>500.0(base of hole)
139.52.21.2
137.467.434.2
3.825.9
>48.4>500.0
6R-l,06R-l,07R-l,021R-1,1627R-1.031R-1.2132R-1.4035R-1.541B-1.42
133.7153.2181.9316.7374.3413.0422.9451.6
Weathering and Submergence of the Volcanic Edifice(451.6-425.7 mbsf; Lithologic Unit III; late Paleocene)
Massive alkaline basalt flows and interbedded volcanic brecciaare overlain by weathered volcanic breccia and associated overlyingvariegated clayey soil. Soil formation and deeper partial weatheringunder tropical conditions penetrated approximately 26 m (to 451.6mbsf) into the volcanic edifice, although the lower 15 m may bethickened by slump deposits.
The uppermost meter of gray clay contains small gastropods andpatches of sand-sized fragments of marine organisms (mollusks andforaminifers). However, the onset of carbonate platform deposition isa sharp contact at 425.7 mbsf. The uppermost gray clay with redepos-ited bioclasts is interpreted as a marginal-marine marsh to nearshoremud with partial bioturbation mixing of sand-sized bioclastic debriscarried landward by waves or storms. This marginal-marine mud alsopreserved some rare pelagic nannofossils.
Storm-redeposited Bioclastic Sands, Shallow-waterAlgal-rich Parasequences, and Exposure Surfaces
(425.7-387.7 mbsf; Lithologic Subunits IIF and HE;late Paleocene)
The basal 4 m of the carbonate platform (Subunit IIF) consist ofseven beds of gray, poorly sorted grainstone to packstone, comprisedprimarily of foraminifer and mollusk fragments, with thin (ca. 10 cmthick) interbeds of clay-rich sediment. These beds probably representstorm-redeposited material, derived from an inner shelf environmentor from an offshore "lagoon," that have been washed onto a beach orintertidal setting. An upward increase in resistivity and calcium abun-dance corresponds to a progressive decrease in average clay contentand an increase in degree of cementation. Therefore, a series ofstorm-redeposited shoal accumulations are interbedded with clay-rich sediment and organic material washed from the adjacent volcanicisland. Cementation of these beds may have been enhanced under thelow-oxygen conditions, but yellowing limonite weathering and thesharp surface on the uppermost bed (421.9 mbsf) indicates at least oneperiod of emergence. The emergent surface may also represent arelative drop of sea level, because upward-shallowing algal-rich para-sequences also characterize the overlying Subunit HE. Therefore, thisinitial carbonate-sand-rich cycle of submergence and emergence mayrepresent a single upward-shallowing parasequence.
The next 34 m are a series of six main cycles or upward-shallow-ing parasequences (Subunits IIE-1 through IIE-6). The uppermostmain parasequence appears to be a composite of four thin parase-quences (Subunits IIE-6a to IIE-6d). The top of each parasequence isa sharp surface, overlain by the low-resistivity base of the next parase-quence (Fig. 3). The dominant lithology is algal-rhodolith-rich grain-stone-packstone with abundant benthic foraminifers, coral and mol-lusk fragments. Lenticular, 10- to 20-cm-thick bodies of relativelyhigher resistivity in the FMS imagery are interpreted to be producedby algal mats. The enrichment in uranium in these cycles is probably
caused by redox-concentration processes associated with the algalmicroenvironments. The maximum uranium content just below theupper peak in cementation of each parasequence may be a combina-tion of enrichment in algal components and of a redox concentrationassociated with an uppermost emergence. The lower set of algal-richparasequences (Subunits IIE-1 through IIE-3) average 5 m in thick-ness and commonly display meter-thick fluctuations in resistivity anduranium contents superimposed on the main trend of upward-increas-ing resistivity. The meter-scale fluctuations are probably caused byvariations in lime-mud content, in abundance of algal mats and rhodo-liths, and in degree of cementation.
The fourth parasequence (Subunit IIE-4, 3 m thickness) termi-nates in a well-cemented surface, interpreted as a brief emergentepisode. The overlying set of parasequences are relatively thin, aver-aging only about 2.5 m in thickness, and are dominated by algal-matfacies (Fig. 3).
Subunit HE is interpreted as a late highstand systems tract fol-lowed by an period when falling sea levels were limiting accommo-dation space for sediment accumulation. A "sequence boundary,"corresponding to the most rapid rate of eustatic sea-level fall, istentatively assigned to 400.1 mbsf. At this level, a surface of emer-gence marks the change between a lower interval of well-developed,5-m-thick parasequences (typical of highstand facies) to an upperinterval dominated by algal flats and thin condensed parasequences.Subunit HE is terminated by a rapid deepening trend.
The submergence of the weathered volcanic edifice in Hole 871Cappears to be associated with the deep-water phase of an upward-shallowing parasequence. Therefore, the upper portion of Subunit HE(parasequences IIE-4 through IIE-6) may equivalent to a lowstandsystems tract developed on shelves with slower subsidence rates.
Major Cycle 1: Deepening Episode, Protected Lagoon,and Shallowing to Algal-rich Parasequences
and Exposure Surfaces (387.7-320.3 mbsf; LithologicSubunit IID; late Paleocene)
Subunit IID is a complete cycle of a basal transgressive surface(387.7 mbsf; Fig. 3) and progressive deepening (Subunits IID-1through IID-3, 34 m total thickness), followed by a rapid shallowing(347.2 mbsf) to a series of six major algal-rich parasequences (Sub-units IID-4 to IID-7, 33 m total thickness), which are terminated byanother transgressive surface (ending at 320.3 mbsf).
The first deepening phase (Subunit IID-1, 12 m thickness) isdominated by foraminifer packstone and algal-rich intervals. Thisphase consists of two upward-increasing resistivity and uranium cy-cles, which may be upward-shallowing parasequences superimposedon a general deepening trend. The cycles are thicker (6 m) than theunderlying "highstand" parasequences of Subunit HE (4-5 m); theseexpanded thicknesses are consistent with a transgressive trend. Fur-ther deepening produces a moderate depth-protected lagoon with alime-mud-rich facies of gastropod-rich foraminifer-skeletal wacke-stone-packstone (Subunit IID-2; 17 m).
LIMALOK GUYOT: DEPOSITIONAL HISTORY
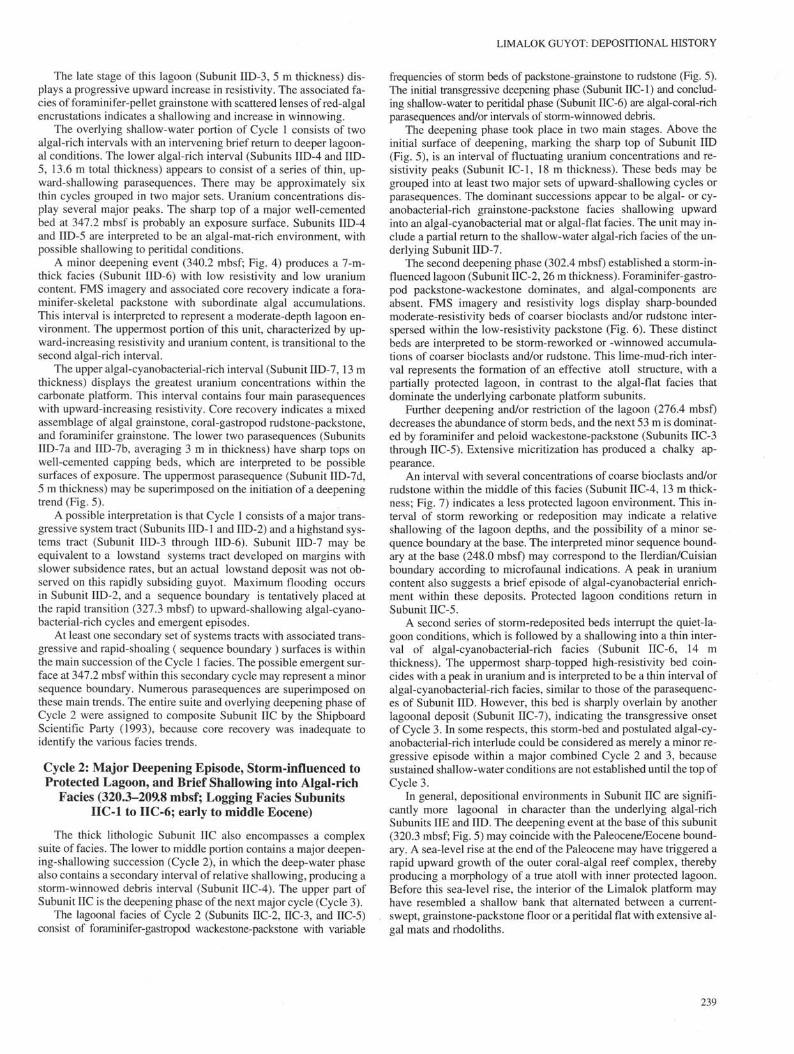
The late stage of this lagoon (Subunit IID-3, 5 m thickness) dis-plays a progressive upward increase in resistivity. The associated fa-des of foraminifer-pellet grainstone with scattered lenses of red-algalencrustations indicates a shallowing and increase in winnowing.
The overlying shallow-water portion of Cycle 1 consists of twoalgal-rich intervals with an intervening brief return to deeper lagoon-al conditions. The lower algal-rich interval (Subunits IID-4 and IID-5, 13.6 m total thickness) appears to consist of a series of thin, up-ward-shallowing parasequences. There may be approximately sixthin cycles grouped in two major sets. Uranium concentrations dis-play several major peaks. The sharp top of a major well-cementedbed at 347.2 mbsf is probably an exposure surface. Subunits IID-4and IID-5 are inteΦreted to be an algal-mat-rich environment, withpossible shallowing to peritidal conditions.
A minor deepening event (340.2 mbsf; Fig. 4) produces a 7-m-thick facies (Subunit IID-6) with low resistivity and low uraniumcontent. FMS imagery and associated core recovery indicate a fora-minifer-skeletal packstone with subordinate algal accumulations.This interval is inteΦreted to represent a moderate-depth lagoon en-vironment. The uppermost portion of this unit, characterized by up-ward-increasing resistivity and uranium content, is transitional to thesecond algal-rich interval.
The upper algal-cyanobacterial-rich interval (Subunit IID-7, 13 mthickness) displays the greatest uranium concentrations within thecarbonate platform. This interval contains four main parasequenceswith upward-increasing resistivity. Core recovery indicates a mixedassemblage of algal grainstone, coral-gastropod rudstone-packstone,and foraminifer grainstone. The lower two parasequences (SubunitsIID-7a and IID-7b, averaging 3 m in thickness) have shaΦ tops onwell-cemented capping beds, which are inteΦreted to be possiblesurfaces of exposure. The uppermost parasequence (Subunit IID-7d,5 m thickness) may be superimposed on the initiation of a deepeningtrend (Fig. 5).
A possible inteΦretation is that Cycle 1 consists of a major trans-gressive system tract (Subunits IID-1 and IID-2) and a highstand sys-tems tract (Subunit IID-3 through IID-6). Subunit IID-7 may beequivalent to a lowstand systems tract developed on margins withslower subsidence rates, but an actual lowstand deposit was not ob-served on this rapidly subsiding guyot. Maximum flooding occursin Subunit IID-2, and a sequence boundary is tentatively placed atthe rapid transition (327.3 mbsf) to upward-shallowing algal-cyano-bacterial-rich cycles and emergent episodes.
At least one secondary set of systems tracts with associated trans-gressive and rapid-shoaling ( sequence boundary ) surfaces is withinthe main succession of the Cycle 1 facies. The possible emergent sur-face at 347.2 mbsf within this secondary cycle may represent a minorsequence boundary. Numerous parasequences are superimposed onthese main trends. The entire suite and overlying deepening phase ofCycle 2 were assigned to composite Subunit IIC by the ShipboardScientific Party (1993), because core recovery was inadequate toidentify the various facies trends.
Cycle 2: Major Deepening Episode, Storm-influenced toProtected Lagoon, and Brief Shallowing into Algal-rich
Facies (320.3-209.8 mbsf; Logging Facies SubunitsIIC-1 to IIC-6; early to middle Eocene)
The thick lithologic Subunit IIC also encompasses a complexsuite of facies. The lower to middle portion contains a major deepen-ing-shallowing succession (Cycle 2), in which the deep-water phasealso contains a secondary interval of relative shallowing, producing astorm-winnowed debris interval (Subunit IIC-4). The upper part ofSubunit IIC is the deepening phase of the next major cycle (Cycle 3).
The lagoonal facies of Cycle 2 (Subunits IIC-2, IIC-3, and IIC-5)consist of foraminifer-gastropod wackestone-packstone with variable
frequencies of storm beds of packstone-grainstone to rudstone (Fig. 5).The initial transgressive deepening phase (Subunit IIC-1) and conclud-ing shallow-water to peritidal phase (Subunit IIC-6) are algal-coral-richparasequences and/or intervals of storm-winnowed debris.
The deepening phase took place in two main stages. Above theinitial surface of deepening, marking the shaΦ top of Subunit IID(Fig. 5), is an interval of fluctuating uranium concentrations and re-sistivity peaks (Subunit IC-1, 18 m thickness). These beds may begrouped into at least two major sets of upward-shallowing cycles orparasequences. The dominant successions appear to be algal- or cy-anobacterial-rich grainstone-packstone facies shallowing upwardinto an algal-cyanobacterial mat or algal-flat facies. The unit may in-clude a partial return to the shallow-water algal-rich facies of the un-derlying Subunit IID-7.
The second deepening phase (302.4 mbsf) established a storm-in-fluenced lagoon (Subunit IIC-2, 26 m thickness). Foraminifer-gastro-pod packstone-wackestone dominates, and algal-components areabsent. FMS imagery and resistivity logs display shaΦ-boundedmoderate-resistivity beds of coarser bioclasts and/or rudstone inter-spersed within the low-resistivity packstone (Fig. 6). These distinctbeds are inteΦreted to be storm-reworked or -winnowed accumula-tions of coarser bioclasts and/or rudstone. This lime-mud-rich inter-val represents the formation of an effective atoll structure, with apartially protected lagoon, in contrast to the algal-flat facies thatdominate the underlying carbonate platform subunits.
Further deepening and/or restriction of the lagoon (276.4 mbsf)decreases the abundance of storm beds, and the next 53 m is dominat-ed by foraminifer and peloid wackestone-packstone (Subunits IIC-3through IIC-5). Extensive micritization has produced a chalky ap-pearance.
An interval with several concentrations of coarse bioclasts and/orrudstone within the middle of this facies (Subunit IIC-4, 13 m thick-ness; Fig. 7) indicates a less protected lagoon environment. This in-terval of storm reworking or redeposition may indicate a relativeshallowing of the lagoon depths, and the possibility of a minor se-quence boundary at the base. The interpreted minor sequence bound-ary at the base (248.0 mbsf) may correspond to the Ilerdian/Cuisianboundary according to microfaunal indications. A peak in uraniumcontent also suggests a brief episode of algal-cyanobacterial enrich-ment within these deposits. Protected lagoon conditions return inSubunit IIC-5.
A second series of storm-redeposited beds interrupt the quiet-la-goon conditions, which is followed by a shallowing into a thin inter-val of algal-cyanobacterial-rich facies (Subunit IIC-6, 14 mthickness). The uppermost sharp-topped high-resistivity bed coin-cides with a peak in uranium and is inteΦreted to be a thin interval ofalgal-cyanobacterial-rich facies, similar to those of the parasequenc-es of Subunit IID. However, this bed is shaΦly overlain by anotherlagoonal deposit (Subunit IIC-7), indicating the transgressive onsetof Cycle 3. In some respects, this storm-bed and postulated algal-cy-anobacterial-rich interlude could be considered as merely a minor re-gressive episode within a major combined Cycle 2 and 3, becausesustained shallow-water conditions are not established until the top ofCycle 3.
In general, depositional environments in Subunit IIC are signifi-cantly more lagoonal in character than the underlying algal-richSubunits HE and IID. The deepening event at the base of this subunit(320.3 mbsf; Fig. 5) may coincide with the Paleocene/Eocene bound-ary. A sea-level rise at the end of the Paleocene may have triggered arapid upward growth of the outer coral-algal reef complex, therebyproducing a moΦhology of a true atoll with inner protected lagoon.Before this sea-level rise, the interior of the Limalok platform mayhave resembled a shallow bank that alternated between a current-swept, grainstone-packstone floor or a peritidal flat with extensive al-gal mats and rhodoliths.
239

Orientation of FMS pad in borehole
0°(N) 90° 180° 270° 0°
Orientation of FMS pad in borehole
0°(N) 90° 180° 270° 0°
Figure 3
Orientation of FMS pad in borehole
0°(N) 90° 180° 270° 0°Figure 3. FMS static-processed image from the uppermost portion of log-ging-facies Subunit IIE-6 (upward-shallowing algal-rich facies successions)and the lowermost portion of Subunit IID-1 (lagoon facies of foraminifer-pellet packstone). This interval (386-390 mbsf, corresponding approxi-mately to Core 144-871C-28R) is of Paleocene age. Subunit IIE-6 is charac-terized by cycles of upward-increasing resistivity, with a sharp transition tothe overlying low-resistivity base of the next cycle; a complete cycle is dis-played from 389.8 to 387.6 mbsf (fourth cycle in Subunit IIE-6). The lenticu-lar to tabular, higher resistivity bands in these cycles are probably caused byalgal-enhanced cementation. Subunit IID-1 has a homogeneous granular tex-ture (dark gray to black in this FMS image), and its sharp lower contact at387.6 mbsf to Subunit HE represents a transgressive deepening episode. Inthis and all following FMS images, the high-resistivity beds are shown inwhite and low-resistivity beds are in black; the gray-scale contrast for rela-tive resistivity has been maximized over the displayed image interval usingNIH Image software; the orientation of the four FMS traces are clockwisearound the borehole, with magnetic north on the left edge fixed by a boreholemagnetometer in the FMS tool; the borehole circumference is approximately1 m.
Figure 4. FMS static-processed image from the upper portion of logging-facies Subunit IID-5 (algal-coral flat facies with an upward-shallowingcycle), overlain at 340.2 mbsf by logging-facies Subunit IID-6 (foraminiferpackstone). This interval (339-343 mbsf, corresponding approximately toCore 144-871C-23R) is of Paleocene age. Subunit IID-5 is characterized bythin, discontinuous, high-resistivity bedsinterbedded with relatively low-resistivity layers with a grainstone-packstone texture. The thin, lenticular totabular, higher resistivity bands in these cycles, such as the bed at 340.9mbsf, are probably caused by algal-enhanced cementation. Subunit IID-6 hasa low-resistivity grainstone-packstone texture with scattered higher resistiv-ity 5- to 10-cm-thick lenses and ca. 1-cm higher resistivity balls, whichprobably represent inhomogeneous cementation. The transition between theunderlying algal-rich facies into a typical lagoon facies indicates a deepeningevent. Format of FMS image is explained in Figure 3.
Figure 5. FMS static-processed image of the facies transition near theEocene/Paleocene boundary (323-320 mbsf, corresponding approximately toCore 144-871C-21R). Logging facies Subunit IID-7 is an algal-rich facieswith upward-shallowing cycles or parasequences of low to medium resistiv-ity changing upward to high resistivity. Dynamic FMS imagery indicates acombination of laminated algal mats and grainstone to rudstone beds. It issharply overlain at 320.3 mbsf by Subunit IIC-1 of lagoonal foraminiferpackstone of low resistivity (black in FMS image). The basal portion of Sub-unit IIC-1 is homogeneous with a rhodolith -bearing grainstone appearancein the dynamic FMS imagery. This transition between the algal-rich faciesand a shallow lagoon facies indicates a major deepening event. Format ofFMS image is explained in Fig. 3.
Figure 5
Figure 4

LIMALOK GUYOT: DEPOSITIONAL HISTORY
Cycle 3: Deepening Episode, Protected Lagoon, andShallowing to Algal-mat Facies (209.8-152.9 mbsf;
Logging Facies Subunits IIC-7 and IIC-8,Lithologic Subunit IIB, and Logging Facies Subunit IA-1;
early to middle Eocene)
Protected lagoon conditions and lime-mud-rich sediments domi-nate the lower 27 m of Cycle 3, with only a short interval containingsome loosely cemented beds of storm-winnowed debris (SubunitsIIC-7 and IIC-8). The sedimentation is dominated by gastropod- andbivalve-bearing foraminifer wackestone-packstone. A relative shal-lowing and/or increasing exposure to storm waves produces an in-creasing abundance of winnowed grainstone and sharp-boundedstorm beds of coarse debris and rudstone (Subunit IIB- 1,13m thick-ness). The top of this storm-bed-rich interval displays a peak in ura-nium. Algal-cyanobacterial-rich parasequences and peritidalsediments dominate the next 17 m (Subunits IIB-2 and IIA-1; Fig. 8).
The lower interval of the algal-cyanobacterial-rich (high uraniumcontent) facies (Subunit IIB-2, 8 m thickness) has four to five cyclesof upward-increasing resistivity with sharp upper surfaces (Fig. 8).At least one of these parasequences included a brief period of emer-gence. Core recovery within the upper interval of algal-cyanobacte-rial-rich facies (Subunit IIA-1, 9 m thickness) included foraminifer-intraclast grainstone with keystone vugs, suggesting occasional per-itidal conditions.
Cycle 3 can be subdivided into a deepening phase or transgres-sive systems tract (Subunit IIC-7), a gradual shallowing-upwardphase or highstand systems tract (Subunits IIC-8 through IIB-2), abrief emergence near 169.6 mbsf (sequence boundary?), and estab-lishment of a subtidal to peritidal facies rich in algal-cyanobacterialfeatures or microbial mats (Subunit IIA-1). Subunit IIA-1 is termi-nated by a deepening event (152.9 mbsf) and return to lagoon condi-tions; therefore, its position between a possible sequence boundaryand an overlying transgressive transition would imply that it may bethe equivalent of a lowstand system tract on shelves with slowersubsi-dence rates.
Progressive Drowning of the Carbonate Platform(152.9-139.5 mbsf; Logging Facies Subunits
IIA-2 to IIA-4; middle Eocene)
Core recovery of a foraminifer packstone coincides with a 6-m in-terval of moderate-resistivity, low-uranium facies with a diffuse mot-tled packstone texture in the FMS imagery (Subunit IIA-2). Thisinterval is interpreted as a quiet lagoon environment.
The overlying 6 m displays peaks in resistivity and uranium con-tent, and the FMS imagery indicates 10-cm-thick, high-resistivitylenses within a granular texture host sediment (Subunit IIA-3; Fig.9). These characteristics are similar to Subunit IIA-1; therefore, thefacies is interpreted to be an algal-rich grainstone deposited in rela-tively shallow depths.
The uppermost 1.3 m of the carbonate platform is a high-resistiv-ity, well-cemented bed associated with a concentration of uranium(Subunit IIA-4; Fig. 9). FMS imagery and core recovery indicate thatthis is a foraminifer wackestone-packstone. The uranium content isinterpreted to be a redox concentration process associated with theformation of the capping phosphatic and iron-manganese crust.
This succession is interpreted as a lagoonal packstone-wacke-stone (Subunit IIA-2) shallowing upward to an algal-cyanobacterial-rich facies (Subunit IIA-3), capped by a cemented phosphate-rich bedof lagoonal packstone-wackestone (Subunit IIA-4). Therefore, thedrowning of the carbonate platform at this site begins with a trans-gressive surface at the top of the algal-flat facies of Subunit IIA-3.The final Subunit IIA-4 represents a partially preserved, deeper waterfacies that accumulated during the drowning.
DISCUSSION AND CONCLUSIONSPaleocene Eocene Platform History
and Sequence Stratigraphy Correlation
A major goal of Leg 144 was to use the stable subsidence rates ofcarbonate platforms as dip sticks to measure the timing and magni-tude of major eustatic sea-level fluctuations (e.g., Lincoln andSchlanger, 1991). Limalok Guyot provides a record of major late Pa-leocene to middle Eocene sea-level changes, and the major events ap-pear to be identical to published eustatic curve compilations (e.g.,Haq et al., 1988). However, the exact timing of these sea-level eventswas precluded by the absence of a detailed biostratigraphic frame-work, and the magnitude of rises and falls was distorted by the rapidsubsidence rate of the seamount.
The Paleocene-Eocene platform succession at Site 871 displayssix main deepening episodes, culminating in a two-stage final drown-ing (Table 2). Sedimentation between each pair of episodes generallyconsists of a deep-water phase followed by an upward shallowing toan algal-rich parasequence suite. Some of the shallow-water parase-quences include surfaces of emergence. The thicker deposits also en-compass minor deepening and shallowing cycles.
The initial submergence of the volcanic edifice was followed by asustained shallow-water to peritidal algal-rich depositional environ-ment (Subunits IIF and HE). After a major second deepening episode,the Paleocene platform underwent a progressive upward shoalingpunctuated by a series of upward-shallowing facies successions andpossible emergent episodes (Subunit IID).
A third major deepening occurs near the Paleocene/Eoceneboundary into a thick interval of lagoon wackestone-packstone withepisodes of storm reworking (Subunits IIC-1 to IIC-5). This earlyEocene lagoon has a general long-term shoaling, culminating in aperitidal algal-mat facies (Subunit IIC-6). A fourth, but less majordeepening event produces a return to lagoonal conditions (SubunitsIIC-7 to IIB-1), followed by another shoaling to a shallow-water toperitidal facies and possible emergent episodes (Subunits IIB-2 andIIA-1).
A middle Eocene transgressive pulse submerges the shallow-wa-ter environment, but is immediately followed by a upward-shoalingcycle and a brief partial reestablishment of the algal-rich facies (Sub-units IIA-2 and IIA-3). The shallow-water platform is permanentlydrowned by another major transgressive pulse.
If Limalok Guyot had a steady rate of subsidence during the latePaleocene and Eocene, then these six main deepening events are arecord of significant transgressive rises of eustatic sea level. The on-set of these rapid transgressive rises are the most distinctive featurein these carbonate platform successions.
In contrast, a depositional sequence on clastic margins is definedas the package of sediments deposited between successive major fallsof eustatic sea level which produce unconformities across significantportions of the continental shelf and epicontinental basins. On a rap-idly subsiding seamount, these eustatic sea-level falls and associatedsequence boundaries will partially cancel the effects of subsidenceand cause a slowing or elimination of accommodation space for ac-cumulation of carbonate sediments. Therefore, a sequence boundaryis recorded by the guyot carbonate platform as an unusually rapidtransition to a sustained interval of shallow-water facies punctuatedby short-period condensed parasequences or as periods of emer-gence. To produce a sustained unconformity, such as those that char-acterize sequence boundaries on ramping continental shelves, the rateof eustatic sea-level fall must exceed the typical seamount subsidencerates of 30-50 m/m.y. Possible equivalents of these sequence bound-aries within the carbonate platform succession are listed in Table 2.However, in many cases, the recognition and placement of such se-quence boundaries (rapid shallowing events) are ambiguous, becauseupward-shallowing and progradation episodes may also occur duringstillstands and highstand systems tracts.

Orientation of FMS pad in borehole
0°(N) 90° 180° 270° 0°Orientation of FMS pad in borehole
0°(N) 90° 180° 270°
fl~l 1 IOrientation of FMS pad in borehole
0°(N) 90° 180° 270° 0°
Figure 7 Figure 8
Figure 6. FMS static-processed image of a lower Eocene lagoonal facies offoraminifer-gastropod packstone-wackestone with several storm-winnowedaccumulations of coarser bioclasts or rudstone (290-293 mbsf, correspond-ing approximately to upper Core 144-871C-18R). Subunit IIC-2 is character-ized by a medium-resistivity facies with 30- to 50-cm-thick, higherresistivity horizons spaced approximately every 2 3 m. Dynamic FMS imag-ery suggests that the higher resistivity beds, such as the levels at 292.0 and289.6 mbsf, are a rudstone facies. Format of FMS image is explained in Fig-ure 3.
Figure 7. FMS static-processed image of a thick storm-winnowed debris con-centration (239-242 mbsf, corresponding approximately to upper Core 144-871C-13R) within a lower Eocene lagoonal facies of foraminifer-gastropodpackstone-wackestone (Subunit IIC-4). In the dynamic FMS imagery, thisbed is a concentration of high-resistivity, 2- to 5-cm-diameter clasts within agranular-texture matrix. The sediment interbedded between these coarse-clast beds, such as the low-resistivity lithology below 242 mbsf), is grain-stone-packstone. Format of FMS image is explained in Figure 3.
Figure 8. FMS static-processed image of the upper portion of lithologic Sub-unit IIB (162-165 mbsf, early to middle Eocene, corresponding approxi-mately to upper Core 144-871C-5R). This interval in logging-facies SubunitIIB-2 is winnowed foraminifer grainstone to bioclastic rudstone (gray in thisFMS imagery) interbedded with high-resistivity algal-encrustation episodes(white in this image). The uppermost well-cemented, algal-encrustation epi-sode (162 mbsf) is a possible emergence horizon and is overlain by lagoonalfacies of Subunit IIA-1. Format of FMS image is explained in Figure 3.
Figure 6

LIMALOK GUYOT: DEPOSITIONAL HISTORY
Orientation of FMS pad in borehole
0°(N) 90° 180° 270° 0°
Figure 9. FMS static-processed image of the facies succession leading to themiddle Eocene drowning of the platform at 139.5 mbsf, overlain by pelagicchalk. This interval (143-139 mbsf, approximately corresponding to lowerCore 144-871C-2R) spans the algal-rich Subunit IIA-3 (below 140.8 mbsf),the cemented phosphate-rich bed of lagoonal packstone-wackestone of Sub-unit IIA-4, and the pelagic chalks of basal Unit I (above 139.5 mbsf). SubunitIIA-3 is an algal-rich facies of encrustations or mats interbedded with pack-stone or low-resistivity grainstone, with possible partial dissolution in theupper 2-m band. Subunit IIA-4 is a very high-resistivity layer with alagoonal texture in the dynamic FMS imagery (1- to 2-cm-diameter spots ofhigher resistivity in a grainstone-packstone sediment). Therefore, the finalpreserved facies before drowning of the carbonate platform is a lagoonal-typesediment; however, this episode may represent last-stage sediment accumula-tion during the early stages of drowning. The actual drowning probablybegan at the top of the underlying algal-rich Subunit IIA-3. Indeed, this finalbed may be post-drowning, redeposited sediment, that was later cementedupon further deepening below the wave base. Format of FMS image isexplained in Figure 3.
The eustatic sea-level curve compiled by Haq et al. (1988) has ap-proximately 15 numbered sequences within the late Paleocene to mid-dle Eocene portion of the Tejas A super-sequence set (Fig. 10).However, the majority of these sequences are either relatively minorsea-level fluctuations or are too closely spaced to be adequately re-solved by our log-based stratigraphic resolution at Limalok Guyot. In-deed, there are only five major sea-level rises (deepening events withgreater than 25 m estimated magnitude) within the late Paleocene tomid middle Eocene interval. An independent derivation of a Pale-ocene early Eocene sea-level curve by Gràfe (1994) has the samenumber and ages for major excursions, but the estimated magnitudes(in meters) of these sea-level changes is approximately 50% less.
Using the Paleocene/Eocene boundary assignment at the base ofSubunit IIC as the main biostratigraphic constraint, the five majoreustatic sea-level rises and an additional basal highstand systems tractin the Haq et al. (1988) curve were tentatively matched to deepeningevents in Hole 871C (Table 2; Fig. 10). Absolute ages for the onset ofeach rapid rise of sea level were estimated from the time scale in thechart of Haq et al. (1988), and the corresponding age span betweenevents were used to compute a suite of subsidence rates of the carbon-ate platform (Table 2). An oceanic seamount should have fairly con-stant rates of subsidence over a 10-m.y. interval. Therefore, if thecomputed set of subsidence rates from the correlation of transgres-sions to the Haq et al. (1988) scale are constant, then the scale is ingeneral agreement with the Limalok stratigraphy. There are severalpotential problems and unknowns with such a quantitative correla-tion, such as the undocumented biostratigraphic calibrations and der-ivations of relative magnitudes for the eustatic sea-level variations inthe Haq et al. (1988) compilation, the lack of adequate biostratigraph-ic control in Hole 871C to adequately justify each sequence assign-ments, the Ma age assignments used by the Haq et al. (1988) timescale, and the implicit assumption that absolute eustatic sea level atthe beginning of each rapid deepening (sea-level rise) was approxi-mately at the same level.
Each of the four main depositional cycles (Subunits IIP throughIIA-2) yield similar subsidence rates of 25-28 m/m.y. Therefore, theduration of carbonate accumulation in Hole 871C is approximately 11m.y. with a mean accumulation rate of 27 m/m.y., and is implied tospan the earliest part of the late Paleocene through the earliest part ofthe Middle Eocene. Subsidence rates in the range of 25 30 m/m.y. areexpected for a carbonate platform constructed about 5 15 millionyears after initial seamount formation according to simple subsidencemodels of seamounts that thermally reset the underlying older oceaniccrust (e.g., Detrick and Crough, 1978; Larson et al., this volume). TheMarshall Islands probably had overlapping loading effects of edificesconstructed during different volcanic episodes (e.g., Lincoln et al.,1993). Therefore, it is difficult to apply these simple models or moreaccurate complex models (e.g., Watts and Ribe, 1984; Wolfe and Mc-Nutt, 1991). Despite these complications, the subsidence rate ofLimalok Guyot in the late Paleocene was probably within this samegeneral range. An independent verification of the subsidence rate isthe ~3-m thickness of the upward-shallowing parasequences recordedin the shallow-water facies in Hole 871C. These short-term upward-shallowing cycles may be related to climatic-oceanic cooling cyclesinduced by the 100-k.y. Milankovitch periodicity of eccentricity mod-ulation of precession. Therefore, the 3-m-average thickness of theseupward-shallowing cycles would also imply a subsidence rate of ap-proximately 30 m/m.y.
The apparent consistent correlation of the Haq et al. (1988) curvewith the independent sea-level changes, biostratigraphic constraints,and subsidence rates interpreted from the Site 871C logging and cor-ing data is a surprising and unexpected agreement. Their curve ismainly derived from selected passive continental margins and may bedistorted by regional tectonics and other factors, and the reliability ofconverting these depositional sequences into global eustatic sea-levelvariations is uncertain. However, we must tentatively conclude that

J.G. OGG, G.F. CAMOIN, A. ARNAUD VANNEAU
Hole871CMain deepening
episodes
Sequence(Supercycle and
cycle)
Chronostratigraphy (Seriesand Stage boundaries with
age in Ma)
Eustatic curves(short-term cycles and
long-term trend)
Figure 10. Major deepening episodes in Hole 871C and the Paleocene to middle Eocene portion of the eustatic sea-level curve compiled by Haq et al. (1988).Correlations of deepening episodes in Hole 871C with major transgressions are constrained by the placement of the Paleocene/Eocene boundary (Table 2).
the Paleocene-Eocene portion of the eustatic sea-level curve of Haqet al. (1988) appears to be a reliable representation of the eustatic sealevels recorded by isolated seamounts in the Pacific.
Some minor sequences in the Haq et al. (1988) compilation alsoappear to be recorded within the Limalok platform. For example, theirset of early Eocene sequences TA 2.4 through TA 2.9 are mainly minorvariations except for a single major sea-level excursion in lower TA2.7 (Fig. 10). This series is correlated to Subunits IIC-2 through IIB-2;which contains one major deepening episode (top of Subunit IIC-6)and at least three minor cycles of deepening-shallowing.
The main discrepancy in the Limalok Guyot stratigraphy correla-tion to the Haq et al. (1988) curve is at the Paleocene/Eocene bound-ary. Their curve in the latest Paleocene contains three close-spacedsequences with progressively higher levels of maximum sea level (TA2.2 to 2.4; Fig. 10). These events may correlate to the set of deepening
and parasequence events combined into upper Subunit IID-7 andlower Subunit IIC-1; but they cannot be resolved as distinct deposi-tional sequences. This set of end-Paleocene events is also exhibitedas a single major excursion on some other margins (e.g., Grafe, 1994).
Final Stages of Middle Eocene Guyot
The last stage of active shallow-water carbonate accumulation atSite 871 was an algal-cyanobacterial-rich facies near or at sea level(Fig. 8). This episode is considered to be equivalent to a falling or"lowstand" of eustatic sea level that followed a general upward-shallowing succession of the underlying -50 m of facies, from alagoon to a shallow algal-cyanobacterial-rich facies. The magnitudeof the regression in the Haq et al. (1988) curve would imply a periodof emergence of the carbonate platform, but there is no direct evi-
244
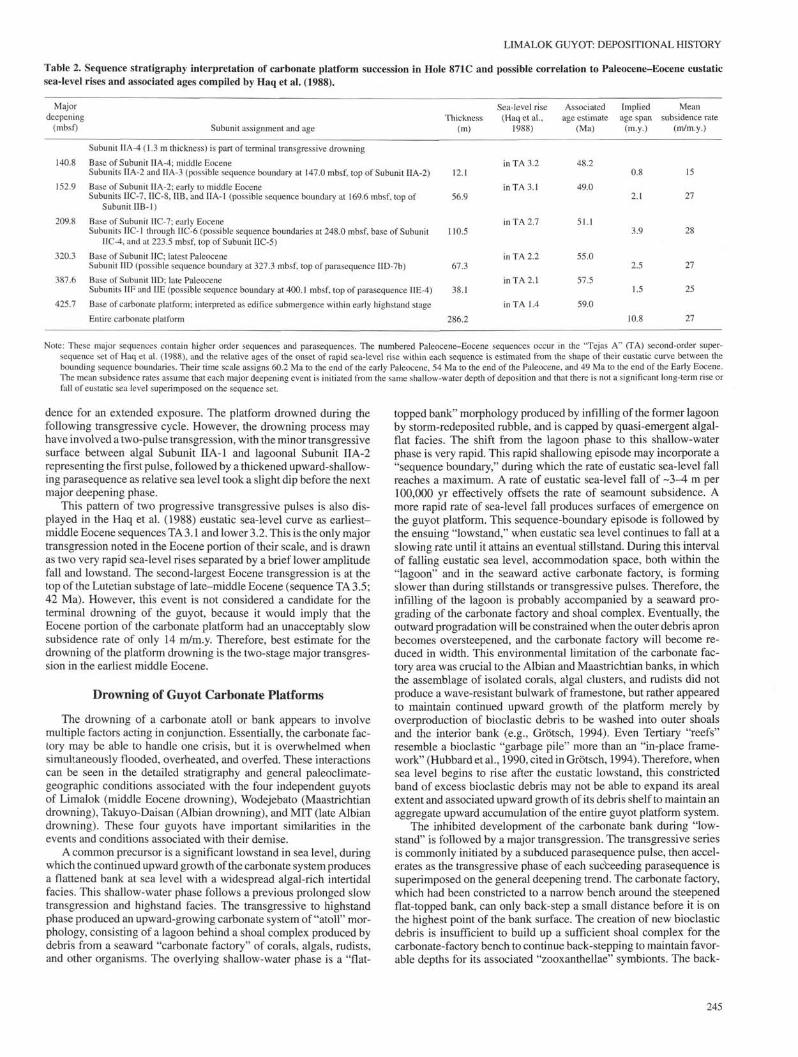
LIMALOK GUYOT: DEPOSITIONAL HISTORY
Table 2. Sequence stratigraphy interpretation of carbonate platform succession in Hole 871C and possible correlation to Paleocene-Eocene eustaticsea-level rises and associated ages compiled by Haq et al. (1988).
Major Sea-level risedeepening Thickness (Haqetal.,
(mbsf) Subunit assignment and age (m)
Associatedage estimate
(Ma)
Impliedage span
(m.y.)
Meansubsidence rate
(m/m.y.)
Subunit IIA-4 (1.3 m thickness) is part of terminal transgressive drowning
140.8 Base of Subunit IIA-4; middle EoceneSubunits IIA-2 and IIA-3 (possible sequence boundary at 147.0 mbsf, top of Subunit IIA-2)
152.9 Base of Subunit IIA-2; early to middle EoceneSubunits IIC-7, IIC-8, IIB, and IIA-1 (possible sequence boundary at 169.6 mbsf, top of
Subunit IIB-1)
209.8 Base of Subunit IIC-7; early EoceneSubunits IIC-1 through IIC-6 (possible sequence boundaries at 248.0 mbsf, base of Subunit
IIC-4, and at 223.5 mbsf, top of Subunit IIC-5)
320.3 Base of Subunit IIC; latest PaleoceneSubunit IID (possible sequence boundary at 327.3 mbsf, top of parasequence IID-7b)
387.6 Base of Subunit IID; late Paleocene
Subunits IIF and HE (possible sequence boundary at 400.1 mbsf, top of parasequence IIE-4)
425.7 Base of carbonate platform; interpreted as edifice submergence within early highstand stage
Entire carbonate platform
12.1
56.9
in TA 3.2
inTA3.1
48.2
49.0
0.8
2.1
15
27
in TA 2.7 51.1110.5 3.9
67.3
38.1
in TA 2.2
inTA2.1
inTA1.4
55.0
57.5
59.0
2.5
1.5
27
25
286.2 27
Note: These major sequences contain higher order sequences and parasequences. The numbered Paleocene-Eocene sequences occur in the "Tejas A" (TA) second-order super-sequence set of Haq et al. (1988), and the relative ages of the onset of rapid sea-level rise within each sequence is estimated from the shape of their eustatic curve between thebounding sequence boundaries. Their time scale assigns 60.2 Ma to the end of the early Paleocene, 54 Ma to the end of the Paleocene, and 49 Ma to the end of the Early Eocene.The mean subsidence rates assume that each major deepening event is initiated from the same shallow-water depth of deposition and that there is not a significant long-term rise orfall of eustatic sea level superimposed on the sequence set.
dence for an extended exposure. The platform drowned during thefollowing transgressive cycle. However, the drowning process mayhave involved a two-pulse transgression, with the minor transgressivesurface between algal Subunit IIA-1 and lagoonal Subunit IIA-2representing the first pulse, followed by a thickened upward-shallow-ing parasequence as relative sea level took a slight dip before the nextmajor deepening phase.
This pattern of two progressive transgressive pulses is also dis-played in the Haq et al. (1988) eustatic sea-level curve as earliest-middle Eocene sequences TA3.1 and lower 3.2. This is the only majortransgression noted in the Eocene portion of their scale, and is drawnas two very rapid sea-level rises separated by a brief lower amplitudefall and lowstand. The second-largest Eocene transgression is at thetop of the Lutetian substage of late-middle Eocene (sequence TA 3.5;42 Ma). However, this event is not considered a candidate for theterminal drowning of the guyot, because it would imply that theEocene portion of the carbonate platform had an unacceptably slowsubsidence rate of only 14 m/m.y. Therefore, best estimate for thedrowning of the platform drowning is the two-stage major transgres-sion in the earliest middle Eocene.
Drowning of Guyot Carbonate Platforms
The drowning of a carbonate atoll or bank appears to involvemultiple factors acting in conjunction. Essentially, the carbonate fac-tory may be able to handle one crisis, but it is overwhelmed whensimultaneously flooded, overheated, and overfed. These interactionscan be seen in the detailed stratigraphy and general paleoclimate-geographic conditions associated with the four independent guyotsof Limalok (middle Eocene drowning), Wodejebato (Maastrichtiandrowning), Takuyo-Daisan (Albian drowning), and MIT (late Albiandrowning). These four guyots have important similarities in theevents and conditions associated with their demise.
A common precursor is a significant lowstand in sea level, duringwhich the continued upward growth of the carbonate system producesa flattened bank at sea level with a widespread algal-rich intertidalfacies. This shallow-water phase follows a previous prolonged slowtransgression and highstand facies. The transgressive to highstandphase produced an upward-growing carbonate system of "atoll" mor-phology, consisting of a lagoon behind a shoal complex produced bydebris from a seaward "carbonate factory" of corals, algals, rudists,and other organisms. The overlying shallow-water phase is a "flat-
topped bank" morphology produced by infilling of the former lagoonby storm-redeposited rubble, and is capped by quasi-emergent algal-flat facies. The shift from the lagoon phase to this shallow-waterphase is very rapid. This rapid shallowing episode may incorporate a"sequence boundary," during which the rate of eustatic sea-level fallreaches a maximum. A rate of eustatic sea-level fall of ~ 3 ^ m per100,000 yr effectively offsets the rate of seamount subsidence. Amore rapid rate of sea-level fall produces surfaces of emergence onthe guyot platform. This sequence-boundary episode is followed bythe ensuing "lowstand," when eustatic sea level continues to fall at aslowing rate until it attains an eventual stillstand. During this intervalof falling eustatic sea level, accommodation space, both within the"lagoon" and in the seaward active carbonate factory, is formingslower than during stillstands or transgressive pulses. Therefore, theinfilling of the lagoon is probably accompanied by a seaward pro-grading of the carbonate factory and shoal complex. Eventually, theoutward progradation will be constrained when the outer debris apronbecomes oversteepened, and the carbonate factory will become re-duced in width. This environmental limitation of the carbonate fac-tory area was crucial to the Albian and Maastrichtian banks, in whichthe assemblage of isolated corals, algal clusters, and rudists did notproduce a wave-resistant bulwark of framestone, but rather appearedto maintain continued upward growth of the platform merely byoverproduction of bioclastic debris to be washed into outer shoalsand the interior bank (e.g., Grötsch, 1994). Even Tertiary "reefs"resemble a bioclastic "garbage pile" more than an "in-place frame-work" (Hubbard et al., 1990, cited in Grötsch, 1994). Therefore, whensea level begins to rise after the eustatic lowstand, this constrictedband of excess bioclastic debris may not be able to expand its arealextent and associated upward growth of its debris shelf to maintain anaggregate upward accumulation of the entire guyot platform system.
The inhibited development of the carbonate bank during "low-stand" is followed by a major transgression. The transgressive seriesis commonly initiated by a subduced parasequence pulse, then accel-erates as the transgressive phase of each succeeding parasequence issuperimposed on the general deepening trend. The carbonate factory,which had been constricted to a narrow bench around the steepenedflat-topped bank, can only back-step a small distance before it is onthe highest point of the bank surface. The creation of new bioclasticdebris is insufficient to build up a sufficient shoal complex for thecarbonate-factory bench to continue back-stepping to maintain favor-able depths for its associated "zooxanthellae" symbionts. The back-

J.G. OGG, G.F. CAMOIN, A. ARNAUD VANNEAU
stepping is further constrained by the competition with algal mats.The guyot platform has a transgressive deepening stage recordedin the final carbonate facies before the system completely drowns.The observed guyot-drowning transgressions appear to be major andrapid events in the sequence-stratigraphy charts compiled by theExxon group: for example, the late Albian, mid-Maastrichtian, andearly-middle Eocene events are pronounced global events. However,the magnitude of the transgressive rise is only one factor in platformdrowning. Transgressions of nearly comparable magnitude are re-corded, successfully, by the survival of carbonate platforms throughthe Aptian and across the Paleocene/Eocene boundary. Another im-portant factor is the rate of the cumulative transgressive rise. Forexample, transgressive rises of similar magnitudes occur in the latePaleocene (sequence TA2.1) and latest Paleocene (sequence TA 3.1).In the Haq et al. (1988) charts; however, the earlier sea-level rise wasa gradual process over approximately 1.5 m.y., whereas the latertransgressive event spanned less than 0.2 m.y (Fig. 10). The finaldrowning may incorporate a longer term transgressive rise enhancedperiodically by superposition of an independent parasequence rise.Other important and required factors in carbonate platform drowningappear to be an extended "lowstand" interval and associated forma-tion of a flattened carbonate platform and a set of unfavorable envi-ronmental conditions.
A brief but major sea-level excursion, such as the estimated200,000 yr duration to the composite succession of a major sequenceboundary, lowstand, and rapid transgression in the latest Paleocene(lower portion of sequence TA 2.2 of Haq et al., 54.8-55.0 Ma) doesnot allow sufficient time for accumulation of significant subsidenceof the seamount. At a typical subsidence rate of 30 m/m.y., such anexcursion, while deadly to the ecosystems in the short-term, wouldproduce a net deepening of only about 6 m. Therefore, the carbonateplatform will become recolonized after this transgression, and thesystem will recover in a short time. Similar dramatic short-termexcursions, but with inadequate duration to permanently drown car-bonate platforms, characterize the Pleistocene glacial-interglacial cy-cles. In contrast, the rapid earliest middle Eocene major transgressionoccurred nearly 1.3 m.y. after the previous major sea-level drop(transgression of sequence TA 3.2 at 48.2 Ma was a return to condi-tions before the basal TA 3.1 sequence-boundary regression at 49.5Ma). Therefore, a subsidence "deficit" of approximately 40 m hadaccumulated. This added deepening caused by subsidence, whenadded to the rapid rise of sea level, overwhelmed the ability of thecarbonate factory to become reestablished.
Upward-shallowing successions produced by Milankovitch-related sea-level oscillations are present in all systems tracts. Theseoscillations cause periodic accelerations and slowing episodes super-imposed on the longer term trends in sea level. The magnitude ofthese Milankovitch-induced oscillations of sea level in nonglacialintervals is probably equivalent to the combined effect of oceanthermohaline volume changes (0.1-10 m, depending upon the mag-nitude of cyclical heating and cooling of deep ocean waters) andpostulated changes in groundwater storage on the continents (up to10-20 m) (Revelle, 1990; Hay and Leslie, 1990; Plint et al., 1992).During stillstands or periods of falling sea level, these Milankovitch-cycle oscillations of global sea level will produce a series of stacked,condensed, upward-shallowing successions or parasequences. Dur-ing long-term transgressions, these oscillations produce rapid upwardpulses of sea level interspersed with relative stillstands.
The carbonate sediments may become dominated by algae. AtWodejebato Guyot, the Maastrichtian "inner perimeter ridge" at Site874 is capped by a unique stromatoporoid-algal-coral assemblage(Camoin et al., this volume); however, the "lagoonal" setting at Site873 only recorded storm-rubble debris accumulation without a sig-nificant final stage dominated by algal facies (Lincoln et al., thisvolume). At Site 878 on MIT Guyot, the Albian "lagoonal" setting isalso dominated by algal flats in the upper portion (Ogg, this volume).At Site 871, the Eocene "lagoon" shallowed into possible algal flat
intervals, according to the features in FMS imagery and the associ-ated elevated uranium concentrations; however, an unusual algal-enrichment in the uppermost portion of the succession was not notedin the cores or in the downhole logs. The abundance of algal flats orstromatoporoids may be enhanced by increased nutrient availability, aphenomenon observed in present-day Caribbean reefs ("nutrient poi-soning" condition of Schlager, 1989). Vogt (1989) proposed that ex-cess nutrient episodes were a major contributing factor to the drowningof mid-Cretaceous guyot platforms. The high-fertility waters of theequatorial divergence zone would contribute to an increase in nutrientavailability, and it is a curious correlation that all the guyots drilled onLeg 144 preferentially drowned when approaching this equatorialzone. Another factor favoring algal growth may have been their toler-ance relative to other carbonate-producing organism under conditionsof heavy rainfall mixed with high evaporation rates in the tropicalwaters under the Intertropical Convergence Zone (ITCZ). Menard(1982) noted the apparent correlation between "healthy" atoll-reefsystems in the nonequatorial regions, contrasted with "nonhealthy"atoll-reefs in proximity to the equator, which he also associated withrainfall and evaporation patterns. Under such variable climatic ex-tremes, especially those affecting the salinity of shallow semirestrictedwaters, algae are probably more tolerant than are other large carbonateproducers. However, an abundance of algal growths can be a death-knell to a carbonate factory because these will prevent attachment oreven smother other sessile organisms. This end effect of "nutrientpoisoning" is the inability of a carbonate factory to continue to producesufficient bioclasts to maintain an upward growth of the larger platformduring the combination of subsidence and rising sea levels.
The final environmental factor, which is based on the observedcorrelation of preferential drownings with global paleoclimatictrends, is a period of enhanced global warmth. The Albian and mid-Maastrichtian are the warmest periods during the Pacific Cretaceousplatform developments (there are no carbonate platforms known inthe Pacific during the even warmer Cenomanian-Santonian), and themiddle Eocene is the warmest interval of the Tertiary. In presentPacific reefs, El Nino events of anomalous warming produce wide-spread coral bleaching (inability of the corals to retain zooxanthellaein their tissues). The production of carbonate skeletal material ceases,and the reef ecosystem is destroyed. The reefs around the GalapagosIslands were essentially permanently destroyed by the 1982-1983 ElNino. Based upon the El Nino analogy, geological periods of en-hanced warmth may be less favorable for continuous "healthy" car-bonate platform growth. In this regard, it is interesting that all theLeg 144 guyots drowned during their approach to the paleo-equator,which may represent both the warmest waters in the Pacific in theseregions and the region with greatest susceptibility to El Nino anoma-lous warming episodes. Certainly, the observed combination of "hot"geological paleoclimates, plus proximity to the paleo-equator, plusthe probable periodic occurrence of anomalous warming episodes inthe tropical Pacific associated with such El Nino-Southern Oscilla-tions would represent the worst possible climatic condition for acarbonate factory based on symbionts (e.g., corals, rudists, possiblyred algae) to maintain the active upward growth necessary to keeppace with a rapidly rising sea level.
A carbonate platform system may be able to survive exposure toany of these factors individually, but when four or five of these con-ditions act in devastating harmony, then the guyot will sink below thewaves, leaving behind only an enigma for future marine geologists.
ACKNOWLEDGMENTS
This research was sponsored by the Ocean Drilling Program andUSSAC. Many of our interpretations of the depositional history arebased upon the observations and presentations by our shipboardcolleagues. Kai-Uwe Grafe provided advice and an advance copies ofhis studies on carbonate platform sequences and Paleocene-Eocenesea-level changes, and a valuable review and critique. Gabi Ogg
246

LIMALOK GUYOT: DEPOSITIONAL HISTORY
drafted key figures and aided production of the manuscript versions.Valuable reviews and critiques were provided by Kai-Uwe Gràfe andan anonymous reviewer.
REFERENCES*
Asquith, G.D., 1979. Subsurface Carbonate Depositional Models: A ConciseReview: Tulsa, OK (Petroleum Publ. Co.).
Bourke, L., Delfmer, P., Trouiller, J.-C, Fett, T., Grace, M., Luthi, S., Serra,O., and Standen, E., 1989. Using Formation MicroScanner images. Tech.Rev., 37:16-40.
Cooper, P., Arnaud, H.M., and Flood, P.G., 1995. Formation MicroScannerlogging responses to lithology in guyot carbonate platforms and theirimplications: Sites 865 and 866. In Winterer, E.L., Sager, W.W., Firth, J.V.,and Sinton, J.M. (Eds.), Proc. ODP, Sci. Results, 143: College Station, TX(Ocean Drilling Program), 329-372.
Detrick, R.S., and Crough, S.T., 1978. Island subsidence, hot spots, andlithospheric thinning. J. Geophys. Res., 83:1236-1244.
Dorfman, M.H., Newey, J.-J., and Coates, G.R., 1990. New techniques inlithofacies determination and permeability prediction in carbontes usingwell logs. In Hurst, A., Lovell, M.A., and Morton, A.C. (Eds.), GeologicalApplications of Wireline Logs. Geol. Soc. Spec. Publ. London, 48:113—120.
Drummond, C.N., and Wilkinson, B.H., 1993a. Aperiodic accumulation ofcyclic peritidal carbonate. Geology, 21:1023-1026.
, 1993b. On the use of cycle thickness diagrams as records oflong-term sealevel change during accumulation of carbonate sequences. J.Geol., 101:687-702.
Ekstrom, M.P., Dahan, C.A., Chen, M.-Y, Lloyd, P.M., and Rossi, D.J., 1986.Formation imaging with microelectrical scanning arrays. Trans. SPWLAAnnu. Logging Symp., 27:Pap. BB.
Goldhammer, R.K., Dunn, P.A., and Hardie, L.A., 1990. Depositional cycles,composite sea-level changes, cycle stacking patterns, and the hierarchy ofstratigraphic forcing: examples from Alpine Triassic platform carbonates.Geol. Soc. Am. Bull., 102:535-562.
Goldhammer, R.K., Lehmann, P.J., and Dunn, P.A., 1993. The origin ofhigh-frequency platform carbonate cycles and third-order sequences(Lower Ordovician El Paso Gp, west Texas): constraints from outcrop dataand stratigraphic modeling. /. Sediment. Petrol, 63:318-359.
Gràfe, K.-U., 1994. Sequence stratigraphy in the Cretaceous and Paleogene(Aptian to Eocene) of the Basco-Cantabrian Basin (N. Spain). Tub. Ge-owiss. Arbeiten, Reihe A, 18.
Gràfe, K.-U., and Wiedmann, J., 1993. Sequence stratigraphy in the UpperCretaceous of the Basco-Cantabrian Basin (northern Spain). Geol.Rundsch., 82:327-361.
Grötsch, J., 1994. Guilds, cycles and episodic vertical aggradation of a reef(late Barremian to early Aptian, Dinaric carbonate platform, Slovenia).Spec. Publ. Int. Assoc. Sedimentol, 19:227-242.
Haq, B.U., Hardenbol, J., and Vail, P.R., 1988. Mesozoic and Cenozoicchronostratigraphy and cycles of sea-level change. In Wilgus, C.K., Hast-ings, B.S., Kendall, C.G.St.C, Posamentier, H.W., Ross, C.A., and VanWagoner, J.C. (Eds.), Sea-level Changes—An Integrated Approach. Spec.Publ.—Soc. Econ. Paleontol. Mineral, 42:72-108.
Harker, S.D., McGann, G.J., Bourke, L.T., and Adams, J.T., 1990. Methodol-ogy of Formation Micro Scanner image interpretation in Claymore andScapa Fields (North Sea). In Hurst, A., Lovell, M.A., and Morton, A.C.(Eds.), Geological Applications of Wireline Logs. Geol. Soc. Spec. Publ.London, 48:11-25.
Hay, W.W., and Leslie, M.A., 1990. Could possible changes in global ground-water reservoir cause eustatic sea-level fluctuations? In Revelle, R. (Ed.),Sea Level Change. Nat. Res. Counc, Stud. Geophys., 161-170.
Hubbard, D.K., Miller, A.I., and Scaturo, D., 1990. Production and cycling ofcalcium carbonate in a shelf-edge reef system (St. Croix, U.S. VirginIslands): applications to the nature of reef systems in the fossil record. J.Sediment. Petrol, 60:335-360.
Jones, B., and Desrochers, A., 1992. Shallow platform carbonates. In Walker,R.G., and James, N.P. (Eds), Fades Models: Response to Sea LevelChange. Geol. Assoc. Can., 277-301.
Lincoln, J.M., Pringle, M.S., and Premoli-Silva, I., 1993. Early and LateCretaceous volcanism and reef-building in the Marshall Islands. In Pringle,M.S., Sager, W.W., Sliter, W.V., and Stein, S. (Eds.), The Mesozoic Pacific:Geology, Tectonics, and Volcanism. Geophys. Monogr., Am. Geophys.Union, 77:279-305.
Lincoln, J.M., and Schlanger, S.O., 1991. Atoll stratigraphy as a record of sealevel change: problems and prospects. J. Geophys. Res., 96:6727-6752.
.Menard, H.W., 1982. The influence of rainfall upon the morphology anddistribution of atolls. In Scrutton, R.A., and Talwani, M. (Eds.), The OceanFloor: Bruce Heezen Commemorative Volume: Chichester (Wiley), 305-311.
Molinie, A.J., and Ogg, J.G., 1992a. Formation microscanner imagery ofLower Cretaceous and Jurassic sediments from the western Pacific (Site801). In Larson, R.L., Lancelot, Y, et al., Proc. ODP, Sci. Results, 129:College Station, TX (Ocean Drilling Program), 671-691.
, 1992b. Milankovitch cycles in Upper Jurassic and Lower Creta-ceous radiolarites of the equatorial Pacific: spectral analysis and sedimen-tation rate curves. In Larson, R.L., Lancelot, Y, et al., Proc. ODP, Sci.Results, 129: College Station, TX (Ocean Drilling Program), 529-547.
Osleger, D., 1991. Subtidal carbonate cycles: implications for allocyclic vs.autocyclic controls. Geology, 19:917-920.
Osleger, D., and Read, J.F., 1993. Comparative analysis of methods used todefine eustatic variation in outcrop: Late Cambrian interbasinal sequencedevelopment. Am. /. Sci., 293:157-216.
Pezard, P., and Luthi, S., 1988. Borehole electrical images in the basement ofthe Cajon Pass Scientific drillhole, California: fracture identification andtectonic implications. Geophys. Res. Lett., 15:1017-1020.
Pezard, P.A., Lovell, M., and Ocean Drilling Program Leg 126 ShipboardScientific Party, 1990. Downhole images—electrical scanning reveals thenature of subsurface oceanic crust. Eos, 71:710.
Plint, A.G., Eyles, N., Eyles, C, and Walker, R.G., 1992. Control of sea-levelchange. In Walker, R.G., and James, N.P. (Eds.), Fades Models: Responseto Sea Level Change. Geol. Assoc. Can., 15-25.
Pratt, B.R., James, N.P., and Cowan, C.A., 1992. Pertidal carbonates. InWalker, R.G., and James, N.P. (Eds.), Fades Models: Response to SeaLevel Change. Geol. Assoc. Canada, 303-322.
Premoli Silva, I., Haggerty, J., Rack, F, et al., 1993. Proc. ODP, Init. Repts.,144: College Station, TX (Ocean Drilling Program).
Revelle, R. (Ed.), 1990. Sea Level Change. Nat. Res. Counc, Stud. Geophys.Schlager, W, 1989. Drowning unconformities on carbonate platforms. In
Wilgus, C.K., Hastings, B.S., Kendall, C.S., Posamentier, H.W., Ross,C.A., and van Wagoner, J.C. (Eds.), Sea Level Changes—An IntegratedApproach. Spec. Publ.—Soc. Econ. Paleontol. Mineral., 42:15-25.
Serra, O., 1985. Shallow-water carbonate environment (Sect. 5.8). In Sedimen-tary Environments from Wireline Logs: Houston (Schlumberger Educ.Services), 143-154.
Shipboard Scientific Party, 1993. Site 871. In Premoli Silva, I., Haggerty, J.,Rack, F, et al., Proc. ODP, Init. Repts., 144: College Station, TX (OceanDrilling Program), 41-103.
Tucker, M.E., and Wright, P.V., 1990. Carbonate Sedimentology: Oxford(Blackwell Sci. Publ.).
Van Wagoner, J.C, Mitchum, R.M., Campion, K.M., and Rahmanian, V.D.,1990. Siliciclastic Sequence Stratigraphy in Well Logs, Cores, and Out-crops: Concepts for High-Resolution Correlation of Time and Fades.AAPG Methods Explor. Sen, 7.
Vogt, P.R., 1989. Volcanogenic upwelling of anoxic, nutrient-rich water: apossible factor in carbonate-bank/reef demise and benthic faunal extinc-tions? Geol. Soc. Am. Bull, 101:1225-1245.
Watts, A.B., and Ribe, N.M., 1984. On geoid heights and flexure of thelithosphere at seamounts. J. Geophys. Res., 89:11152-11170.
Wilson, J.L., 1975. Carbonate Fades in Geologic History: Berlin (Springer-Verlag).
Wolfe, C.J., and McNutt, M.K., 1991. Compensation of Cretaceous guyots ofthe Darwin Rise, northwest Pacific Ocean. J. Geophys. Res., 86:2363-2374.
* Abbreviations for names of organizations and publications in ODP reference lists followthe style given in Chemical Abstracts Service Source Index (published by AmericanChemical Society).
Date of initial receipt: 4 February 1994Date of acceptance: 14 October 1994Ms 144SR-042
247

J.G. OGG, G.F. CAMOIN, A. ARNAUD VANNEAU
APPENDIXDescription and Interpretation of Facies Subunits
The following summary of the carbonate facies integrates the independentobservations from the cored sediments (typically much less than 50 cm ofrecovery from each 10-m cored interval), the quantitative resistivity measure-ments, the natural gamma-ray intensities, and the detailed FMS "textures" andvertical successions. Division of the lithologic succession into subunits isbased initially upon the facies and nomenclature of shipboard-defined litho-logic units. At Site 871, the entire carbonate platform succession was denotedas lithologic Unit II with six lettered subunits. Additional subdivisions aredefined according to coherent log-facies packets or individual recognizedparasequences (Fig. 1). These subunits simplify later discussions of sedimen-tary history interpretation.
Relative FMS resistivity (darkness on gray-scale imagery) is expressed ina shorthand of "low" (<2 Qm), "medium" (2-5 Qm), and "high" (>5 Qm)resistivity. Relative resistivity of features produced in the dynamic-processedenhanced FMS imagery denoted as "higher" or "lower" resistivity, and do notimply fixed resistivity ranges. In the accompanying log-stratigraphy columns,the resistivity values from shallow-focused resistivity tool (SFLU instrument)are plotted after depth-shifting to FMS depths. Some features on this resistivitylog (resolution of 1 m) have been adjusted by increasing or decreasing thesharpness and amplitude of peaks to agree with the high-resolution resistivityrecords of the FMS imagery (resolution of 2.5 mm).
All depths of features and subunits, except quoted cored intervals, refer tothe FMS logs as processed by Lamont-BRG or corrected depths on the otherdownhole logs (see main text).
Lithologic Unit IIIClay Overlying Basalt
(425.7^*51.6 mbsf, 25.9 m thickness)
Core 144-871C-32R (422.5^132.2 mbsf, 6.1 m recovery): clay, mottled olivegray to dark red; overlain at Section 1, 40 cm, by dark gray skeletalpackstone
Summary of Logging Facies
426.0-425.7 mbsf: Top of clay (lithologic Unit III). The FMS resistivitytool penetrated to a depth of 426 mbsf and may have recorded the top of theclay of lithologic Unit III as the top of a very low resistivity unit extendingupward to 425.7 mbsf (Fig. 1). This placement of the top of the clay at 425.7mbsf is supported by the geochemical tool, which indicates a sharp increasein the aluminum and iron indicator ratio and a corresponding decrease incalcium below 423 mbsf. However, the 424-mbsf level is at the deepest depthlimit of the geochemical tool record; therefore, these signals may be influencedby the 0.5-m resolution of the tool.
Lithologic Subunit IIFDark Gray Foraminifer-Mollusk Packstone, with Abundant Miliolids,
Mollusks, Carbon Fragments, and Pyrite(421.9^125.7 mbsf, 3.8 m thickness, late Paleocene)
Core 144-871C-32R (422.5^432.2 mbsf, 6.1 m recovery): dark grayskeletal packstone above Section 1, 40 cm, of thick-walled mollusk fragments,gastropods, and common foraminifers (alveolinids, miliolids, nummulites),coarse-grained and poorly sorted
Core 144-871C-31R (412.8-422.5 mbsf, 0.4 m recovery): dark graypackstone of miliolids and mollusks below Section 1, 21 cm, very coarsegrained and poorly sorted; upper 6 cm of recovered portion is yellowishcolored; overlain by tan-colored algal grainstone with rhodoliths
Summary of Logging Facies
425.7 mbsf: Base of carbonate platform. We place the base of the carbonateplatform (lithologic Unit II) at 425.7 mbsf. The contact to the overlyinghigh-resistivity carbonate facies is very sharp, although this boundary mayhave been enhanced by later diagenesis.
421.9-425.7 mbsf: Very high-resistivity, 3.8-m interval with a single, verylow-resistivity, 20-cm bed at 424.4^124.6 mbsf. There is a progressive upwardtrend toward higher resistivity. Dynamic FMS imagery indicates that thisinterval is medium bedded (approximately seven beds) with thin (-5-10 cm)interbeds of relatively lower resistivity lithology. On the dynamic FMS im-
agery this bedding is most pronounced and regular in the lower 2 m of the unit,whereas the relatively lower resistivity interbeds in the upper portion are notas well defined and appear to be wavy or discontinuous. An upward decreaseoccurs in the iron-indicator ratio and in aluminum, whereas calcium progres-sively increases. This suggests an upward decrease in clay content, probablyderived from exposures of the claystone facies. In contrast to the shipboardreports of pyrite, no apparent change takes place in the sulfur content relativeto the overlying units.
Interpretation: The lower boundary of the carbonate platform is a flood-ing surface on the muddy near-shore margin of a weathered volcanic edifice.The lowermost facies is a medium-bedded, poorly sorted carbonate sand, com-prised primarily of foraminifer and mollusk fragments. The bioclast assem-blage suggests redeposition from an original "lagoonal" environment. Clayand organic material continued to be intermixed into these beds, but in decreas-ing amounts. The dark gray coloration, the result of a combination of fineorganic material and pyrite, indicates a low-oxygen, post-burial environment.A storm-bed origin for these beds, possibly followed by some bioturbationmixing, is suggested by the apparent pulse deposition followed by establish-ment of anaerobic conditions within the beds, medium-bedding of homoge-neous, poorly sorted or vaguely upward-fining packstone, and intermixed clay.The shipboard sedimentology report indicates that lithologic Subunit IIF iscoarse grained at its base and becomes finer grained toward the top, where ithas less than 2% porosity (Shipboard Scientific Party, 1993). This upward-fin-ing trend may partially cause the upward increase in resistivity. The top of this3.8-m unit was emergent, as indicated by the yellowish limonite weathering.
This packet of dark gray packstone beds represents a transgressive-highstand facies, terminated by a drop in relative sea level. The transgressionmay be a local feature related to the subsidence of the volcanic edifice, ratherthan caused by a significant eustatic sea-level rise. However, the emergentsurface overlain by an algal grainstone facies requires a significant drop of sealevel. The entire 3.8-m unit could be considered as a parasequence within ageneral transgressive or early highstand systems tract, rather than as a sepa-rate sequence.
Lithologic Subunit HERhodolith Grainstone and Packstone, with Abundant
Red-algal Fragments(387.7-421.9 mbsf, 34.2 m thickness, late Paleocene)
Summary of Logging Facies
This algal-rich Subunit HE is characterized by high natural gamma-rayintensity and by a sawtooth pattern of six main cycles or parasequences ofupward-increasing resistivity (Fig. 1). Each parasequences displays a progres-sive upward increase in resistivity, terminating sharply in the relatively low-resistivity zone at the base of the next parasequence (Fig. 3). These para-sequences average about 5 m in thickness and commonly display an internalstructure of irregular meter-thick zones of relatively higher or lower resistivityfluctuations superimposed on the general upward trend toward higher resistiv-ity. Peaks in uranium concentration occur just below the highest resistivity,uppermost surface of each parasequences. The higher parasequences arethinner than the lower cycles, with the uppermost compound cycle consistingof four distinct pulses. These six major parasequences are designated aslogging facies Subunits HE-1 through IIE-6.
The general uranium enrichment of Subunit HE is probably associated withalgal-rich intervals in these beds, caused by the redox scavenging of uraniumfrom seawater in the reducing microenvironments of algal films (Serra, 1985).However, another process that may contribute to the uranium enrichment iscondensed sedimentation.
The top of Subunit HE was placed at 387.6 mbsf at the sharp lowerboundary of a 35-m-thick, low-resistivity interval. The overlying unit lackshigh-amplitude parasequences and has a low natural gamma-ray intensity,although the lowest 10 m contains another sawtooth peak of uranium concen-tration. This boundary placement from the logging characteristics is signifi-cantly lower than the 374.3-mbsf level assigned by shipboard sedimentologistsfrom the limited core recovery.
Subunit HE represents a late highstand systems tract followed by an episodewhen falling sea levels partially kept pace with seamount subsidence rates. A"sequence boundary" or level of maximum rates of falling eustatic sea level,could be assigned to 400.1 mbsf. This level is a surface of emergence and marksthe change between a lower interval of pronounced development of 5-m-thickparasequences (typical of highstand facies) to an upper interval dominated byalgal flats and thin parasequence before the next drowning episode.

LIMALOK GUYOT: DEPOSITIONAL HISTORY
Logging Facies Subunit IIE-1(416.7-421.9 mbsf, 5.2 m thickness)
Core 144-871C-31R {412.8-422.5 mbsf, 0.4 m recovery): foraminifer-algal grainstone, above Section 1, 21 cm, well sorted and coarse grained,with red-algal rhodoliths up to 1-cm diameter; overlain by bioturbated,gastropod-mold-rich wackestone
416.7-421.9 mbsf: Above the sharp, very high-resistivity top of SubunitIIF at 421.9 mbsf is a 1.5-m-thick interval of medium to high resistivity thatdisplays about 10%-20% of equant, high-resistivity balls of 5- to 10-cm diam-eter in the FMS imagery. This nonbedded facies probably consists of algal-rhodoliths within a less cemented grainstone. This facies passes gradationallyupward into a high-resistivity interval from about 420.2 to 418.0 mbsf, which,in addition to the high-resistivity ?rhodolith balls, contains about 5%-10% oflenticular to quasiplanar patches, 10 to 20 cm thick and of low to medium resis-tivity. Following a 0.6-m interval of relatively lower resistivity, the sequenceterminates in a 0.7-m-thick bed (417.4-416.7 mbsf) of high resistivity.
Interpretation: A flooding surface at the base is followed by upward-shallowing grainstone with red-algal rhodoliths and flattened algal biscuits.The parasequence was terminated by another deepening pulse.
Logging Facies Subunit IIE-2(409.1^16.7 mbsf, 7.6 m thickness)
409.1-416.7 mbsf: The lower 3 m is dominated by medium resistivity, buthas four to five bands of relatively higher resistivity apparent in the dynamic-processed FMS imagery. "Rhodolith"-ball features are absent until 413.0 mbsf.A rapid upward increase in resistivity also begins at 413.0 mbsf, and peaks ina very high-resistivity zone at 412.0-411.0 mbsf. The uppermost 2 m havemottles of low resistivity (cavities?) within a high-resistivity interval; the unitterminates in a sharp surface at 409.1 mbsf.
Interpretation: The lower portion may correspond to the leached gastro-pod wackestone recovered at the top of Core 144-871C-31R. An upward-shal-lowing succession passes into algal-rich facies, capped by a well-cementedbed with possible solution features. The upper surface may have been emergentduring the cementation episode, before the drowning by the next parasequencebasal transgression.
Logging Facies Subunit IIE-3(403.1^09.1 mbsf, 6.0 m thickness)
Core 144-871C-30R (403.1-412.8 mbsf, 1.3 m recovery): algal-coral-bivalve-gastropod packstone coarsening upward to algal-rich rudstone tograinstone
403.1-409.1 mbsf: The basal 1.7 m consists of a homogeneous low-resis-tivity facies without "rhodolith"-ball features. The interval from 405.6 to 407.4mbsf is composed of thin-bedded (10-15 cm) alternations of medium- andhigh-resistivity lithology, with an associated peak in natural gamma-ray inten-sity. The uppermost 1.5 m is high resistivity with irregular thin beds and a sharpupper surface.
Interpretation: This is a parasequence of packstone, which coarsensupward to algal-rich grainstone and terminates in a deepening surface.
Logging Facies Subunit IIE-4(400.1-403.1 mbsf, 3.0 m thickness)
400.1^103.1 mbsf: Rapid upward increase from a basal 1.3 m of lowresistivity to a major high-resistivity peak. Sharp upper surface. High naturalgamma-ray intensity associated with middle portion.
Interpretation: The first set of parasequences culminates in this high-am-plitude, condensed parasequence. The top surface was possibly emergent. Incontrast, the tops of the overlying parasequences of Subunits IIE-5 and IIE-6are not sharp surfaces (Fig. 3) suggesting that these cycles were not developedin as shallow to emergent depths as this Subunit IIE-4. Accumulation of theseoverlying parasequences appear to limited by subsidence being partiallycancelled by a dropping sea level. Therefore, the rapid shift between thewell-developed parasequences of Subunits IIE-1 through IIE-4 to the "con-densed" overlying cycles is considered to represent a "sequence boundary," inwhich the a rapid upward-shallowing was induced by a relative sea-level fall.
Logging Facies Subunit IIE-5(396.0-400.1 mbsf, 4.1 m thickness)
Core 144-871C-29R (393.4^03.1 mbsf, 0.3 m recovery): algal packstonewith rhodoliths; overlain by a 5-cm piece of foraminifer-peloid grainstone(which may be downhole contamination)
396.0-400.1 mbsf: Basal 1.7 m is homogeneous, low resistivity grain-stone-texture with "rhodolifh"-ball features. The upper 2.4 m has five alterna-tions of medium- and high-resistivity beds or lenses. High natural gamma-rayintensity throughout.
Interpretation: This parasequence is primarily in algal-rich lithologies ofrhodolith-grainstone changing upward to a facies with possible algal-cyano-bacterial mats.
Logging Facies Subunit IIE-6(387.6-396.0 mbsf, 8.4 m thickness)
Core 144-871C-28R (383.7-393.4 mbsf, 1.2 m recovery): red-algal grain-stone with rhodoliths, benthic foraminifers, coral, and other skeletal fragments
This subunit has four distinct peaks of high resistivity, separated by low-to medium-resistivity facies (Fig. 3). The entire interval has continuous highnatural gamma-ray intensity with minor peaks corresponding to the higherresistivity beds. The abundance of "rhodolith"-ball features in the dynamicFMS imagery increases with each higher and (?) coarser grained cycle.
393.0-396.0 mbsf: Lower 1.8-m interval with "rhodolith"-ball features,followed by a rapid upward increase to 40-cm-thick peak of high resistivity.
391.6-393.0 mbsf: Second thin cycle from medium resistivity upward to80-cm-thick bed of high resistivity.
389.8-391.6 mbsf: Third thin cycle, with the upper 20-cm-thick bed ofhigh resistivity followed by a 10-cm transition interval into the lower resistivitybase of the next cycle.
387.6-389.8 mbsf: Fourth cycle is capped by a 1.0-m-thick, rhodolith-richbed with a sharp upper surface (Fig. 3).
Interpretation: These thin parasequences are developed in an algal-grain-stone to a setting with possible algal-cyanobacterial mats.
Lithologic Subunit IIDForaminifer Packstone and Algal-coral Grainstone(320.3-387.7 mbsf, 67.4 m thickness, late Paleocene)
Summary of Logging Facies
The lower 34 m of Subunit IID consists of sustained low- to medium-resistivity lagoonal facies (mainly foraminifer-peloid packstone) within awidened borehole (Fig. 3). There is a progressive upward increase in resistivity,with a thick peak in natural gamma-ray intensity in the middle at 375.2 mbsfcorresponding to an algal-rich interval (division between Subunits IID-1 andIID-2). This lower part ends in a 4.5-m interval of low resistivity (Sub-unit IID-3).
The upper 33 m of this subunit is characterized by a series of at least sixmajor algal-rich parasequences of increasing shallow-water aspect (SubunitsIID-4 through IID-7) (Fig. 4). The overlying Subunit IIC begins with adeepening phase (Fig. 5).
Subunit IID is a full sequence between a basal transgressive surface,followed by transgressive and maximum flooding (Subunits IID-1 to IID-3),and a progressive upward-shallowing succession (Subunits IID-4 to IID-7). Thesuccession is terminated by another transgressive surface (Fig. 5). Relativelysharp upward-shallowing transitions to algal facies at 327.3 and 347.2 mbsf arecandidates for "sequence boundaries," although there is no clear link betweendepth and the occurrence of red algae. Within this overall sequence are numerousparasequence sets. Secondary transgressive/highstand systems tracts with asso-ciated flooding and sequence-boundary surfaces appear to be present. Thiscomplex suite was assigned as a single subunit by the shipboard sedimentolo-gists, mainly for lack of sufficient core recovery to identify the various facies.
Logging Facies Subunit IID-1(375.2-387.6 mbsf, 12.4 m thickness)
Core 144-871C-27R (374.3-383.7 mbsf, 0.1 m recovery): lower piece aforaminifer packstone; upper piece a red-algal encrustation
249

J.G. OGG, G.F. CAMOIN, A. ARNAUD VANNEAU
This unit has a general increase upward to a high natural gamma-rayintensity, with the peak sharply terminated at 375.2 mbsf.
379.2-387.6 mbsf: Low-resistivity interval ending in a 1.4-m-thick, sharp-topped, medium-resistivity bed that coincides with a minor peak in uraniumconcentration.
375.2-379.2 mbsf: Dynamic FMS imagery indicates five subequal alter-nations of relatively higher and lower resistivities. The gradual increase anduppermost sharp decrease in uranium concentrations within this interval, doesnot have obvious corresponding features in the FMS imagery, suggesting thatsome of the uranium concentration may be associated with a redox front,coincident with the higher resistivity base of the next unit.
Interpretation: Basal deepening and deposition of foraminifer packstonewas followed by two upward-shallowing successions into algal-rich facies.These parasequences are subdued relative to the underlying Subunit HE,indicating a relative deepening of the facies. Therefore, this Subunit IID-1 isassigned to a transgressive systems tract. The peak in uranium concentrationis a combination of an algal-facies and a redox contrast to the overlying nextphase of transgressive flooding, which may have had a higher organic content.
Logging Facies Subunit IID-2(358.2-375.2 mbsf, 17.0 m thickness)
Core 144-871C-26R (364.7-374.3 mbsf, 0.1 m recovery): foraminifer-skeletal packstone to wackestone with numerous shell fragments and gastro-pod molds, white
375.2-358.2 mbsf: This unit of medium-resistivity has a dynamic-processed FMS texture of ca. 1-cm-diameter, high-resistivity "clasts" in amassive grainstone-packstone host facies. There is very low natural gamma-rayintensity throughout this interval, which suggests that these features are bioclastsor intraclasts rather than algal rhodoliths. There is a sharp lower boundarybetween this facies and the underlying Subunit IID-1, and the upper boundarywas placed at the contact to the overlying low-resistivity facies of Subunit IID-3.
Interpretation: This unit is a bioclast-rich foraminifer packstone to bi-valve-gastropod floatstone. There is no natural gamma-ray or core-recoverysignature of algal enrichment. Storm-induced winnowing or influx of in-traclasts may be present, but such processes did not result in distinct layers.Alternatively, the entire deposit is a stacked set of storm-winnowed deposits.The deposit begins with a transgressive deepening, therefore, is assigned as atransgressive to early highstand systems tract. The lack of significant algalsignature, relative to adjacent units, suggest that this interval represents thedeepest depositional environment (i.e., maximum flooding) of Subunit IID.
Logging Facies Subunit IID-3(353.6-358.2 mbsf, 4.6 m thickness)
Core 144-871C-25R (355.1-364.7 mbsf, 0.3 m recovery): lower piece abivalve-gastropod floatstone; middle piece a red-algal boundstone; upperpiece a foraminifer-peloid packstone, pinkish gray
353.6-358.2 mbsf: This unit has a very low-resistivity lithology, with adynamic FMS texture of grainstone-packstone, interbedded with 10- to 20-cm-thick lenses and blocks of high-resistivity. The lower portion of this intervalhas a relatively increased uranium concentration. The borehole is washed outin this zone. The upper boundary of this unit is gradational to the high-resis-tivity beds at the base of Subunit IID-4 and could be considered as the lowerportion of its lower parasequence.
Interpretation: The logging characteristics and limited core recoveryindicate that this interval is poorly cemented foraminifer-pellet grainstone withscattered lenses of red-algal encrustations. This unit is considered to be part ofa highstand systems tract because it is transitional to the overlying suite ofalgal-rich parasequences.
Logging Facies Subunit IID-4(347.2-353.6 mbsf, 6.4 m thickness)
Core 144-871C-24R (345.4-355.1 mbsf, 0.05 m recovery): piece of fora-minifer wackestone with bivalve and gastropod molds
349.6-353.6 mbsf: Compound parasequence of two upward increases inresistivity. Lower cycle culminates in a 40-cm, high-resistivity peak with asharp upper surface at 351.8 mbsf. Second cycle ends in a thicker (1.4 m),high-resistivity bed, also with a sharp upper surface. The second cycle isassociated with a high concentration of uranium.
347.2-349.6 mbsf: Thin, but high-amplitude, parasequence with a veryhigh-resistivity bed in the upper half that is associated with a high concentra-tion of uranium.
Interpretation: These are a set of thin, upward-shallowing parasequencesin algal- or cyanobacterial-rich facies. The very high resistivity of the upper-most bed implies a cemented horizon, which may have been an emergentsurface. The subunit is a part of a highstand systems tract.
Logging Facies Subunit IID-5(340.2-347.2 mbsf, 7.0 m thickness)
340.2-347.2 mbsf: Parasequence of upward increase in resistivity. Thevery high natural gamma-ray intensity includes three secondary peaks inuranium concentration. The FMS imagery indicates thin, discontinuous, high-resistivity beds interbedded with a relatively lower resistivity, grainstone-pack-stone texture.
Interpretation: This is an algal- or cyanobacterial-rich facies, possiblywith algal mats, and appears to have three thin parasequences within a mainparasequence set. This facies overlies a cemented surface on the underlyingsubunit, which is tentatively assigned as a minor "sequence boundary" (rapidupward-shallowing episode). Therefore, this unit was deposited during aninterval of falling relative sea level or stillstand at a "lowstand" of eustatic sealevel, but within a larger sequence framework. The sharp upper surface to anon-algal facies is considered to be a transgressive deepening event.
Logging Facies Subunit IID-6(333.6-340.2 mbsf, 6.6 m thickness)
Core 144-871C-23R (335.8-345.4 mbsf, 0.5 m recovery): foraminiferwackestone to grainstone; top piece a grainstone of red algae, coral frag-ments, and foraminifers
333.6-340.2 mbsf: This unit is characterized by low to medium resistivityand low natural gamma-ray intensity. However, the appearance in the FMSimagery is similar to the lower portion of the underlying unit with a low-resis-tivity grainstone-packstone texture containing scattered, higher resistivity, 5-to 10-cm-thick lenses and ~l-cm spheres of higher resistivity.
Interpretation: This foraminifer-skeletal packstone has subordinate algalaccumulations. This interval is a deeper facies than the adjacent units, andrepresents a brief excursion into a transgressive to early highstand systems tract.The upper portion is transitional into the next set of algal-rich parasequences.
Logging Facies Subunit IID-7(320.3-333.6 mbsf, 13.3 m thickness)
Core 144-871C-22R (326.2-335.8 mbsf, 0.3 m recovery): foraminiferpackstone-grainstone and coral-algal-foraminifer packstone
Core 144-871C-21R (316.5-326.2 mbsf, 1.4 m recovery): algal grain-stone in lower part; predominantly coral-gastropod rudstone and foraminifergrainstone in upper part
This interval has four parasequences of low-medium resistivity changingupward to high resistivity. Major peaks of uranium content correlate with thehigh-resistivity beds. The dynamic FMS imagery indicates a combination oflaminated algal mats and grainstone to rudstone beds.
331.5-333.6 mbsf: First parasequence, capped by a 50-cm-thick, veryhigh-resistivity bed with a sharp top. This first parasequence is comparativelyalgal-poor relative to the overlying parasequences.
327.3-331.5 mbsf: This second cycle may be a compound parasequencebecause there are two separate sharp-topped high-resistivity beds in theupper 2 m.
325.4-327.3 mbsf: This third cycle also has a two-parasequence character.320.3-325.4 mbsf: Fourth parasequence cycle (Fig. 5) is a thick episode
with a lower resistivity basal portion relative to the underlying parasequences.The upper portion is a cluster of very high-resistivity beds interbedded withmedium-resistivity lithology. Sharp top.
Interpretation: Algal-flat facies with several upward-shallowing epi-sodes. This facies is assigned as a highstand systems tract to possible onset offalling eustatic sea level. A possible minor sequence boundary (maximum rateof relative sea-level fall) is placed at 331.5 mbsf, where a pronounced high-resistivity cemented bed caps the lowest algal-poor parasequence; this intervalmay represent the most rapid rate of upward shallowing of facies.
250
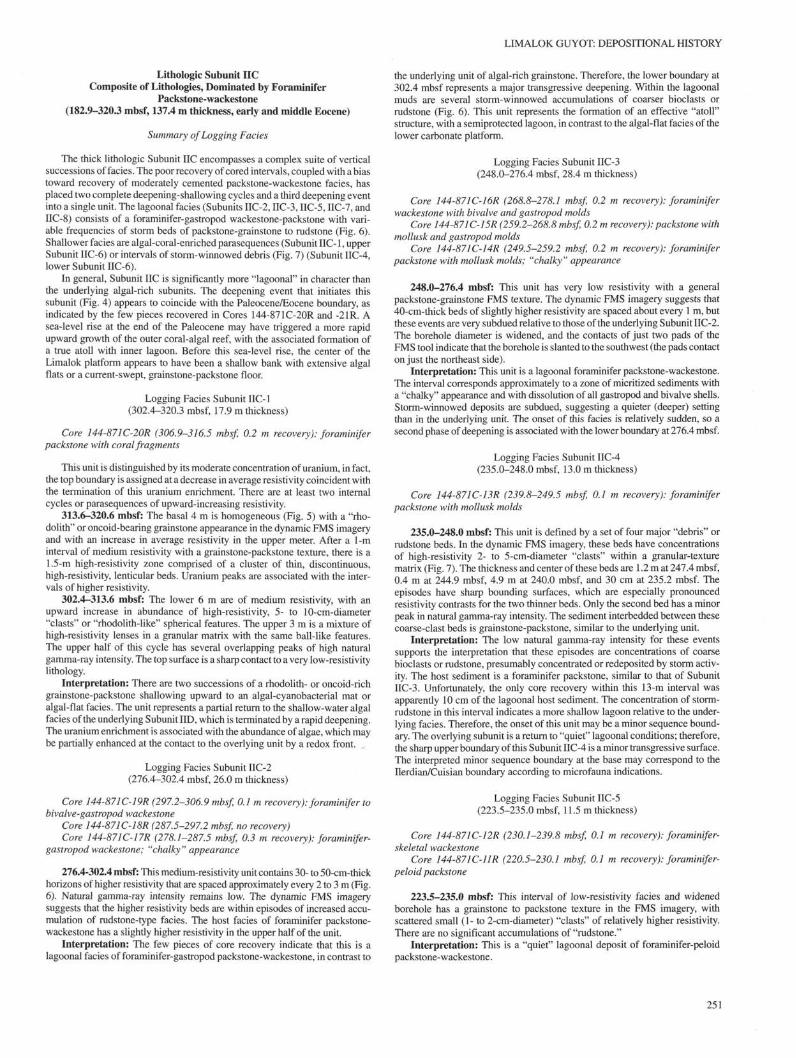
LIMALOK GUYOT: DEPOSITIONAL HISTORY
Lithologic Subunit IICComposite of Lithologies, Dominated by Foraminifer
Packstone-wackestone(182.9-320.3 mbsf, 137.4 m thickness, early and middle Eocene)
Summary of Logging Fades
The thick lithologic Subunit IIC encompasses a complex suite of verticalsuccessions of facies. The poor recovery of cored intervals, coupled with a biastoward recovery of moderately cemented packstone-wackestone facies, hasplaced two complete deepening-shallowing cycles and a third deepening eventinto a single unit. The lagoonal facies (Subunits IIC-2, IIC-3, IIC-5, IIC-7, andIIC-8) consists of a foraminifer-gastropod wackestone-packstone with vari-able frequencies of storm beds of packstone-grainstone to rudstone (Fig. 6).Shallower facies are algal-coral-enriched parasequences (Subunit IIC-1, upperSubunit IIC-6) or intervals of storm-winnowed debris (Fig. 7) (Subunit IIC-4,lower Subunit IIC-6).
In general, Subunit IIC is significantly more "lagoonal" in character thanthe underlying algal-rich subunits. The deepening event that initiates thissubunit (Fig. 4) appears to coincide with the Paleocene/Eocene boundary, asindicated by the few pieces recovered in Cores 144-871C-20R and -21R. Asea-level rise at the end of the Paleocene may have triggered a more rapidupward growth of the outer coral-algal reef, with the associated formation ofa true atoll with inner lagoon. Before this sea-level rise, the center of theLimalok platform appears to have been a shallow bank with extensive algalflats or a current-swept, grainstone-packstone floor.
Logging Facies Subunit IIC-1(302.4-320.3 mbsf, 17.9 m thickness)
Core 144-871C-20R (306.9-316.5 mbsf, 0.2 m recovery): foraminiferpackstone with coral fragments
This unit is distinguished by its moderate concentration of uranium, in fact,the top boundary is assigned at a decrease in average resistivity coincident withthe termination of this uranium enrichment. There are at least two internalcycles or parasequences of upward-increasing resistivity.
313.6-320.6 mbsf: The basal 4 m is homogeneous (Fig. 5) with a "rho-dolith" or oncoid-bearing grainstone appearance in the dynamic FMS imageryand with an increase in average resistivity in the upper meter. After a 1-minterval of medium resistivity with a grainstone-packstone texture, there is a1.5-m high-resistivity zone comprised of a cluster of thin, discontinuous,high-resistivity, lenticular beds. Uranium peaks are associated with the inter-vals of higher resistivity.
302.4-313.6 mbsf: The lower 6 m are of medium resistivity, with anupward increase in abundance of high-resistivity, 5- to 10-cm-diameter"clasts" or "rhodolith-like" spherical features. The upper 3 m is a mixture ofhigh-resistivity lenses in a granular matrix with the same ball-like features.The upper half of this cycle has several overlapping peaks of high naturalgamma-ray intensity. The top surface is a sharp contact to a very low-resistivitylithology.
Interpretation: There are two successions of a rhodolith- or oncoid-richgrainstone-packstone shallowing upward to an algal-cyanobacterial mat oralgal-flat facies. The unit represents a partial return to the shallow-water algalfacies of the underlying Subunit IID, which is terminated by a rapid deepening.The uranium enrichment is associated with the abundance of algae, which maybe partially enhanced at the contact to the overlying unit by a redox front.
Logging Facies Subunit IIC-2(276.4-302.4 mbsf, 26.0 m thickness)
Core 144-871C-19R (297.2-306.9 mbsf 0.1 m recovery): foraminifer tobivalve-gastropod wackestone
Core 144-871C-18R (287.5-297.2 mbsf, no recovery)Core 144-871C-17R (278.1-287.5 mbsf, 0.3 m recovery): foraminifer-
gastropod wackestone; "chalky " appearance
276.4-302.4 mbsf: This medium-resistivity unit contains 30- to 50-cm-thickhorizons of higher resistivity that are spaced approximately every 2 to 3 m (Fig.6). Natural gamma-ray intensity remains low. The dynamic FMS imagerysuggests that the higher resistivity beds are within episodes of increased accu-mulation of rudstone-type facies. The host facies of foraminifer packstone-wackestone has a slightly higher resistivity in the upper half of the unit.
Interpretation: The few pieces of core recovery indicate that this is alagoonal facies of foraminifer-gastropod packstone-wackestone, in contrast to
the underlying unit of algal-rich grainstone. Therefore, the lower boundary at302.4 mbsf represents a major transgressive deepening. Within the lagoonalmuds are several storm-winnowed accumulations of coarser bioclasts orrudstone (Fig. 6). This unit represents the formation of an effective "atoll"structure, with a semiprotected lagoon, in contrast to the algal-flat facies of thelower carbonate platform.
Logging Facies Subunit IIC-3(248.0-276.4 mbsf, 28.4 m thickness)
Core 144-871C-16R (268.8-278.1 mbsf, 0.2 m recovery): foraminiferwackestone with bivalve and gastropod molds
Core 144-871C-15R (259.2-268.8 mbsf, 0.2 m recovery): packstone withmollusk and gastropod molds
Core 144-871C-14R (249.5-259.2 mbsf, 0.2 m recovery): foraminiferpackstone with mollusk molds; "chalky " appearance
248.0-276.4 mbsf: This unit has very low resistivity with a generalpackstone-grainstone FMS texture. The dynamic FMS imagery suggests that40-cm-thick beds of slightly higher resistivity are spaced about every 1 m, butthese events are very subdued relative to those of the underlying Subunit IIC-2.The borehole diameter is widened, and the contacts of just two pads of theFMS tool indicate that the borehole is slanted to the southwest (the pads contacton just the northeast side).
Interpretation: This unit is a lagoonal foraminifer packstone-wackestone.The interval corresponds approximately to a zone of micritized sediments witha "chalky" appearance and with dissolution of all gastropod and bivalve shells.Storm-winnowed deposits are subdued, suggesting a quieter (deeper) settingthan in the underlying unit. The onset of this facies is relatively sudden, so asecond phase of deepening is associated with the lower boundary at 276.4 mbsf.
Logging Facies Subunit IIC-4(235.0-248.0 mbsf, 13.0 m thickness)
Core 144-871C-13R (239.8-249.5 mbsf, 0.1 m recovery): foraminiferpackstone with mollusk molds
235.0-248.0 mbsf: This unit is defined by a set of four major "debris" orrudstone beds. In the dynamic FMS imagery, these beds have concentrationsof high-resistivity 2- to 5-cm-diameter "clasts" within a granular-texturematrix (Fig. 7). The thickness and center of these beds are 1.2 m at 247.4 mbsf,0.4 m at 244.9 mbsf, 4.9 m at 240.0 mbsf, and 30 cm at 235.2 mbsf. Theepisodes have sharp bounding surfaces, which are especially pronouncedresistivity contrasts for the two thinner beds. Only the second bed has a minorpeak in natural gamma-ray intensity. The sediment interbedded between thesecoarse-clast beds is grainstone-packstone, similar to the underlying unit.
Interpretation: The low natural gamma-ray intensity for these eventssupports the interpretation that these episodes are concentrations of coarsebioclasts or rudstone, presumably concentrated or redeposited by storm activ-ity. The host sediment is a foraminifer packstone, similar to that of SubunitIIC-3. Unfortunately, the only core recovery within this 13-m interval wasapparently 10 cm of the lagoonal host sediment. The concentration of storm-rudstone in this interval indicates a more shallow lagoon relative to the under-lying facies. Therefore, the onset of this unit may be a minor sequence bound-ary. The overlying subunit is a return to "quiet" lagoonal conditions; therefore,the sharp upper boundary of this Subunit IIC-4 is a minor transgressive surface.The interpreted minor sequence boundary at the base may correspond to theIlerdian/Cuisian boundary according to microfauna indications.
Logging Facies Subunit IIC-5(223.5-235.0 mbsf, 11.5 m thickness)
Core 144-871C-12R (230.1-239.8 mbsf, 0.1 m recovery): foraminifer-skeletal wackestone
Core 144-871C-11R (220.5-230.1 mbsf, 0.1 m recovery): foraminifer-peloid packstone
223.5-235.0 mbsf: This interval of low-resistivity facies and widenedborehole has a grainstone to packstone texture in the FMS imagery, withscattered small (1- to 2-cm-diameter) "clasts" of relatively higher resistivity.There are no significant accumulations of "rudstone."
Interpretation: This is a "quiet" lagoonal deposit of foraminifer-peloidpackstone-wackestone.
251

J.G. OGG, G.F. CAMOIN, A. ARNAUD VANNEAU
Logging Facies Subunit IIC-6(209.8-223.5 mbsf, 13.7 m thickness)
Core 144-871C-10R (210.9-220.5 mbsf, 0.1 m recovery): foraminiferwackestone with gastropod, coral, and bivalve molds
209.8—223.5 mbsf: A lower set of three "debris" beds is separated from anuppermost 1.8-m-thick, high-resistivity bed by a 5.4-m interval of low resis-tivity. The lower debris beds generally have relatively sharp upper surfacesand interbeds of typical "lagoonal" sediments similar to the underlying subunit.The low-resistivity interval is also of "lagoonal" grainstone-packstone with afew scattered, high-resistivity, 5-cm-diameter "clasts." The upper high-resis-tivity interval has an "algal" or oncolite-bearing appearance of high-resistivitylenses in a lower resistivity matrix, and is associated with a set of peaks of highnatural gamma-ray intensity.
Interpretation: Subunit IIC-6 consists of three depositional facies. Thelower interval is a storm-winnowed, debris-rich facies similar to Subunit IIC-4.It is separated from an upper algal- or cyanobacterial-rich facies by a temporaryreturn to "quiet" lagoonal sediments. The upper algal-facies is sharply overlainby another episode of "quiet" lagoonal facies, indicating a transgressivedeepening event. Therefore, the abrupt base of the lower cluster of storm-winnowed or redeposited debris beds could represent a minor "sequenceboundary," marking a relative sea-level fall.
Logging Facies Subunit IIC-7(187.9-209.8 mbsf, 21.9 m thickness)
Core 144-871C-9R (201.2-210.9 mbsf, 0.4 m recovery): foraminiferwackestone-packstone with gastropod and bivalve molds; also includes apiece of dense mudstone with borings
Core 144-871C-8R (191.5-201.2 mbsf 0.2 m recovery): foraminiferwackestone with bivalves and gastropods
187.2-209.7 mbsf: Low-resistivity interval of widened borehole conditions.Low natural gamma-ray intensity, except for a pronounced peak at the top ofthis unit. The texture in the FMS imagery varies from a granular packstone-grainstone to a mottled wackestone-packstone, and there are scattered high-resistivity "blocks" up to 10 cm in diameter. The uppermost 8 m have a higheraverage resistivity in the geophysics log and a vague indication of "rubble" onthe FMS imagery, but the FMS pads were not able to contact the borehole wallsin this extra-widened zone, indicating that this particular facies was not verycoherent. The top of the unit is a high-resistivity bed, coinciding with the peakin uranium concentration, and is overlain by another "lagoon" episode.
Interpretation: This is a lagoonal foraminifer packstone-grainstone, pos-sibly containing scattered large bioclasts or concretions. The core recovery ofa piece of dense-cemented lime-mud may represent one of these high-resistiv-ity blocks. No distinct storm beds were noted. The uppermost 8 m may beloosely cemented beds of storm-winnowed debris, implying an upward-shal-lowing episode. The uranium concentration may be caused by a redox front tothe overlying "quiet" lagoon facies.
Logging Facies Subunit IIC-8(182.9-187.9 mbsf, 5.0 m thickness)
Core 144-871C-7R (181.9-191.5 mbsf 0.05 m recovery): piece of fora-minifer packstone
182.9-187.9 mbsf: Highest episode of "quiet" lagoonal foraminiferwackestone-packstone facies. Homogeneous texture similar to underlyingepisodes. No storm-bed layers. Top of unit is placed at base of lowesthigh-resistivity storm bed, characteristic of the lower portion of Subunit IIB.
Lithologic Subunit IIBForaminifer Wackestone to Skeletal Grainstone
(161.7-182.9 mbsf, 21.2 m thickness, middle Eocene)
Summary of Logging Facies
Lithologic Subunit IIB was defined by the shipboard sedimentologists asconsisting predominantly of grainstone texture, in contrast to the underlyingwackestone-packstone facies. The logging characteristics are a high frequencyof "storm beds" in the lower portion (Subunit IIB-1), and upward-shallowingparasequences, which include an algal-cyanobacterial component, in the upperportion (Subunit IIB-2). Subunit IIB appears to end abruptly in a sustainedalgal-cyanobacterial-rich facies (high uranium concentration).
The shipboard distinction of lithologic Subunit IIB is largely an artifact ofsparse core recovery that was biased toward the moderately cemented grain-
stones. In many respects, Subunit IIB-1 is the culmination of the underlyingSubunit IIC lagoonal facies, whereas Subunit IIB-2 displays a distinct upward-shallowing trend (Fig. 8) that leads to the overlying facies of Subunit IIA-1with possible microbial mats. However, for consistency, we have retained theshipboard lithologic subunits.
The change from a "quiet" lagoon in the underlying Subunit IIC-8 intostorm-dominated conditions within Subunit IIB-1 suggests an upward-shallowing episode. Another upward-shallowing episode is at the onset ofthe algal-rich parasequences in Subunit IIB-2, which display an overall shal-lowing trend that culminates in an exposure surface at the top of the unit (Fig.8). The top exposure surface is tentatively assigned as a "sequence boundary."The overlying facies (Subunit IIA-1), rich in algal-cyanobacteria (microbialmats?) may be equivalent to "lowstand" facies on margins with a slowersubsidence rate.
Logging Facies Subunit IIB-1(169.6-182.9 mbsf, 13.3 m thickness)
Core 144-871C-6R (172.3-181.9 mbsf, 0.5 m recovery): foraminiferwackestone with gastropod molds, and foraminifer-skeletal grainstone
181.0-182.9 mbsf: This interval contains four high-resistivity beds. Eachis 10 to 15 cm thick and has sharp upper and lower contacts to "typical lagoon"FMS facies. These beds are probably storm beds.
178.1-181.0 mbsf: A 40-cm "rudstone-debris" bed of high resistivityoverlies a low-resistivity interval. The "rudstone-debris" layer has a distinct,but irregular, basal contact and a sharp upper contact.
169.6-178.1 mbsf: The lower 3 m shows a progressive upward increasein average resistivity, which is mainly the result of an increasing concentrationof high-resistivity "clasts." The succession is sharply overlain by a medium-resistivity facies with a mottled "wackestone-packstone" appearance andscattered high-resistivity "clasts" in the FMS imagery, and with a minor peakin uranium concentration in its lower portion.
Interpretation: This interval contains varying concentrations of storm-winnowed or redeposited bioclastic debris. Core recovery indicates interbed-ded lagoonal foraminifer-gastropod packstone-wackestone and winnowedgrainstone. The uppermost few meters may contain some algal-cyanobacterialencrustations. The coarse "debris" beds were probably not recovered.
Logging Facies Subunit IIB-2(161.7-169.6 mbsf, 7.9 m thickness)
Core 144-871C-5R (162.6-172.3 mbsf, 0.05 m recovery): foraminiferpackstone with ostracode and gastropod molds; well cemented but with ahighly leached outer surface on one piece
168.2-169.6 mbsf: A basal, 30-cm, high-resistivity layer and the overlyingmeter of interbedded low-resistivity matrix with thin high-resistivity lensescoincide with a pronounced peak in natural gamma-ray intensity.
163.3-168.2 mbsf: Moderate natural gamma-ray intensity continuesthrough two cycles of medium-resistivity homogeneous "granular" facies over-lain by a 0.6- or a 1.0-m-thick band, respectively, of stacked high-resistivitylenses (Fig. 8). The uppermost high-resistivity band has a sharp upper surface.
161.7-163.3 mbsf: This interval contains two 15-cm-thick, sharp-bounded, high-resistivity layers, but the main facies is low-resistivity lithologyand displays a mottled "packstone-wackestone" texture in the FMS imagery.
Interpretation: A horizon of algal-cyanobacterial encrustation (micro-bial mat?) is overlain by winnowed foraminifer grainstone interbedded withother algal-encrustation episodes. A progressive upward reduction of uraniumconcentration within the upper 1-m, well-cemented, algal-cyanobacterial-encrustation episode suggests a possible emergence horizon (oxidative leachingassociated with subaerial exposure). Emergence is also suggested by the recov-ery of a well-cemented packstone piece that had experienced leaching on itssurface. This algal-rich interval is followed by a brief return to lagoonal con-ditions with storm layers.
Lithologic Subunit IIAForaminifer Packstone-wackestone
(139.5-161.7 mbsf, 22.2 m thickness, middle Eocene)
Summary of Logging Facies
Lithologic Subunit IIA is a composite of depositional environments inrapid succession. The lower 9 m are interbedded, high-resistivity algal mats

LIMALOK GUYOT: DEPOSITIONAL HISTORY
and low-resistivity grainstone with a high uranium concentration (SubunitIIA-1). A lagoonal packstone-wackestone interval (Subunit IIA-2) precedes afinal interval of algal-cyanobacterial-rich facies (Subunit IIA-3), capped by acemented phosphate-rich bed of "lagoonal" packstone-wackestone (SubunitIIA-4) (Fig. 9). The drowning of the carbonate platform at this site begins withthe transgressive surface at the top of the algal-cyanobacterial-rich facies ofSubunit IIA-3, and the final Subunit IIA-4 represents a partially preserved,deeper water facies that accumulated during the drowning.
Logging Facies Subunit IIA-1(152.9-161.7 mbsf, 8.8 m thickness)
Core 144-871C-4R (152.9-162.6 mbsf, 0.5 m recovery): foraminifer-peloid wackestone-packstone; lower portion is foraminifer-intraclast grain-stone with keystone vugs
152.9-161.7 mbsf: A low-resistivity "packstone-grainstone" matrix con-tains bands of variable concentrations of high-resistivity lenses. Peaks inuranium concentration coincide with the greater abundance of these lenses.The higher resistivity top of this unit coincides with a decrease in naturalgamma-ray intensity and is sharply overlain by a lagoonal facies.
Interpretation: This zone has algal-encrusted lenses or microbial matswithin a foraminifer-peloid-intraclast packstone-grainstone matrix. In contrastto the periodic well-cemented layers of underlying Subunit IIB-2, this algal-cy-anobacterial-rich interval does not appear to have experienced possible episodesof emergence; however, the keystone vugs in one piece of recovered foraminifergrainstone suggests an intertidal depositional environment. The periodic algal-cyanobacteria concentrations might indicate a stacked suite of upward-shallow-ing cycles during an interval of slow accommodation rate (falling sea levelpartially cancelling subsidence). Therefore, this facies is tentatively correlatedto a falling or lowstand of eustatic sea level (although it is not represented by a"lowstand systems tract") and is terminated by a transgressive deepening.
Logging Facies Subunit IIA-2(147.0-152.9 mbsf, 5.9 m thickness)
Core 144-871C-3R (143.3-152.9 mbsf, 0.2 m recovery): foraminiferpackstone with coral and bivalve molds
147.0-152.9 mbsf: The host sediment has a diffuse mottled "packstone-grainstone" texture in the FMS imagery and a low natural gamma-ray intensity.Cycle of medium-to-low to medium-resistivity corresponds to changing con-centration of 1- to 2-cm-diameter high-resistivity "clasts." The unit has a sharpupward transition to the overlying algal-cyanobacterial-rich unit.
Interpretation: This unit has identical characteristics to typical "lagoonal"foraminifer packstone-grainstone sediments of lower lagoon episodes. It is atransgressive to highstand systems tract relative to adjacent units.
Logging Facies Subunit IIA-3(140.8-147.0 mbsf, 6.2 m thickness)
142.9-147.0 mbsf: This facies is similar to Subunit IIA-1, with bands ofvariable concentrations of 5- to 15-cm-thick, high-resistivity lenses or discon-tinuous layers within a "granular" host sediment (Fig. 9). The uranium con-centration mirrors the abundance of the high-resistivity lenses. This intervalends in an 80-cm band of higher resistivity with a sharp upper surface.
140.8-142.9 mbsf: This 2-m layer of very low resistivity contains scatteredhigh-resistivity lenses and displays a peak in uranium concentration.
Interpretation: Subunit IIA-3 is an algal-cyanobacterial-rich facies ofencrustations or microbial mats interbedded with packstone or low-resistivitygrainstone (Fig. 9). The upper 2-m band may have experienced partial disso-lution. This algal-cyanobacterial-rich facies suggests an upward shallowingfrom the underlying lagoonal facies. The interval ends in a deepening event.
Logging Facies Subunit IIA-4(139.5-140.8 mbsf, 1.3 m thickness)
Core 144-871C-2R (133.7-143.3 mbsf, 0.6 m recovery): Fe-Mn andphosphatic crusts on foraminifer wackestone-packstone
Core 144-871C-1R (124.0-133.7 mbsf, no recovery)
139.5-140.8 mbsf: Very high-resistivity layer with a "lagoonal" texture inthe dynamic FMS imagery (1- to 2-cm-diameter spots of higher resistivity ina grainstone-packstone sediment; Fig. 9). This layer corresponds to a pro-nounced peak in uranium concentration. There is a very sharp contact to theoverlying very low-resistivity facies (Unit I of pelagic sediment).
Interpretation: There is no FMS-textural evidence for algal features;therefore, the high uranium concentration is considered to be associated withthe phosphatic enrichment observed in the recovered pieces in this interval.The final facies preserved before drowning of the carbonate platform is alagoonal-type sediment; however, this episode may represent last-stage sedi-ment accumulation during the early stages of drowning. The actual drowningprobably began at the top of the underlying algal-rich Subunit IIA-3. Indeed,this final bed may be post-drowning redeposited sediment that was latercemented upon further deepening below the wave base. The sharp uppersurface of this cemented bed is probably a partial artifact of post-drowning,bottom-erosion, rather than an original truncation to sediment accumulation.
253


![18. TAKUYO-DAISAN GUYOT: DEPOSITIONAL HISTORY OF …The lowest depositional sequence (126-164 meters below seafloor [mbsf] ,39 m thick) onlaps a 23-m-thick clay-rich, weather- ing](https://static.fdocuments.us/doc/165x107/5edc248ead6a402d6666aec0/18-takuyo-daisan-guyot-depositional-history-of-the-lowest-depositional-sequence.jpg)