1.2 LESSON Comparing and Ordering...
6
1 -1 -2 -3 -4 -5 -6 -7 -8 -9 -10 0 2 3 4 5 6 7 8 9 10 ? EXPLORE ACTIVITY Comparing Positive and Negative Integers The Westfield soccer league ranks its teams using a number called the “win/loss combined record. ” A team with more wins than losses will have a positive combined record, and a team with fewer wins than losses will have a negative combined record. The table shows the total win/loss combined record for each team at the end of the season. Team Sharks A Jaguars B Badgers C Tigers D Cougars E Hawks F Wolves G Win/Loss Combined Record 0 4 -4 -6 2 -2 6 Graph the win/loss combined record for each team on the number line. Which team had the best record in the league? How do you know? Which team had the worst record? How do you know? Reflect 1. Analyze Relationships Explain what the data tell you about the win/ loss records of the teams in the league. A B C LESS ON 1.2 Comparing and Ordering Integers ESSENTIAL QUESTION How do you compare and order integers? 6.2.C Number and operations— 6.2.C Locate, compare, and order integers ... using a number line. 13 © Houghton Mifflin Harcourt Publishing Company • © Barry Austin/Getty Images Lesson 1.2
Transcript of 1.2 LESSON Comparing and Ordering...
1-1-2-3-4-5-6-7-8-9-10 0 2 3 4 5 6 7 8 9 10
?
EXPLORE ACTIVITY
Comparing Positive and Negative Integers The Westfield soccer league ranks its teams using a number called the
“win/loss combined record.” A team with more wins than losses will
have a positive combined record, and a team with fewer wins than
losses will have a negative combined record. The table shows the total
win/loss combined record for each team at the end of the season.
TeamSharks
AJaguars
BBadgers
CTigers
DCougars
EHawks
FWolves
G
Win/Loss Combined Record
0 4 -4 -6 2 -2 6
Graph the win/loss combined record for each team on the number line.
Which team had the best record in the league? How do you know?
Which team had the worst record? How do you know?
Reflect1. Analyze Relationships Explain what the data tell you about the win/
loss records of the teams in the league.
A
B
C
L E S S O N
1.2Comparing and Ordering Integers
ESSENTIAL QUESTIONHow do you compare and order integers?
6.2.C
Number and operations—6.2.C Locate, compare, and order integers ... using a number line.
13
© H
ough
ton M
ifflin
Har
cour
t Pub
lishin
g Com
pany
• ©
Bar
ry A
ustin
/Get
ty Im
ages
Lesson 1.2
1-1-2-3-4-5-6-7-8-9-10 0 2 3 4 5 6 7 8 9 10
1-1-2-3-4-5-6-7-8-9-10 0 2 3 4 5 6 7 8 9 10
1-1-2-3-4-5-6-7-8-9-10 0 2 3 4 5 6 7 8 9 10
Math Trainer
Online Assessment and Intervention
Personal
my.hrw.com
Math On the Spotmy.hrw.com
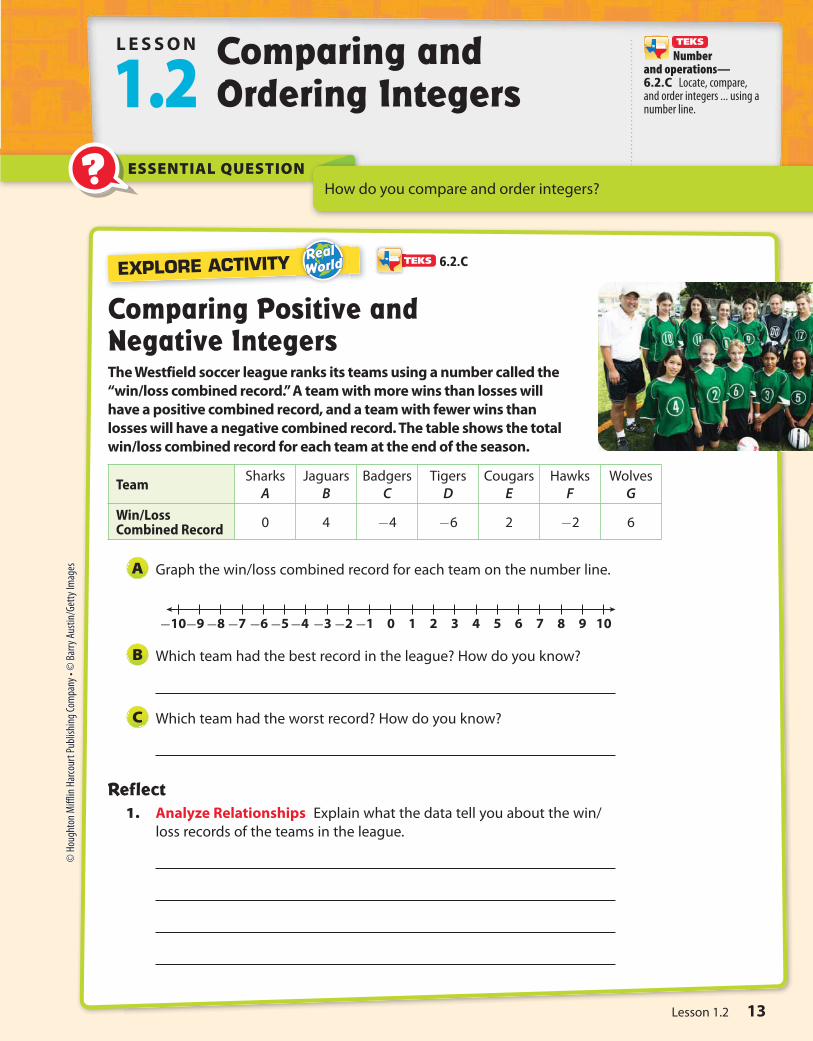
Ordering Positive and Negative Integers When you read a number line from left to right, the numbers are in order from
least to greatest.
Fred recorded the following golf scores during his first week
at the golf academy. In golf, the player with the lowest score
wins the game.
Day Mon Tues Wed Thurs Fri Sat Sun
Score 4 –2 3 –5 –1 0 –3
Graph Fred’s scores on the number line, and then list the numbers
in order from least to greatest.
Graph the scores on the number line.
Read from left to right to list the scores in order from
least to greatest.
The scores listed from least to greatest are –5, –3, –2, –1, 0, 3, 4.
EXAMPLE 1
STEP 1
STEP 2
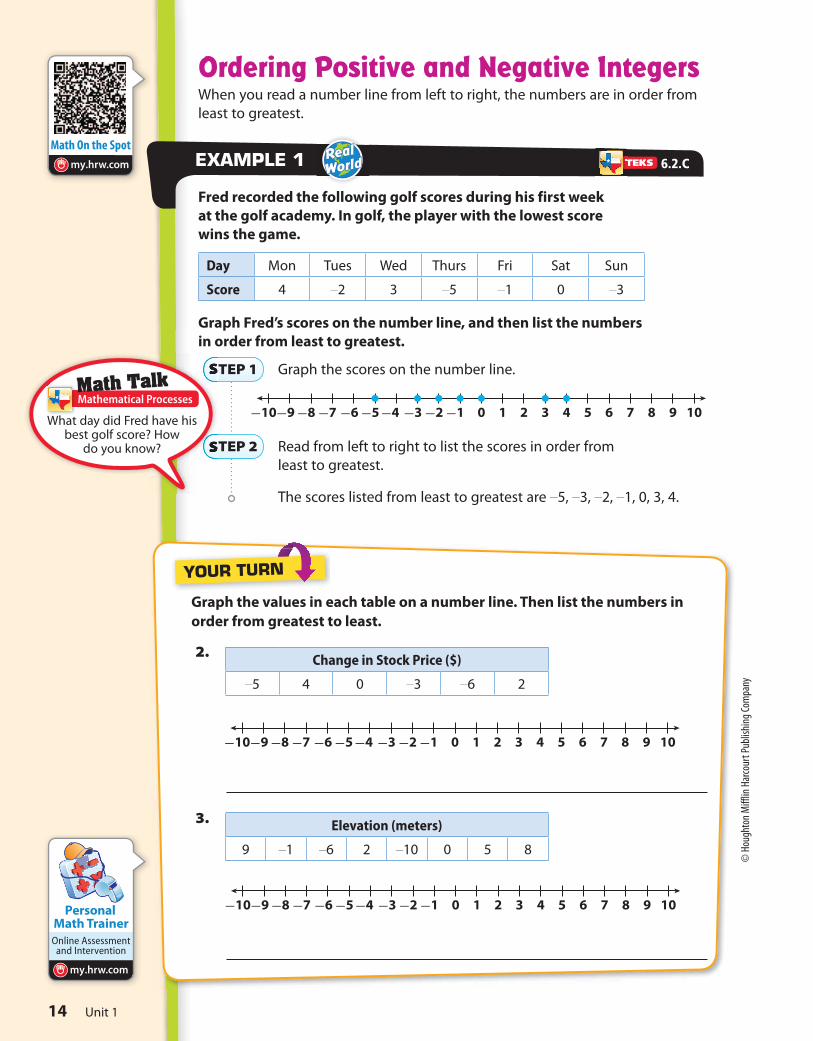
Graph the values in each table on a number line. Then list the numbers in
order from greatest to least.
2. Change in Stock Price ($)
–5 4 0 –3 –6 2
3. Elevation (meters)
9 –1 –6 2 –10 0 5 8
YOUR TURN
Math TalkMathematical Processes
6.2.C
What day did Fred have his best golf score? How
do you know?
Unit 114
© H
ough
ton M
ifflin
Har
cour
t Pub
lishin
g Com
pany
6020 24 28 32 36 4 0 4 4 48 52 56
Math Trainer
Online Assessment and Intervention
Personal
my.hrw.com
1-1-2-3-4-5-6-7-8-9-10 0 2 3 4 5 6 7 8 9 10
Math On the Spot
my.hrw.com
Writing InequalitiesAn inequality is a statement that two quantities are not equal. The symbols
< and > are used to write inequalities.
• The symbol > means “is greater than.”
• The symbol < means “is less than.”
You can use a number line to help write an inequality.
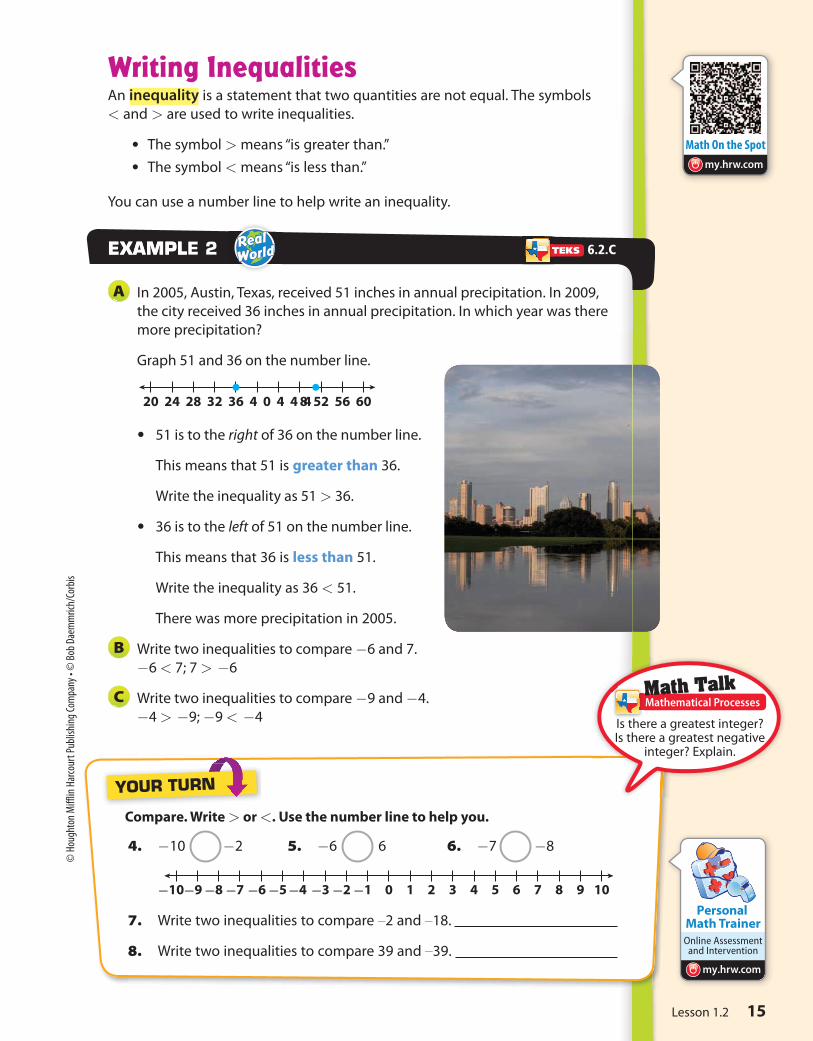
In 2005, Austin, Texas, received 51 inches in annual precipitation. In 2009,
the city received 36 inches in annual precipitation. In which year was there
more precipitation?
Graph 51 and 36 on the number line.
• 51 is to the right of 36 on the number line.
This means that 51 is greater than 36.
Write the inequality as 51 > 36.
• 36 is to the left of 51 on the number line.
This means that 36 is less than 51.
Write the inequality as 36 < 51.
There was more precipitation in 2005.
Write two inequalities to compare -6 and 7.
-6 < 7; 7 > -6
Write two inequalities to compare -9 and -4.
-4 > -9; -9 < -4
A
EXAMPLEXAMPLE 2
B
C
Compare. Write > or <. Use the number line to help you.
4. -10 -2 5. -6 6 6. -7 -8
7. Write two inequalities to compare –2 and –18.
8. Write two inequalities to compare 39 and –39.
YOUR TURN
Math TalkMathematical Processes
6.2.C
Is there a greatest integer? Is there a greatest negative
integer? Explain.
15Lesson 1.2
© H
ough
ton M
ifflin
Har
cour
t Pub
lishin
g Com
pany
• ©
Bob
Dae
mm
rich/
Corb
is
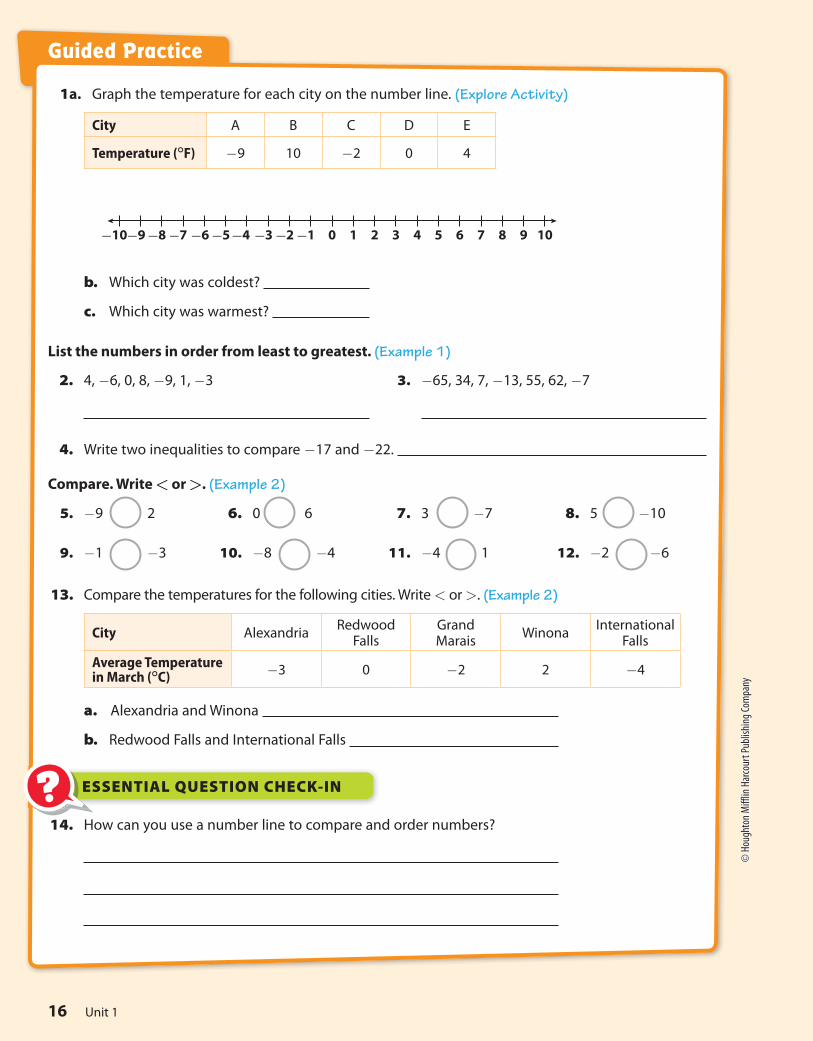
1a. Graph the temperature for each city on the number line. (Explore Activity)
City A B C D E
Temperature (°F) -9 10 -2 0 4
b. Which city was coldest?
c. Which city was warmest?
List the numbers in order from least to greatest. (Example 1)
2. 4, -6, 0, 8, -9, 1, -3 3. -65, 34, 7, -13, 55, 62, -7
1-1-2-3-4-5-6-7-8-9-10 0 2 3 4 5 6 7 8 9 10
13. Compare the temperatures for the following cities. Write < or >. (Example 2)
City AlexandriaRedwood
FallsGrand Marais
WinonaInternational
Falls
Average Temperature in March (°C)
-3 0 -2 2 -4
a. Alexandria and Winona
b. Redwood Falls and International Falls
14. How can you use a number line to compare and order numbers?
ESSENTIAL QUESTION CHECK-IN??
4. Write two inequalities to compare -17 and -22.
Compare. Write < or >. (Example 2)
5. -9 2 6. 0 6 7. 3 -7 8. 5 -10
9. -1 -3 10. -8 -4 11. -4 1 12. -2 -6
Guided Practice
Unit 116
© H
ough
ton M
ifflin
Har
cour
t Pub
lishin
g Com
pany
Personal Math Trainer
Online Assessment and
Interventionmy.hrw.com
1-1-2-3-4-5-6-7-8-9-10 0 2 3 4 5 6 7 8 9 10
1-1-2-3-4-5-6-7-8-9-10 0 2 3 4 5 6 7 8 9 10
Name Class Date
Independent Practice1.2
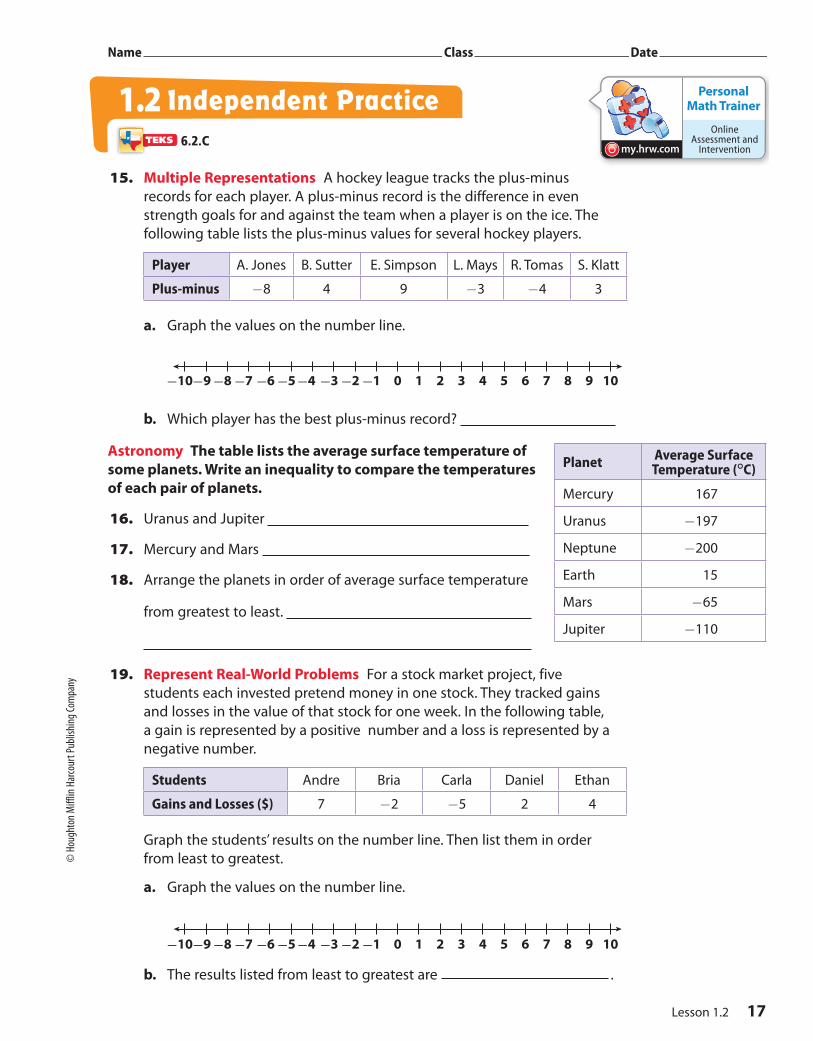
15. Multiple Representations A hockey league tracks the plus-minus
records for each player. A plus-minus record is the difference in even
strength goals for and against the team when a player is on the ice. The
following table lists the plus-minus values for several hockey players.
Player A. Jones B. Sutter E. Simpson L. Mays R. Tomas S. Klatt
Plus-minus -8 4 9 -3 -4 3
a. Graph the values on the number line.
b. Which player has the best plus-minus record?
Astronomy The table lists the average surface temperature of
some planets. Write an inequality to compare the temperatures
of each pair of planets.
16. Uranus and Jupiter
17. Mercury and Mars
18. Arrange the planets in order of average surface temperature
from greatest to least.
19. Represent Real-World Problems For a stock market project, five
students each invested pretend money in one stock. They tracked gains
and losses in the value of that stock for one week. In the following table,
a gain is represented by a positive number and a loss is represented by a
negative number.
Students Andre Bria Carla Daniel Ethan
Gains and Losses ($) 7 -2 -5 2 4
Graph the students’ results on the number line. Then list them in order
from least to greatest.
a. Graph the values on the number line.
b. The results listed from least to greatest are .
PlanetAverage Surface Temperature (°C)
Mercury 167
Uranus -197
Neptune -200
Earth 15
Mars -65
Jupiter -110
6.2.C
17Lesson 1.2
© H
ough
ton M
ifflin
Har
cour
t Pub
lishin
g Com
pany
Work Area
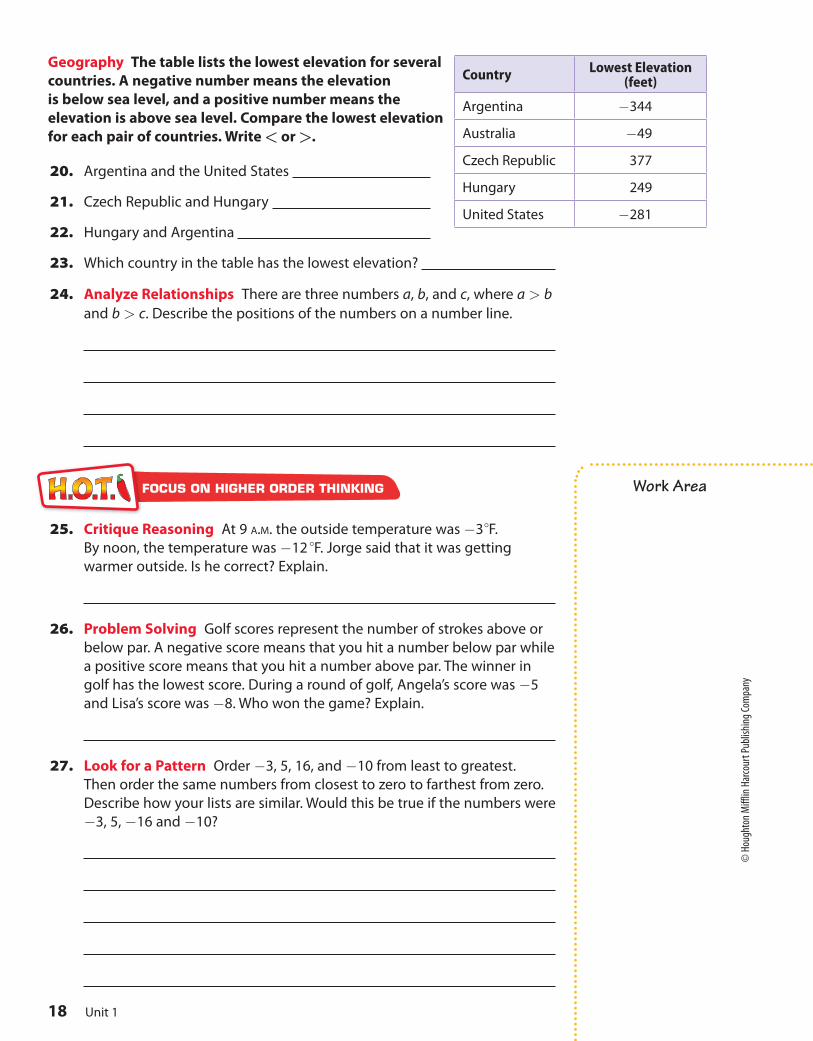
Geography The table lists the lowest elevation for several
countries. A negative number means the elevation
is below sea level, and a positive number means the
elevation is above sea level. Compare the lowest elevation
for each pair of countries. Write < or >.
20. Argentina and the United States
21. Czech Republic and Hungary
22. Hungary and Argentina
23. Which country in the table has the lowest elevation?
24. Analyze Relationships There are three numbers a, b, and c, where a > b
and b > c. Describe the positions of the numbers on a number line.
25. Critique Reasoning At 9 A.M. the outside temperature was -3 °F.
By noon, the temperature was -12 °F. Jorge said that it was getting
warmer outside. Is he correct? Explain.
26. Problem Solving Golf scores represent the number of strokes above or
below par. A negative score means that you hit a number below par while
a positive score means that you hit a number above par. The winner in
golf has the lowest score. During a round of golf, Angela’s score was -5
and Lisa’s score was -8. Who won the game? Explain.
27. Look for a Pattern Order -3, 5, 16, and -10 from least to greatest.
Then order the same numbers from closest to zero to farthest from zero.
Describe how your lists are similar. Would this be true if the numbers were
-3, 5, -16 and -10?
FOCUS ON HIGHER ORDER THINKING
CountryLowest Elevation
(feet)
Argentina -344
Australia -49
Czech Republic 377
Hungary 249
United States -281
Unit 118
© H
ough
ton M
ifflin
Har
cour
t Pub
lishin
g Com
pany