12 Lead ECG Interpretation - MOTEC Life-UK · PDF file12 lead ECG & Acute MI changes a ... ECG...
69
An Introduction to the 12 lead ECG & Acute MI changes a lecture for student nurses 1 Dr Kofi Amu-Darko MB. ChB. DRCOG. DFFP. MRCGP. PgDip. LLM Family Physician Charles Curtis Memorial Hospital October 2008
Transcript of 12 Lead ECG Interpretation - MOTEC Life-UK · PDF file12 lead ECG & Acute MI changes a ... ECG...

An Introduction to the 12 lead ECG & Acute MI changes a lecture for student nurses
1
Dr Kofi Amu-DarkoMB. ChB. DRCOG. DFFP. MRCGP. PgDip. LLM
Family PhysicianCharles Curtis Memorial Hospital
October 2008

2
By the end of this lecture, you will be able to:
• Understand the 12 lead ECG in relation to the coronary circulation and myocardium
• Perform an ECG recording• Identify the ECG changes that occur in the
presence of an acute coronary syndrome.• Begin to recognize and diagnose an acute
MI.

What is a 12 lead ECG?
Records the electrical activity of the heart (depolarization and depolarization of the myocardium)
Views the surfaces of the left ventricle from 12 different angles
3

Anatomy and Physiology Review
A good basic knowledge of the heart and cardiac function is essential in order to understand the 12 lead ECG
Anatomical position of the heart
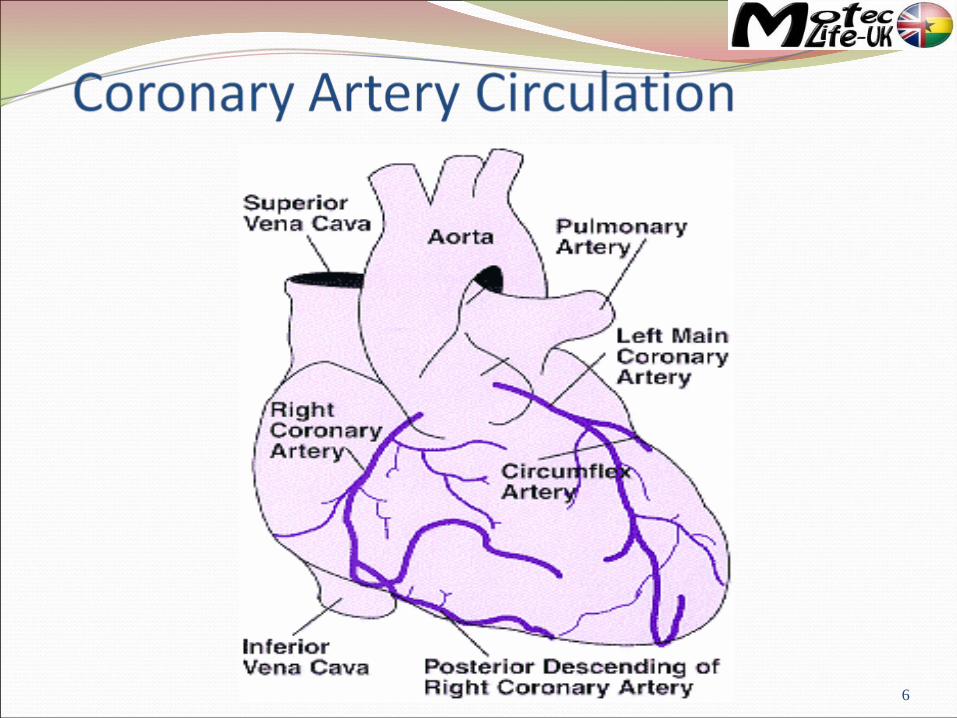
Coronary Artery Circulation
Conduction System
4

Anatomical Position of the Heart
Lies in the mediastinum behind the sternum
between the lungs, just above the diaphragm
the apex (tip of the left ventricle) lies at the fifth intercostal space, mid- clavicular line
5
6

Coronary Artery CirculationRight Coronary Artery
right atrium
right ventricle
inferior wall of left ventricle
posterior wall of left ventricle
1/3 interventricular septum
7

Coronary Artery Circulation Left Main Stem Artery divides in two:Left Anterior Descending
Artery
antero-lateral surface of left ventricle
2/3 interventricular septum
Circumflex Artery
left atrium
lateral surface of left ventricle
8

9
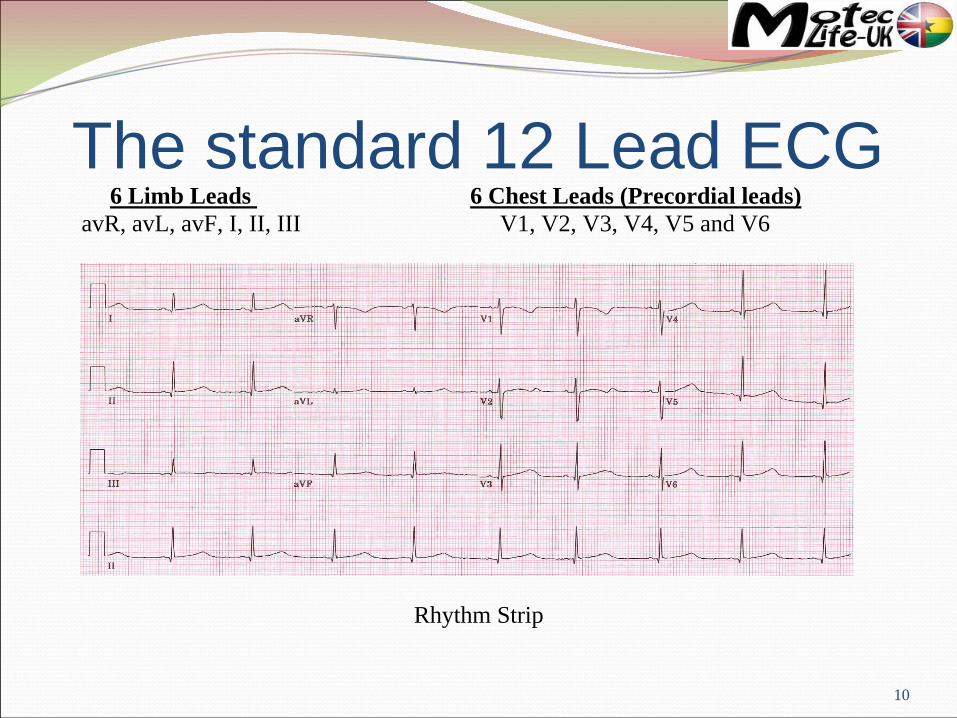
The standard 12 Lead ECG6 Limb Leads 6 Chest Leads (Precordial leads)
avR, avL, avF, I, II, III V1, V2, V3, V4, V5 and V6
Rhythm Strip
10
11
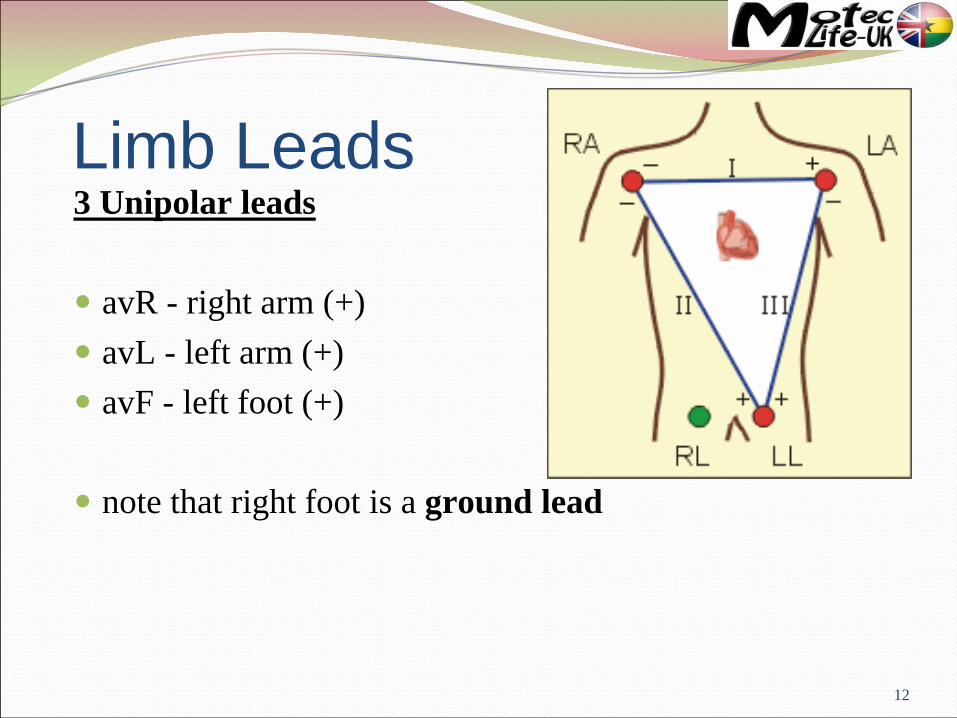
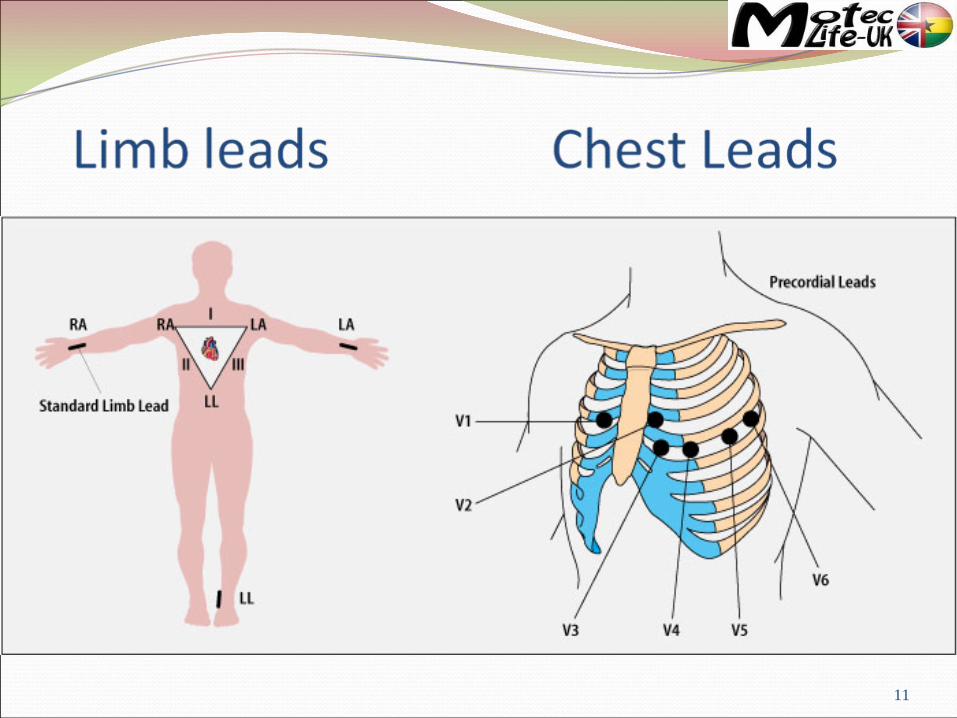
Limb Leads3 Unipolar leads
avR - right arm (+)
avL - left arm (+)
avF - left foot (+)
note that right foot is a ground lead
12

Limb Leads3 Bipolar Leads form (Einthovens Triangle)
Lead I - measures electrical potential between right arm (-) and left arm (+)
Lead II - measures electrical potential between right arm (-) and left leg (+)
Lead III - measures electrical potential between left arm (-) and left leg (+)
13

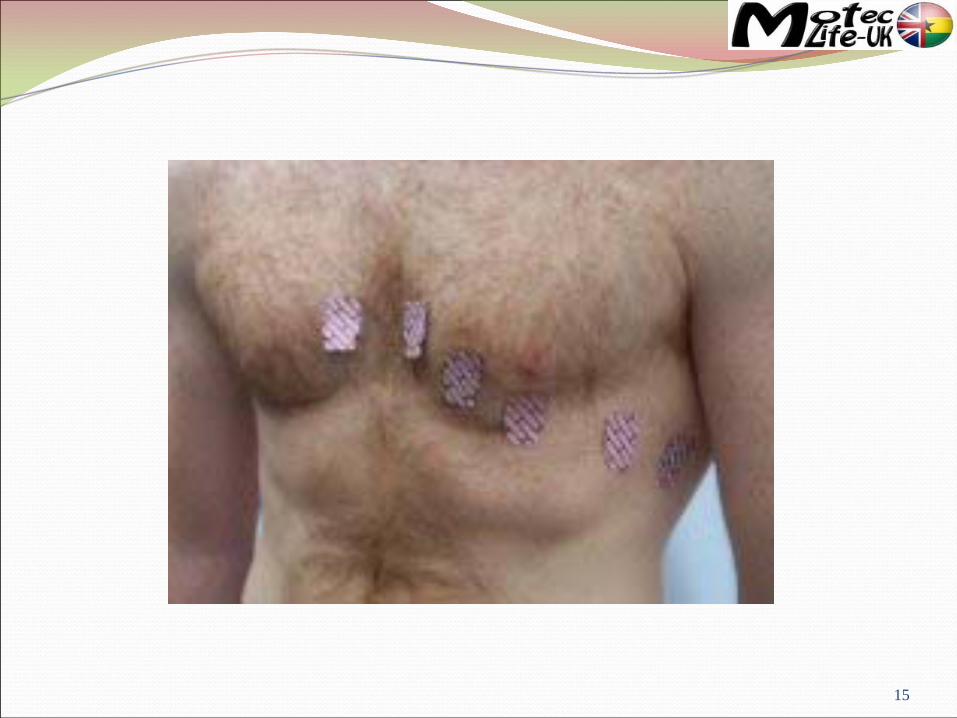
Chest Leads6 Unipolar leadsAlso known as precordial leadsV1, V2, V3, V4, V5 and V6 - all positive
14
15

16
Think of the positive electrode as an ‘eye’…
the position of the positive electrode on the body determines the area of the heart ‘seen’ by that lead.
17

Surfaces of the Left Ventricle
Inferior - underneath
Anterior - front
Lateral - left side
Posterior - back
18

Inferior Surface
Leads II, III and avF look UP from below to the inferior surface of the left ventricle
Mostly perfused by the Right Coronary Artery
19

Inferior Leads
IIIIIaVF
20
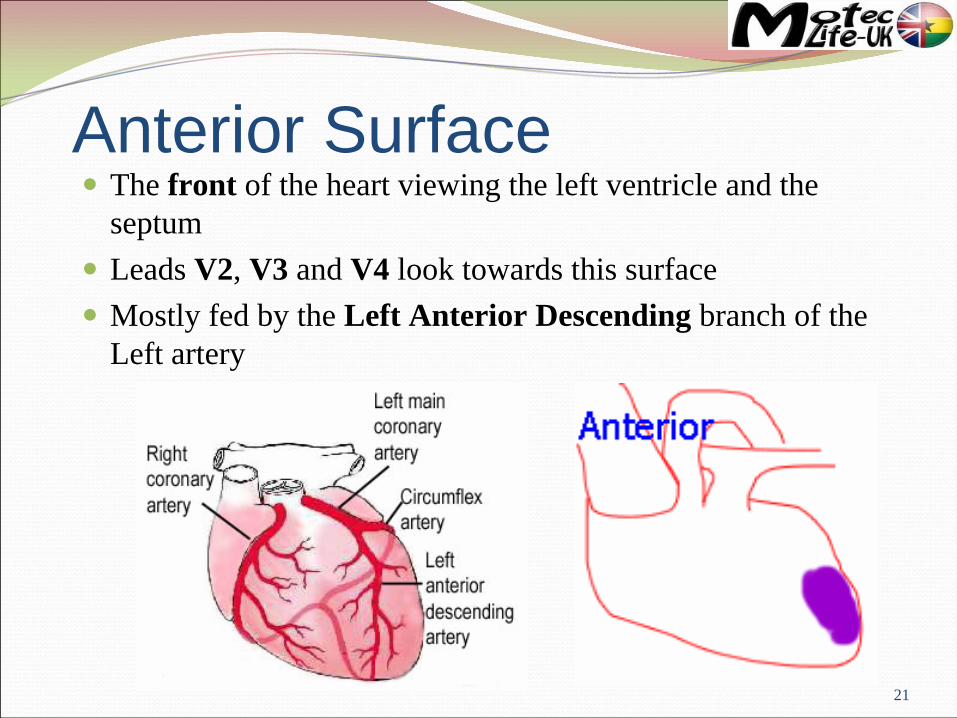
Anterior Surface
The front of the heart viewing the left ventricle and the septum
Leads V2, V3 and V4 look towards this surface
Mostly fed by the Left Anterior Descending branch of the Left artery
21
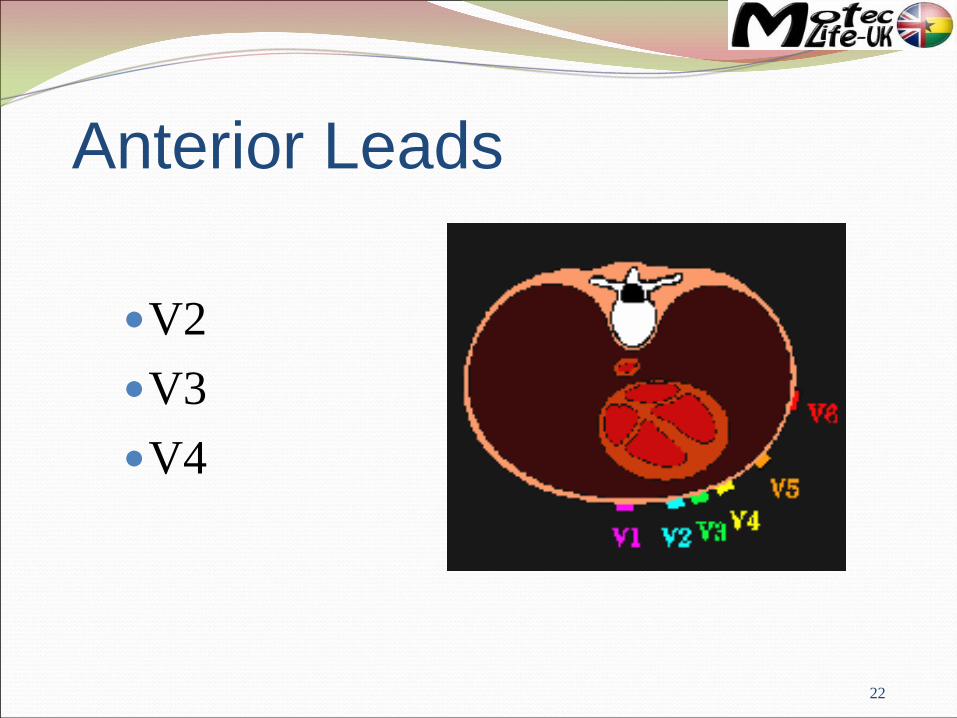
Anterior Leads
V2V3V4
22

Lateral Surface
The left sided wall of the left ventricle
Leads V5 and V6, I and avL look at this surface
Mostly fed by the Circumflex branch of the left artery
23

Lateral Leads
V5, V6, I, aVL
24

Posterior Surface
Posterior wall infarcts are rare
Posterior diagnoses can be made by looking at the anterior leads as a mirror image. Normally there are inferior ischaemic changes
Blood supply predominantly from the Right Coronary Artery
25

Inferior II, III, AVF
Antero-SeptalV1,V2, V3,V4
Lateral I, AVL, V5, V6
Posterior V1, V2, V3
RIGHT LEFT
26

ECG Waveforms
Normal cardiac axis is downward and to the left
ie the wave of depolarisation travels from the right atria towards the left ventricle
when an electrical impulse travels towards a positive electrode, there will be a positive deflection on the ECG
if the impulse travels away from the positive electrode, a negative deflection will be seen
27

ECG Waveforms
Look at your 12 lead ECG’s
What do you notice about lead avR?
How does this compare with lead V6?
28

An Introduction to the 12 lead ECG Part II
29
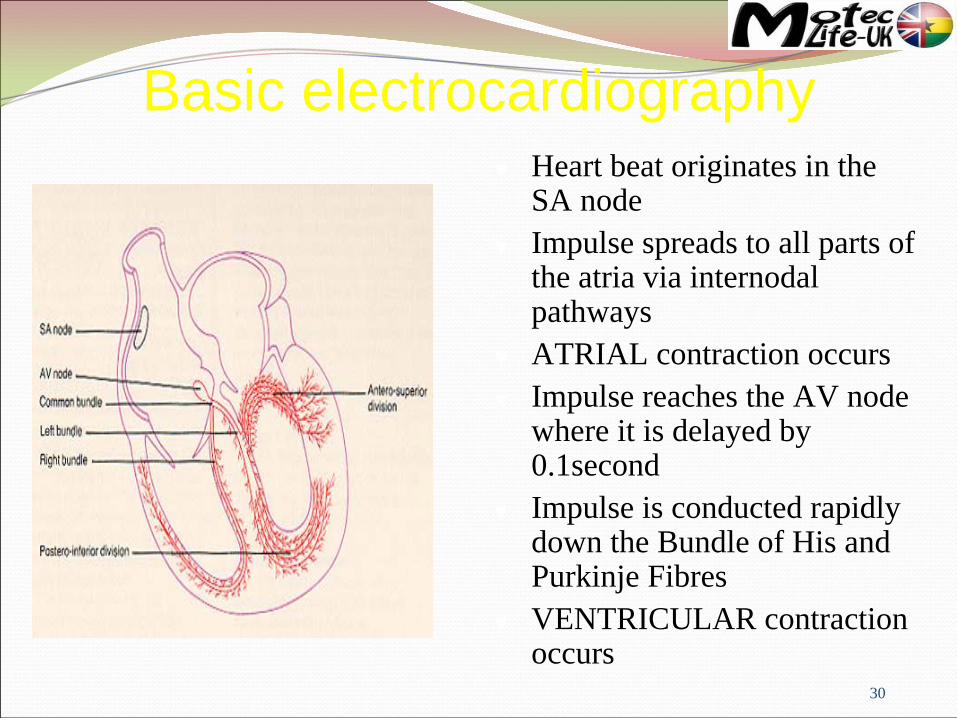
Basic electrocardiography
Heart beat originates in the SA node
Impulse spreads to all parts of the atria via internodal pathways
ATRIAL contraction occurs
Impulse reaches the AV node where it is delayed by 0.1second
Impulse is conducted rapidly down the Bundle of His and Purkinje Fibres
VENTRICULAR contraction occurs
30

•The P wave represents atrial depolarisation•the PR interval is the time from onset of atrial activation to onset of ventricular activation •The QRS complex represents ventricular depolarisation•The S-T segment should be iso-electric, representing the ventricles before repolarisation•The T-wave represents ventricular repolarisation•The QT interval is the duration of ventricular activation and recovery.31

ECG Abnormalities
32
Associated with ischaemia

Ischaemic Changes
S-T segment elevation
S-T segment depression
Hyper-acute T-waves
T-wave inversion
Pathological Q-waves
Left bundle branch block
33

ST Segment
The ST segment represents period between ventricular depolarisation and repolarisation.
The ventricles are unable to receive any further stimulation
The ST segment normally lies on the isoelectric line.
34

ST Segment ElevationThe ST segment lies above the isoelectric line:
Represents myocardial injury
It is the hallmark of Myocardial Infarction
The injured myocardium is slow to repolarise and remains more positively charged than the surrounding areas
Other causes to be ruled out include pericarditis and ventricular aneurysm
35
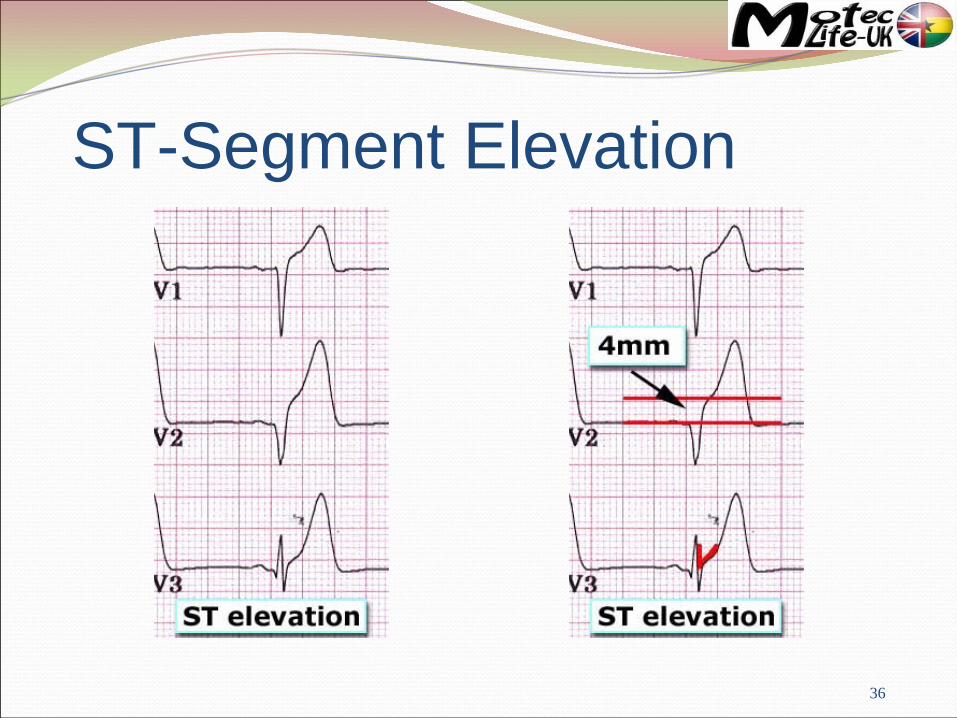
ST-Segment Elevation
36
37

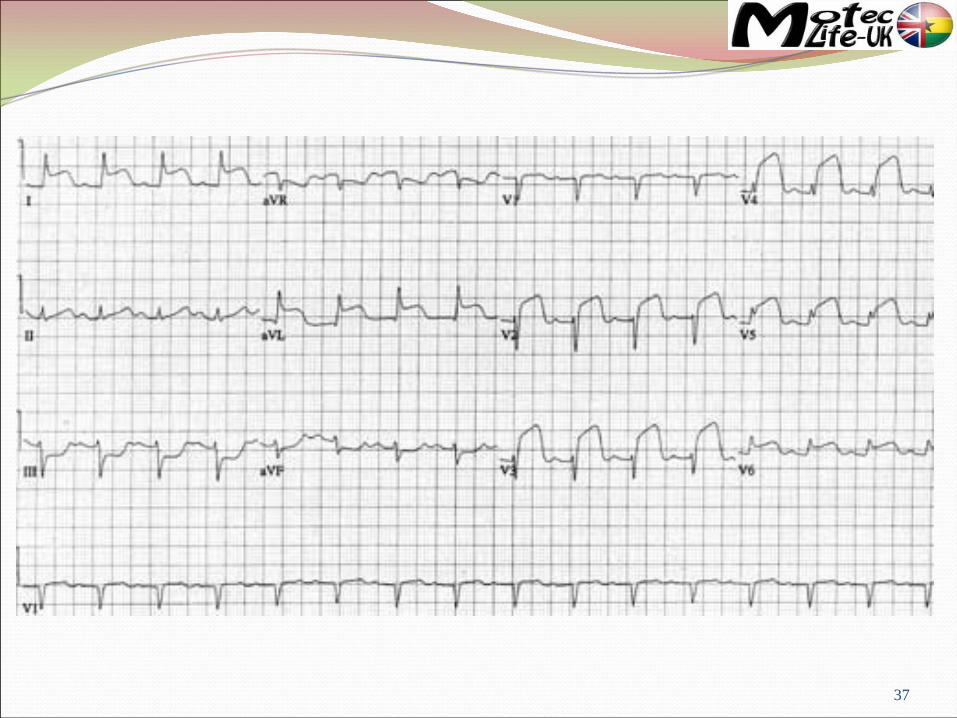
Myocardial Infarction
A medical emergency!!!
ST segment curves upwards in the leads looking at the threatened myocardium.
Presents within a few hours of the infarct.
Reciprocal ST depression may be present
38
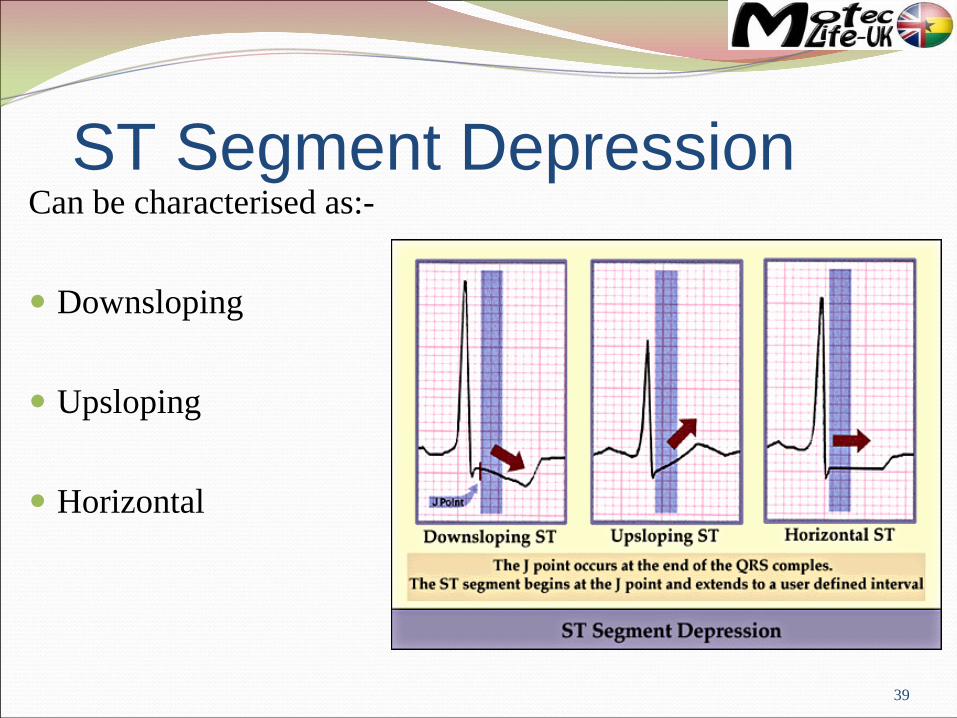
ST Segment DepressionCan be characterised as:-
Downsloping
Upsloping
Horizontal
39

Horizontal ST Segment DepressionMyocardial Ischaemia:
Stable angina - occurs on exertion, resolves with rest and/or GTN
Unstable angina - can develop during rest.
Non ST elevation MI - usually quite deep, can be associated with deep T wave inversion.
Reciprocal horizontal depression can occur during AMI.
40

41

ST Segment DepressionDownsloping ST segment depression:-
Can be caused by digoxin.
Upward sloping ST segment depression:-
Normal during exercise.
42

43
T waves
The T wave represents ventricular repolarisation
Should be in the same direction as and smaller than the QRS complex
Hyperacute T waves occur with S-T segment elevation in acute MI
T wave inversion occurs during ischaemia and shortly after an MI
44
T wavesOther causes of T wave inversion include:
Normal in some leads
Cardiomyopathy
Pericarditis
Bundle Branch Block (BBB)
Sub-arachnoid haemorrhage
Peaked T waves indicate hyperkalaemia
45

46

47

48

QRS ComplexMay be too broad ( more than 0.12 seconds)
A delay in the depolarisation of the ventricles because the conduction pathway is abnormal
A Left Bundle Branch Block can result from MI and may be a sign of an acute MI.
49

50

QRS Complex
May be too tall.
This is caused by an increase in muscle mass in either ventricle. (Hypertrophy)
51
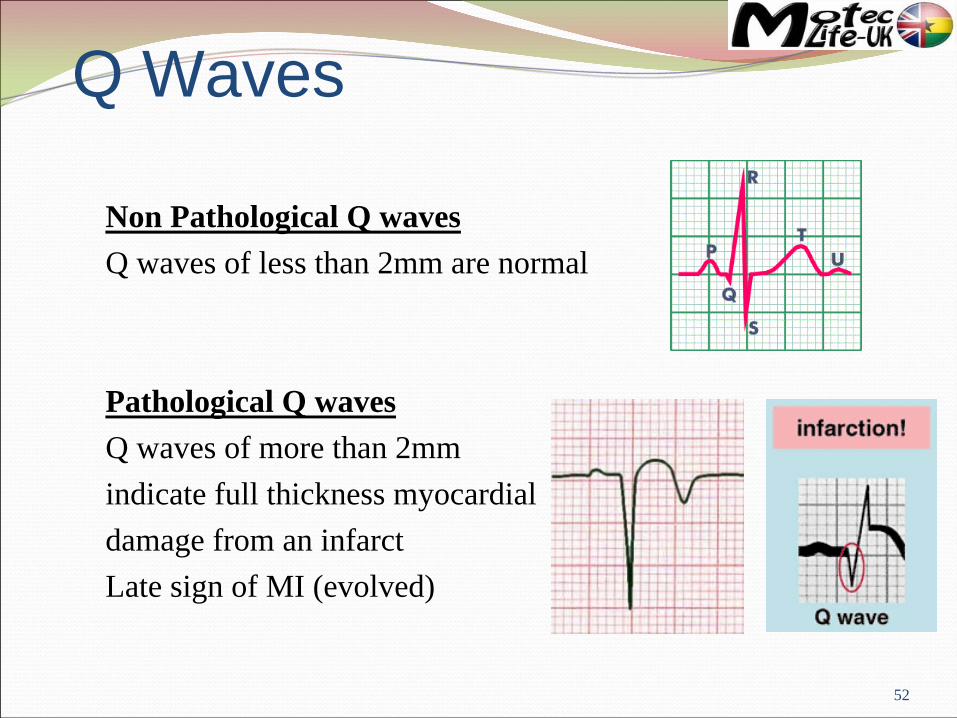
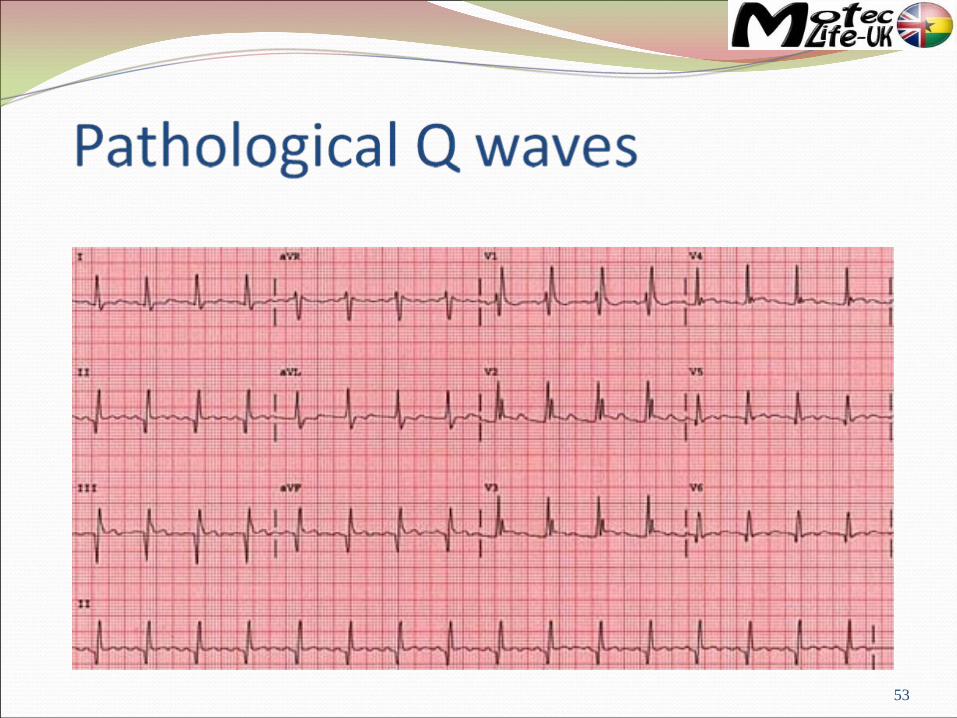
Q Waves
Non Pathological Q wavesQ waves of less than 2mm are normal
Pathological Q wavesQ waves of more than 2mm indicate full thickness myocardial damage from an infarctLate sign of MI (evolved)
52
53

54

ECG Interpretation in Acute Coronary Syndromes
55

56

The Hyper-acute PhaseLess than 12 hours
“ST segment elevation is the hallmark ECG abnormality of acute myocardial infarction” (Quinn, 1996)
The ECG changes are evidence that the ischaemic myocardium cannot completely depolarize or repolarize as normal
Usually occurs within a few hours of infarction
May vary in severity from 1mm to ‘tombstone’ elevation
57

58
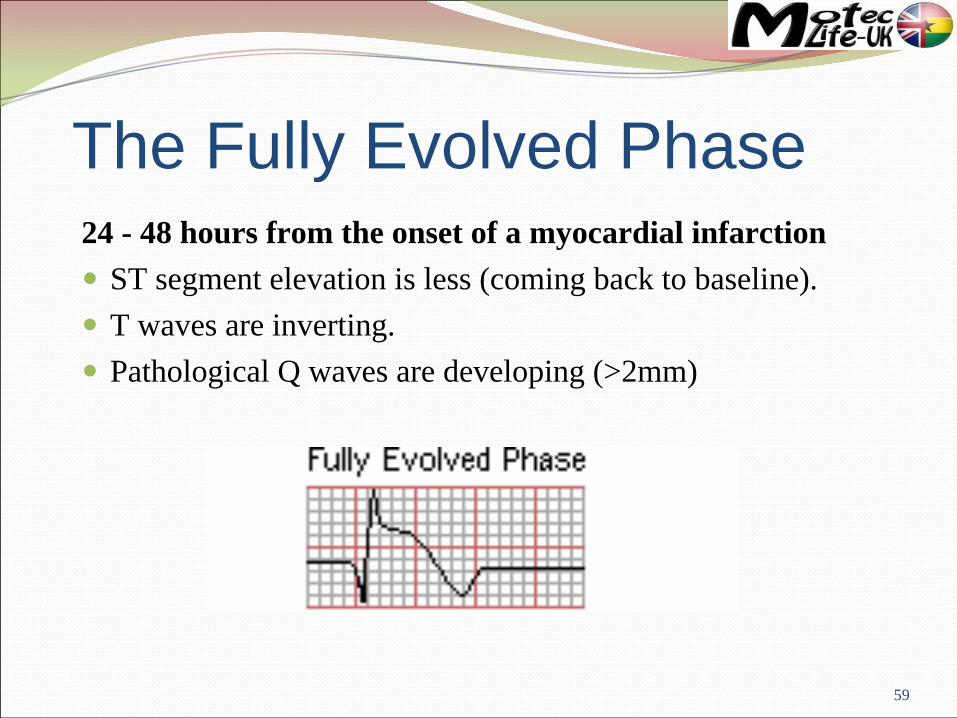
The Fully Evolved Phase24 - 48 hours from the onset of a myocardial infarction
ST segment elevation is less (coming back to baseline).
T waves are inverting.
Pathological Q waves are developing (>2mm)
59

The Chronic Stabilised Phase
Isoelectric ST segments
T waves upright.
Pathological Q waves.
May take months or weeks.
60

61

Reciprocal Changes
62

Reciprocal Changes
Changes occurring on the opposite side of the myocardium that is infarcting
63

64

The ECG in Non ST Elevation MI
65

Non ST Elevation MI
Commonly ST depression and deep T wave inversion
History of chest pain typical of MI
Other autonomic nervous symptoms present
Biochemistry results required to diagnose MI
Q-waves may or may not form on the ECG
66

67
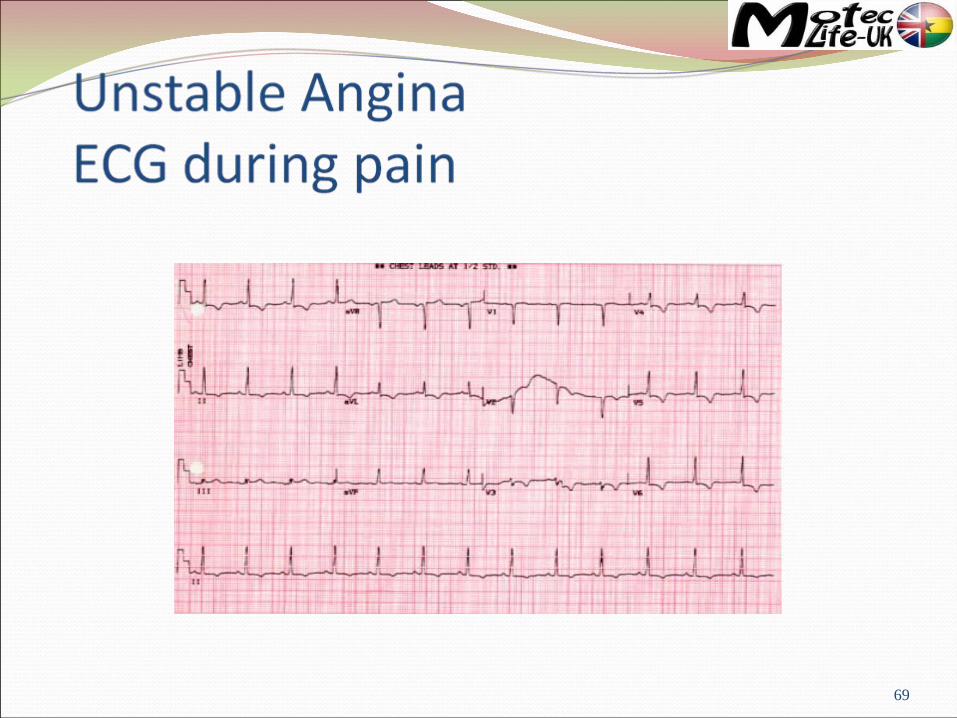
The ECG in Unstable Angina
Ischaemic changes will be detected on the ECG during pain which can OCCUR AT REST
ST depression and/or T wave inversion
Patients should be managed on a coronary care unit
May go on to develop ST elevation
68
69