12-09-12 Honda_results_Q2-1
37
1 Honda Motor Co., Ltd. October 29, 2012 Accord EX-L V-6 U.S. specification model FY13 2nd Quarter Financial Results Insight
Transcript of 12-09-12 Honda_results_Q2-1

7/30/2019 12-09-12 Honda_results_Q2-1
http://slidepdf.com/reader/full/12-09-12-hondaresultsq2-1 1/37
1
Honda Motor Co., Ltd.October 29, 2012
Accord EX-L V-6 U.S. specification model
FY13 2nd Quarter Financial Results Insight
7/30/2019 12-09-12 Honda_results_Q2-1
http://slidepdf.com/reader/full/12-09-12-hondaresultsq2-1 2/37
2
FY13 2nd Quarter Financial Results &
FY13 Financial Forecasts
Fumihiko Ike
Senior Managing Officer and Director
Chief Financial Officer
- FY13 2nd Quarter Consolidated Financial Results - FY13 Financial Forecasts
- Dividend
Kohei Takeuchi Operating Officer, General Manager of Accounting Division
- FY13 2nd Quarter Consolidated Financial Results Net Sales and Other Operating Revenue
Change in Income before Income Taxes Business Segment Information
Geographical Information
Change in Equity in Income of Affiliates
Consolidated Capital Expenditures
- FY 13 Financial Forecasts

7/30/2019 12-09-12 Honda_results_Q2-1
http://slidepdf.com/reader/full/12-09-12-hondaresultsq2-1 3/37
3
FY13 2nd Quarter Financial Results &
FY13 Financial Forecasts
Fumihiko Ike
Senior Managing Officer and Director
Chief Financial Officer
- FY13 2nd Quarter Consolidated Financial Results - FY13 Financial Forecasts
- Dividend
Kohei Takeuchi Operating Officer, General Manager of Accounting Division
- FY13 2nd Quarter Consolidated Financial Results Net Sales and Other Operating Revenue
Change in Income before Income Taxes Business Segment Information
Geographical Information
Change in Equity in Income of Affiliates
Consolidated Capital Expenditures
- FY13 Financial Forecasts
7/30/2019 12-09-12 Honda_results_Q2-1
http://slidepdf.com/reader/full/12-09-12-hondaresultsq2-1 4/37
4
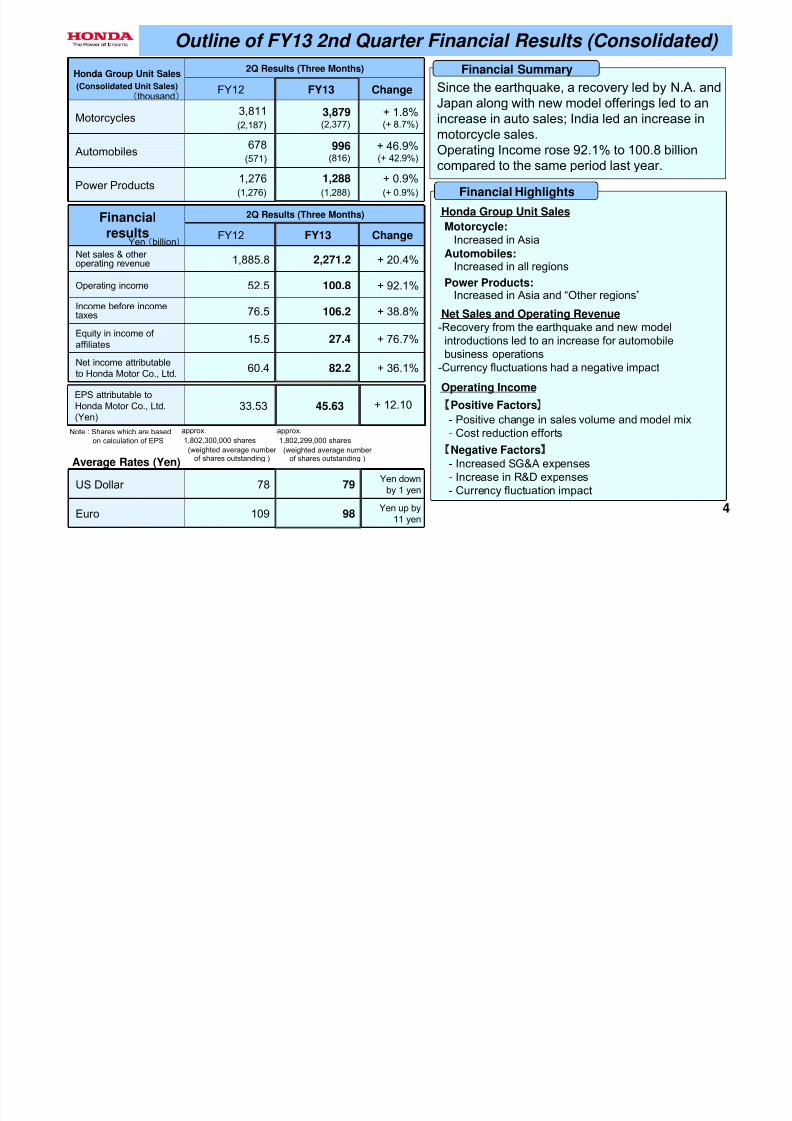
Financial Summary
Financial Highlights
Since the earthquake, a recovery led by N.A. and
Japan along with new model offerings led to anincrease in auto sales; India led an increase inmotorcycle sales.Operating Income rose 92.1% to 100.8 billioncompared to the same period last year.
Honda Group Unit Sales
(Consolidated Unit Sales)
2Q Results (Three Months)
FY12 FY13 Change
Motorcycles3,811(2,187)
3,879(2,377)
+ 1.8%(+ 8.7%)
Automobiles678
(571)
996(816)
+ 46.9%(+ 42.9%)
Power Products1,276
(1,276)
1,288
(1,288)
+ 0.9%
(+ 0.9%)
EPS attributable toHonda Motor Co., Ltd.(Yen)
33.53 45.63 + 12.10
Financialresults
2Q Results (Three Months)
FY12 FY13 Change
Net sales & other operating revenue 1,885.8 2,271.2 + 20.4%
Operating income 52.5 100.8 + 92.1%
Income before incometaxes 76.5 106.2 + 38.8%
Equity in income of affiliates
15.5 27.4 + 76.7%
Net income attributableto Honda Motor Co., Ltd.
60.4 82.2 + 36.1%
US Dollar 78 79
Yen down
by 1 yen
Euro 109 98Yen up by
11 yen
Yen (billion)
- Positive change in sales volume and model mix- Cost reduction efforts
Operating Income
Net Sales and Operating Revenue-Recovery from the earthquake and new model
introductions led to an increase for automobilebusiness operations
-Currency fluctuations had a negative impact
Motorcycle:
Automobiles:
Power Products:
Honda Group Unit Sales
Increased in Asia and “Other regions”
Increased in Asia
Increased in all regions
(thousand)
Positive Factors
- Increased SG&A expenses- Increase in R&D expenses
- Currency fluctuation impact
Negative Factors
Outline of FY13 2nd Quarter Financial Results (Consolidated)
Average Rates (Yen)
Note : Shares which are basedon calculation of EPS
approx.
1,802,300,000 shares
(weighted average number of shares outstanding )
approx.
1,802,299,000 shares
(weighted average number of shares outstanding )
7/30/2019 12-09-12 Honda_results_Q2-1
http://slidepdf.com/reader/full/12-09-12-hondaresultsq2-1 5/37
5
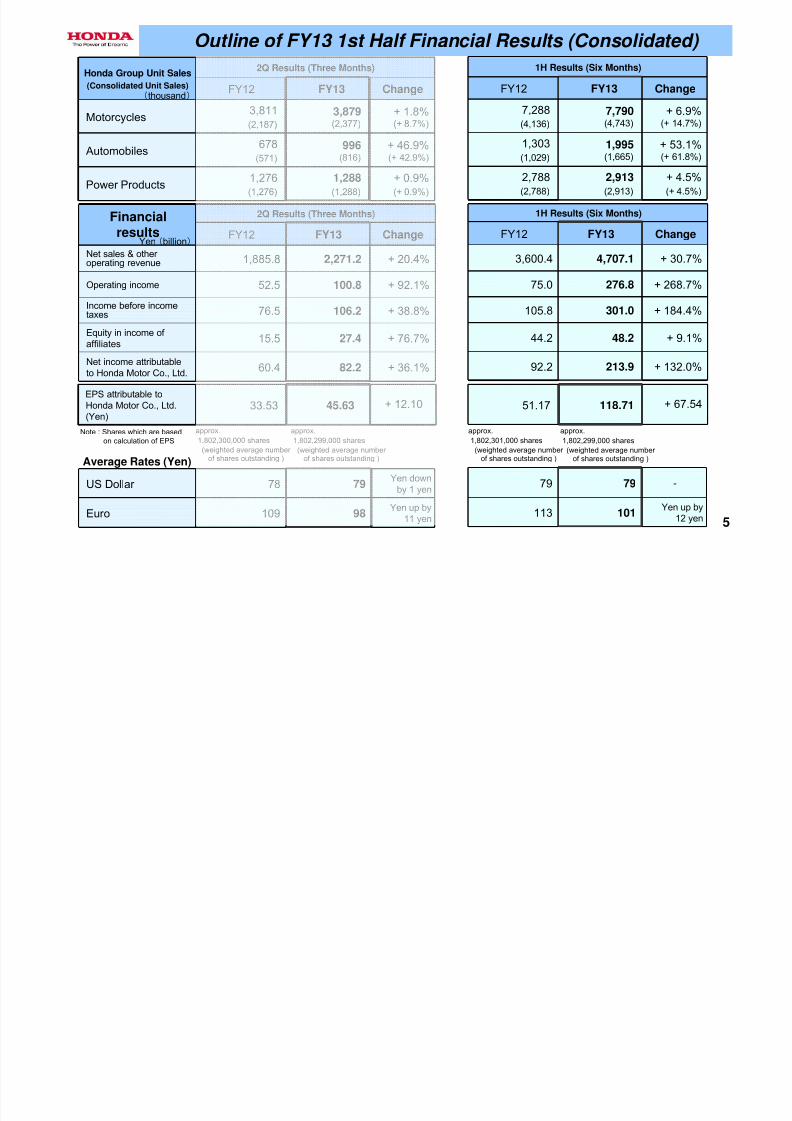
1H Results (Six Months)
FY12 FY13 Change
7,288(4,136)
7,790(4,743)
+ 6.9%(+ 14.7%)
1,303(1,029)
1,995(1,665)
+ 53.1%(+ 61.8%)
2,788
(2,788)
2,913
(2,913)
+ 4.5%
(+ 4.5%)
51.17 118.71 + 67.54
1H Results (Six Months)
FY12 FY13 Change
3,600.4 4,707.1 + 30.7%
75.0 276.8 + 268.7%
105.8 301.0 + 184.4%
44.2 48.2 + 9.1%
92.2 213.9 + 132.0%
79 79-
113 101Yen up by
12 yen
Honda Group Unit Sales
(Consolidated Unit Sales)
2Q Results (Three Months)
FY12 FY13 Change
Motorcycles3,811(2,187)
3,879(2,377)
+ 1.8%(+ 8.7%)
Automobiles678
(571)
996(816)
+ 46.9%(+ 42.9%)
Power Products1,276
(1,276)
1,288
(1,288)
+ 0.9%
(+ 0.9%)
EPS attributable toHonda Motor Co., Ltd.(Yen)
33.53 45.63 + 12.10
Financialresults
2Q Results (Three Months)
FY12 FY13 Change
Net sales & other operating revenue 1,885.8 2,271.2 + 20.4%
Operating income 52.5 100.8 + 92.1%
Income before incometaxes 76.5 106.2 + 38.8%
Equity in income of affiliates
15.5 27.4 + 76.7%
Net income attributableto Honda Motor Co., Ltd.
60.4 82.2 + 36.1%
US Dollar 78 79
Yen down
by 1 yen
Euro 109 98Yen up by
11 yen
Yen (billion)
(thousand)
Average Rates (Yen)
Note : Shares which are basedon calculation of EPS
Outline of FY13 1st Half Financial Results (Consolidated)
approx.
1,802,300,000 shares
(weighted average number of shares outstanding )
approx.
1,802,299,000 shares
(weighted average number of shares outstanding )
approx.
1,802,301,000 shares
(weighted average number of shares outstanding )
approx.
1,802,299,000 shares
(weighted average number of shares outstanding )
7/30/2019 12-09-12 Honda_results_Q2-1
http://slidepdf.com/reader/full/12-09-12-hondaresultsq2-1 6/37
6
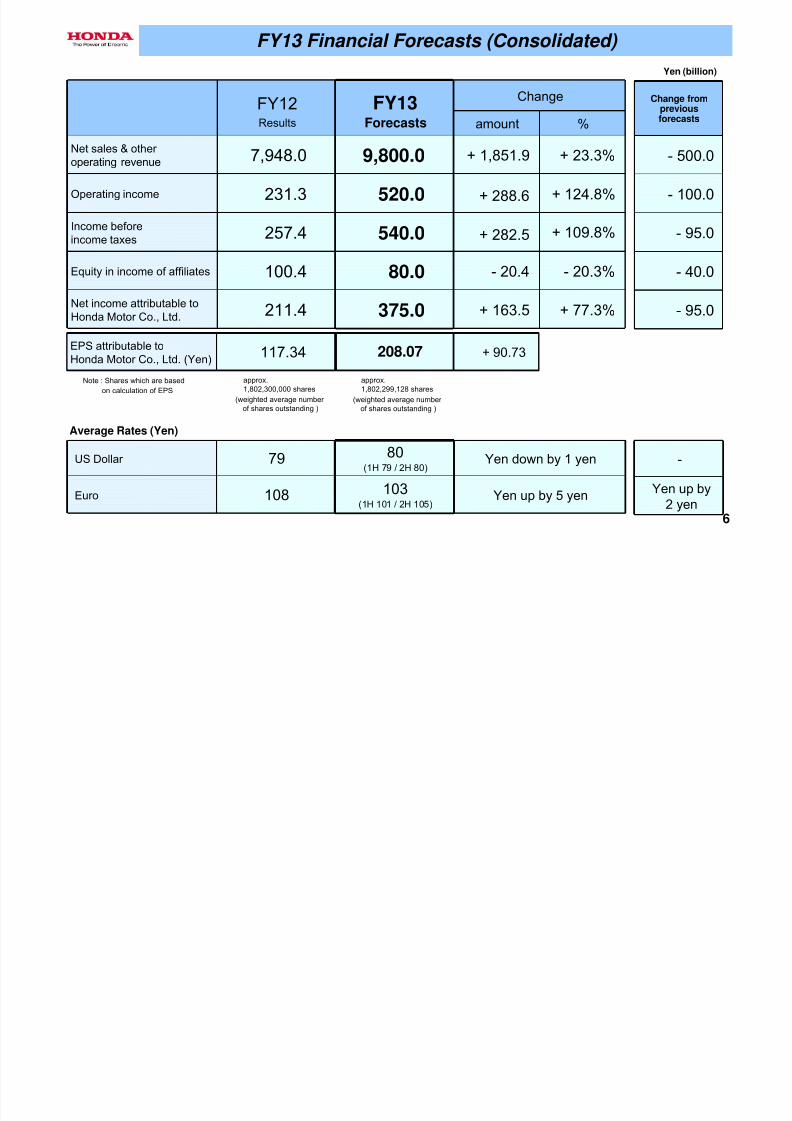
FY12Results
FY13Forecasts
Change
amount %
Net sales & other operating revenue 7,948.0 9,800.0 + 1,851.9 + 23.3%
Operating income 231.3 520.0 + 288.6 + 124.8%
Income beforeincome taxes 257.4 540.0 + 282.5 + 109.8%
Equity in income of affiliates 100.4 80.0 - 20.4 - 20.3%
Net income attributable toHonda Motor Co., Ltd. 211.4 375.0 + 163.5 + 77.3%
EPS attributable toHonda Motor Co., Ltd. (Yen)
117.34 208.07 + 90.73
US Dollar 79 80(1H 79 / 2H 80)
Yen down by 1 yen
Euro 108 103(1H 101 / 2H 105)
Yen up by 5 yen
Change frompreviousforecasts
- 500.0
- 100.0
- 95.0
- 40.0
- 95.0
-
Yen up by2 yen
FY13 Financial Forecasts (Consolidated)
Yen (billion)
Note : Shares which are based
on calculation of EPS
approx.
1,802,300,000 shares(weighted average number
of shares outstanding )
approx.
1,802,299,128 shares(weighted average number
of shares outstanding )
Average Rates (Yen)
7/30/2019 12-09-12 Honda_results_Q2-1
http://slidepdf.com/reader/full/12-09-12-hondaresultsq2-1 7/37
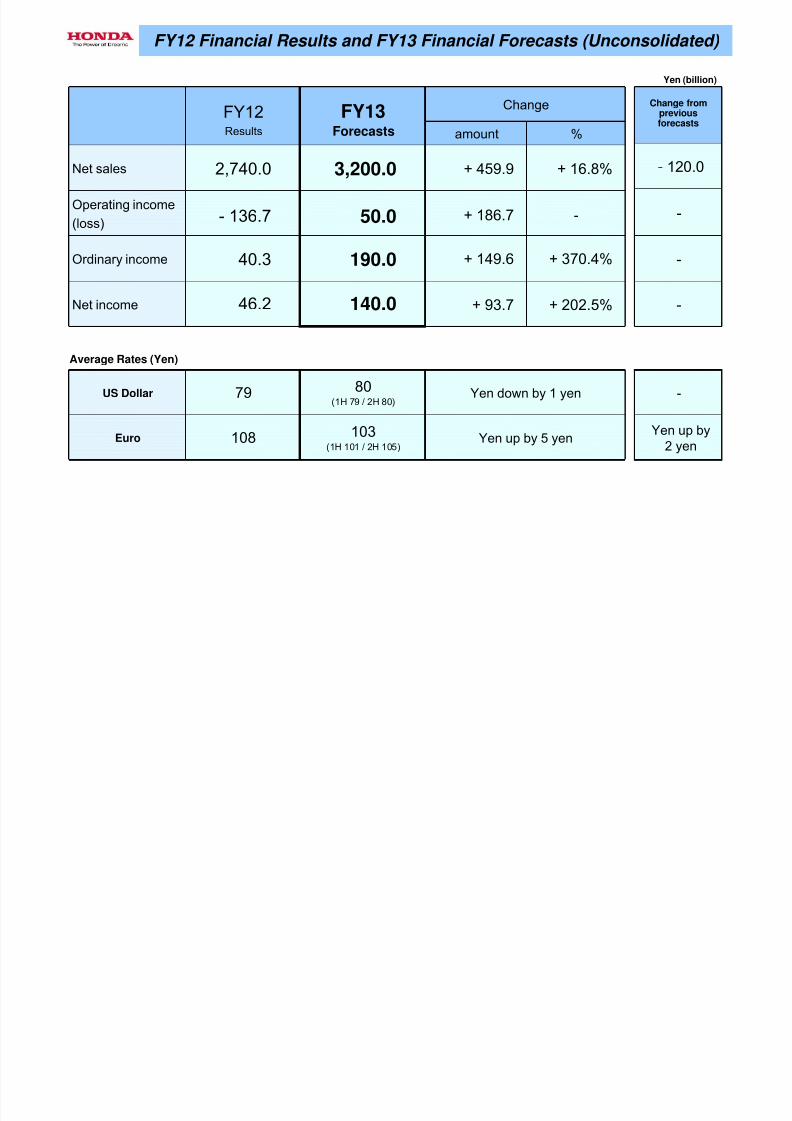
46.2
40.3
- 136.7
2,740.0
FY12Results
+ 202.5%
+ 370.4%
-
+ 16.8%
%amount
ChangeFY13Forecasts
140.0
190.0
50.0
3,200.0
+ 93.7
+ 149.6
+ 186.7
+ 459.9
Net income
Ordinary income
Operating income
(loss)
Net sales
-
-
-
- 120.0
108
79
103(1H 101 / 2H 105)
80(1H 79 / 2H 80)
Yen up by 5 yen
Yen down by 1 yen
Euro
US Dollar
Yen up by2 yen
-
FY12 Financial Results and FY13 Financial Forecasts (Unconsolidated)
Yen (billion)
Change frompreviousforecasts
Average Rates (Yen)
7/30/2019 12-09-12 Honda_results_Q2-1
http://slidepdf.com/reader/full/12-09-12-hondaresultsq2-1 8/37
8
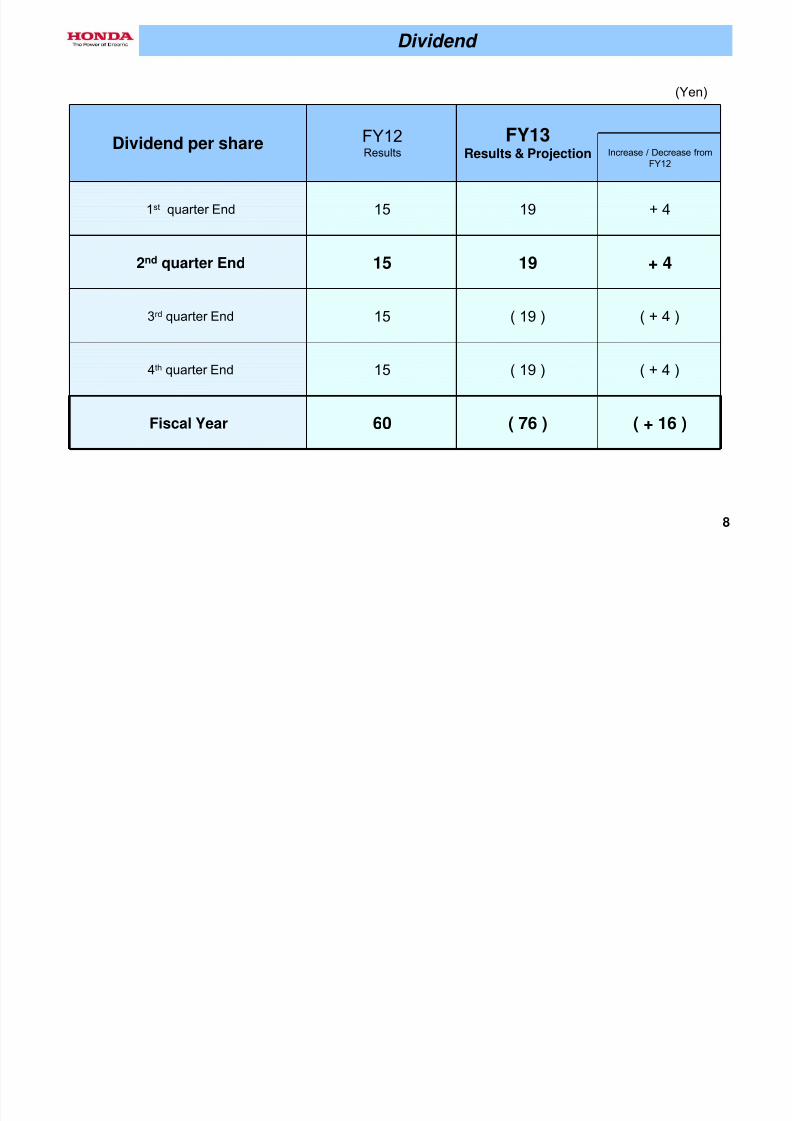
FY12Results
FY13Results & Projection Increase / Decrease from
FY12
1st quarter End 15 19 + 4
2nd quarter End 15 19 + 4
3rd quarter End 15 ( 19 ) ( + 4 )
4th quarter End 15 ( 19 ) ( + 4 )
Fiscal Year 60 ( 76 ) ( + 16 )
Dividend
(Yen)
Dividend per share

7/30/2019 12-09-12 Honda_results_Q2-1
http://slidepdf.com/reader/full/12-09-12-hondaresultsq2-1 9/37
9
FY13 2nd Quarter Financial Results &FY13 Financial Forecasts
Fumihiko Ike
Senior Managing Officer and Director
Chief Financial Officer
- FY13 2nd Quarter Consolidated Financial Results - FY13 Financial Forecasts
- Dividend
Kohei Takeuchi Operating Officer, General Manager of Accounting Division
- FY13 2nd Quarter Consolidated Financial Results Net Sales and Other Operating Revenue
Change in Income before Income Taxes Business Segment Information
Geographical Information
Change in Equity in Income of Affiliates
Consolidated Capital Expenditures
- FY13 Financial Forecasts
7/30/2019 12-09-12 Honda_results_Q2-1
http://slidepdf.com/reader/full/12-09-12-hondaresultsq2-1 10/37
10
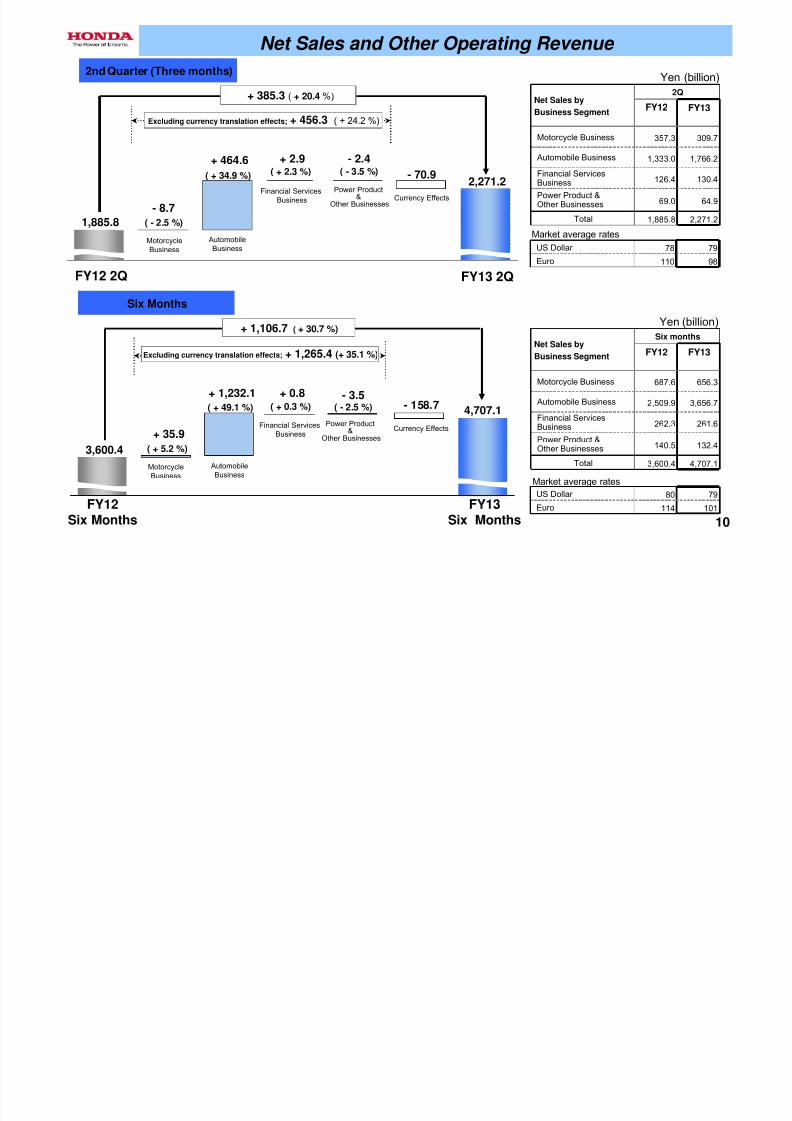
( - 2.5 %)
( + 34.9 %) ( + 2.3 %) ( - 3.5 %)
Net Sales byBusiness Segment
2Q
FY12 FY13
Motorcycle Business 357.3 309.7
Automobile Business 1,333.0 1,766.2
Financial ServicesBusiness 126.4 130.4
Power Product &Other Businesses 69.0 64.9
Total 1,885.8 2,271.2
US Dollar 78 79
Euro 110 98
Excluding currency translation effects; + 456.3 ( + 24.2 %)
1,885.8
- 8.7
+ 464.6 + 2.9 - 2.4
- 70.92,271.2
+ 385.3 ( + 20.4 %)
( + 5.2 %)
( + 49.1 %) ( - 2.5 %)
Excluding currency translation effects; + 1,265.4 (+ 35.1 %)
3,600.4
+ 35.9
+ 1,232.1 + 0.8 - 3.5- 158.7 4,707.1( + 0.3 %)
Net Sales by
Business Segment
Six months
FY12 FY13
Motorcycle Business 687.6 656.3
Automobile Business 2,509.9 3,656.7
Financial ServicesBusiness 262.3 261.6
Power Product &Other Businesses 140.5 132.4
Total 3,600.4 4,707.1
US Dollar 80 79
Euro 114 101
+ 1,106.7 ( + 30.7 %)
Net Sales and Other Operating Revenue
2nd Quarter (Three months)
Six Months
Yen (billion)
Yen (billion)
FY12 2Q FY13 2Q
MotorcycleBusiness
AutomobileBusiness
Financial ServicesBusiness
Power Product
&Other Businesses
Currency Effects
Market average rates
FY12Six Months
FY13Six Months
MotorcycleBusiness
AutomobileBusiness
Financial ServicesBusiness
Power Product&
Other Businesses
Currency Effects
Market average rates
7/30/2019 12-09-12 Honda_results_Q2-1
http://slidepdf.com/reader/full/12-09-12-hondaresultsq2-1 11/37
11
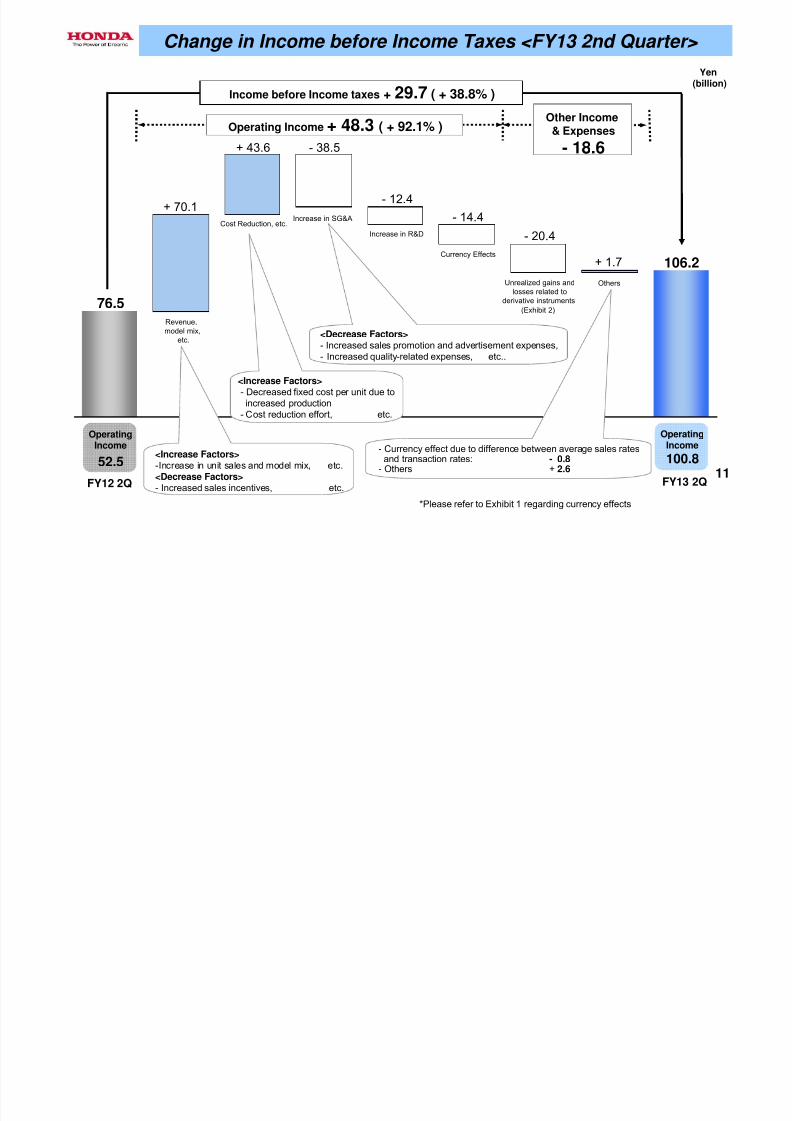
Income before Income taxes + 29.7 ( + 38.8% )
76.5
106.2
+ 70.1
+ 43.6 - 38.5
- 12.4- 14.4
- 20.4
+ 1.7
Operating Income + 48.3 ( + 92.1% )Other Income& Expenses
- 18.6
- Currency effect due to difference between average sales ratesand transaction rates: - 0.8
- Others + 2.6
Change in Income before Income Taxes <FY13 2nd Quarter>
Yen(billion)
FY12 2Q FY13 2Q
OperatingIncome
52.5
OperatingIncome
100.8
*Please refer to Exhibit 1 regarding currency effects
Revenue,model mix,
etc.
Cost Reduction, etc.Increase in SG&A
Increase in R&D
Currency Effects
Unrealized gains and
losses related toderivative instruments
(Exhibit 2)
Others
<Increase Factors>-Increase in unit sales and model mix, etc.<Decrease Factors>
- Increased sales incentives, etc.
<Increase Factors>
- Decreased fixed cost per unit due toincreased production
- Cost reduction effort, etc.
<Decrease Factors>- Increased sales promotion and advertisement expenses,- Increased quality-related expenses, etc..
7/30/2019 12-09-12 Honda_results_Q2-1
http://slidepdf.com/reader/full/12-09-12-hondaresultsq2-1 12/37
12
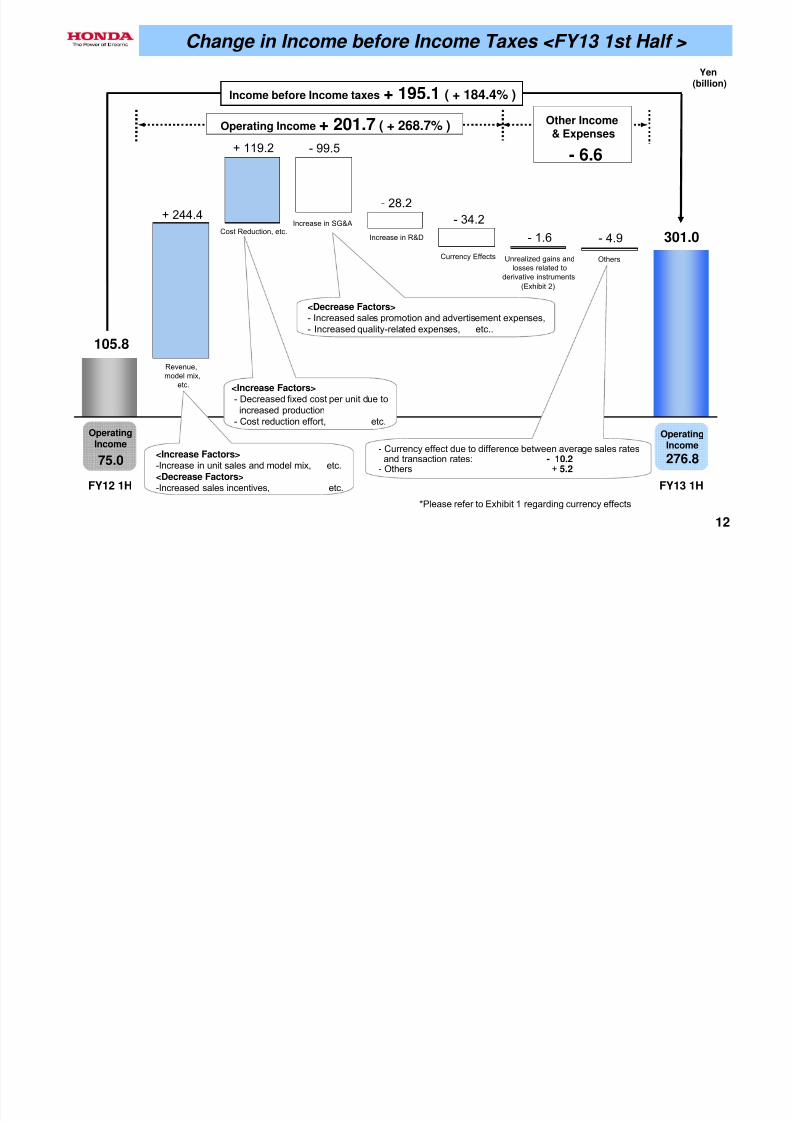
Income before Income taxes + 195.1 ( + 184.4% )
301.0
+ 244.4
+ 119.2 - 99.5
- 28.2
- 34.2
- 1.6 - 4.9
Operating Income + 201.7 ( + 268.7% ) Other Income& Expenses
- 6.6
105.8
Change in Income before Income Taxes <FY13 1st Half >
Yen(billion)
Revenue,model mix,
etc.
Cost Reduction, etc.Increase in SG&A
Increase in R&D
Currency Effects Unrealized gains andlosses related to
derivative instruments
(Exhibit 2)
Others
- Currency effect due to difference between average sales ratesand transaction rates: - 10.2
- Others + 5.2
OperatingIncome
75.0
FY12 1H FY13 1H
OperatingIncome
276.8
*Please refer to Exhibit 1 regarding currency effects
<Increase Factors>-Increase in unit sales and model mix, etc.<Decrease Factors>
-Increased sales incentives, etc.
<Increase Factors>- Decreased fixed cost per unit due toincreased production
- Cost reduction effort, etc.
<Decrease Factors>- Increased sales promotion and advertisement expenses,- Increased quality-related expenses, etc..
7/30/2019 12-09-12 Honda_results_Q2-1
http://slidepdf.com/reader/full/12-09-12-hondaresultsq2-1 13/37
13
0
1,000
2,000
3,000
4,000
5,000
6,000
7,000
8,000
9,000
10,000
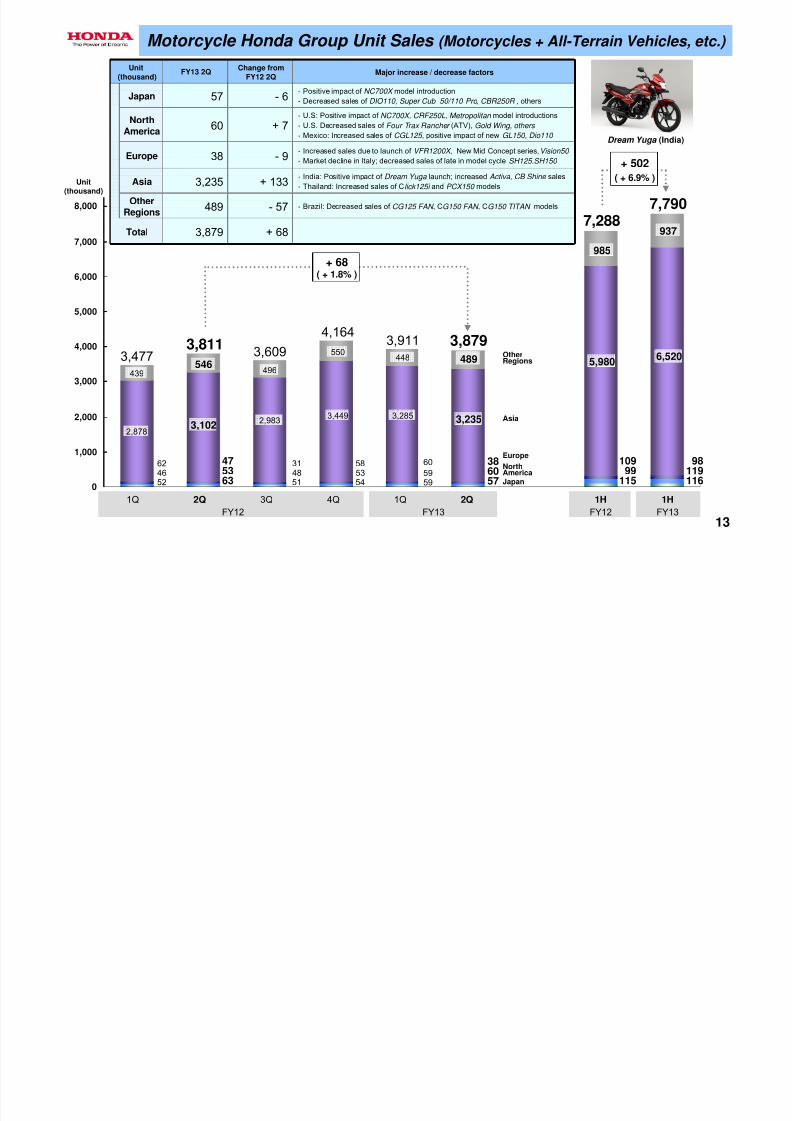
+ 68( + 1.8% )
2,878
62
439
3,477
4652
546
3,102
3,811
475363
496
2,983
3,609
314851
550
3,449
4,164
585354
3,285
60
448
3,911
5959
FY13 2QChange from
FY12 2QMajor increase / decrease factors
Japan 57 - 6
- Positive impact of NC700X model introduction
- Decreased sales of DIO110 , Super Cub 50/110 Pro , CBR250R , others
NorthAmerica
60 + 7- U.S: Positive impact of NC700X, CRF250L, Metropolitan model introductions
- U.S. Decreased sales of Four Trax Rancher (ATV), Gold Wing, others
- Mexico: Increased sales of CGL125 , positive impact of new GL150 , Dio110
Europe 38 - 9- Increased sales due to launch of VFR1200X , New Mid Concept series,Vision50
- Market decline in Italy; decreased sales of late in model cycle SH125,SH150
Asia 3,235 + 133- India: Positive impact of Dream Yuga launch; increased Activa , CB Shine sales
- Thailand: Increased sales of Click125i and PCX150 models
OtherRegions
489 - 57 - Brazil: Decreased sales of CG125 FAN , CG150 FAN , CG150 TITAN models
Total 3,879 + 68
489
3,235
3,879
386057
985
5,980
7,288
10999
115
937
6,520
7,790
98119116
+ 502
( + 6.9% )
Dream Yuga (India)
Unit
(thousand)
Motorcycle Honda Group Unit Sales (Motorcycles + All-Terrain Vehicles, etc.)
Unit(thousand)
FY13FY12FY13FY12
1Q 2Q 1H 1H4Q3Q2Q1Q
Asia
Europe
OtherRegions
Japan
NorthAmerica

7/30/2019 12-09-12 Honda_results_Q2-1
http://slidepdf.com/reader/full/12-09-12-hondaresultsq2-1 14/37
14
38.9
83.8
25.4
62.2
32.8 36.825.8
44.9
10.9%
8.2%
12.2%
9.5%9.2%
10.6%
13.6%
8.5%
-10
10
30
50
70
90
110
130
150
-1%
3%
7%
11%
15%
( - 13.3 % )
2Q4Q3Q2QFY12 FY13 FY12 FY13
1Q 1Q 1H 1HHonda Group
Unit Sales(Consolidated
Unit Sales)3,477(1,949) 3,811(2,187) 3,609(2,031) 4,164(2,483) 3,911(2,366) 3,8792,377 7,2884,136 7,7904,743
NetSales 330.3 357.3 302.5 358.5 346.6 309.7 687.6 656.3
( - 4.6% )
( - 25.8% )
( - 34.8%)
Motorcycle Business Unit Sales/Net Sales/Operating Income (Margin)
Unit(thousand)
Yen(billion)
Currency Effect - 67.3(Revenue from sales to
external customers)
Currency Effect - 38.8(Revenue from sales to
external customers)
Yen(billion)
Operating Margin
Operating Income
FY13FY12FY13FY12
1Q 2Q 1H 1H4Q3Q2Q1Q
<Increase Factors>
-Decreased SG&A expenses, etc
<Decrease Factors>
-Decreased sale of parts for overseas production,
-Negative currency effect, etc
7/30/2019 12-09-12 Honda_results_Q2-1
http://slidepdf.com/reader/full/12-09-12-hondaresultsq2-1 15/37
15
0
500
1,000
1,500
2,000
2,500
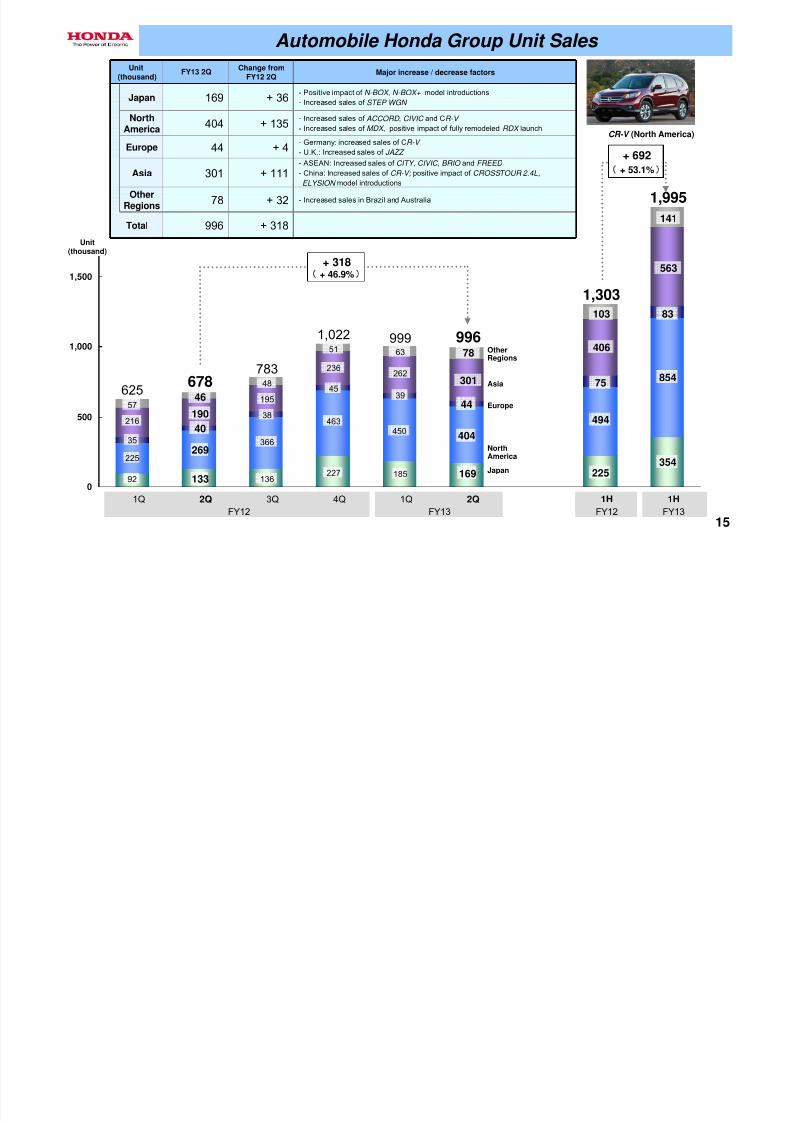
+ 318+ 46.9%
216
35
57625
225
92
46
190
678
40
269
133
48
195
783
38
366
136
51
236
1,022
45
463
227
262
39
63
999
450
185
78
301
996
44
404
169
103
406
1,303
75
494
225
141
563
1,995
83
854
354
+ 692
+ 53.1%
FY13 2QChange from
FY12 2QMajor increase / decrease factors
Japan 169 + 36
- Positive impact of N-BOX , N-BOX+ model introductions
- Increased sales of STEP WGN
NorthAmerica
404 + 135- Increased sales of ACCORD , CIVIC and CR-V
- Increased sales of MDX , positive impact of fully remodeled RDX launch
Europe 44 + 4- Germany: increased sales of CR-V
- U.K.: Increased sales of JAZZ
Asia 301 + 111- ASEAN: Increased sales of CITY , CIVIC , BRIO and FREED
- China: Increased sales of CR-V; positive impact of CROSSTOUR 2.4L,
ELYSION model introductions
OtherRegions 78 + 32 - Increased sales in Brazil and Australia
Total 996 + 318
CR-V (North America)
Unit(thousand)
FY13FY12FY13FY12
1Q 2Q 1H 1H4Q3Q2Q1Q
Asia
Europe
OtherRegions
Japan
NorthAmerica
Automobile Honda Group Unit Sales
Unit
(thousand)
7/30/2019 12-09-12 Honda_results_Q2-1
http://slidepdf.com/reader/full/12-09-12-hondaresultsq2-1 16/37
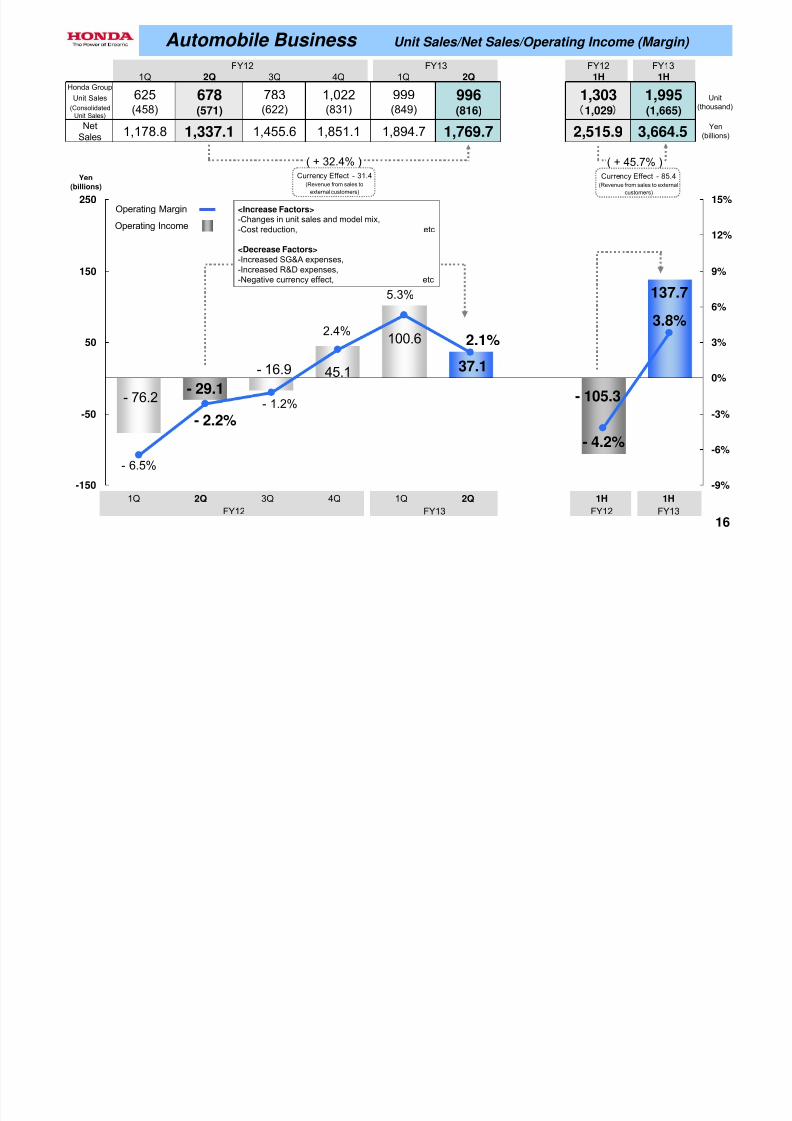
16
137.7
- 76.2 - 29.1
- 16.9 45.1
100.6
37.1
- 105.3
3.8%
- 6.5%
- 1.2%
2.4%
5.3%
- 2.2%
2.1%
- 4.2%
-150
-50
50
150
250
-9%
-6%
-3%
0%
3%
6%
9%
12%
15%
FY12 FY13 FY12 FY131Q 2Q 3Q 4Q 1Q 2Q 1H 1H
Honda Group
Unit Sales(Consolidated
Unit Sales)625(458) 678(571) 783(622) 1,022(831) 999(849) 996(816) 1,3031,029 1,995(1,665)
NetSales 1,178.8 1,337.1 1,455.6 1,851.1 1,894.7 1,769.7 2,515.9 3,664.5
( + 32.4% ) ( + 45.7% )
FY13FY12FY13FY12
1Q 2Q 1H 1H4Q3Q2Q1Q
Operating Margin
Operating Income
Yen(billions)
Yen(billions)
Currency Effect - 31.4(Revenue from sales to
external customers)
Currency Effect - 85.4(Revenue from sales to external
customers)
Automobile Business Unit Sales/Net Sales/Operating Income (Margin)
<Increase Factors>-Changes in unit sales and model mix,-Cost reduction, etc
<Decrease Factors>-Increased SG&A expenses,-Increased R&D expenses,-Negative currency effect, etc
Unit(thousand)
7/30/2019 12-09-12 Honda_results_Q2-1
http://slidepdf.com/reader/full/12-09-12-hondaresultsq2-1 17/37
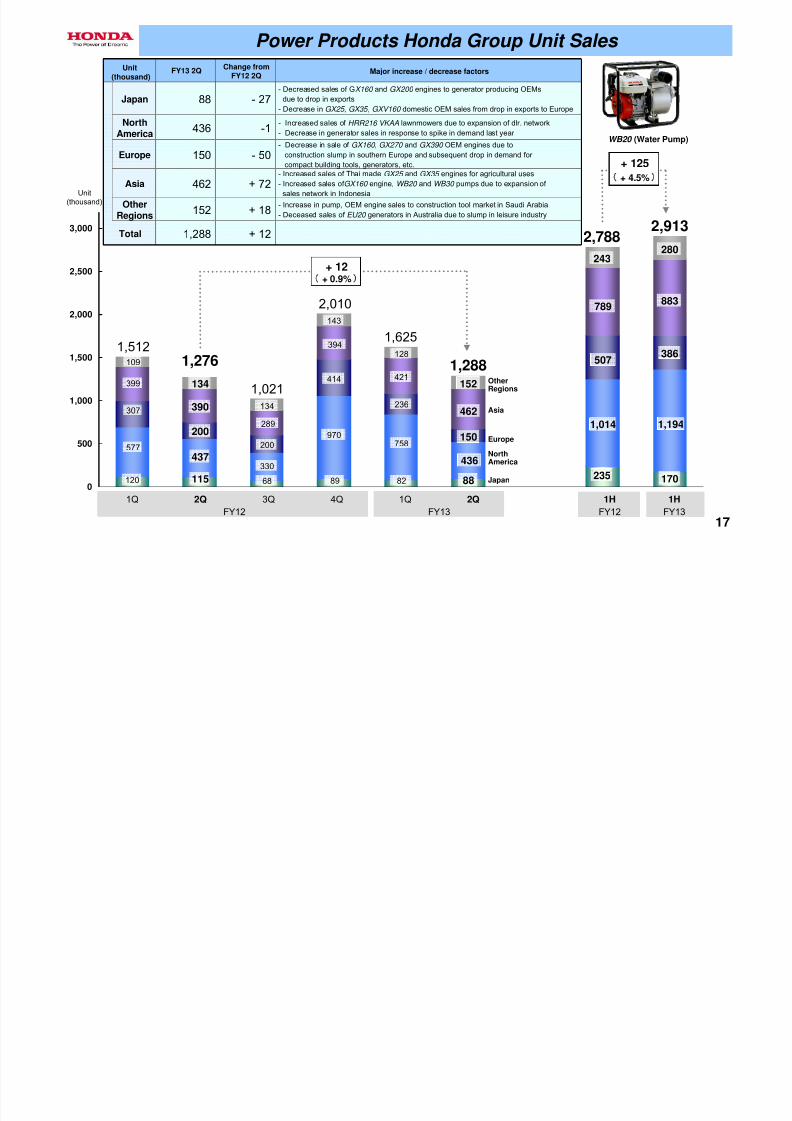
17
0
500
1,000
1,500
2,000
2,500
3,000
3,500
4,000
+ 12+ 0.9%
399
307
109
1,512
577
120
134
390
1,276
200
437
115
134
289
1,021
200
330
68
143
394
2,010
414
970
89
421
236
128
1,625
758
82
152
462
1,288
150
436
88
243
789
2,788
507
1,014
235
280
883
2,913
386
1,194
170
+ 125
+ 4.5%
FY13 2QChange from
FY12 2QMajor increase / decrease factors
Japan 88 - 27
- Decreased sales of GX160 and GX200 engines to generator producing OEMs
due to drop in exports- Decrease in GX25 , GX35 , GXV160 domestic OEM sales from drop in exports to Europe
NorthAmerica
436 -1- Increased sales of HRR216 VKAA lawnmowers due to expansion of dlr. network
- Decrease in generator sales in response to spike in demand last year
Europe 150 - 50- Decrease in sale of GX160 , GX270 and GX390 OEM engines due to
construction slump in southern Europe and subsequent drop in demand for
compact building tools, generators, etc.
Asia 462 + 72- Increased sales of Thai made GX25 and GX35 engines for agricultural uses
- Increased sales of GX160 engine, WB20 and WB30 pumps due to expansion of
sales network in Indonesia
OtherRegions
152 + 18- Increase in pump, OEM engine sales to construction tool market in Saudi Arabia
- Deceased sales of EU20 generators in Australia due to slump in leisure industry
Total 1,288 + 12
WB20 (Water Pump)
Unit(thousand)
FY13FY12FY13FY12
1Q 2Q 1H 1H4Q3Q2Q1Q
Asia
Europe
OtherRegions
Japan
NorthAmerica
Power Products Honda Group Unit Sales
Unit
(thousand)
7/30/2019 12-09-12 Honda_results_Q2-1
http://slidepdf.com/reader/full/12-09-12-hondaresultsq2-1 18/37
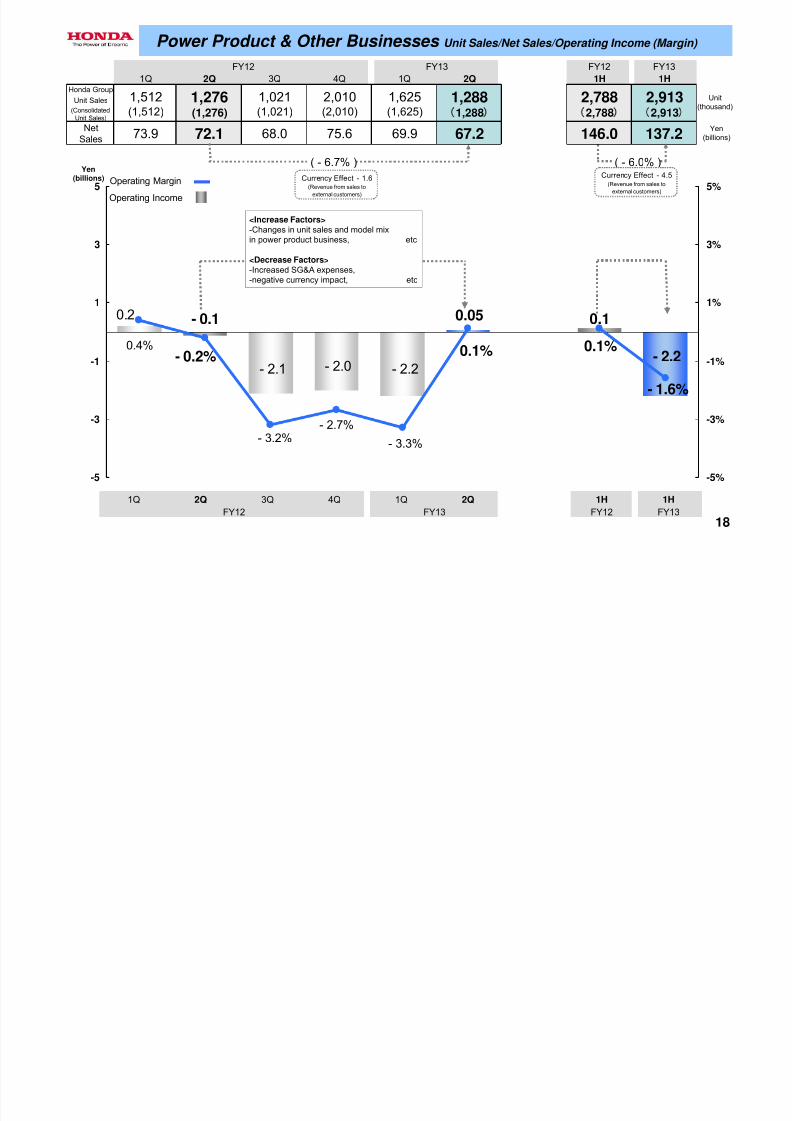
18
- 2.2
0.10.050.2
- 2.0 - 2.2- 2.1
- 0.1
0.1%0.1%- 0.2%
- 3.3%
- 2.7%
- 3.2%
0.4%
- 1.6%
-5
-3
-1
1
3
5
-5%
-3%
-1%
1%
3%
5%
<Increase Factors>-Changes in unit sales and model mixin power product business, etc
<Decrease Factors>-Increased SG&A expenses,-negative currency impact, etc
FY12 FY13 FY12 FY13
1Q 2Q 3Q 4Q 1Q 2Q 1H 1HHonda Group
Unit Sales(Consolidated
Unit Sales)
1,512(1,512) 1,276(1,276) 1,021(1,021) 2,010(2,010) 1,625(1,625) 1,2881,288 2,7882,788 2,9132,913
NetSales 73.9 72.1 68.0 75.6 69.9 67.2 146.0 137.2
( - 6.7% ) ( - 6.0% )
Power Product & Other Businesses Unit Sales/Net Sales/Operating Income (Margin)
Yen(billions)
Yen(billions) Operating Margin
Operating Income
Currency Effect - 1.6(Revenue from sales to
external customers)
Currency Effect - 4.5(Revenue from sales to
external customers)
FY13FY12FY13FY12
1Q 2Q 1H 1H4Q3Q2Q1Q
Unit(thousand)
7/30/2019 12-09-12 Honda_results_Q2-1
http://slidepdf.com/reader/full/12-09-12-hondaresultsq2-1 19/37
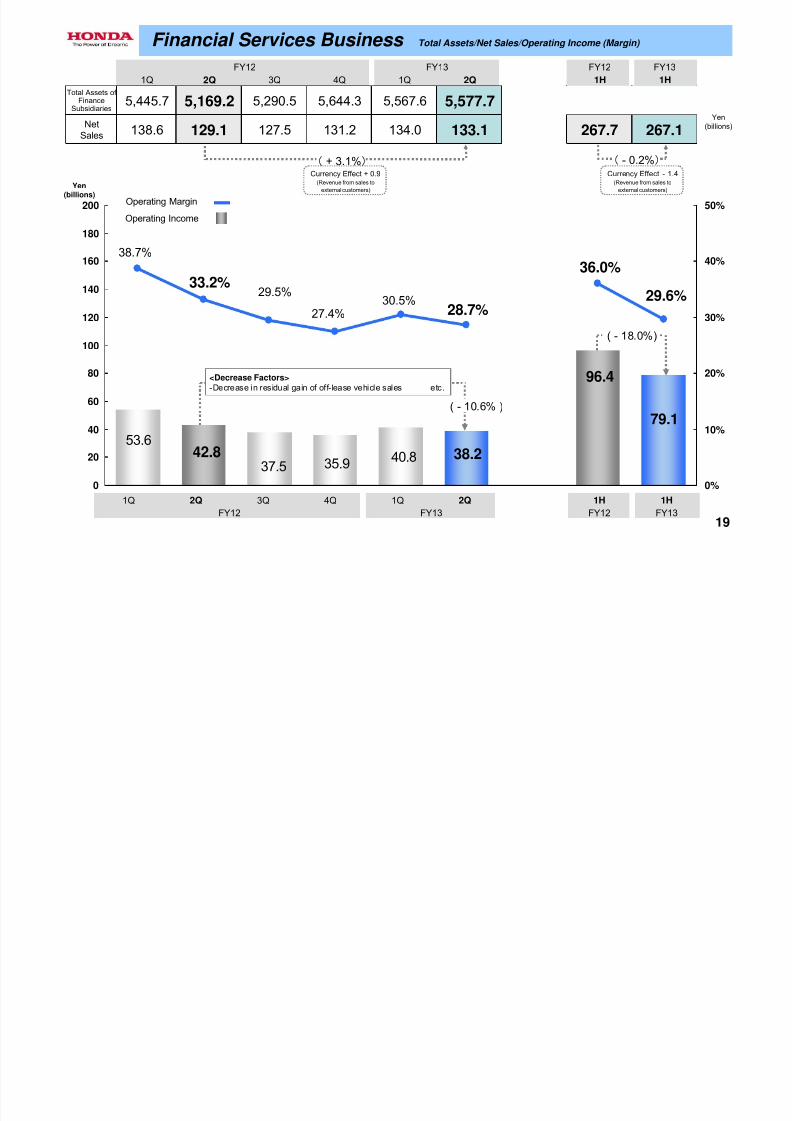
19
96.4
38.240.835.937.5
42.853.6
79.1
36.0%
28.7%
33.2%
30.5%27.4%
29.5%
38.7%
29.6%
0
20
40
60
80
100
120
140
160
180
200
0%
10%
20%
30%
40%
50%
<Decrease Factors>-Decrease in residual gain of off-lease vehicle sales etc.
FY12 FY13 FY12 FY13
1Q 2Q 3Q 4Q 1Q 2Q 1H 1H
Total Assets of
FinanceSubsidiaries 5,445.7 5,169.2 5,290.5 5,644.3 5,567.6 5,577.7
NetSales 138.6 129.1 127.5 131.2 134.0 133.1 267.7 267.1
( + 3.1%) ( - 0.2%)
( - 18.0%)
( - 10.6% )
Financial Services Business Total Assets/Net Sales/Operating Income (Margin)
Yen(billions)
FY13FY12FY13FY12
1Q 2Q 1H 1H4Q3Q2Q1Q
Operating Margin
Operating Income
Yen(billions)
Currency Effect + 0.9(Revenue from sales to
external customers)
Currency Effect - 1.4(Revenue from sales to
external customers)
7/30/2019 12-09-12 Honda_results_Q2-1
http://slidepdf.com/reader/full/12-09-12-hondaresultsq2-1 20/37
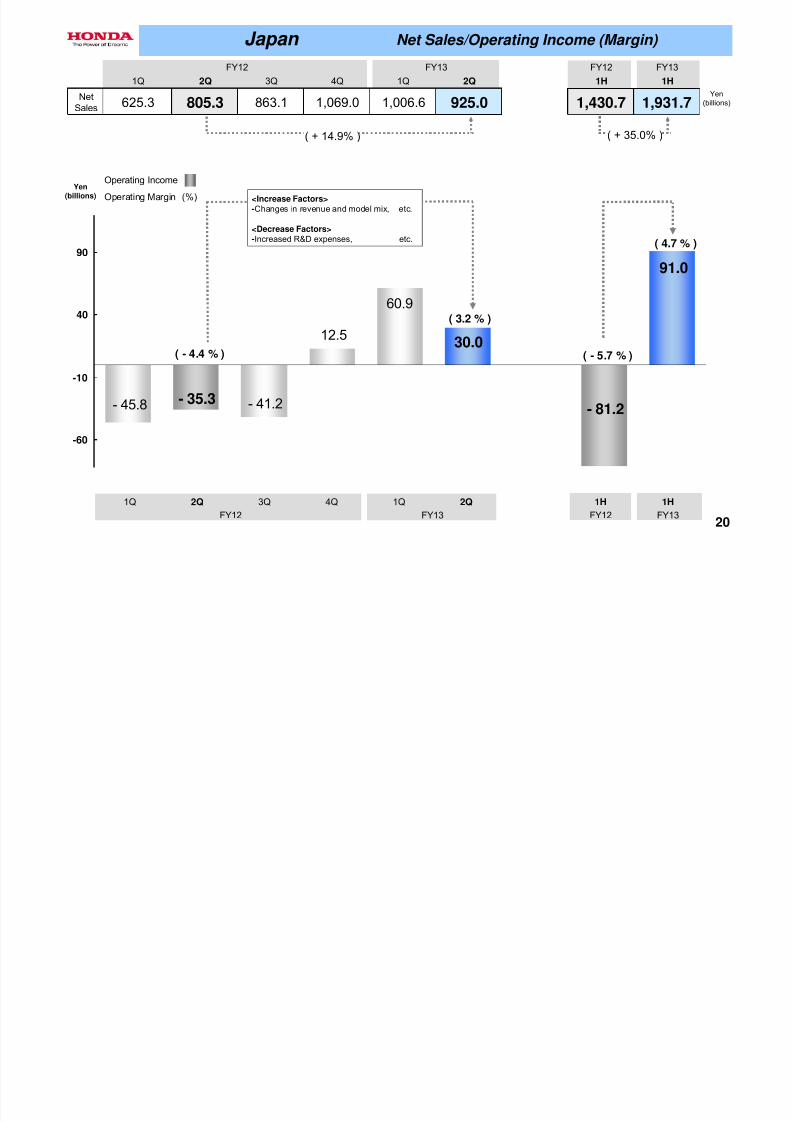
20
- 81.2
30.0
60.9
12.5
- 41.2- 35.3- 45.8
91.0
-110
-60
-10
40
90
( 3.2 % )
( - 4.4 % )
( + 14.9% )
FY12 FY13 FY12 FY13
1Q 2Q 3Q 4Q 1Q 2Q 1H 1H
NetSales 625.3 805.3 863.1 1,069.0 1,006.6 925.0 1,430.7 1,931.7
( 4.7 % )
( - 5.7 % )
( + 35.0% )
Japan Net Sales/Operating Income (Margin)
FY13FY12FY13FY12
1Q 2Q 1H 1H4Q3Q2Q1Q
Yen
(billions)
Operating Income
Operating Margin (%)
Yen
(billions)
<Increase Factors>-Changes in revenue and model mix, etc.
<Decrease Factors>-Increased R&D expenses, etc.
7/30/2019 12-09-12 Honda_results_Q2-1
http://slidepdf.com/reader/full/12-09-12-hondaresultsq2-1 21/37
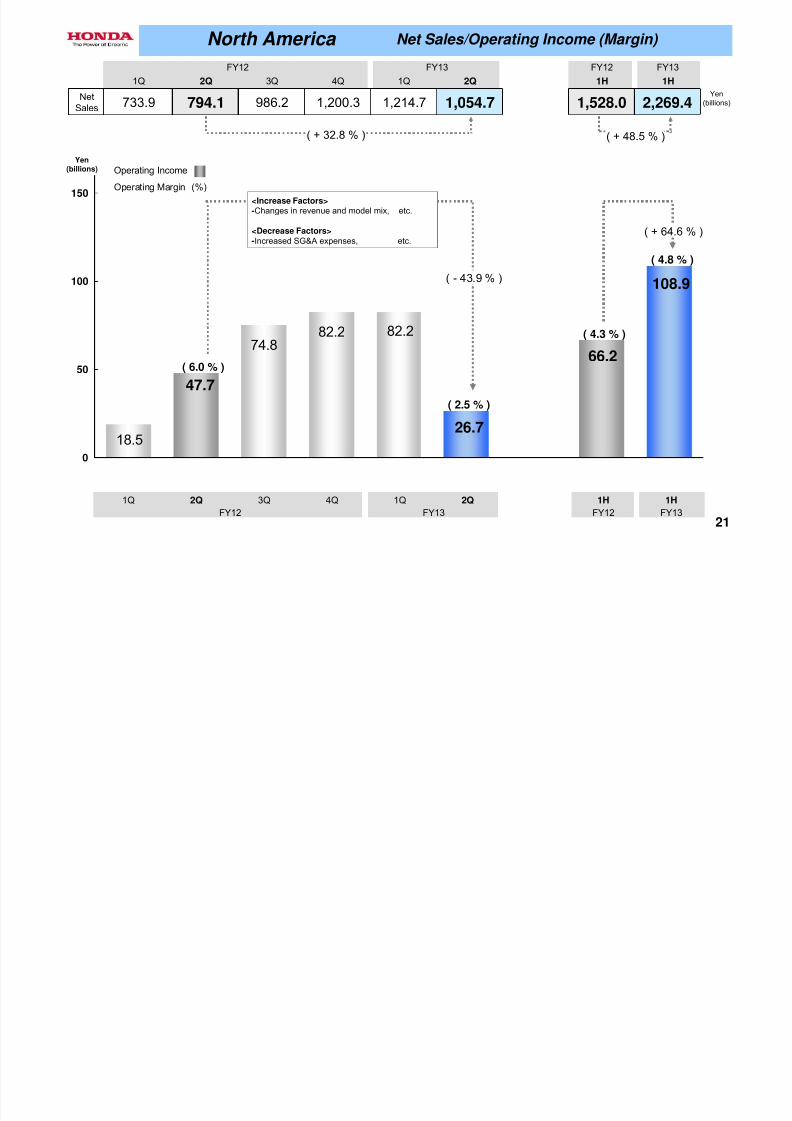
21
108.9
18.5
47.7
74.882.2 82.2
26.7
66.2
0
50
100
150
( 6.0 % )
( 2.5 % )
( + 32.8 % )
( - 43.9 % )
FY12 FY13 FY12 FY13
1Q 2Q 3Q 4Q 1Q 2Q 1H 1H
NetSales 733.9 794.1 986.2 1,200.3 1,214.7 1,054.7 1,528.0 2,269.4
( 4.3 % )
( 4.8 % )
( + 64.6 % )
( + 48.5 % )
North America Net Sales/Operating Income (Margin)
FY13FY12FY13FY12
1Q 2Q 1H 1H4Q3Q2Q1Q
Yen(billions) Operating Income
Operating Margin (%)
Yen
(billions)
<Increase Factors>-Changes in revenue and model mix, etc.
<Decrease Factors>-Increased SG&A expenses, etc.
7/30/2019 12-09-12 Honda_results_Q2-1
http://slidepdf.com/reader/full/12-09-12-hondaresultsq2-1 22/37
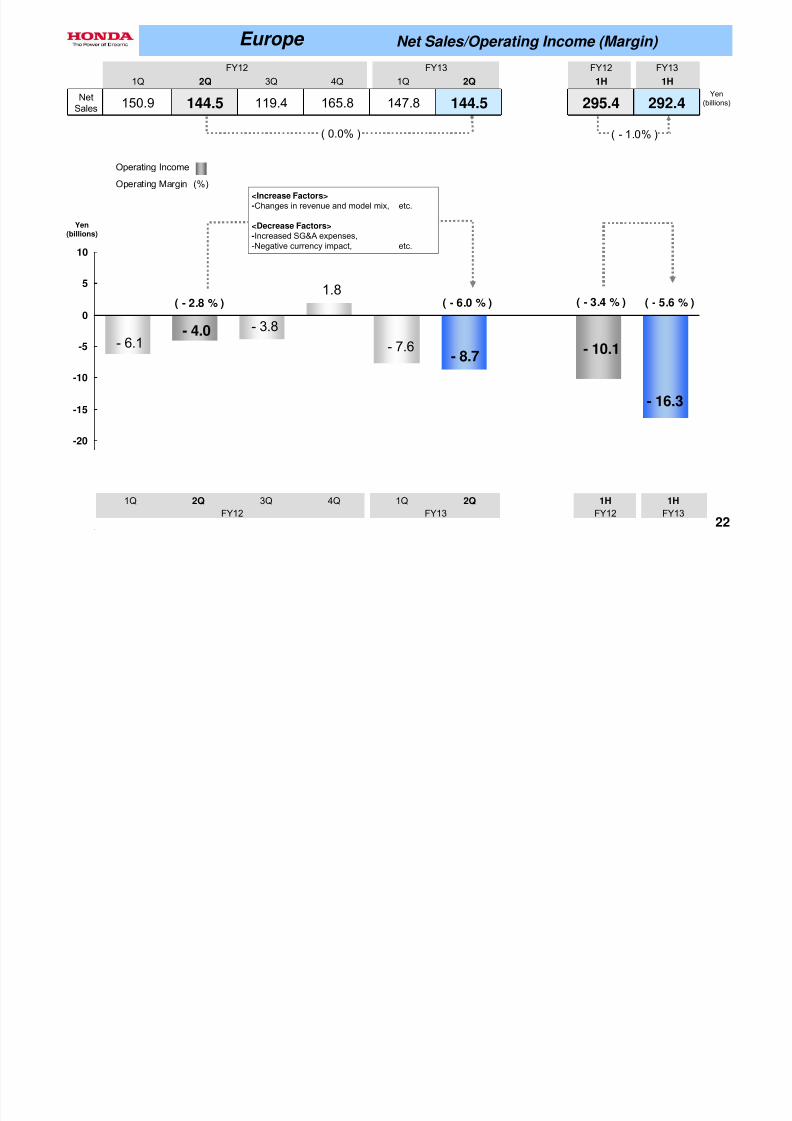
22
- 16.3
- 6.1- 4.0 - 3.8
1.8
- 7.6- 8.7
- 10.1
-30
-25
-20
-15
-10
-5
0
5
10
( - 6.0 % )( - 2.8 % )
( 0.0% )
( - 3.4 % ) ( - 5.6 % )
FY12 FY13 FY12 FY13
1Q 2Q 3Q 4Q 1Q 2Q 1H 1H
NetSales 150.9 144.5 119.4 165.8 147.8 144.5 295.4 292.4
( - 1.0% )
Europe Net Sales/Operating Income (Margin)
FY13FY12FY13FY12
1Q 2Q 1H 1H4Q3Q2Q1Q
Yen(billions)
Operating Income
Operating Margin (%)
Yen
(billions)
<Increase Factors>-Changes in revenue and model mix, etc.
<Decrease Factors>-Increased SG&A expenses,-Negative currency impact, etc.
7/30/2019 12-09-12 Honda_results_Q2-1
http://slidepdf.com/reader/full/12-09-12-hondaresultsq2-1 23/37
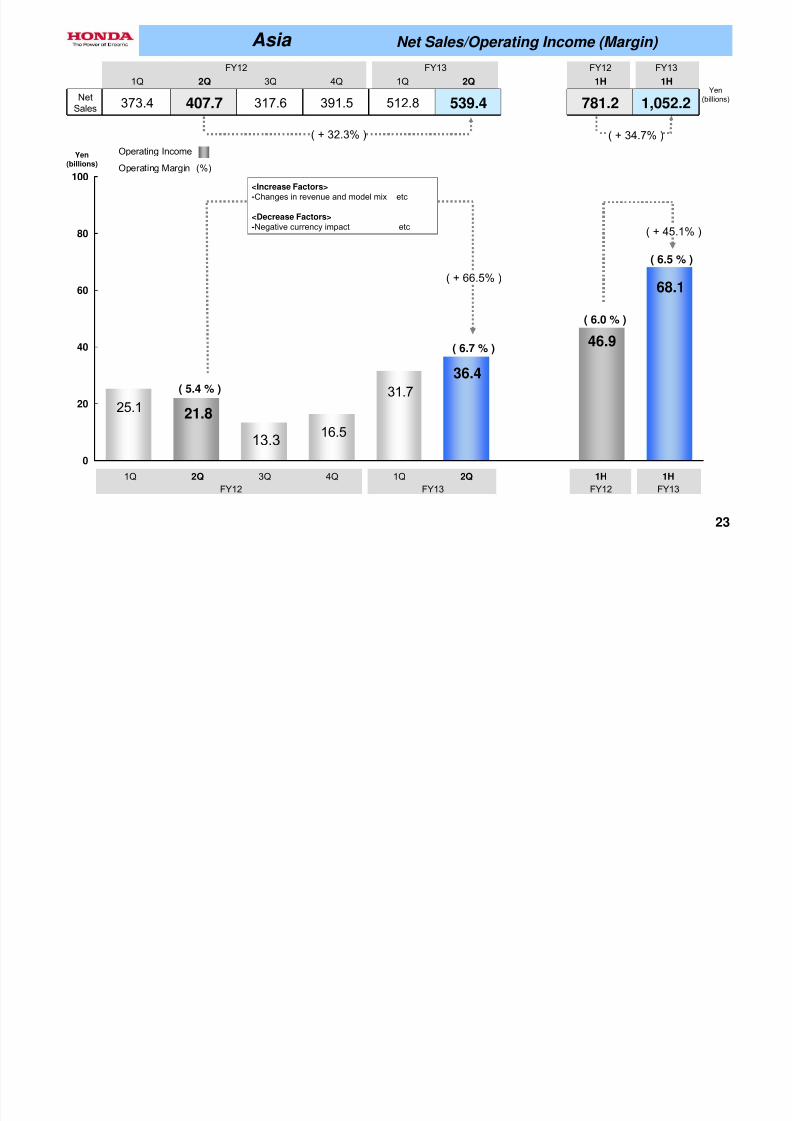
23
46.9
36.4
31.7
16.513.3
21.825.1
68.1
0
20
40
60
80
100
( 6.7 % )
( 5.4 % )
( + 32.3% )
( + 66.5% )
( 6.0 % )
( 6.5 % )
FY12 FY13 FY12 FY13
1Q 2Q 3Q 4Q 1Q 2Q 1H 1H
NetSales 373.4 407.7 317.6 391.5 512.8 539.4 781.2 1,052.2
( + 45.1% )
( + 34.7% )
Asia Net Sales/Operating Income (Margin)
Yen
(billions)
Yen(billions)
Operating Income
Operating Margin (%)
FY13FY12FY13FY12
1Q 2Q 1H 1H4Q3Q2Q1Q
<Increase Factors>
-Changes in revenue and model mix etc
<Decrease Factors>-Negative currency impact etc
7/30/2019 12-09-12 Honda_results_Q2-1
http://slidepdf.com/reader/full/12-09-12-hondaresultsq2-1 24/37
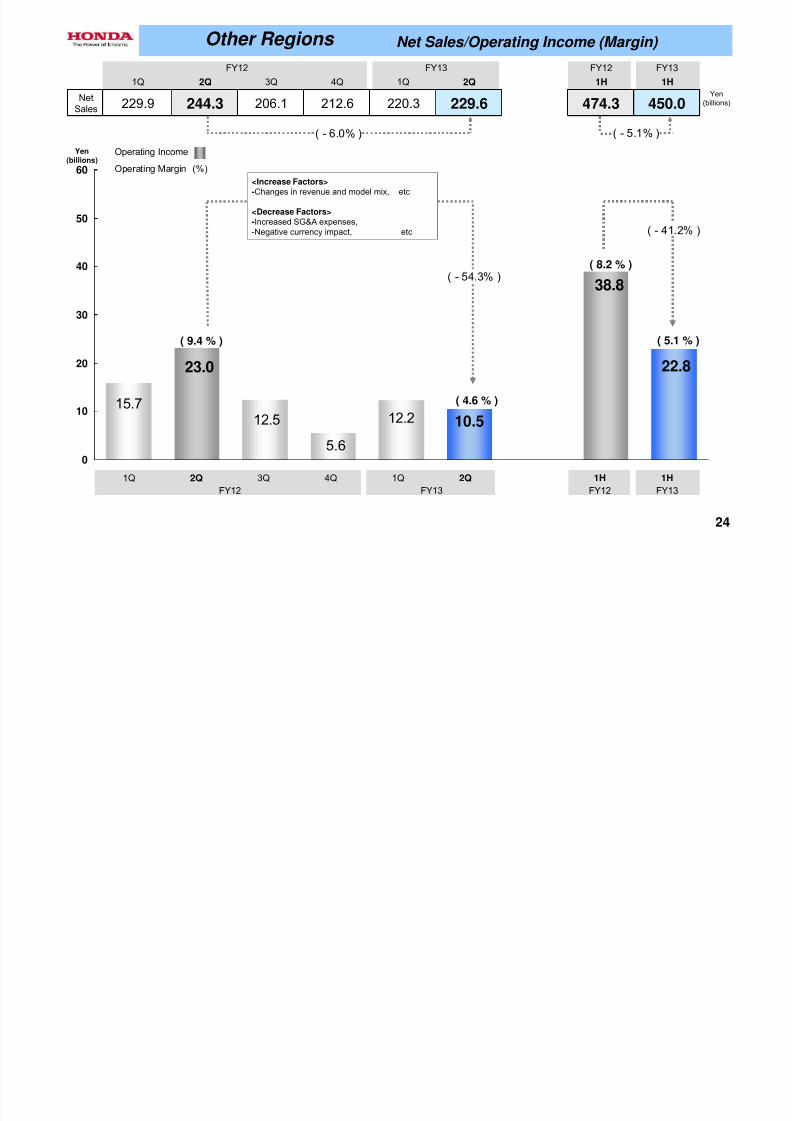
24
22.8
15.7
23.0
12.5
5.6
12.2 10.5
38.8
0
10
20
30
40
50
60
( 4.6 % )
( 9.4 % )
( - 6.0% )
( - 54.3% )
<Increase Factors>-Changes in revenue and model mix, etc
<Decrease Factors>-Increased SG&A expenses,-Negative currency impact, etc
( 8.2 % )
( 5.1 % )
FY12 FY13 FY12 FY13
1Q 2Q 3Q 4Q 1Q 2Q 1H 1H
NetSales 229.9 244.3 206.1 212.6 220.3 229.6 474.3 450.0
( - 41.2% )
( - 5.1% )
Other Regions Net Sales/Operating Income (Margin)
Yen
(billions)
Operating Income
Operating Margin (%)
Yen(billions)
FY13FY12FY13FY12
1Q 2Q 1H 1H4Q3Q2Q1Q
Ch i E i i i f ffili
7/30/2019 12-09-12 Honda_results_Q2-1
http://slidepdf.com/reader/full/12-09-12-hondaresultsq2-1 25/37
25
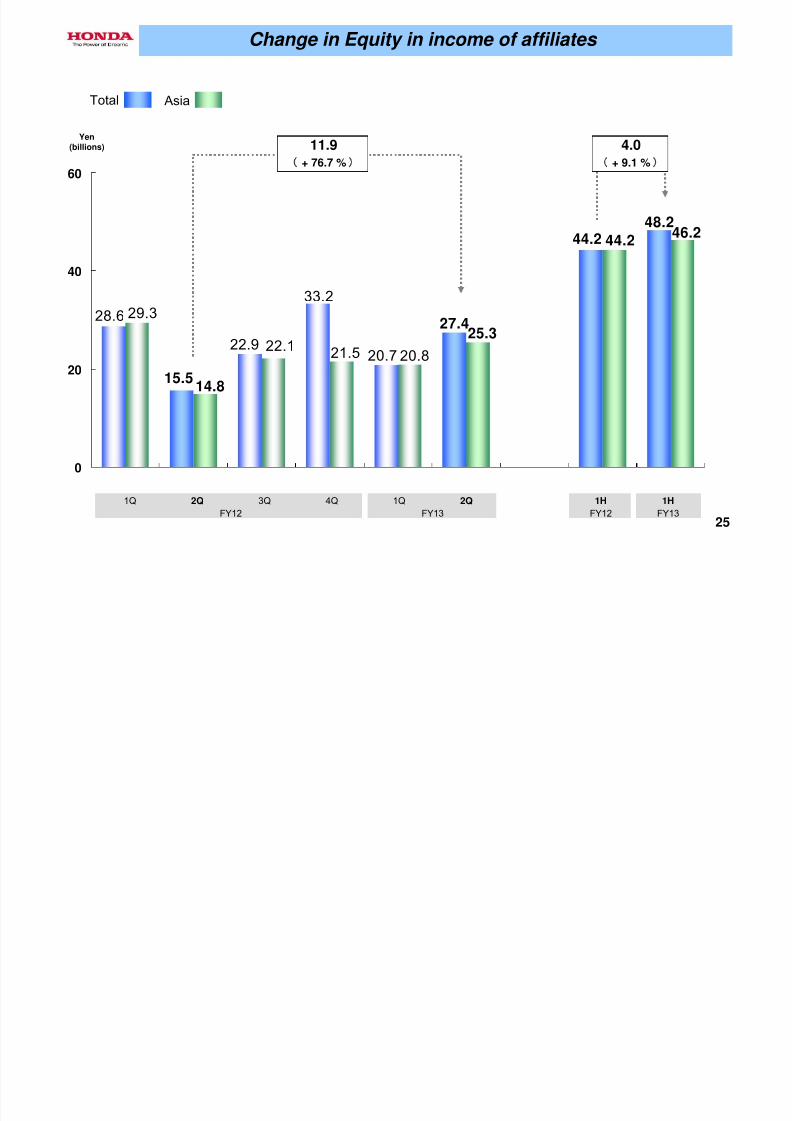
20.7
33.2
22.9
15.5
28.6
44.2
27.4
48.2
20.821.522.1
44.2
14.8
29.3
25.3
46.2
0
20
40
60
11.9+ 76.7 %
4.0+ 9.1 %
Change in Equity in income of affiliates
Total Asia
Yen(billions)
FY13FY12FY13FY12
1Q 2Q 1H 1H4Q3Q2Q1Q
C lid d C i l E di FY 3 H
7/30/2019 12-09-12 Honda_results_Q2-1
http://slidepdf.com/reader/full/12-09-12-hondaresultsq2-1 26/37
26
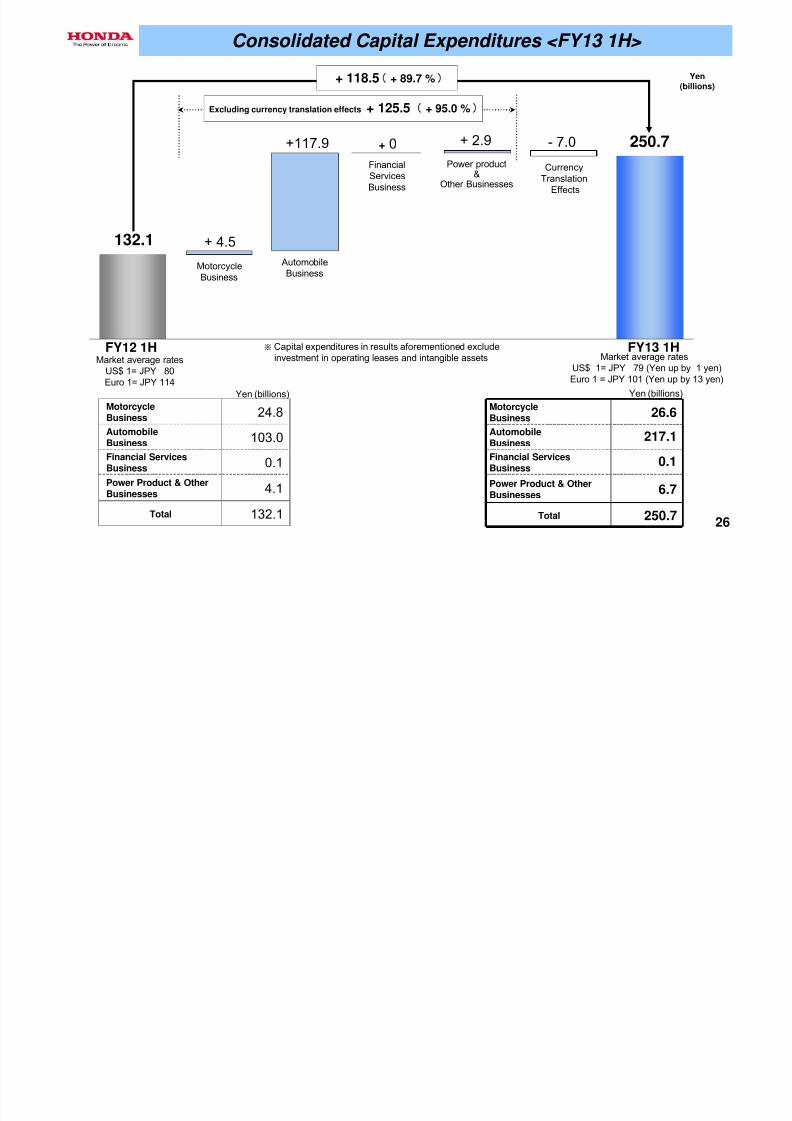
MotorcycleBusiness 24.8
AutomobileBusiness 103.0
Financial ServicesBusiness 0.1
Power Product & Other
Businesses 4.1Total 132.1
MotorcycleBusiness 26.6
AutomobileBusiness
217.1
Financial ServicesBusiness
0.1
Power Product & Other
Businesses 6.7Total 250.7
Excluding currency translation effects + 125.5 + 95.0 %
+117.9
132.1 + 4.5
+ 0 + 2.9 - 7.0 250.7
+ 118.5 + 89.7 %
Consolidated Capital Expenditures <FY13 1H>
Yen(billions)
FY12 1HMarket average rates
US$ 1= JPY 80Euro 1= JPY 114
MotorcycleBusiness
AutomobileBusiness
FinancialServicesBusiness
Power product&
Other Businesses
CurrencyTranslation
Effects
※ Capital expenditures in results aforementioned excludeinvestment in operating leases and intangible assets Market average rates
US$ 1= JPY 79 (Yen up by 1 yen)Euro 1 = JPY 101 (Yen up by 13 yen)
FY13 1H
Yen (billions)Yen (billions)
7/30/2019 12-09-12 Honda_results_Q2-1
http://slidepdf.com/reader/full/12-09-12-hondaresultsq2-1 27/37
27
FY13 2nd Quarter Financial Results &
FY13 Financial Forecasts
Fumihiko Ike
Senior Managing Officer and Director
Chief Financial Officer
- FY13 2nd Quarter Consolidated Financial Results - FY13 Financial Forecasts
- Dividend
Kohei Takeuchi Operating Officer, General Manager of Accounting Division
- FY13 2nd Quarter Consolidated Financial Results Net Sales and Other Operating Revenue
Change in Income before Income Taxes
Business Segment Information
Geographical Information
Change in Equity in Income of Affiliates
Consolidated Capital Expenditures
- FY13 Financial Forecasts
Forecast Honda Group Unit Sales
7/30/2019 12-09-12 Honda_results_Q2-1
http://slidepdf.com/reader/full/12-09-12-hondaresultsq2-1 28/37
28
0
2,000
4,000
6,000
8,000
0
1,000
2,000
3,000
4,000
5,000
0
5,000
10,000
15,000
20,000
220200198
12,412
2,031
15,061
235255210
13,820
2,080
16,600
588
1,323
158
837
3,108
202
710
1,740
230
1,310
4,300
310
5,819
1,121
392
2,314
520
1,472
6,300
1,150
355
2,520
605
1,670
230255180
13,055
1,840
15,560
710
205
1,155
310
4,1206,220
1,045
325
2,630
550
1,670
1,740
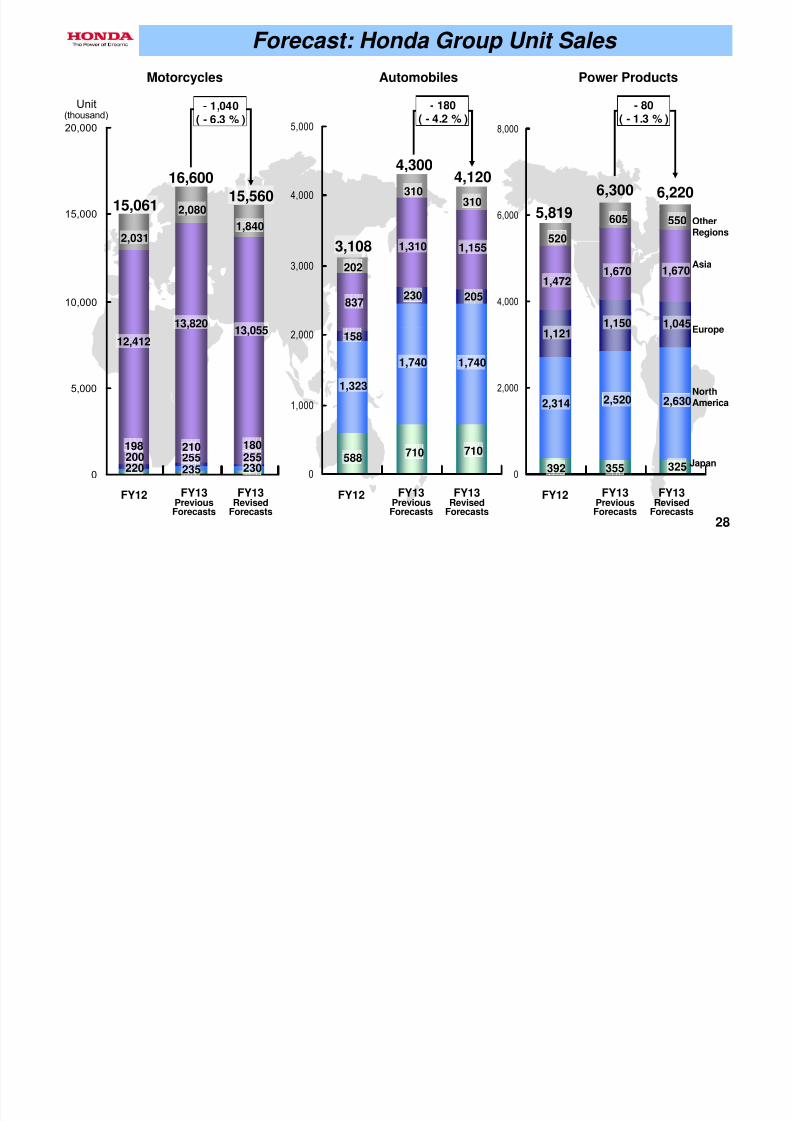
- 1,040( - 6.3 % )
- 180( - 4.2 % )
- 80( - 1.3 % )
Forecast: Honda Group Unit Sales
Motorcycles Automobiles Power Products
OtherRegions
Asia
Europe
NorthAmerica
Japan
FY12 FY13RevisedForecasts
FY13PreviousForecasts
FY12 FY13RevisedForecasts
FY13PreviousForecasts
FY12 FY13PreviousForecasts
FY13RevisedForecasts
Unit(thousand)
Forecast: Consolidated Unit Sales
7/30/2019 12-09-12 Honda_results_Q2-1
http://slidepdf.com/reader/full/12-09-12-hondaresultsq2-1 29/37
0
1,000
2,000
3,000
4,000
5,000
6,000
7,000
8,000
0
3,000
6,000
9,000
12,000
6,300
1,150
355
2,520
605
1,670
0
500
1,000
1,500
2,000
2,500
3,000
3,500
4,000
235255210
7,120
2,080
9,900
220200198
6,001
2,031
8,650
580
1,323
158
219
2,482
202
700
1,740
230
560
3,540
310
5,819
1,121
392
2,314
520
1,472
230255180
7,115
1,840
9,620
700
1,740
205
535
3,490
3106,220
1,045
325
2,630
550
1,670
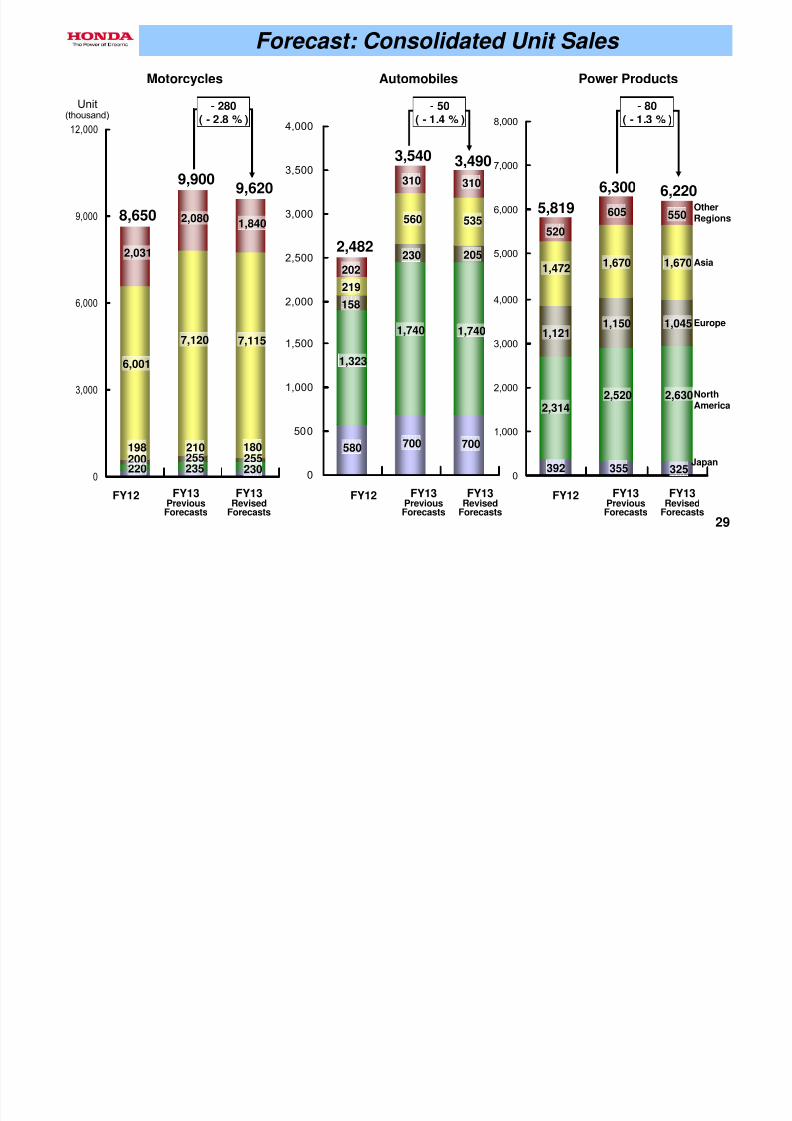
- 280( - 2.8 % )
- 50( - 1.4 % )
- 80( - 1.3 % )
Forecast: Consolidated Unit Sales
Motorcycles Automobiles Power Products
Unit(thousand)
FY12 FY13RevisedForecasts
FY13PreviousForecasts
FY12 FY13RevisedForecasts
FY13PreviousForecasts
FY12 FY13RevisedForecasts
FY13PreviousForecasts
OtherRegions
Asia
Europe
NorthAmerica
Japan
29
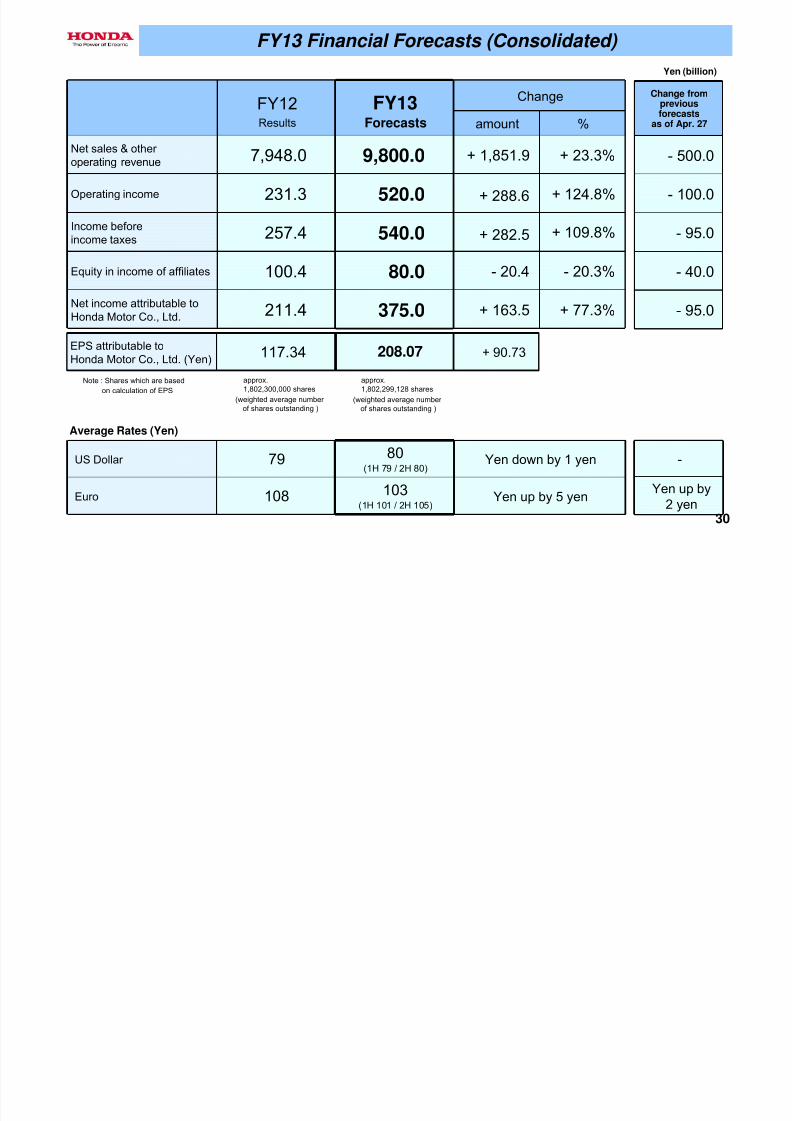
FY13 Financial Forecasts (Consolidated)
7/30/2019 12-09-12 Honda_results_Q2-1
http://slidepdf.com/reader/full/12-09-12-hondaresultsq2-1 30/37
30
FY12Results
FY13Forecasts
Change
amount %
Net sales & other operating revenue 7,948.0 9,800.0 + 1,851.9 + 23.3%
Operating income
231.3 520.0 + 288.6 + 124.8%Income beforeincome taxes 257.4 540.0 + 282.5 + 109.8%
Equity in income of affiliates 100.4 80.0 - 20.4 - 20.3%
Net income attributable toHonda Motor Co., Ltd. 211.4 375.0 + 163.5 + 77.3%
EPS attributable toHonda Motor Co., Ltd. (Yen)
117.34 208.07 + 90.73
US Dollar 79 80(1H 79 / 2H 80)
Yen down by 1 yen
Euro 108 103(1H 101 / 2H 105) Yen up by 5 yen
Change from
previousforecasts
as of Apr. 27
- 500.0
- 100.0
- 95.0
- 40.0
- 95.0
-
Yen up by2 yen
FY13 Financial Forecasts (Consolidated)
Yen (billion)
Note : Shares which are based
on calculation of EPS
approx.1,802,300,000 shares
(weighted average number of shares outstanding )
approx.1,802,299,128 shares
(weighted average number of shares outstanding )
Average Rates (Yen)
Forecast: Change in Income before Income Taxes
7/30/2019 12-09-12 Honda_results_Q2-1
http://slidepdf.com/reader/full/12-09-12-hondaresultsq2-1 31/37
31
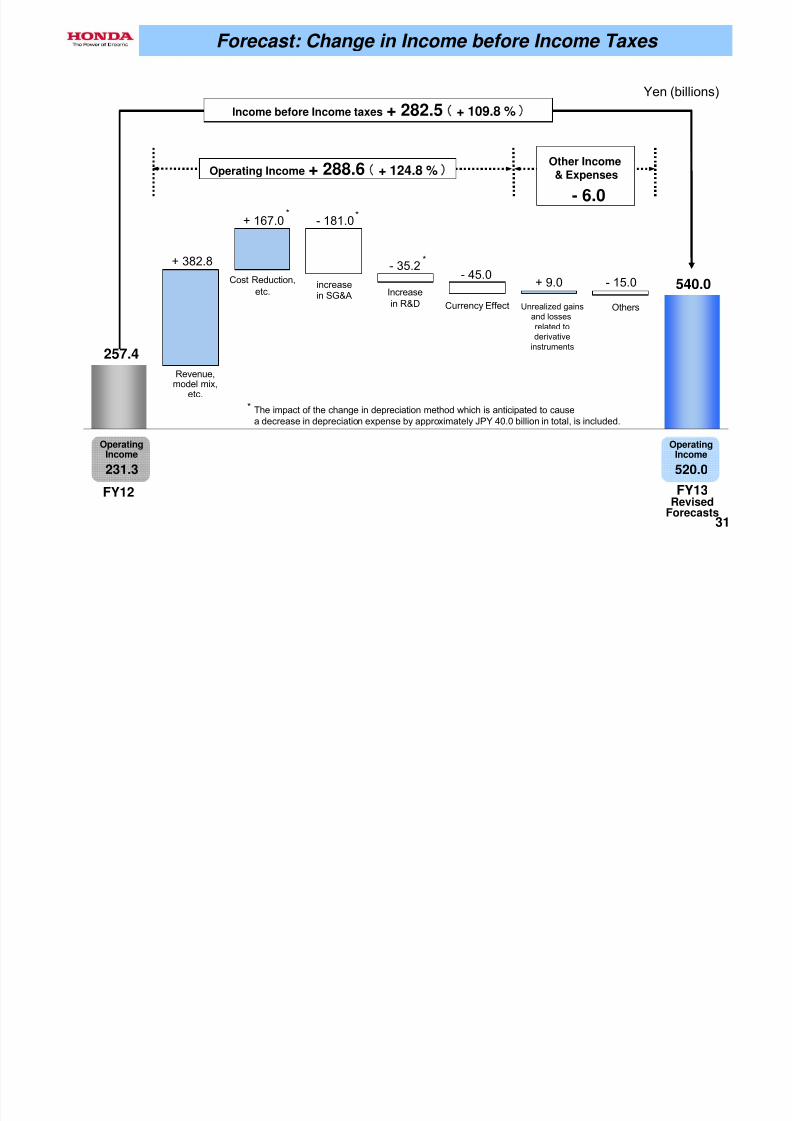
Income before Income taxes + 282.5 + 109.8 %
257.4
540.0
+ 382.8
+ 167.0 - 181.0
- 35.2- 45.0
+ 9.0 - 15.0
Operating Income + 288.6 + 124.8 %Other Income& Expenses
- 6.0* *
*
*
Forecast: Change in Income before Income Taxes
Yen (billions)
OperatingIncome
231.3
FY12 FY13RevisedForecasts
OperatingIncome
520.0
Revenue,model mix,
etc.
Cost Reduction,
etc.increase
in SG&A
Increase
in R&D Currency Effect Unrealized gainsand lossesrelated toderivative
instruments
Others
The impact of the change in depreciation method which is anticipated to causea decrease in depreciation expense by approximately JPY 40.0 billion in total, is included.
Forecast: Change in Income before Income Taxes
7/30/2019 12-09-12 Honda_results_Q2-1
http://slidepdf.com/reader/full/12-09-12-hondaresultsq2-1 32/37
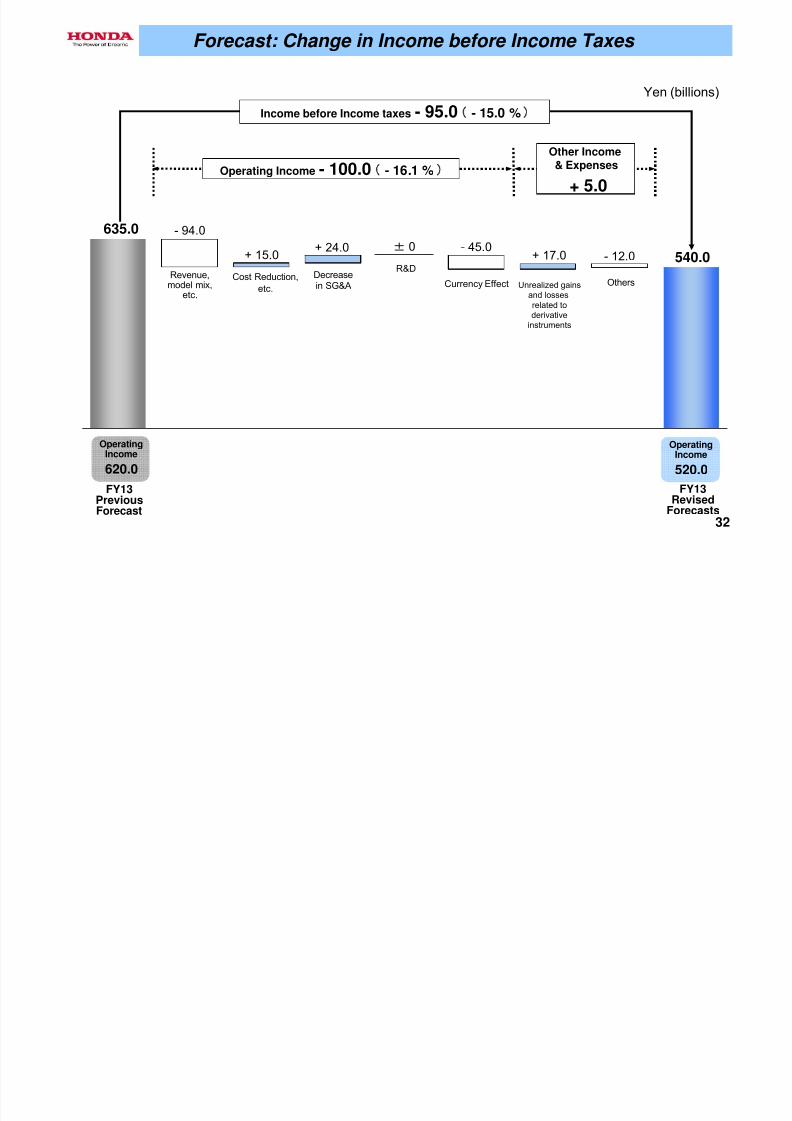
32
635.0
540.0
- 94.0
+ 15.0+ 24.0 ± 0 - 45.0
+ 17.0 - 12.0
Other Income& Expenses
+ 5.0
Income before Income taxes - 95.0 - 15.0 %
Forecast: Change in Income before Income Taxes
FY13PreviousForecast
FY13RevisedForecasts
OperatingIncome
620.0
OperatingIncome
520.0
Yen (billions)
Revenue,model mix,
etc.
Cost Reduction,
etc.
Decreasein SG&A
R&D
Currency Effect Unrealized gainsand lossesrelated toderivative
instruments
Others
Operating Income - 100.0 - 16.1 %
Forecast: Capital Expenditures Depreciation R&D Expenses
7/30/2019 12-09-12 Honda_results_Q2-1
http://slidepdf.com/reader/full/12-09-12-hondaresultsq2-1 33/37
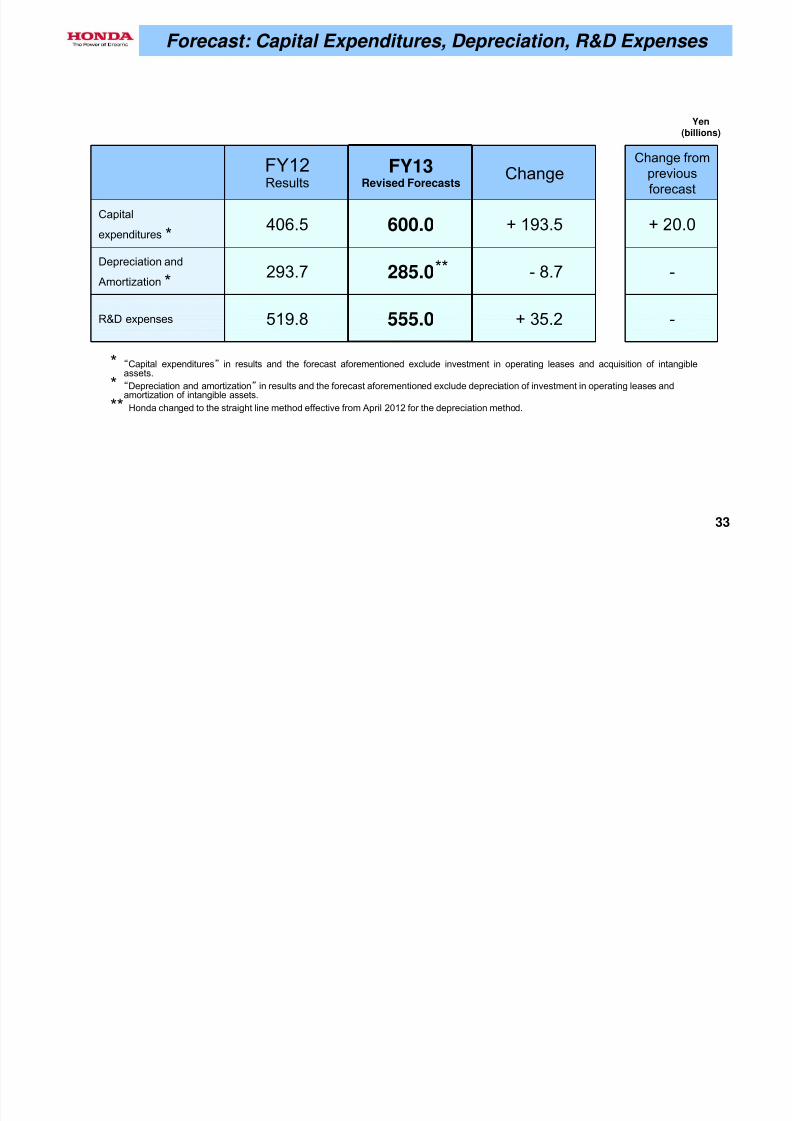
33
FY12Results
FY13Revised Forecasts
ChangeChange from
previousforecast
Capital
expenditures406.5 600.0 + 193.5 + 20.0
Depreciation and
Amortization293.7 285.0 - 8.7 -
R&D expenses 519.8 555.0 + 35.2 -
Forecast: Capital Expenditures, Depreciation, R&D Expenses
Yen(billions)
* “Capital expenditures” in results and the forecast aforementioned exclude investment in operating leases and acquisition of intangibleassets.
* “Depreciation and amortization” in results and the forecast aforementioned exclude depreciation of investment in operating leases and
amortization of intangible assets.** Honda changed to the straight line method effective from April 2012 for the depreciation method.
*
***
Caution with Respect to Forward-Looking Statements:
7/30/2019 12-09-12 Honda_results_Q2-1
http://slidepdf.com/reader/full/12-09-12-hondaresultsq2-1 34/37
34
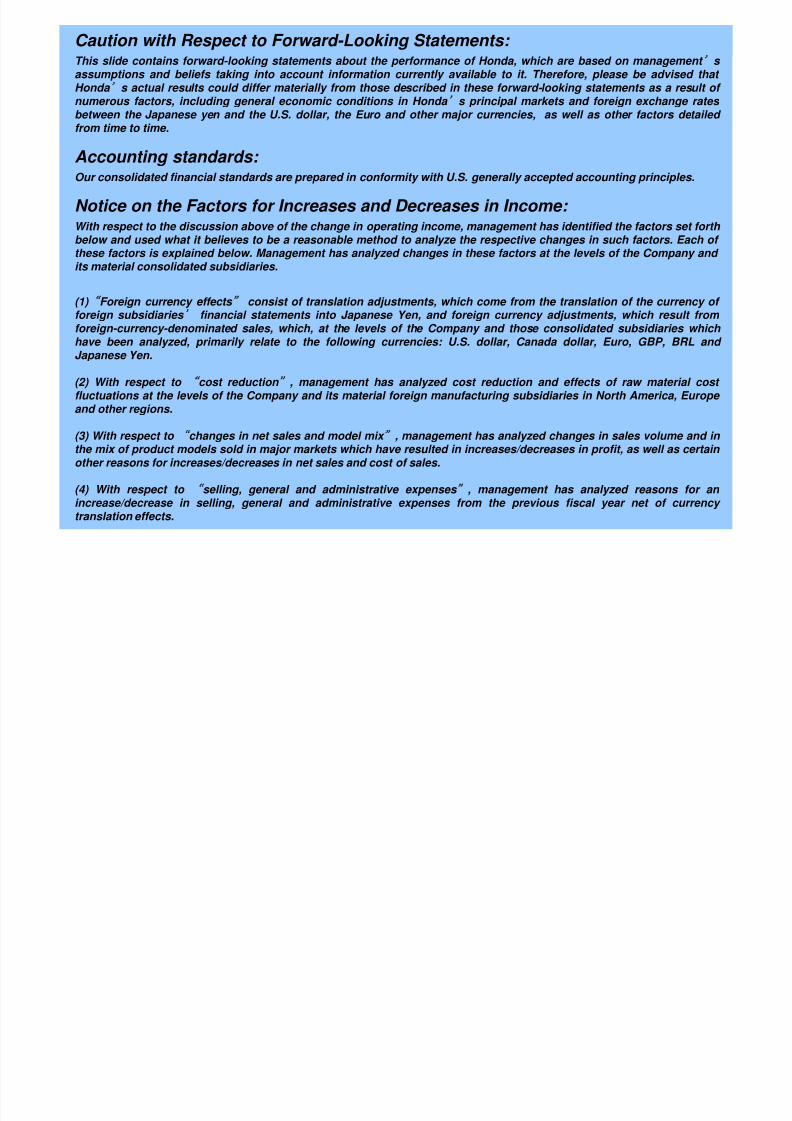
Caution with Respect to Forward Looking Statements: This slide contains forward-looking statements about the performance of Honda, which are based on management s assumptions and beliefs taking into account information currently available to it. Therefore, please be advised that Honda s actual results could differ materially from those described in these forward-looking statements as a result of
numerous factors, including general economic conditions in Honda s principal markets and foreign exchange rates between the Japanese yen and the U.S. dollar, the Euro and other major currencies, as well as other factors detailed from time to time.
Accounting standards: Our consolidated financial standards are prepared in conformity with U.S. generally accepted accounting principles.
Notice on the Factors for Increases and Decreases in Income: With respect to the discussion above of the change in operating income, management has identified the factors set forth below and used what it believes to be a reasonable method to analyze the respective changes in such factors. Each of these factors is explained below. Management has analyzed changes in these factors at the levels of the Company and its material consolidated subsidiaries.
(1) Foreign currency effects consist of translation adjustments, which come from the translation of the currency of foreign subsidiaries financial statements into Japanese Yen, and foreign currency adjustments, which result from foreign-currency-denominated sales, which, at the levels of the Company and those consolidated subsidiaries which have been analyzed, primarily relate to the following currencies: U.S. dollar, Canada dollar, Euro, GBP, BRL and Japanese Yen.
(2) With respect to cost reduction , management has analyzed cost reduction and effects of raw material cost
fluctuations at the levels of the Company and its material foreign manufacturing subsidiaries in North America, Europe and other regions.
(3) With respect to changes in net sales and model mix , management has analyzed changes in sales volume and in the mix of product models sold in major markets which have resulted in increases/decreases in profit, as well as certain
other reasons for increases/decreases in net sales and cost of sales.
(4) With respect to selling, general and administrative expenses , management has analyzed reasons for an increase/decrease in selling, general and administrative expenses from the previous fiscal year net of currency translation effects.
-Currency Effects- (effects associated with sales transactions and translation effects)
(Exhibit 1)
7/30/2019 12-09-12 Honda_results_Q2-1
http://slidepdf.com/reader/full/12-09-12-hondaresultsq2-1 35/37
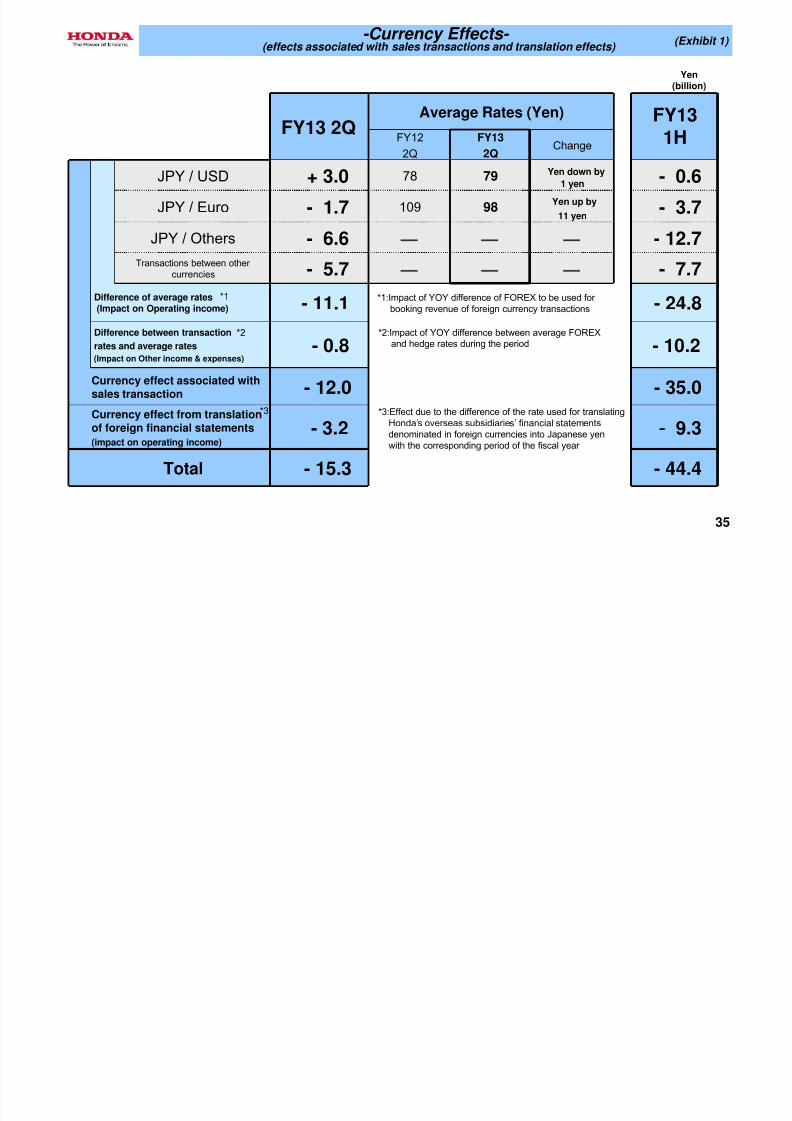
35
FY13 2QAverage Rates (Yen) FY13
1HFY12
2Q
FY13
2QChange
JPY / USD + 3.0 78 79 Yen down by
1 yen - 0.6
JPY / Euro - 1.7 109 98 Yen up by11 yen - 3.7
JPY / Others - 6.6 - 12.7Transactions between other
currencies - 5.7 - 7.7
Difference of average rates(Impact on Operating income) - 11.1 - 24.8Difference between transaction
rates and average rates
(Impact on Other income & expenses)- 0.8 - 10.2
Currency effect associated with
sales transaction- 12.0 - 35.0
Currency effect from translationof foreign financial statements
(impact on operating income)- 3.2 - 9.3
Total - 15.3 - 44.4
*1
*2
*3
(effects associated with sales transactions and translation effects) ( )
Yen(billion)
*1:Impact of YOY difference of FOREX to be used for booking revenue of foreign currency transactions
*2:Impact of YOY difference between average FOREXand hedge rates during the period
*3:Effect due to the difference of the rate used for translatingHonda’s overseas subsidiaries’ financial statementsdenominated in foreign currencies into Japanese yenwith the corresponding period of the fiscal year
- Unrealized Gains and Losses Related to Derivative Instruments - (Exhibit 2)
7/30/2019 12-09-12 Honda_results_Q2-1
http://slidepdf.com/reader/full/12-09-12-hondaresultsq2-1 36/37
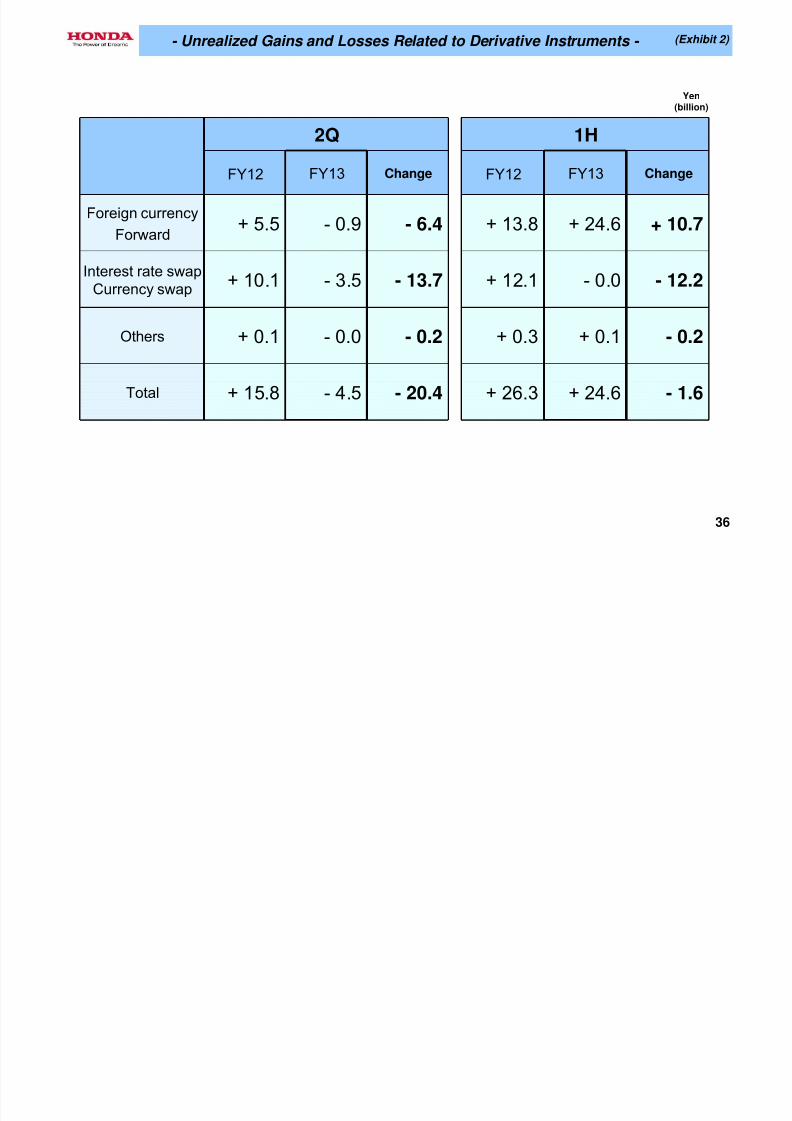
36
2Q 1H
FY12 FY13 Change FY12 FY13 Change
Foreign currency
Forward+ 5.5 - 0.9 - 6.4 + 13.8 + 24.6 + 10.7
Interest rate swapCurrency swap
+ 10.1 - 3.5 - 13.7 + 12.1 - 0.0 - 12.2
Others + 0.1 - 0.0 - 0.2 + 0.3 + 0.1 - 0.2
Total + 15.8 - 4.5 - 20.4 + 26.3 + 24.6 - 1.6
Yen
(billion)

7/30/2019 12-09-12 Honda_results_Q2-1
http://slidepdf.com/reader/full/12-09-12-hondaresultsq2-1 37/37
37