11.The Response of Haricot Bean to Phosphorus Application on Ultisols at Areka, Southern Ethiopia
13
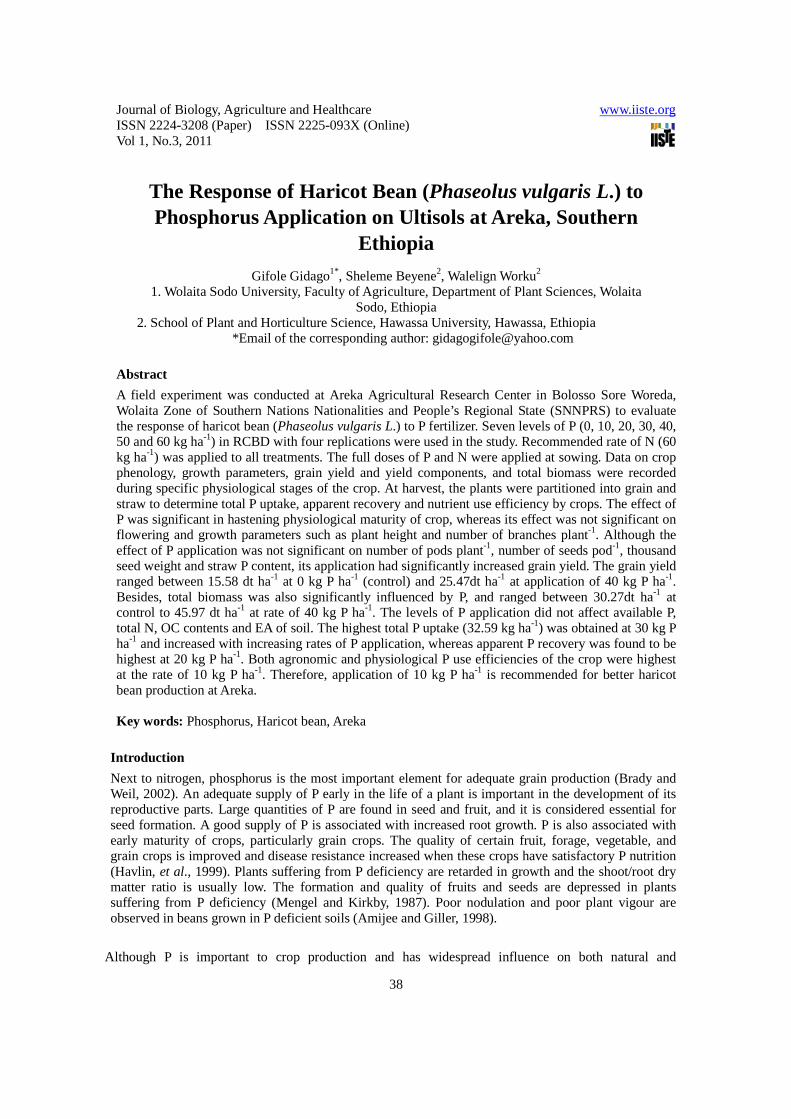
Journal of Biology, Agriculture and Healthcare www.iiste.org ISSN 2224-3208 (Paper) ISSN 2225-093X (Online) Vol 1, No.3, 2011 38 The Response of Haricot Bean (Phaseolus vulgaris L.) to Phosphorus Application on Ultisols at Areka, Southern Ethiopia Gifole Gidago 1* , Sheleme Beyene 2 , Walelign Worku 2 1. Wolaita Sodo University, Faculty of Agriculture, Department of Plant Sciences, Wolaita Sodo, Ethiopia 2. School of Plant and Horticulture Science, Hawassa University, Hawassa, Ethiopia *Email of the corresponding author: [email protected] Abstract A field experiment was conducted at Areka Agricultural Research Center in Bolosso Sore Woreda, Wolaita Zone of Southern Nations Nationalities and People’s Regional State (SNNPRS) to evaluate the response of haricot bean (Phaseolus vulgaris L.) to P fertilizer. Seven levels of P (0, 10, 20, 30, 40, 50 and 60 kg ha -1 ) in RCBD with four replications were used in the study. Recommended rate of N (60 kg ha -1 ) was applied to all treatments. The full doses of P and N were applied at sowing. Data on crop phenology, growth parameters, grain yield and yield components, and total biomass were recorded during specific physiological stages of the crop. At harvest, the plants were partitioned into grain and straw to determine total P uptake, apparent recovery and nutrient use efficiency by crops. The effect of P was significant in hastening physiological maturity of crop, whereas its effect was not significant on flowering and growth parameters such as plant height and number of branches plant -1 . Although the effect of P application was not significant on number of pods plant -1 , number of seeds pod -1 , thousand seed weight and straw P content, its application had significantly increased grain yield. The grain yield ranged between 15.58 dt ha -1 at 0 kg P ha -1 (control) and 25.47dt ha -1 at application of 40 kg P ha -1 . Besides, total biomass was also significantly influenced by P, and ranged between 30.27dt ha -1 at control to 45.97 dt ha -1 at rate of 40 kg P ha -1 . The levels of P application did not affect available P, total N, OC contents and EA of soil. The highest total P uptake (32.59 kg ha -1 ) was obtained at 30 kg P ha -1 and increased with increasing rates of P application, whereas apparent P recovery was found to be highest at 20 kg P ha -1 . Both agronomic and physiological P use efficiencies of the crop were highest at the rate of 10 kg P ha -1 . Therefore, application of 10 kg P ha -1 is recommended for better haricot bean production at Areka. Key words: Phosphorus, Haricot bean, Areka Introduction Next to nitrogen, phosphorus is the most important element for adequate grain production (Brady and Weil, 2002). An adequate supply of P early in the life of a plant is important in the development of its reproductive parts. Large quantities of P are found in seed and fruit, and it is considered essential for seed formation. A good supply of P is associated with increased root growth. P is also associated with early maturity of crops, particularly grain crops. The quality of certain fruit, forage, vegetable, and grain crops is improved and disease resistance increased when these crops have satisfactory P nutrition (Havlin, et al., 1999). Plants suffering from P deficiency are retarded in growth and the shoot/root dry matter ratio is usually low. The formation and quality of fruits and seeds are depressed in plants suffering from P deficiency (Mengel and Kirkby, 1987). Poor nodulation and poor plant vigour are observed in beans grown in P deficient soils (Amijee and Giller, 1998). Although P is important to crop production and has widespread influence on both natural and
-
Upload
alexander-decker -
Category
Documents
-
view
223 -
download
0
description
Although P is important to crop production and has widespread influence on both natural and Key words: Phosphorus, Haricot bean, Areka Journal of Biology, Agriculture and Healthcare 38 Journal of Biology, Agriculture and Healthcare 39 Agronomic Data Collection and Sampling Treatments and the Experimental Design Wolaita and Sidamo areas (Tenaw and Yeshi, 1990). Journal of Biology, Agriculture and Healthcare 40
Transcript of 11.The Response of Haricot Bean to Phosphorus Application on Ultisols at Areka, Southern Ethiopia
Journal of Biology, Agriculture and Healthcare www.iiste.org ISSN 2224-3208 (Paper) ISSN 2225-093X (Online) Vol 1, No.3, 2011
38
The Response of Haricot Bean (Phaseolus vulgaris L.) to Phosphorus Application on Ultisols at Areka, Southern
Ethiopia
Gifole Gidago1*, Sheleme Beyene2, Walelign Worku2 1. Wolaita Sodo University, Faculty of Agriculture, Department of Plant Sciences, Wolaita
Sodo, Ethiopia 2. School of Plant and Horticulture Science, Hawassa University, Hawassa, Ethiopia *Email of the corresponding author: [email protected]
Abstract
A field experiment was conducted at Areka Agricultural Research Center in Bolosso Sore Woreda, Wolaita Zone of Southern Nations Nationalities and People’s Regional State (SNNPRS) to evaluate the response of haricot bean (Phaseolus vulgaris L.) to P fertilizer. Seven levels of P (0, 10, 20, 30, 40, 50 and 60 kg ha-1) in RCBD with four replications were used in the study. Recommended rate of N (60 kg ha-1) was applied to all treatments. The full doses of P and N were applied at sowing. Data on crop phenology, growth parameters, grain yield and yield components, and total biomass were recorded during specific physiological stages of the crop. At harvest, the plants were partitioned into grain and straw to determine total P uptake, apparent recovery and nutrient use efficiency by crops. The effect of P was significant in hastening physiological maturity of crop, whereas its effect was not significant on flowering and growth parameters such as plant height and number of branches plant-1. Although the effect of P application was not significant on number of pods plant-1, number of seeds pod-1, thousand seed weight and straw P content, its application had significantly increased grain yield. The grain yield ranged between 15.58 dt ha-1 at 0 kg P ha-1 (control) and 25.47dt ha-1 at application of 40 kg P ha-1. Besides, total biomass was also significantly influenced by P, and ranged between 30.27dt ha-1 at control to 45.97 dt ha-1 at rate of 40 kg P ha-1. The levels of P application did not affect available P, total N, OC contents and EA of soil. The highest total P uptake (32.59 kg ha-1) was obtained at 30 kg P ha-1 and increased with increasing rates of P application, whereas apparent P recovery was found to be highest at 20 kg P ha-1. Both agronomic and physiological P use efficiencies of the crop were highest at the rate of 10 kg P ha-1. Therefore, application of 10 kg P ha-1 is recommended for better haricot bean production at Areka. Key words: Phosphorus, Haricot bean, Areka
Introduction
Next to nitrogen, phosphorus is the most important element for adequate grain production (Brady and Weil, 2002). An adequate supply of P early in the life of a plant is important in the development of its reproductive parts. Large quantities of P are found in seed and fruit, and it is considered essential for seed formation. A good supply of P is associated with increased root growth. P is also associated with early maturity of crops, particularly grain crops. The quality of certain fruit, forage, vegetable, and grain crops is improved and disease resistance increased when these crops have satisfactory P nutrition (Havlin, et al., 1999). Plants suffering from P deficiency are retarded in growth and the shoot/root dry matter ratio is usually low. The formation and quality of fruits and seeds are depressed in plants suffering from P deficiency (Mengel and Kirkby, 1987). Poor nodulation and poor plant vigour are observed in beans grown in P deficient soils (Amijee and Giller, 1998).
Although P is important to crop production and has widespread influence on both natural and
Journal of Biology, Agriculture and Healthcare www.iiste.org ISSN 2224-3208 (Paper) ISSN 2225-093X (Online) Vol 1, No.3, 2011
39
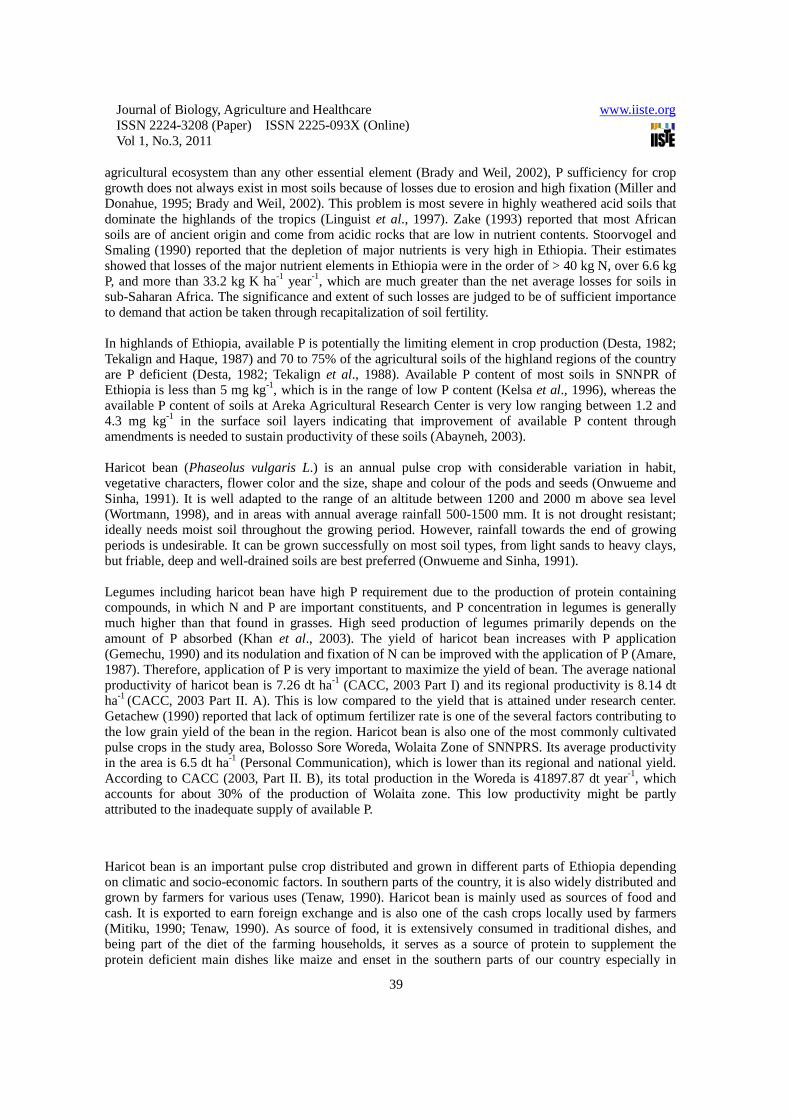
agricultural ecosystem than any other essential element (Brady and Weil, 2002), P sufficiency for crop growth does not always exist in most soils because of losses due to erosion and high fixation (Miller and Donahue, 1995; Brady and Weil, 2002). This problem is most severe in highly weathered acid soils that dominate the highlands of the tropics (Linguist et al., 1997). Zake (1993) reported that most African soils are of ancient origin and come from acidic rocks that are low in nutrient contents. Stoorvogel and Smaling (1990) reported that the depletion of major nutrients is very high in Ethiopia. Their estimates showed that losses of the major nutrient elements in Ethiopia were in the order of > 40 kg N, over 6.6 kg P, and more than 33.2 kg K ha-1 year-1, which are much greater than the net average losses for soils in sub-Saharan Africa. The significance and extent of such losses are judged to be of sufficient importance to demand that action be taken through recapitalization of soil fertility.
In highlands of Ethiopia, available P is potentially the limiting element in crop production (Desta, 1982; Tekalign and Haque, 1987) and 70 to 75% of the agricultural soils of the highland regions of the country are P deficient (Desta, 1982; Tekalign et al., 1988). Available P content of most soils in SNNPR of Ethiopia is less than 5 mg kg-1, which is in the range of low P content (Kelsa et al., 1996), whereas the available P content of soils at Areka Agricultural Research Center is very low ranging between 1.2 and 4.3 mg kg-1 in the surface soil layers indicating that improvement of available P content through amendments is needed to sustain productivity of these soils (Abayneh, 2003).
Haricot bean (Phaseolus vulgaris L.) is an annual pulse crop with considerable variation in habit, vegetative characters, flower color and the size, shape and colour of the pods and seeds (Onwueme and Sinha, 1991). It is well adapted to the range of an altitude between 1200 and 2000 m above sea level (Wortmann, 1998), and in areas with annual average rainfall 500-1500 mm. It is not drought resistant; ideally needs moist soil throughout the growing period. However, rainfall towards the end of growing periods is undesirable. It can be grown successfully on most soil types, from light sands to heavy clays, but friable, deep and well-drained soils are best preferred (Onwueme and Sinha, 1991).
Legumes including haricot bean have high P requirement due to the production of protein containing compounds, in which N and P are important constituents, and P concentration in legumes is generally much higher than that found in grasses. High seed production of legumes primarily depends on the amount of P absorbed (Khan et al., 2003). The yield of haricot bean increases with P application (Gemechu, 1990) and its nodulation and fixation of N can be improved with the application of P (Amare, 1987). Therefore, application of P is very important to maximize the yield of bean. The average national productivity of haricot bean is 7.26 dt ha-1 (CACC, 2003 Part I) and its regional productivity is 8.14 dt ha-1 (CACC, 2003 Part II. A). This is low compared to the yield that is attained under research center. Getachew (1990) reported that lack of optimum fertilizer rate is one of the several factors contributing to the low grain yield of the bean in the region. Haricot bean is also one of the most commonly cultivated pulse crops in the study area, Bolosso Sore Woreda, Wolaita Zone of SNNPRS. Its average productivity in the area is 6.5 dt ha-1 (Personal Communication), which is lower than its regional and national yield. According to CACC (2003, Part II. B), its total production in the Woreda is 41897.87 dt year-1, which accounts for about 30% of the production of Wolaita zone. This low productivity might be partly attributed to the inadequate supply of available P.
Haricot bean is an important pulse crop distributed and grown in different parts of Ethiopia depending on climatic and socio-economic factors. In southern parts of the country, it is also widely distributed and grown by farmers for various uses (Tenaw, 1990). Haricot bean is mainly used as sources of food and cash. It is exported to earn foreign exchange and is also one of the cash crops locally used by farmers (Mitiku, 1990; Tenaw, 1990). As source of food, it is extensively consumed in traditional dishes, and being part of the diet of the farming households, it serves as a source of protein to supplement the protein deficient main dishes like maize and enset in the southern parts of our country especially in
Journal of Biology, Agriculture and Healthcare www.iiste.org ISSN 2224-3208 (Paper) ISSN 2225-093X (Online) Vol 1, No.3, 2011
40
Wolaita and Sidamo areas (Tenaw and Yeshi, 1990).
Besides, the farmers also grow the bean to use the straw as forage for livestock, source of fuel, mulching, bedding, and covering material for houses of poor farmers. Despite all these advantages, little effort was made to improve its productivity and the yield is comparatively low because of depletion of nutrients as a result of erosion and crop mining, lack of optimum fertilizer rate, etc. One of the solutions to alleviate the problem could be applying P fertilizers from external sources based on recommended rate for the crop. In order to make site-specific recommendation of P for haricot bean production, nutrient rate experiment is needed. Therefore, this study was initiated with the objective to evaluate the response of haricot bean to increasing levels of P application and effect of P application on soil chemical properties.
Materials and methods
Description of the Study Area
The study was conducted at Areka Agricultural Research Center, which is located in Southern Nations Nationalities and People’s Regional State (SNNPRS), Wolaita zone. It is found at 410 km south of Addis Ababa and 3 km from Areka town, at 7°04.196’N and 37°41.330’ E and altitude of 1790 meters above sea level (masl). The soil of the center is formed from pyroclastic rocks, and is clayey in texture (Abayneh, 2003). The mean annual rainfall is 1460 with a bimodal pattern, which extends from March to September. The peak rainy months are April, July, August and September. The mean minimum and maximum temperatures are 15 oC and 26 °C, respectively. November and December were the coldest months, whereas February was the hottest. Treatments and the Experimental Design
Seven levels of phosphorus were used to evaluate the response of haricot bean (Phaseolus vulgaris L.) variety Red Wolaita to increasing P supply. The levels used were 0, 10, 20, 30, 40, 50, and 60 kg P ha-1. The experiment was laid out in RCBD with four replications. Eight rows, each having 40 plants, were used on 3.2 m by 4 m plot. A distance of 1 m and 1.5 m were left between plots and blocks, respectively. Spacing of 40 cm and 10 cm were used between rows and plants, respectively. Diammonium phosphate was used as source of P and all doses were applied as side banding at sowing time. Urea was used to make a uniform 60 kg N ha-1 application on every plot. All cultural practices such as weeding, hoeing, etc., were kept uniform for all treatments.
Agronomic Data Collection and Sampling
Flowering and maturity dates (when 50% of the plants were at respective phenological stage), number of branches per plant, plant height, number of pods per plant and number of seeds per pod were recorded. Six central rows were harvested for determination of grain yield and total biomass. Grain yield was adjusted to 10% moisture content. Finally, harvest index was calculated as the ratio of grain yield to total biomass, and 1000 seed weight was determined using sensitive electronic balance. At harvest, the total biomass from every plot was sampled and partitioned into straw and grain. These were properly cleaned and placed in an oven at 65 oC until constant weight was obtained. The oven-dried samples were ground to pass 200 mesh for determination of P contents. Forty samples were randomly collected from surface layer (0 to 30 cm depth) just before sowing and composited. At the time of harvesting, 72 random samples were also collected from surface layer of every plot and a composite per treatment was made using formula indicated for band applied fertilizers by Havlin et al. (1999) as:
S= 8 (row spacing)/30, where: S stands for the ratio of off-band to on-band samples.
Journal of Biology, Agriculture and Healthcare www.iiste.org ISSN 2224-3208 (Paper) ISSN 2225-093X (Online) Vol 1, No.3, 2011
41
Laboratory Analyses
The soil samples were air-dried and ground to pass 2 and 0.5 mm (for total N) sieves. All samples were analyzed following standard laboratory procedures as outlined by Sahlemedhin and Taye (2000). Organic carbon and total N contents of the soil were determined following the wet combustion method of Walkley and Black, and wet digestion procedure of Kjeldahl method, respectively. The available P content of the soil was determined following Bray II method. Soil texture was analyzed by Bouyoucos hydrometer method. The cations exchange capacity (CEC) of the soil was determined following the 1N ammonium acetate (pH 7) method. Ca and Mg contents were measured by using EDTA titration, whereas the exchangeable K and Na in the extract were measured by flame photometer. The pH (1:2.5 solid: liquid ratio) of the soils was measured in water using pH meter with glass-calomel combination electrode. Exchangeable acidity of the soil was determined by leaching exchangeable hydrogen and aluminum ions from the soil samples by 1N KCl solution. Determination of the P content of the straw and grain yield was carried out on the digest aliquote obtained through digestion. P in the solution was determined colorimetrically by using molybdate and metavanadate for color development. Finally, reading was made at 460 nm.
Statistical Analysis and Phosphorus Uptake and Efficiency
The data obtained from soil and crop, were statistically analyzed using the PROC ANOVA function of SAS and means were compared using LSD at a probability level of 5%. Total P uptake in grain and straw were calculated by multiplying P content with respective straw and grain yield ha-1. Total P uptake of the biomass was calculated by summing up the P uptake by grain and straw. Apparent P recovery, agronomic and physiological P efficiencies were calculated using procedures described by Craswell and Godwin (1984) as: [(Un-U0/n)] X 100 for apparent P fertilizer recovery, (Gn-G0)/n for agronomic efficiency and (Gn-G0)/Un-U0) for physiological efficiency, where:
Un stands for P uptake at ‘n’ rate of P fertilizer, U0 stands for P uptake at control (zero P level), Gn and G0 stand for grain yield fertilized at ‘n’ rates of fertilizer and control,
respectively.
Results and Discussion
Response of Haricot Bean to Phosphorus Application
Crop phenology and growth parameters
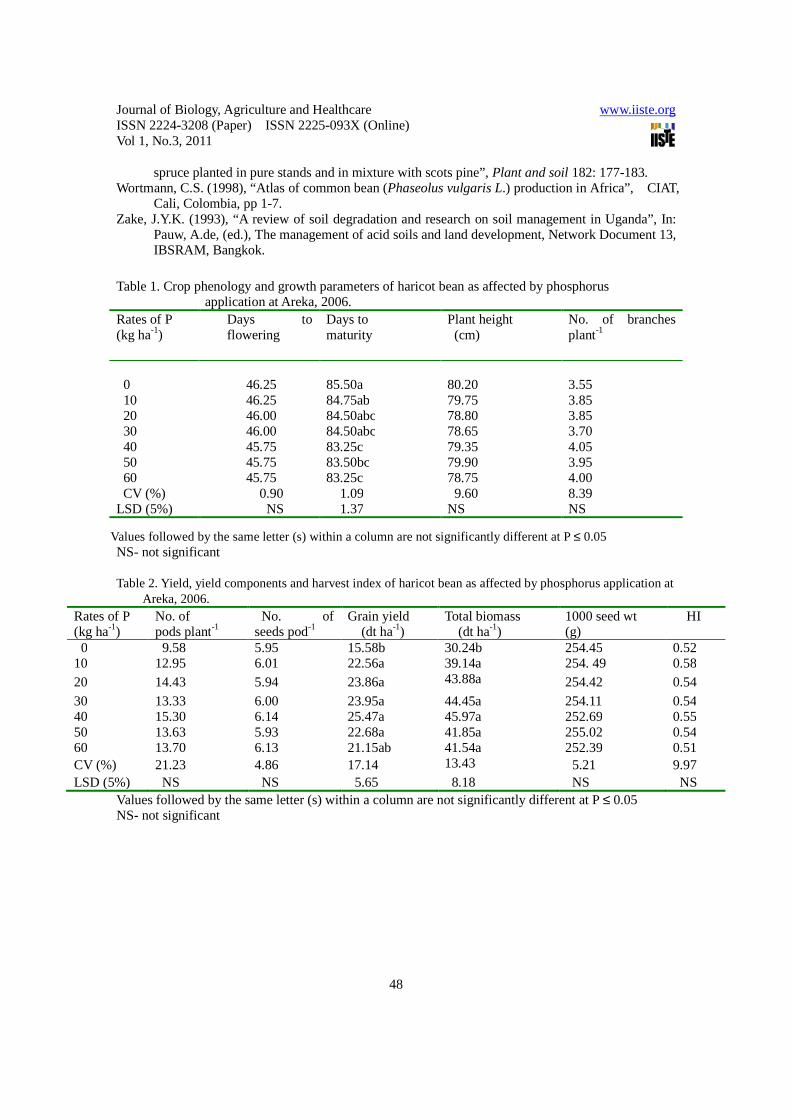
The level of P supply has significantly influenced days to physiological maturity. Phosphorus application at 40, 50 and 60 kg P ha-1 has significantly reduced days to physiological maturity as compared to the control (Table 1). Although statistically insignificant, the other treatments (10, 20 and 30 kg P ha-1) have also slightly reduced the days to physiological maturity as compared to the control. Hastening crop maturity due to increasing P supply was also reported by Brady and Weil (2002). Havlin et al. (1999) also indicated that ample phosphorus nutrition could reduce the time required for grain ripening. Similarly, Marschner (2002) reported that P could reduce the days to physiological maturity by controlling some key enzyme reactions that involve in hastening crop maturity. Simple correlation results indicated that physiological maturity was highly correlated with pH (r= 0.55**). Possible reason for this might be that as pH of the soil increased, P availability will be improved which in turn could reduce the days to physiological maturity.
Although P application has slightly reduced the days to 50% flowering (Table 1), the effect was not
Journal of Biology, Agriculture and Healthcare www.iiste.org ISSN 2224-3208 (Paper) ISSN 2225-093X (Online) Vol 1, No.3, 2011
42
statistically significant. Similar results were also reported by Birhan (2006) and Meseret (2006) on haricot bean and mung bean, respectively. Days to flowering were highly correlated with pH (r= 0.50**). Similar reason can also be suggested as in physiological maturity. Negative correlation (r= -0.44*) was obtained between days to flowering and OC content. This might be due to mineralization of organic matter during the growing period that releases N which could cause delay in flowering date (Havlin et al., 1999).
Phosphorus application did not significantly affect plant height and number of branches plant-1. A slight decrease was, however, observed in plant height with increasing levels of P, while number of branches plant-1 showed increasing trend (Table 1). These results are similar to that of Birhan (2006) who reported a non-significant response of plant height to P application on haricot bean. Meseret (2006) also reported that P application did not significantly influence plant height and number of branches on mung bean. From growth parameters, number of branches plant-1 was significantly correlated with available P (r= 0.43*), while plant height was highly correlated with number of branches plant-1 (r= 0.48**). This indicates that application of P is important for growth and development of growth parameters and improvement of one growth parameter may support the other. On the other hand, plant height was negatively correlated with exchangeable acidity (r= -0.51**), indicating that presence of exchangeable acidity can negatively affect the growth of crops through fixation of P and thereby decreasing its availability.
Grain yield and yield components
Application of P has significantly affected the grain yield of the bean. Phosphorus application at all rates except at 60 kg P ha-1, resulted in significantly higher grain yield than the control (Table 2). The highest yield (25.47 dt ha-1) was obtained from the application of 40 kg P ha-1, whereas the lowest yield (15.58 dt ha-1) was obtained from the control. This result is in agreement with that of Birhan (2006) who reported a significant yield response of haricot bean to application of P at Melkassa because of P deficiency in the area. To the contrary, Meseret (2006) reported a non-significant yield response of mung bean at Awassa Agricultural Research Center as result of high content of available P. The result of regression analysis indicated that there was a significant quadratic relationship between P application and grain yield, and the yield increased with increasing levels of P up to the rate of 35 kg ha-1 and then declined afterwards. This tendency of yield decrease might be attributed to imbalance of P with other nutrients, especially with N (Havlin et al., 1999; Mengel and Kirkby, 1987). Simple correlation results revealed that grain yield was highly correlated with available P (r= 0.52**), number of pods plant-1 (r=0.55**), total biomass (r= 0.90***) and HI (r= 0.63***). These results suggest that P is a very important nutrient element for crop production, and as result of this, its availability in soil is very important to improve grain yield, which is directly related with amount of total biomass and number of pods plant-1. Havlin et al. (1999) indicated that large quantities of P are found in seed and P is considered to be essential for seed formation. The result of the present work has also shown a significant correlation between grain yield and seed P (r= 0.39*). To the contrary, there was a negative correlation (r= -0.44*) between grain yield and exchangeable acidity, which implies that the exchangeable acidity can reduce the content of available P through fixation.
Unlike its effect on grain yield, the effect of P on the number of pods plant-1 was not significant. However, all rates of applied P produced higher number of pods plant-1 than that of the control, though the increment was statistically non-significant (Table 2). The highest (15.30) and the lowest (9.58) number of pods plant-1 were obtained at the rates of 40 and 0 kg P ha-1, respectively, and these were also the rates at which the highest and the lowest grain yield were obtained. The number of pods plant-1 was highly correlated with available P (r= 0.51**) and seed P (r= 0.40*). These results are in agreement with that of van Schoonhoven and Voysest (1991) and Hajeal et al. (1994) who reported that the increase in production through fertilization in P deficient zones is due to the increase in number of pods plant-1, and
Journal of Biology, Agriculture and Healthcare www.iiste.org ISSN 2224-3208 (Paper) ISSN 2225-093X (Online) Vol 1, No.3, 2011
43
hence pods plant-1 was positively correlated with available P.
Similarly, application of P did not significantly influence yield components such as number of seeds pod-1 and thousand seed weight. Except 20 and 50 kg P ha-1, however, all rates of applied P resulted in higher number of seeds pod-1 (Table 2). In line with this, Meseret (2006) and Birhan (2006) reported non-significant results on mung bean and haricot bean, respectively. On the other hand, correlation result indicated that thousand seed weight was negatively correlated with straw P (r= -0.56**). Possible reason for this might be that the main storage area of P is seed as suggested in grain yield.
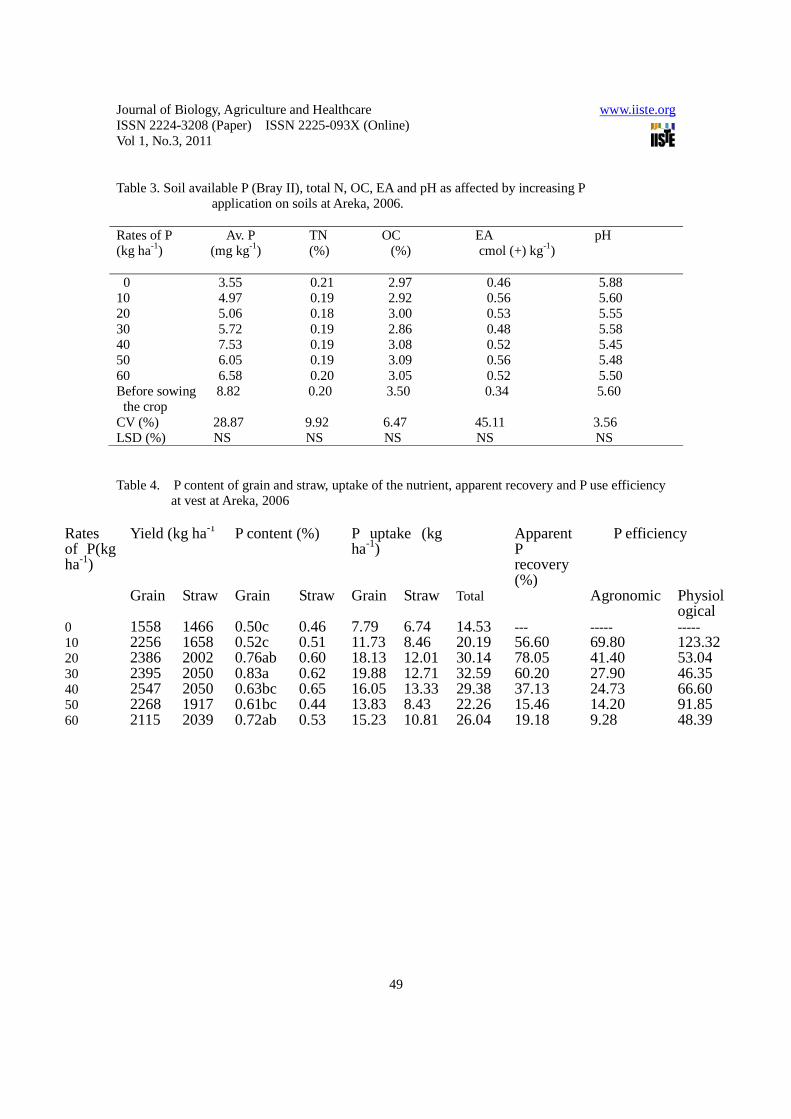
Total biomass and harvest index Application of P significantly affected total biomass of haricot bean. All treatments resulted in significantly higher total biomass over the control (Table 2). The highest total biomass (45.97 dt ha-1) was recorded from the treatment with application of 40 kg P ha-1 followed by 44.45, 43.88, 41.85, 41.54 and 39.14 dt ha-1, which were recorded from treatments with application of 30, 20, 50, 60 and 10 kg P ha-1, respectively. The increment in total biomass followed similar trend with that of grain yield. Generally, it declined after application of 35 kg P ha-1, which might also be attributed to imbalance of P with other nutrients, especially with N (Havlin et al., 1999; Mengel and Kirkby, 1987). Total biomass was highly correlated with available P (r= 0.49**), seed P (r= 0.48**), number of pods plant-1 (r= 0.67***) and number of branches plant-1 (r= 0.38*). These correlation results indicate that level of biomass production directly affects growth parameters, yield and yield components, which in turn are highly dependent on available P content of the soil. In line with this, van Schoonhoven and Voysest (1991) reported that biomass production of crops would be increased as P demand by crops increased. Biomass was negatively correlated (r= -0.52**) with exchangeable acidity, which may be due to the reduction of available P with rise in exchangeable acidity. On the other hand, P application did not significantly affect harvest index (HI). Meseret (2006) has also reported a non-significant response of harvest index to P application on mung bean, while Birhan (2006) reported a significant response of harvest index to the application of P on haricot bean. Although P application increased grain yield and similar effect was expected on HI, the latter did not increase due to simultaneous increase in straw yield. Effect of Phosphorus Application on Soil Chemical Properties Available phosphorus The available P content of the experimental soil was 8.82 mg kg-1 (Table 3) before sowing the crop, which is low according to the classification by Pushparajah (1997). Application of P fertilizer increased the available P content of the experimental soil over the control although the increment was not significant and consistent. The highest increment (3.98 mg kg-1) was resulted from the application of P at the rate 40 kg P ha-1, whereas the lowest increment (1.42 mg kg-1) was resulted from 10 kg P ha-1
application. The highest available P was also obtained from the application of P at the rate of 40 kg P ha-1, whereas the lowest was from the control (Table 3). This result is in agreement with that of Sheleme (1997) and Birhan (2006) who reported that addition of P fertilizer would increase the available P content of the soil. Similarly, Havlin et al. (1999) also reported that addition of P fertilizer would increase anion-exchangeable H2PO4
-. Besides, root exudation to rhizosphere can also increase nutrient availability by desorbing phosphate from surfaces of sesquioxides by anion exchange and increasing phosphate mobilization by chelating with Fe or Al phosphate or both (Mengel and Kirkby, 1987). Although the available P content of the experimental soil was supposed to be increased by P fertilization (Mengel and Kirkby, 1987; Havlin et al., 1999) and repeated wetting (Mishra et al., 2006), its content decreased during the growing period in all treatments (Table 3). The highest reduction of available P from the original value (8.82 mg kg-1) was 5.27 mg kg-1 in the control, whereas the lowest reduction of 1.29 mg kg-1 was obtained from the application of 40 kg P ha-1. Possible reasons for reduction might be crop
Journal of Biology, Agriculture and Healthcare www.iiste.org ISSN 2224-3208 (Paper) ISSN 2225-093X (Online) Vol 1, No.3, 2011
44
utilization, fixation and leaching of P. In line with this, Sheleme (1997) reported a reduction in available P after crop harvest due to crop utilization at Areka Agricultural Research Center. Brady and Weil (2002) indicated that P availability is maximum at pH ranges of 6 to 7, while below and above these, fixation occurs. Similarly, Havlin et al. (1999) also indicated that P availability is at a maximum near pH 6.5, whereas below and above pH 6.5, fixation occurs in most soils. On the other hand, Mengel and Kirkby (1987) reported that P could be removed by leaching from the upper soil layers and become unavailable although the rate of removal is low. Williams (1996) also indicated that large extractable and total P concentrations in summer coincided with drying of humus and root death and release. Total nitrogen The total nitrogen content of the soil was 0.2% (Table 3) at pre-plant, which could be classified as medium according to Pushparajah (1997). Application of P did not significantly influence total nitrogen content of the soil. It ranged from 0.18% at the rate of 20 kg P ha-1 to 0.21% at control (Table 3). A slight reduction was observed in all treatments except at 0 and 60 kg P ha-1 as compared to the original value (0.2%), which might be attributed to the relatively higher uptake by plants. As compared to the treatments with 0 and 60 kg P ha-1, all the others resulted in higher total biomass, which in turn resulted in lower concentration of N in soil after crop harvest, due to uptake. Organic carbon The organic carbon content of the experimental soil was 3.5% (Table 3) at pre-plant, which could be classified as high according to Herrera (2005). The organic carbon content was not significantly affected by increasing rates of P application. As indicated in Table 3, the organic carbon content of the soil ranged from 2.86% at the rate of 30 kg P ha-1 to 3.09% at 50 kg P ha-1. In all treatments, including the control, the organic carbon contents were reduced from the original value of 3.5% during the growing period. The highest reduction was 18.29%, whereas the lowest reduction was 11.71%. The decrease in organic carbon content during the growing period of the crop might be due to organic matter decomposition. Havlin et al. (1999) indicated that tillage of the soil produces greater aeration, thus stimulating more microbial activity, and increases the rate of disappearance of soil organic carbon. Soil pH and exchangeable acidity The pH and exchangeable acidity (EA) values of the experimental soil were 5.60 and 0.34, respectively (Table 3), before sowing the crop. Herrera (2005) classified soil pH as strongly acidic (3-5.6), moderately acidic (5.6-6.2), slightly acidic (6.2-6.7), neutral (6.7-7.3), slightly alkaline (7.3-7.9), moderately alkaline (7.9-8.5) and strongly alkaline (> 8.5). Based on this classification, the pH of the experimental soil was moderately acidic, which is satisfactory for growth of most crops (Havlin et al., 1999). Increasing levels of P supply did not significantly influence the pH and exchangeable acidity of the soil. Compared to the original value, slight reductions in soil pH were detected in all treatments except, in control and 10 kg P ha-1 plots (Table 3). The slight decrease found from the present experiment could be attributed to release of H+ in the process of nutrient uptake. Correlation results indicated that soil pH was significantly correlated with total nitrogen (r= 0.39*). The exchangeable acidity of the soil ranged between 0.46 cmol (+) kg-1 in the control and 0.56 cmol (+) kg-1 in the treatment with application of 10 and 50 kg P ha-1 (Table 3). Although statistically not significant, all rates of applied P resulted in higher exchangeable acidity as compared to the control (Table 3). The highest exchangeable acidity was obtained from the rates of 10 and 50 kg P ha-1, whereas the lowest was obtained from the control. The exchangeable acidity was increased from the original value in all treatments including the control. This increment could be attributed to exchangeable hydrogen (H+), which might have been released from roots, decomposition of organic matter, and microbial and root
Journal of Biology, Agriculture and Healthcare www.iiste.org ISSN 2224-3208 (Paper) ISSN 2225-093X (Online) Vol 1, No.3, 2011
45
respiration as was also suggested by Havlin et al. (1999). The authors indicated that decomposition of organic matter and root respiration increase CO2 in the soil air, which combines with water to produce H+. Phosphorus Uptake and Efficiency Application of P fertilizer highly significantly influenced the concentration of P in seed. All rates of applied P resulted in higher seed P concentration than that of control although significant differences were observed only at rates of 20, 30 and 60 kg P ha-1. The concentration of grain P showed increasing trend with levels of applied P till 30 kg P ha-1 and declined afterwards (Table 4). The highest P content of the grain (0.83%) was obtained from the treatment with application of 30 kg P ha-1, whereas the lowest P content (0.50%) was obtained from the control. Seed P was negatively correlated with total N (r= -0.36*), which might be due to the negative effect of high N levels. Similarly, it was negatively correlated with exchangeable acidity (r= -0.38**), showing with increment in exchangeable acidity values available P level would decline due to fixation and resulting in low P concentration in seed. Unlike its effect on seed P, P application did not significantly influence straw P concentration. Except at 50 kg P ha-1, the concentration of straw P was higher at all rates of P application than that of control. Similar to its concentration in seed, the concentration of P in straw was also increased from 0.46% in control plants to 0.65% in those supplied with 40 kg P ha-1 although its lowest concentration (0.44%) was obtained at 50 kg P ha-1. Simple correlation result indicated that there was a negative correlation (r= -0.36**) between straw P and exchangeable acidity. Similar in seed P, with increment in exchangeable acidity values of available P level would decline due to fixation and thereby resulting in low P concentration in straw. The concentrations of P in both seed and straw in all treatments except those of control and 50 kg P ha-1 (Table 4) were greater than the plant P concentration range (0.1-0.5%) rated as optimum by Havlin et al. (1999). The minimum (7.79 kg ha-1) and the maximum (19.88 kg ha-1) grain uptake of P were recorded at the rates of 0 and 30 kg P ha-1, respectively, whereas the minimum (6.74 kg ha-1) and the maximum (13.33 kg ha-1) straw uptake were recorded at the rates of 0 and 40 kg ha-1, respectively (Table 4). The uptake of P by both the grain and straw decreased after the maximum uptake was attained at 30 and 40 kg P ha-1 applications, respectively. Likewise, the total uptake of P by the biomass (the sum of uptake by grain yield and straw) increased from 14.53 to 32.59 kg ha-1 at the rates of 0 and 30 kg P ha-1, respectively and declined beyond this rate. The grain P uptake accounted for 61% of the maximum total P uptake, whereas straw P accounted for 39%. This result is in agreement with that of Birhan (2006) who reported that P uptake increased with application of P in haricot bean. The highest apparent P recovery obtained was 78.05% at application of 20 kg P ha-1 followed by 60.20% at the rate of 30 kg P ha-1, whereas the lowest was 15.46% at application of 50 kg P ha-1. The highest agronomic (69.80) and physiological (123.32) P efficiencies were obtained at application of 10 kg P ha- 1. The lowest agronomic P efficiency (9.28) was obtained at 60 kg P ha-1, whereas the lowest physiological P efficiency (46.35) was obtained at application of 30 kg P ha-1. Both P efficiencies were decreased with application of P. The value of agronomic efficiency indicated that for a unit of fertilizer P applied the highest yield was produced at 10 kg P ha-1, whereas the lowest was produced at 60 kg P ha-1. On the other hand, the value of physiological efficiency indicated that from a given unit of P taken up by the total biomass, relatively the highest portion was used in grain formation at the rate of 10 kg P ha-1, whereas the lowest was used at 30 kg P ha-1. Thus, application of 10 kg P ha-1 is optimum to obtain the highest agronomic and physiological efficiencies. Conclusion and Recommendation Application of 10 kg P ha-1 had significantly improved grain yield and biomass. Although statistically insignificant, enhanced physiological maturity and yield components such as number of pods plant-1 and
Journal of Biology, Agriculture and Healthcare www.iiste.org ISSN 2224-3208 (Paper) ISSN 2225-093X (Online) Vol 1, No.3, 2011
46
number of seed pod-1 were obtained from this rate. Further increase in levels of P up to 35 kg P ha-1 did not increase yield significantly compared to that of 10 kg P ha-1 application. Phosphorus supply beyond 35 kg P ha-1 generally resulted in decline of grain and biomass yields, number of pods plant-1 and number of seed pod-1. Thus, application of 10 kg P ha-1 is recommended for better production of haricot bean at Areka. Reference Abayneh Esayas (2003), “Soils of Areka Agriculture Research Center”, Unpublished material, Technical Paper No. 77. Amare Abebe (1987), “Haricot bean (Phaseolus vulgaris L.) varieties performance and recommended method of production”, In: proceedings of the 19th National Crop Improvement Conference, 22-26 April 1987, IAR, Addis Ababa, Ethiopia. Amijee, F and K, Giller (1998), “Environmental constraints to nodulation and nitrogen fixation of phaseolus vulgaris L. in Tanzania, 1 A survey of soil fertility, root nodulation and multi-locational responses to Rhizobium inoculation”, African crop science Journal 6:159-169. Birhan Abdulkadir (2006), “Response of haricot bean (Phaseolus vulgaris L.) to nitrogen, phosphorus and inoculation of Rhizobium Leguminosarum on yield and yield components at Melkassa”, M.Sc. Thesis, University of Hawassa, Awassa College of Agriculture, Ethiopia, 97 p. Brady, N.C. and R.R. Weil (2002), “The nature and properties of soils”, thirteenth edition, Printice Hall, New Jersey, 960 p. Central Agricultural Census Commission (2003 Part I), “Ethiopian Agricultural Sample Enumeration, 2001/02, Results at country level, Statistical Report on Socio-economic Characteristics of the Population in Agricultural Households, Land Use, and Area and Production of Crops”, Addis Ababa, Ethiopia, 375 p. Central Agricultural Census Commission (2003 Part II A), “Ethiopian Agricultural Sample Enumeration, 2001/02, Results for Southern Nations, Nationalities and Peoples’ Region. Statistical Report on Area and Production of Crops”, Addis Ababa, Ethiopia, 519 p. Central Agricultural Census Commission (2003 Part II B), “Ethiopian Agricultural Sample Enumeration, 2001/02, Results for Southern Nations, Nationalities and Peoples’ Region. Statistical Report on Socio-economic Characteristics of the Population in Agricultural Households, Land Use, and Area and Production of Crops”, Addis Ababa, Ethiopia. Craswell, E.T. and D.C. Godwin (1984), “The efficiency of nitrogen fertilizers applied to cereals in different climates”, Principles of plant nutrition, In Mengel, K. and E.A. Kirkby (eds.), Panima Publishing Corporation, New Delhi, India. Desta Beyene (1982), “Diagnosis of Phosphorus Deficiency in Ethiopian soils”, Soil sci. Buletin No. 3, Institute of Agric. Research (IAR), Addis Ababa, Ethiopia, 18 p. Gemechu Gedeno (1990), “Haricot bean (Phaseolus vulgaris L.) Agronomic Research at Bako”, Research on Haricot Bean in Ethiopia: an Assessment of Status, Progress, Priorities and Strategies. Proceedings of a National Workshop held in Addis Ababa, 1-3 October, 1990, 114 p. Getachew Kassaye (1990), “Research Recommendations and the Adoption of Improved
Technology for Haricot Bean in the Southern Zone of Ethiopia”, Research on Haricot Bean in Ethiopia: an Assessment of Status, Progress, Priorities and Strategies, Proceedings of a National Workshop held in Addis Ababa, 1-3 October 1990. 114 p.
Hajeal, T.N, Jagdish Prasad and S.R. Naga Bhushana (1994), “Response of soybean to phosphorus with and without nitrogen and Rhizobium inoculation in cracking clay soil”, Indian Journal of Agricultural Sciences 64: 492-494.
Havlin, J.L., J.D. Beaton, S.L. Tisdale and W.L. Nelson (1999), “Soil Fertility and Fertilizers: An Introduction to Nutrient Management”, Prentice Hall, New Jersey, 499 p.
Herrera, E. (2005), “Soil Test Interpretations Guide A-122”, College of Agriculture and Home Economics New Mexico State University.
Kelsa Kena, Ejigu Jonfa and Tesfaye Birhanu (1996), “Participatory Soil Mapping and
Journal of Biology, Agriculture and Healthcare www.iiste.org ISSN 2224-3208 (Paper) ISSN 2225-093X (Online) Vol 1, No.3, 2011
47
Characterization in Kindo Koysha, southern Ethiopia”, Proceeding of Workshop on Nutrient Cycling and Soil Fertility Management in Ethiopia, 26-November to 2-December 1998, Wolaita Sodo, International Institute for Environmental Development, London.
Khan, B.M., Asif, M., Hussain, N. and Aziz, M (2003), “Impact of different levels of phosphorus on growth and yield of mung bean genotypes”, Asian Journal of Plant Sciences 2(9): 677-679.
Linguist, B.A., P.W. Singleton and K.G. Cassmann (1997), “Inorganic and organic phosphorus dynamics during a build up and decline of available phosphorus in an Ultisols”, Soil Sci. 164: 254-264.
Marschner, H (2002), “Mineral Nutrition of Higher Plants”, Second edition, Academic Press, Amsterdam, Boston, Heidelberg, London, New York, Oxford, Paris, san Diego San Francisco, Singapore, Sydney, Tokyo.
Mengel, K. and E.A. Kirkby (1987), “Principles of Plant Nutrition”, Fourth edition, International Potash Institute, Worblaufen-Bern/Switzerland, 687 p.
Meseret Fanta (2006), “Effect of population density, inter-row spacing and phosphorus fertilizer on yield and yield components of mung bean (Vigna radiata L.) wilczek at Awassa Research Center”, M.Sc. Thesis, University of Hawasa, Awassa college of Agriculture, Ethiopia.
Miller, R.W. and R.L. Donahue (1995), “Soils in our environment”, Seventh (ed.), Prentice Hall, Englewood Cliff, New Jersey, USA.
Mishra, B.B, Heluf Gebrekidan and Sheleme Beyene (2006), “Photopedogenesis: Concept and Application”, Journal of Food, Agriculture and Environment 4 (2): 12-14.
Mitiku Haile (1990), “Biological nitrogen fixation by haricot bean in Ethiopia”, Research on Haricot Bean in Ethiopia: an Assessment of Status, Progress Priorities and Strategies, Proceedings of a National Workshop held in Addis Ababa, 1-3 October 1990, 114 p.
Onwueme, I.C. and T.D. Sinha (1991), “Field crop production in tropical Africa”, Technical Center for Agriculture and Rural Co-operation.
Pushparajah, E. (1997), “World Fertilizer Use Manual”, International Board for Soil Research and Management, Bangkok, Thailand.
Sahlemedhin Sertsu and Taye Bekele (2000), “Procedures for Soil and Plant Analysis”, National Soil Research Center, EARO, Technical Paper No. 74, Addis Ababa, Ethiopia.
Sheleme Beyene (1997), “Effects of Arbuscular Mycorrhizae on Yield and Nutrient Concentration of Maize (Zea mays L.) at increasing P supply under field conditions in Ethiopia”, PhD Thesis, Justus Liebig University, Glesssen, Germany, 142 p.
Stoorvogel, I.J. and E.M. Smaling (1990), “Assessment of nutrient depletion in sub-Saharan Africa", 1983-2000, Report 28, The Winard Starting Center for Integrated Land, Soil and Water Research (Sc-D10), Wageningen.
Tekalign Mamo and J. Haque (1987), “Phosphorus status of some Ethiopian soils, sorption characteristics in plants and soils”.
Tekalign, M., I. Haque and C.S. Kamara (1988), “Phosphorus status of some Ethiopian high land Vertisols”,In: S.C. Jutz et al. (eds.), Management of Vertisols in sub-Saharan Africa, Procedings of a conference held at International Livestock Center for Africa, Addis Ababa, Ethiopia, 31 Aug.- 4 Sep, 1987, ILCA, Addis Ababa, Ethiopia, pp 232-257.
Tenaw Workayehu (1990), “Review of Agronomic Studies on Haricot Bean in the Southern Zone of Ethiopia”, Research on Haricot Bean in Ethiopia: an Assessment of Status, Progress, Priorities and Strategies, Proceedings of a National Workshop held in Addis Ababa, 1-3 October 1990, 114 p.
Tenaw Workayehu and Yeshi Chiche (1990), “Importance, production system and problems of haricot bean in the southern zone of Ethiopia”, Research on Haricot Bean in Ethiopia: an Assessment of Status, Progress, Priorities and Strategies, Proceedings of a National Workshop held in Addis Ababa, 1-3 October 1990, 114 p.
van Schoonhoven. T. and H. Voysest (1991), “Common bean: Research for Crop Improvement”, CIAT, Cali, Colombia.
Williams, B.L. (1996), “Total organic phosphorus and extractable-P in humus and soil beneath stika
Journal of Biology, Agriculture and Healthcare www.iiste.org ISSN 2224-3208 (Paper) ISSN 2225-093X (Online) Vol 1, No.3, 2011
48
spruce planted in pure stands and in mixture with scots pine”, Plant and soil 182: 177-183. Wortmann, C.S. (1998), “Atlas of common bean (Phaseolus vulgaris L.) production in Africa”, CIAT,
Cali, Colombia, pp 1-7. Zake, J.Y.K. (1993), “A review of soil degradation and research on soil management in Uganda”, In:
Pauw, A.de, (ed.), The management of acid soils and land development, Network Document 13, IBSRAM, Bangkok.
Table 1. Crop phenology and growth parameters of haricot bean as affected by phosphorus application at Areka, 2006. Rates of P (kg ha-1)
Days to flowering
Days to maturity
Plant height (cm)
No. of branches plant-1
0
46.25
85.50a
80.20
3.55
10 46.25 84.75ab 79.75 3.85 20 46.00 84.50abc 78.80 3.85 30 46.00 84.50abc 78.65 3.70 40 45.75 83.25c 79.35 4.05 50 45.75 83.50bc 79.90 3.95 60 45.75 83.25c 78.75 4.00 CV (%) 0.90 1.09 9.60 8.39 LSD (5%) NS 1.37 NS NS
Values followed by the same letter (s) within a column are not significantly different at P ≤ 0.05 NS- not significant Table 2. Yield, yield components and harvest index of haricot bean as affected by phosphorus application at Areka, 2006.
Rates of P (kg ha-1)
No. of pods plant-1
No. of seeds pod-1
Grain yield (dt ha-1)
Total biomass (dt ha-1)
1000 seed wt (g)
HI
0 9.58 5.95 15.58b 30.24b 254.45 0.52 10 12.95 6.01 22.56a 39.14a 254. 49 0.58 20 14.43 5.94 23.86a 43.88a 254.42 0.54 30 13.33 6.00 23.95a 44.45a 254.11 0.54 40 15.30 6.14 25.47a 45.97a 252.69 0.55 50 13.63 5.93 22.68a 41.85a 255.02 0.54 60 13.70 6.13 21.15ab 41.54a 252.39 0.51 CV (%) 21.23 4.86 17.14 13.43 5.21 9.97 LSD (5%) NS NS 5.65 8.18 NS NS
Values followed by the same letter (s) within a column are not significantly different at P ≤ 0.05 NS- not significant
Journal of Biology, Agriculture and Healthcare www.iiste.org ISSN 2224-3208 (Paper) ISSN 2225-093X (Online) Vol 1, No.3, 2011
49
Table 3. Soil available P (Bray II), total N, OC, EA and pH as affected by increasing P application on soils at Areka, 2006.
Rates of P Av. P TN OC EA pH (kg ha-1) (mg kg-1) (%) (%) cmol (+) kg-1) 0 3.55 0.21 2.97 0.46 5.88 10 4.97 0.19 2.92 0.56 5.60 20 5.06 0.18 3.00 0.53 5.55 30 5.72 0.19 2.86 0.48 5.58 40 7.53 0.19 3.08 0.52 5.45 50 6.05 0.19 3.09 0.56 5.48 60 6.58 0.20 3.05 0.52 5.50 Before sowing 8.82 0.20 3.50 0.34 5.60 the crop CV (%) 28.87 9.92 6.47 45.11 3.56 LSD (%) NS NS NS NS NS Table 4. P content of grain and straw, uptake of the nutrient, apparent recovery and P use efficiency at vest at Areka, 2006
Rates of P(kg ha-1)
Yield (kg ha-1 P content (%) P uptake (kg ha-1)
Apparent P recovery (%)
P efficiency
Grain Straw Grain Straw Grain Straw Total Agronomic Physiological
0 1558 1466 0.50c 0.46 7.79 6.74 14.53 --- ----- ----- 10 2256 1658 0.52c 0.51 11.73 8.46 20.19 56.60 69.80 123.32 20 2386 2002 0.76ab 0.60 18.13 12.01 30.14 78.05 41.40 53.04 30 2395 2050 0.83a 0.62 19.88 12.71 32.59 60.20 27.90 46.35 40 2547 2050 0.63bc 0.65 16.05 13.33 29.38 37.13 24.73 66.60 50 2268 1917 0.61bc 0.44 13.83 8.43 22.26 15.46 14.20 91.85 60 2115 2039 0.72ab 0.53 15.23 10.81 26.04 19.18 9.28 48.39
International Journals Call for Paper
The IISTE, a U.S. publisher, is currently hosting the academic journals listed below. The peer review process of the following journals
usually takes LESS THAN 14 business days and IISTE usually publishes a qualified article within 30 days. Authors should
send their full paper to the following email address. More information can be found in the IISTE website : www.iiste.org
Business, Economics, Finance and Management PAPER SUBMISSION EMAIL
European Journal of Business and Management [email protected]
Research Journal of Finance and Accounting [email protected]
Journal of Economics and Sustainable Development [email protected]
Information and Knowledge Management [email protected]
Developing Country Studies [email protected]
Industrial Engineering Letters [email protected]
Physical Sciences, Mathematics and Chemistry PAPER SUBMISSION EMAIL
Journal of Natural Sciences Research [email protected]
Chemistry and Materials Research [email protected]
Mathematical Theory and Modeling [email protected]
Advances in Physics Theories and Applications [email protected]
Chemical and Process Engineering Research [email protected]
Engineering, Technology and Systems PAPER SUBMISSION EMAIL
Computer Engineering and Intelligent Systems [email protected]
Innovative Systems Design and Engineering [email protected]
Journal of Energy Technologies and Policy [email protected]
Information and Knowledge Management [email protected]
Control Theory and Informatics [email protected]
Journal of Information Engineering and Applications [email protected]
Industrial Engineering Letters [email protected]
Network and Complex Systems [email protected]
Environment, Civil, Materials Sciences PAPER SUBMISSION EMAIL
Journal of Environment and Earth Science [email protected]
Civil and Environmental Research [email protected]
Journal of Natural Sciences Research [email protected]
Civil and Environmental Research [email protected]
Life Science, Food and Medical Sciences PAPER SUBMISSION EMAIL
Journal of Natural Sciences Research [email protected]
Journal of Biology, Agriculture and Healthcare [email protected]
Food Science and Quality Management [email protected]
Chemistry and Materials Research [email protected]
Education, and other Social Sciences PAPER SUBMISSION EMAIL
Journal of Education and Practice [email protected]
Journal of Law, Policy and Globalization [email protected]
New Media and Mass Communication [email protected]
Journal of Energy Technologies and Policy [email protected]
Historical Research Letter [email protected]
Public Policy and Administration Research [email protected]
International Affairs and Global Strategy [email protected]
Research on Humanities and Social Sciences [email protected]
Developing Country Studies [email protected]
Arts and Design Studies [email protected]
[Type a quote from the document or the
summary of an interesting point. You can
position the text box anywhere in the
document. Use the Drawing Tools tab to change
the formatting of the pull quote text box.]
Global knowledge sharing:
EBSCO, Index Copernicus, Ulrich's
Periodicals Directory, JournalTOCS, PKP
Open Archives Harvester, Bielefeld
Academic Search Engine, Elektronische
Zeitschriftenbibliothek EZB, Open J-Gate,
OCLC WorldCat, Universe Digtial Library ,
NewJour, Google Scholar.
IISTE is member of CrossRef. All journals
have high IC Impact Factor Values (ICV).