11C-metionine (MET) and 18F-fluorothymidine (FLT) PET in patients with newly diagnosed glioma
11
18 F-Fluoro-L-Thymidine and 11 C- Methylmethionine as Markers of Increased Transport and Proliferation in Brain Tumors Andreas H. Jacobs, MD 1–3 ; Anne Thomas, MD 1,2 ; Lutz W. Kracht, MD 1 ; Huongfeng Li, PhD 1 ; Claus Dittmar, PhD 1 ; Guido Garlip, MD 1 ; Norbert Galldiks, MD 1 ; Johannes C. Klein, MD 1 ; Jan Sobesky, MD 1,2 ; Ru ¨diger Hilker, MD 1,2 ; Stefan Vollmar, PhD 1,2 ; Karl Herholz, MD 1,2 Klaus Wienhard, PhD 1 ; and Wolf-Dieter Heiss, MD 1–3 1 Max Planck Institute for Neurological Research, Cologne, Germany; 2 Department of Neurology, University of Cologne, Cologne, Germany; and 3 Center for Molecular Medicine, University of Cologne, Cologne, Germany Because of the high glucose metabolism in normal brain tissue 18 F-FDG is not the ideal tracer for the detection of gliomas. Methyl- 11 C-L-methionine ( 11 C-MET) is better suited for imaging the extent of gliomas, because it is transported specifically into tumors but only insignificantly into normal brain. 3-Deoxy-3- 18 F-fluorothymidine ( 18 F-FLT) has been introduced as a prolifer- ation marker in a variety of neoplasias and has promising po- tential for the detection of brain tumors, because its uptake in normal brain is low. Additionally, the longer half-life might permit differentiation between transport and intracellular phosphoryla- tion. Methods: PET of 18 F-FLT and 11 C-MET was performed on 23 patients (age range, 20 –70 y) with histologically verified gliomas of different grades. On all patients, conventional MRI was performed, and 16 patients additionally underwent con- trast-enhanced imaging. Images were coregistered, and the volumes of abnormality were defined for PET and MRI. Uptake ratios and standardized uptake values (SUVs) of various tumors and regions were assessed by region-of-interest analysis. Ki- netic modeling was performed on 14 patients for regional time– activity curves of 18 F-FLT from tumorous and normal brain tis- sue. Results: Sensitivity for the detection of tumors was lower for 18 F-FLT than for 11 C-MET (78.3% vs. 91.3%), especially for low-grade astrocytomas. Tumor volumes detected by 18 F-FLT and 11 C-MET were larger than tumor regions displaying gado- linium enhancement (P 0.01). Uptake ratios of 18 F-FLT were higher than uptake ratios of 11 C-MET (P 0.01). Uptake ratios of 18 F-FLT were higher in glioblastomas than in astrocytomas (P 0.01). Absolute radiotracer uptake of 18 F-FLT was low and significantly lower than that of 11 C-MET (SUV, 1.3 0.7 vs. 3.1 1.0; P 0.01). Some tumor regions were detected only by either 18 F-FLT (7 patients) or 11 C-MET (13 patients). Kinetic modeling revealed that 18 F-FLT uptake in tumor tissue seems to be predominantly due to elevated transport and net influx. How- ever, a moderate correlation was found between uptake ratio and phosphorylation rate k3 (r 0.65 and P 0.01 for grade II–IV gliomas; r 0.76 and P 0.01 for grade III–IV tumors). Conclusion: 18 F-FLT is a promising tracer for the detection and characterization of primary central nervous system tumors and might help to differentiate between low- and high-grade glio- mas. 18 F-FLT uptake is mainly due to increased transport, but irreversible incorporation by phosphorylation might also con- tribute. In some tumors and tumor areas, 18 F-FLT uptake is not related to 11 C-MET uptake. In view of the high sensitivity and specificity of 11 C-MET PET for imaging of gliomas, it cannot be excluded that 18 F-FLT PET was false positive in these areas. However, the discrepancies observed for the various imaging modalities ( 18 F-FLT and 11 C-MET PET as well as gadolinium- enhanced MRI) yield complementary information on the activity and the extent of gliomas and might improve early evaluation of treatment effects, especially in patients with high-grade glio- mas. Further studies are needed, including coregistered histol- ogy and kinetic analysis in patients undergoing chemotherapy. Key Words: brain tumor; PET; 18 F-FLT; 11 C-MET J Nucl Med 2005; 46:1948 –1958 Methyl- 11 C-L-methionine ( 11 C-MET) and 18 F-FDG are well-established markers in brain tumor diagnosis. Al- though the potential of 18 F-FDG in the diagnosis of cortical gliomas is limited because of the hypo- or isometabolism of some tumors, 11 C-MET has been shown to possess high specificity in tumor detection, tumor delineation, and dif- ferentiation of benign from malignant lesions (1). 11 C-MET uptake, which seems to be caused by increased carrier- mediated transport rather than elevated protein synthesis, correlates with cell proliferation, in vitro Ki-67 expression, and proliferating cell nuclear antigen expression (2–4) as well as with microvessel density (5). Unfortunately, the short half-life of 11 C (20 min) and the rapid catabolism of methionine in vivo limits kinetic modeling for this tracer. Recently, Shields et al. have developed the new PET tracer, 3-deoxy-3- 18 F-fluorothymidine ( 18 F-FLT), which allows for noninvasive assessment of tumor proliferation (6). In contrast to 18 F-FDG and 11 C-MET, which provide only an indirect measure of proliferation status, 18 F-FLT allows the direct measurement of cellular thymidine kinase Received Jan. 20, 2005; revision accepted Aug. 19, 2005. For correspondence or reprints contact: Andreas H. Jacobs, MD, Labora- tory for Gene Therapy and Molecular Imaging, MPI for Neurological Research, Gleuelerstrasse 50, 50931 Cologne, Germany. E-mail: [email protected] Andreas H. Jacobs and Anne Thomas contributed equally to this work. 1948 THE JOURNAL OF NUCLEAR MEDICINE • Vol. 46 • No. 12 • December 2005
description
Articulo
Transcript of 11C-metionine (MET) and 18F-fluorothymidine (FLT) PET in patients with newly diagnosed glioma

18F-Fluoro-L-Thymidine and 11C-Methylmethionine as Markers of IncreasedTransport and Proliferation in Brain TumorsAndreas H. Jacobs, MD1–3; Anne Thomas, MD1,2; Lutz W. Kracht, MD1; Huongfeng Li, PhD1; Claus Dittmar, PhD1;Guido Garlip, MD1; Norbert Galldiks, MD1; Johannes C. Klein, MD1; Jan Sobesky, MD1,2; Rudiger Hilker, MD1,2;Stefan Vollmar, PhD1,2; Karl Herholz, MD1,2 Klaus Wienhard, PhD1; and Wolf-Dieter Heiss, MD1–3
1Max Planck Institute for Neurological Research, Cologne, Germany; 2Department of Neurology, University of Cologne, Cologne,Germany; and 3Center for Molecular Medicine, University of Cologne, Cologne, Germany
Because of the high glucose metabolism in normal brain tissue18F-FDG is not the ideal tracer for the detection of gliomas.Methyl-11C-L-methionine (11C-MET) is better suited for imagingthe extent of gliomas, because it is transported specifically intotumors but only insignificantly into normal brain. 3�-Deoxy-3�-18F-fluorothymidine (18F-FLT) has been introduced as a prolifer-ation marker in a variety of neoplasias and has promising po-tential for the detection of brain tumors, because its uptake innormal brain is low. Additionally, the longer half-life might permitdifferentiation between transport and intracellular phosphoryla-tion. Methods: PET of 18F-FLT and 11C-MET was performed on23 patients (age range, 20–70 y) with histologically verifiedgliomas of different grades. On all patients, conventional MRIwas performed, and 16 patients additionally underwent con-trast-enhanced imaging. Images were coregistered, and thevolumes of abnormality were defined for PET and MRI. Uptakeratios and standardized uptake values (SUVs) of various tumorsand regions were assessed by region-of-interest analysis. Ki-netic modeling was performed on 14 patients for regional time–activity curves of 18F-FLT from tumorous and normal brain tis-sue. Results: Sensitivity for the detection of tumors was lowerfor 18F-FLT than for 11C-MET (78.3% vs. 91.3%), especially forlow-grade astrocytomas. Tumor volumes detected by 18F-FLTand 11C-MET were larger than tumor regions displaying gado-linium enhancement (P � 0.01). Uptake ratios of 18F-FLT werehigher than uptake ratios of 11C-MET (P � 0.01). Uptake ratiosof 18F-FLT were higher in glioblastomas than in astrocytomas(P � 0.01). Absolute radiotracer uptake of 18F-FLT was low andsignificantly lower than that of 11C-MET (SUV, 1.3 � 0.7 vs.3.1 � 1.0; P � 0.01). Some tumor regions were detected only byeither 18F-FLT (7 patients) or 11C-MET (13 patients). Kineticmodeling revealed that 18F-FLT uptake in tumor tissue seems tobe predominantly due to elevated transport and net influx. How-ever, a moderate correlation was found between uptake ratioand phosphorylation rate k3 (r � 0.65 and P � 0.01 for gradeII–IV gliomas; r � 0.76 and P � 0.01 for grade III–IV tumors).Conclusion: 18F-FLT is a promising tracer for the detection and
characterization of primary central nervous system tumors andmight help to differentiate between low- and high-grade glio-mas. 18F-FLT uptake is mainly due to increased transport, butirreversible incorporation by phosphorylation might also con-tribute. In some tumors and tumor areas, 18F-FLT uptake is notrelated to 11C-MET uptake. In view of the high sensitivity andspecificity of 11C-MET PET for imaging of gliomas, it cannot beexcluded that 18F-FLT PET was false positive in these areas.However, the discrepancies observed for the various imagingmodalities (18F-FLT and 11C-MET PET as well as gadolinium-enhanced MRI) yield complementary information on the activityand the extent of gliomas and might improve early evaluation oftreatment effects, especially in patients with high-grade glio-mas. Further studies are needed, including coregistered histol-ogy and kinetic analysis in patients undergoing chemotherapy.
Key Words: brain tumor; PET; 18F-FLT; 11C-MET
J Nucl Med 2005; 46:1948–1958
Methyl-11C-L-methionine (11C-MET) and 18F-FDG arewell-established markers in brain tumor diagnosis. Al-though the potential of 18F-FDG in the diagnosis of corticalgliomas is limited because of the hypo- or isometabolism ofsome tumors, 11C-MET has been shown to possess highspecificity in tumor detection, tumor delineation, and dif-ferentiation of benign from malignant lesions (1). 11C-METuptake, which seems to be caused by increased carrier-mediated transport rather than elevated protein synthesis,correlates with cell proliferation, in vitro Ki-67 expression,and proliferating cell nuclear antigen expression (2–4) aswell as with microvessel density (5). Unfortunately, theshort half-life of 11C (20 min) and the rapid catabolism ofmethionine in vivo limits kinetic modeling for this tracer.
Recently, Shields et al. have developed the new PETtracer, 3�-deoxy-3�-18F-fluorothymidine (18F-FLT), whichallows for noninvasive assessment of tumor proliferation(6). In contrast to 18F-FDG and 11C-MET, which provideonly an indirect measure of proliferation status, 18F-FLTallows the direct measurement of cellular thymidine kinase
Received Jan. 20, 2005; revision accepted Aug. 19, 2005.For correspondence or reprints contact: Andreas H. Jacobs, MD, Labora-
tory for Gene Therapy and Molecular Imaging, MPI for Neurological Research,Gleuelerstrasse 50, 50931 Cologne, Germany.
E-mail: [email protected] H. Jacobs and Anne Thomas contributed equally to this work.
1948 THE JOURNAL OF NUCLEAR MEDICINE • Vol. 46 • No. 12 • December 2005
activity, which is proportional to the proliferative activity ofthe tumor, and early assessment of response to therapy.After phosphorylation by cellular thymidine kinase 1 (TK1),18F-FLT nucleotides are trapped within the cell (7). Al-though in normal cells TK1 activity is increased by about10-fold only during the DNA synthetic phase (8), in malig-nant cells the increase in TK1 activity is higher and perma-nent (9,10).
18F-FLT uptake has already been demonstrated in a va-riety of tumors such as lung cancer, colorectal carcinoma,malignant melanoma, and non-Hodgkin’s lymphoma (11–14). Several studies detected a strong correlation betweenthe standardized uptake value (SUV) of 18F-FLT and theproliferative status in corresponding tumor samples (11,14).In cell culture experiments, 18F-FLT uptake correlated wellwith percentage of cells in S-phase and TK1 activity (15).Because uptake of 18F-FLT is low in intact brain tissue,18F-FLT provides a low-background cerebral image andthus is considered to be an attractive PET tracer for theimaging of brain tumors.
The purpose of this prospective study was to clarify therole of 18F-FLT in the diagnosis of primary central nervoussystem tumors. We therefore compared the newly devel-oped 18F-FLT PET with the routinely used 11C-MET PETand contrast-enhanced MRI to determine DNA metabolism
and amino acid uptake as well as the integrity of the blood–brain barrier in patients with gliomas.
MATERIALS AND METHODS
PatientsTwenty-three patients with primary central nervous system tu-
mors (11 men and 12 women; mean age, 47.1 � 14.6 y; range,20–70 y) were included in this prospective study after giving theirinformed consent. Diagnoses had been confirmed histologicallyaccording to World Health Organization (WHO) criteria in allpatients before or after the PET examination. Tumor types andgrades were distributed as follows: WHO grade I astrocytoma (n �1); WHO grade II astrocytoma (n � 6); WHO grade II oligoas-trocytoma (n � 2); WHO grade III astrocytoma (n � 4); WHOgrade III oligodendroglioma (n � 1); WHO grade III oligoastro-cytoma (n � 1); anaplastic ganglioglioma (n � 1); WHO grade IVglioblastoma (n � 6); and WHO grade IV medulloblastoma (n �1). Because patients partly had received different therapy schemesbefore being included in the study, the WHO groups were dividedinto a treated subgroup (n � 15) and an untreated subgroup (n �8). Individual clinical data are summarized in Table 1.
PET StudiesData Acquisition. PET imaging devices were an ECAT EXACT
(CTI/Siemens; in-plane full width at half maximum, 6 mm; slicethickness, 3.375 mm; axial field of view, 162 mm) and an ECAT
TABLE 1Characteristics of 22 Patients with Glioma and 1 Patient with Medulloblastoma
Patientno.
Age(y) Sex
Tumor type andWHO grade Location Side ND/REC
Therapy before study entry
SurgeryRadiation
(Gy) Chemotherapy
1 33 F Astrocytoma II Frontal R REC 1 54 —2 59 F Glioblastoma IV Temporal L REC 2 60 TMZ3 51 F Astrocytoma II Precentral R REC 1 — —4 49 F Glioblastoma IV Temporal L REC 1 60 TMZ 5C5 70 M Glioblastoma IV Frontoparietal R ND — — —6 50 F Astrocytoma II Frontotemporal L REC 1 — —7 64 M Glioblastoma IV Frontal R ND — — —8 67 M Glioblastoma IV Parietooccipital L ND — — —9 39 F Astrocytoma III Brainstem, thalamus L REC — 60 TMZ 4C, PCV 5C
10 35 F Glioblastoma IV Temporal R REC 2 60 TMZ11 20 M Medulloblastoma IV Cerebellar R REC 2 3� HIT-91, 97, 3�12 38 M Astrocytoma III Parietooccipital L REC 1 60 PCV 2C13 57 F Oligoastrocytoma II Thalamus R and L REC 3 60 —14 58 F Ganglioglioma III Temporoparietal L REC — — PCV 1C15 34 M Astrocytoma II Precentral L ND — — —16 38 M Astrocytoma II Temporoparietal L REC 1 — TMZ 9C17 26 F Astrocytoma I Occipital R ND — — —18 47 F Oligoastrocytoma III Parietal L REC 1 60 TMZ19 33 M Astrocytoma III Frontoparietal R REC 1 — PCV 4C20 55 M Oligoastrocytoma II Temporoparietooccipital L REC 1 — —21 60 F Oligodendroglioma III Parietal L ND — — —22 31 M Astrocytoma II Temporoparietal L ND — — —23 69 M Astrocytoma II Occipital R ND — — —
ND � newly diagnosed; REC � recurrent; TMZ � temozolomide; PCV � procarbazine, lomustine, and vincristine; HIT � randomized,prospective, multicenter trial in order to improve the survival of children with medulloblastoma by using postoperative neoadjuvantchemotherapy before radiation therapy as opposed to maintenance chemotherapy after immediate postoperative radiotherapy.
18F-FLT PET IN BRAIN TUMORS • Jacobs et al. 1949
EXACT HR (CTI/Siemens; in-plane full width at half maximum,3.6 mm; slice thickness, 3.125 mm; axial field of view, 150 mm).For attenuation correction, 10-min transmission scans with 3 ro-tating 68Ga/68Ge sources were obtained before tracer application.
All patients were examined using 11C-MET and 18F-FLT syn-thesized according to the method of Machulla et al. (16) andWodarski et al. (17). The radiolabeling yield of 18F-FLT was6.3% � 1.3%, and the radiochemical purity of 18F-FLT was 98%.
After injection of 677.1 � 148.0 MBq (range, 222–720 MBq) of11C-MET, tracer accumulation was recorded over 60 min in 47transaxial slices of the entire brain as described elsewhere (5).
The mean dose of 18F-FLT was 321.9 � 85.1 MBq (range,111–370 MBq). For kinetic analysis of 18F-FLT, arterialized bloodsamples were obtained from 14 patients using an intravenouscatheter separate from that used for tracer injection. The hand ofthe patient was kept in a 40°C water bath from at least 10 minbefore the PET examination until the end of the examination toensure sufficient arterial-venous shunting. The oxygenation statusof a blood sample was measured before the start of the PETexamination to ensure that oxygenation was greater than 85%.18F-FLT PET images were acquired as a 90-min dynamic setcomprising the following frame durations: 6 � 10 s, 3 � 20 s, 2 �30 s, 2 � 60 s, 2 � 150 s, and 16 � 300 s.
To allow for coregistration of metabolic and anatomic data,digitally delivered T1- and T2-weighted MRI was performed on a1.5-T system (Gyroscan Intera; Philips Medical Systems) for allpatients. Contrast-enhanced T1-weighted MRI was performed on16 of the 23 patients. Multitracer PET and MRI scans werecompleted within 6.3 � 3.0 d (range, 2–13 d).
Data Analysis. For 2 patients, the results of both 11C-MET PETand 18F-FLT PET were false negative, and these data were thusexempted from further analysis. Tumor volumes were defined inthe remaining 21 and 14 patients for PET and contrast-enhancedMRI, respectively, using the 3D-Tool, which was developed in-house. The threshold for increased 11C-MET uptake was set to 1.3(18), the threshold for increased 18F-FLT uptake was set to 2.0, andthe threshold for positive contrast enhancement on MRI wasdetermined by varying the lower value to match the area ofpositive enhancement on individual MRI scans. To all 3 imagingmodalities, a component analyses was applied to extract areas ofpositive enhancement or tracer uptake outside the brain, such ashigh 11C-MET uptake in lacrimal or pituitary glands and high18F-FLT uptake in bone and venous sinuses.
A region-of-interest (ROI) approach was used to compare traceruptake in 11C-MET and 18F-FLT PET. To determine maximaltracer uptake, a circular ROI 8 mm in diameter was placed on theareas of highest 11C-MET and 18F-FLT uptake. For reference, acommensurate ROI was placed on the corresponding contralateralregion or, if impossible because of the tumor location, on intactbrain regions. Uptake ratios and SUVs were calculated as de-scribed elsewhere (5,19).
For further differentiation of 11C-MET, 18F-FLT, and gadolin-ium-diethylenetriaminepentaacetic acid (DTPA) uptake, detailed,irregularly shaped ROIs were placed on coregistered PET andavailable MRI scans where increased uptake of 18F-FLT alone,11C-MET alone, gadolinium-DTPA alone, or a combination of anyof these was observed. A circular ROI was placed on the nasalmucosa, being a rapidly dividing tissue with presumed high TK1
activity. Because of the variation in ROI size, reference ROIs
were placed on intact gray and white matter to calculate theuptake ratios.
For kinetic analysis of 18F-FLT, time–activity curves were gen-erated from circular regions placed over the tumor region withmaximum tracer uptake. Because of low counts in intact braintissue, reference ROIs were enlarged to the whole contralateralhemisphere to improve kinetic fitting. Time–activity curves ob-tained from 3 consecutive slices of the dynamic image set wereanalyzed by the PMOD biomedical image quantification and ki-netic modeling software (PMOD Technologies Ltd.).
A three-compartment (4 rate constants) model was used todescribe tracer kinetics. In this model, K1 and k2 are rate constantsdescribing tracer influx and efflux from plasma to tissue, respec-tively. The metabolic rate constant k3 describes the phosphoryla-tion rate of 18F-FLT by TK1. The dephosphorylation constant k4was either set to zero (20,21) or also included into the fittingprocedure. The net influx constant Ki of 18F-FLT into the respec-tive regions was calculated as follows: Ki � K1 � k3/(k2 � k3).Additionally, blood volume was assessed in both tumor and ref-erence regions.
Statistical AnalysisThe Wilcoxon signed rank test, the Mann–Whitney rank sum
test, and Spearman correlation analysis were used to assess thesignificance of any differences. Differences were considered sta-tistically significant when P was �0.05.
RESULTS
Sensitivity of 18F-FLT PET in Detecting Gliomas IsLower Than Sensitivity of 11C-MET PET
Of the 23 tumors studied, 21 (91.3%) were imaged by11C-MET PET and 18 (78.3%) by 18F-FLT PET. Tumorsthat were false negative on 11C-MET PET (n � 2) also werefalse negative on 18F-FLT PET; thus, no tumors were de-tected by 18F-FLT PET only. Of the tumors that were falsenegative on 18F-FLT PET (n � 5), 1 exhibited slight con-trast enhancement by MRI, 3 did not show contrast en-hancement, and for 1 the diagnosis was made by 11C-METPET, without an MRI examination (Table 2). Both tracersfailed to detect WHO grade II astrocytomas; 18F-FLT PETadditionally was false negative in 1 case of WHO grade IIIoligodendroglioma. All tumors showing positive contrastenhancement on MRI (n � 13) were depicted by 11C-METPET, 1 of these patients had false-negative 18F-FLT uptake.
These data indicate that, in this study, 18F-FLT PET wasless sensitive than 11C-MET PET in detecting primary cen-tral nervous system tumors, especially WHO grade II astro-cytomas.
Figure 1 gives 2 examples of increased 18F-FLT uptake inregions of increased gadolinium uptake, with additionalinformation on the true extent of the tumor given by 11C-MET PET. Figure 2 gives an example of a false-negativeresult on 18F-FLT PET. Figures 3 and 4 give examples ofpatients for whom complementary information on the ac-tivity and extent of the tumor could be obtained by 18F-FLTPET.
1950 THE JOURNAL OF NUCLEAR MEDICINE • Vol. 46 • No. 12 • December 2005
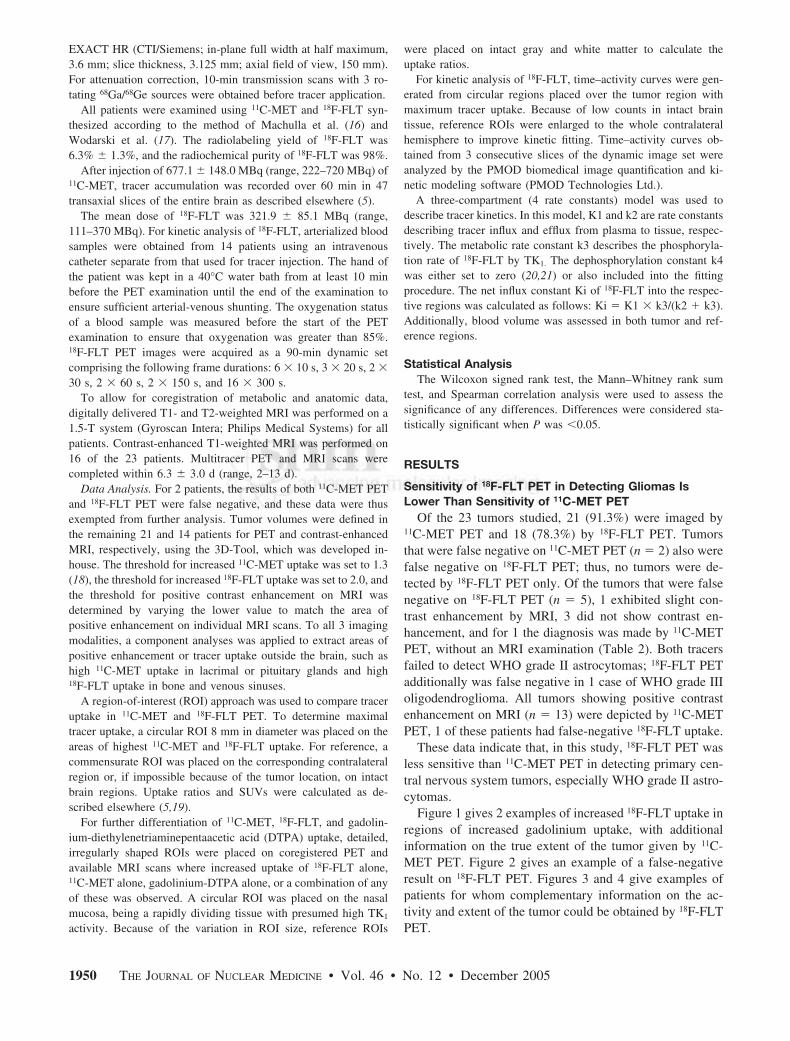
FIGURE 1. Two patients with highly intense 18F-FLT accumulation that was found mainly in areas of breakdown of blood–brain barrier asdepicted by gadolinium-enhanced MRI. A 64-y-old man with newly diagnosed glioblastoma (A) and 26-y-old woman with newly diagnosedWHO grade I astrocytoma (B). In both patients, 11C-MET PET is suggestive of a larger extent of tumor as depicted by gadolinium MRI.
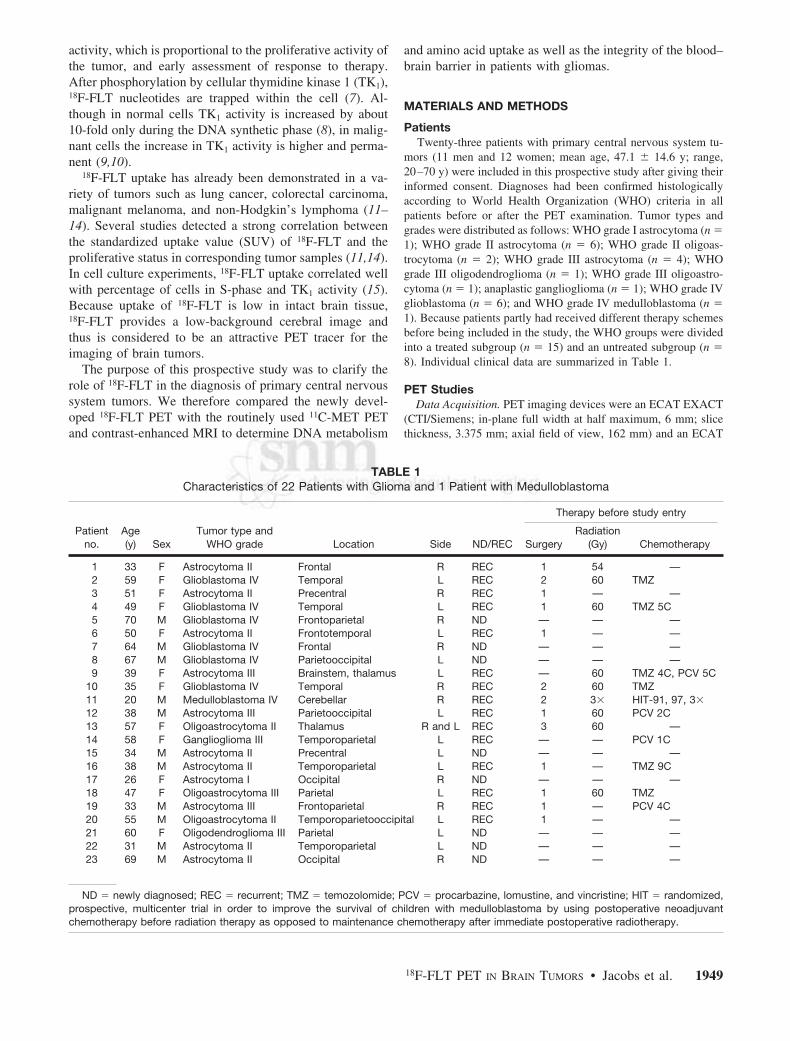
TABLE 2Results for 23 Patients Undergoing PET and MRI
Patientno.
Tumor volume (cm3) asdetermined by . . . Normalized tumor volume
Radiotracer uptakeratio* SUV
18F-FLT 11C-MET MRI-Gd FLT/Gd MET/Gd MET/FLT 18F-FLT 11C-MET 18F-FLT 11C-MET
1 5.0 7.6 — — — 1.5 2.4 1.6 1.1 2.52 27.4 27.5 6.8 4.0 4.0 1.0 7.9 3.3 1.7 3.63 7.9 18.5 — — — 2.3 4.4 2.7 1.0 3.14 91.2 52.7 20.5 4.5 2.6 0.6 9.3 2.7 2.7 5.45 46.6 46.0 — — — 1.0 7.0 3.5 1.3 3.36 0 5.7 1.2 0 4.9 — (1.0) 1.6 (0.2) 1.97 60.4 51.8 37.8 1.6 1.4 0.9 6.4 2.6 1.2 3.48 42.7 66.3 — — — 1.6 6.9 2.7 1.5 3.39 7.7 35.3 2.6 3.0 13.7 4.6 3.8 2.4 1.4 2.8
10 8.3 1.0 3.3 2.5 0.3 0.1 3.7 1.2 0.7 1.611 5.5 3.7 1.6 3.3 2.2 0.7 3.3 1.4 1.8 4.212 8.9 20.6 — — — 2.3 2.1 1.7 0.5 2.413 3.9 42.6 0.1 29.9 327.8 11.0 1.3 2.3 0.5 3.214 40.0 35.6 14.4 2.8 2.5 0.9 13.0 4.7 3.0 3.915 0 0 0 — — — (1.0) (1.0) (0.2) (1.0)16 0 18.8 — — — — (1.0) 2.0 (0.4) 2.617 7.7 14.3 5.5 1.4 2.6 1.9 3.9 2.3 1.4 4.018 0.4 20.6 1.1 0.4 19.4 46.8 2.0 1.3 0.8 2.619 17.4 24.7 6.8 2.6 3.6 1.4 3.5 1.9 0.6 2.020 1.7 28.0 — — — 16.3 2.0 2.7 0.5 3.121 0 14.6 0 — — — (1.0) 1.8 (0.3) 4.322 0 0 0 — — — (1.0) (1.0) (0.2) (1.0)23 14.7 34.4 10.7 1.4 3.2 2.3 4.7 2.1 1.3 1.3
Mean 18.9 27.1 8.0 4.4 29.9 5.4 4.9 2.3 1.3 3.1SD 24.2 17.6 10.4 7.8 89.7 11.1 3.0 0.8 0.7 1.0
*Calculated by dividing circular ROIs placed over tumor tissue by circular ROIs placed over intact brain. Uptake ratios of false-negativetumors in either PET examination were set to 1.
18F-FLT PET IN BRAIN TUMORS • Jacobs et al. 1951
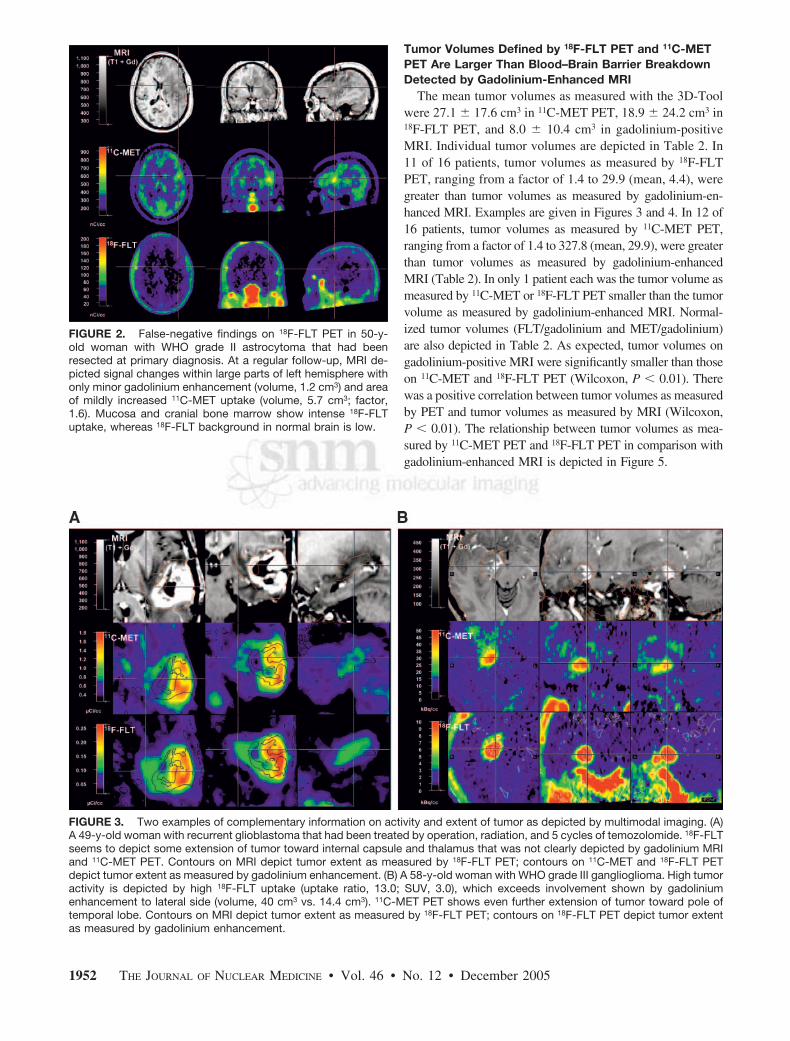
Tumor Volumes Defined by 18F-FLT PET and 11C-METPET Are Larger Than Blood–Brain Barrier BreakdownDetected by Gadolinium-Enhanced MRI
The mean tumor volumes as measured with the 3D-Toolwere 27.1 � 17.6 cm3 in 11C-MET PET, 18.9 � 24.2 cm3 in18F-FLT PET, and 8.0 � 10.4 cm3 in gadolinium-positiveMRI. Individual tumor volumes are depicted in Table 2. In11 of 16 patients, tumor volumes as measured by 18F-FLTPET, ranging from a factor of 1.4 to 29.9 (mean, 4.4), weregreater than tumor volumes as measured by gadolinium-en-hanced MRI. Examples are given in Figures 3 and 4. In 12 of16 patients, tumor volumes as measured by 11C-MET PET,ranging from a factor of 1.4 to 327.8 (mean, 29.9), were greaterthan tumor volumes as measured by gadolinium-enhancedMRI (Table 2). In only 1 patient each was the tumor volume asmeasured by 11C-MET or 18F-FLT PET smaller than the tumorvolume as measured by gadolinium-enhanced MRI. Normal-ized tumor volumes (FLT/gadolinium and MET/gadolinium)are also depicted in Table 2. As expected, tumor volumes ongadolinium-positive MRI were significantly smaller than thoseon 11C-MET and 18F-FLT PET (Wilcoxon, P � 0.01). Therewas a positive correlation between tumor volumes as measuredby PET and tumor volumes as measured by MRI (Wilcoxon,P � 0.01). The relationship between tumor volumes as mea-sured by 11C-MET PET and 18F-FLT PET in comparison withgadolinium-enhanced MRI is depicted in Figure 5.
FIGURE 2. False-negative findings on 18F-FLT PET in 50-y-old woman with WHO grade II astrocytoma that had beenresected at primary diagnosis. At a regular follow-up, MRI de-picted signal changes within large parts of left hemisphere withonly minor gadolinium enhancement (volume, 1.2 cm3) and areaof mildly increased 11C-MET uptake (volume, 5.7 cm3; factor,1.6). Mucosa and cranial bone marrow show intense 18F-FLTuptake, whereas 18F-FLT background in normal brain is low.
FIGURE 3. Two examples of complementary information on activity and extent of tumor as depicted by multimodal imaging. (A)A 49-y-old woman with recurrent glioblastoma that had been treated by operation, radiation, and 5 cycles of temozolomide. 18F-FLTseems to depict some extension of tumor toward internal capsule and thalamus that was not clearly depicted by gadolinium MRIand 11C-MET PET. Contours on MRI depict tumor extent as measured by 18F-FLT PET; contours on 11C-MET and 18F-FLT PETdepict tumor extent as measured by gadolinium enhancement. (B) A 58-y-old woman with WHO grade III ganglioglioma. High tumoractivity is depicted by high 18F-FLT uptake (uptake ratio, 13.0; SUV, 3.0), which exceeds involvement shown by gadoliniumenhancement to lateral side (volume, 40 cm3 vs. 14.4 cm3). 11C-MET PET shows even further extension of tumor toward pole oftemporal lobe. Contours on MRI depict tumor extent as measured by 18F-FLT PET; contours on 18F-FLT PET depict tumor extentas measured by gadolinium enhancement.
1952 THE JOURNAL OF NUCLEAR MEDICINE • Vol. 46 • No. 12 • December 2005
These data indicate that both 18F-FLT PET and 11C-METPET can detect tumor regions that are not detected bygadolinium-enhanced MRI.
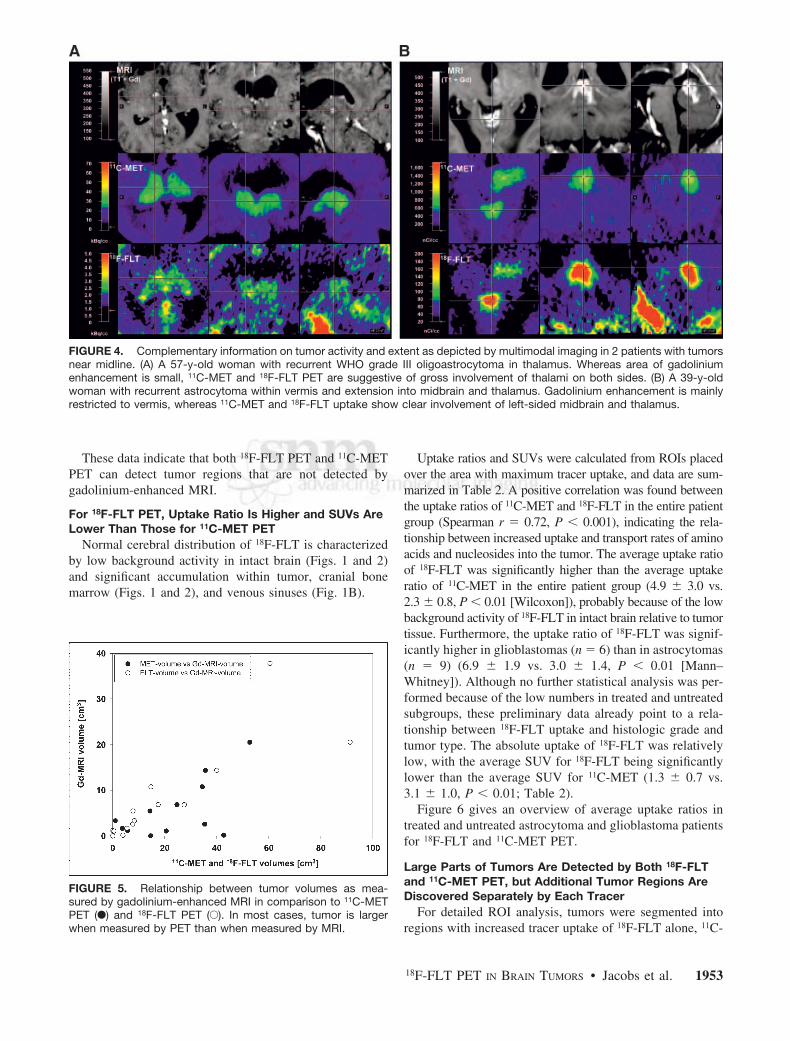
For 18F-FLT PET, Uptake Ratio Is Higher and SUVs AreLower Than Those for 11C-MET PET
Normal cerebral distribution of 18F-FLT is characterizedby low background activity in intact brain (Figs. 1 and 2)and significant accumulation within tumor, cranial bonemarrow (Figs. 1 and 2), and venous sinuses (Fig. 1B).
Uptake ratios and SUVs were calculated from ROIs placedover the area with maximum tracer uptake, and data are sum-marized in Table 2. A positive correlation was found betweenthe uptake ratios of 11C-MET and 18F-FLT in the entire patientgroup (Spearman r � 0.72, P � 0.001), indicating the rela-tionship between increased uptake and transport rates of aminoacids and nucleosides into the tumor. The average uptake ratioof 18F-FLT was significantly higher than the average uptakeratio of 11C-MET in the entire patient group (4.9 � 3.0 vs.2.3 � 0.8, P � 0.01 [Wilcoxon]), probably because of the lowbackground activity of 18F-FLT in intact brain relative to tumortissue. Furthermore, the uptake ratio of 18F-FLT was signif-icantly higher in glioblastomas (n � 6) than in astrocytomas(n � 9) (6.9 � 1.9 vs. 3.0 � 1.4, P � 0.01 [Mann–Whitney]). Although no further statistical analysis was per-formed because of the low numbers in treated and untreatedsubgroups, these preliminary data already point to a rela-tionship between 18F-FLT uptake and histologic grade andtumor type. The absolute uptake of 18F-FLT was relativelylow, with the average SUV for 18F-FLT being significantlylower than the average SUV for 11C-MET (1.3 � 0.7 vs.3.1 � 1.0, P � 0.01; Table 2).
Figure 6 gives an overview of average uptake ratios intreated and untreated astrocytoma and glioblastoma patientsfor 18F-FLT and 11C-MET PET.
Large Parts of Tumors Are Detected by Both 18F-FLTand 11C-MET PET, but Additional Tumor Regions AreDiscovered Separately by Each Tracer
For detailed ROI analysis, tumors were segmented intoregions with increased tracer uptake of 18F-FLT alone, 11C-
FIGURE 4. Complementary information on tumor activity and extent as depicted by multimodal imaging in 2 patients with tumorsnear midline. (A) A 57-y-old woman with recurrent WHO grade III oligoastrocytoma in thalamus. Whereas area of gadoliniumenhancement is small, 11C-MET and 18F-FLT PET are suggestive of gross involvement of thalami on both sides. (B) A 39-y-oldwoman with recurrent astrocytoma within vermis and extension into midbrain and thalamus. Gadolinium enhancement is mainlyrestricted to vermis, whereas 11C-MET and 18F-FLT uptake show clear involvement of left-sided midbrain and thalamus.
FIGURE 5. Relationship between tumor volumes as mea-sured by gadolinium-enhanced MRI in comparison to 11C-METPET (F) and 18F-FLT PET (E). In most cases, tumor is largerwhen measured by PET than when measured by MRI.
18F-FLT PET IN BRAIN TUMORS • Jacobs et al. 1953

MET alone, gadolinium-DTPA alone, or a combination ofthese using irregularly shaped ROIs. Because of differencesin ROI size, the average of the ROIs placed over intact grayand white matter was used as the reference region. Forcomparison of tumor regions with known highly prolifera-tive tissue, a circular ROI was placed on the nasal mucosa.Uptake ratios for detailed ROIs were then calculated asalready described.
High proliferative activity in the nasal mucosa was re-flected in a significantly higher uptake ratio for 18F-FLTthan for 11C-MET (P � 0.001 [Wilcoxon]).
A mean of 2.4 � 1.0 (range, 1–4) different ROIs weredefined in the tumor tissue of 21 patients, and a total of 50ROIs were evaluated. Regions positive for both PET tracerswere identified in most tumors (gadolinium, 18F-FLT, and11C-MET: n � 11; 18F-FLT and 11C-MET: n � 12). In theseregions, the uptake ratios for 18F-FLT were significantlyhigher than those for 11C-MET (P � 0.01 [Wilcoxon];gadolinium, 18F-FLT, and 11C-MET: 5.8 � 3.0 vs. 2.3 �0.8; 18F-FLT and 11C-MET: 4.0 � 2.0 vs. 2.3 � 0.7). In 13patients, circumscribed tumor regions were detected by11C-MET PET only. As expected in these ROIs, uptakeratios for 11C-MET were significantly higher than those for18F-FLT (2.0 � 0.4 vs. 1.6 � 0.4, P � 0.01 [Wilcoxon]). In7 patients, certain tumor regions were positive on 18F-FLTPET only (3.4 � 1.4 vs. 1.1 � 0.3, P � 0.05 [Wilcoxon]).In the ROIs for gadolinium (n � 1) and gadolinium-18F-FLT (n � 2), as well as in tumor necrosis (n � 4), uptakeratios for 18F-FLT and 11C-MET were not significantlydifferent, most probably because of low sample numbers.
These data indicate that 18F-FLT and 11C-MET detectmainly the same tumor regions, although there are regionsdetectable only by either 18F-FLT or 11C-MET (Figs. 3 and4). Furthermore, the presence of regions positive for therespective PET tracer but not showing gadolinium enhance-ment implies that both 18F-FLT and 11C-MET can detecttumor regions that do not present with gross destruction ofthe blood–brain barrier as shown by gadolinium-enhancedMRI.
18F-FLT Uptake in Tumor Seems to Be Due to HighTransport and Net Influx but Correlates withPhosphorylation Rate by TK1
A representative example of the kinetic analysis is givenin Figure 7. 18F-FLT-derived radioactivity in the tumorregion peaks in the first 2 min and declines rapidly in thenext 5 min, thereafter staying at constant levels (Fig. 7A)that are higher than the radioactivity levels in blood (Fig.7B) and in the contralateral control region (Fig. 7C). In thekinetic analysis, the 3-compartment model provided a sig-nificantly better fit of the data than did the 2-compartmentmodel. Tumor regions were significantly different from thereference region in blood volume, most probably because ofhigher vascularization of tumor tissue (Tables 3 and 4).Furthermore, Ki and K1 differed significantly, indicative ofa higher transport and net influx of 18F-FLT into tumortissue. Kinetic analysis revealed no significant differencesin k3 between tumor and normal brain (Tables 3 and 4).Kinetic analysis including a k4 revealed a significant dif-
FIGURE 6. Comparison of uptake ratios for 18F-FLT (A) and 11C-MET (B) in treated and untreated astrocytomas and glioblas-tomas. Uptake ratios of untreated tumors tend to increase with WHO grade. Uptake ratios vary more in treated tumors, mostprobably because of tissue alterations in response to therapy. NT � no therapy before study inclusion; T � therapy before studyinclusion.
1954 THE JOURNAL OF NUCLEAR MEDICINE • Vol. 46 • No. 12 • December 2005
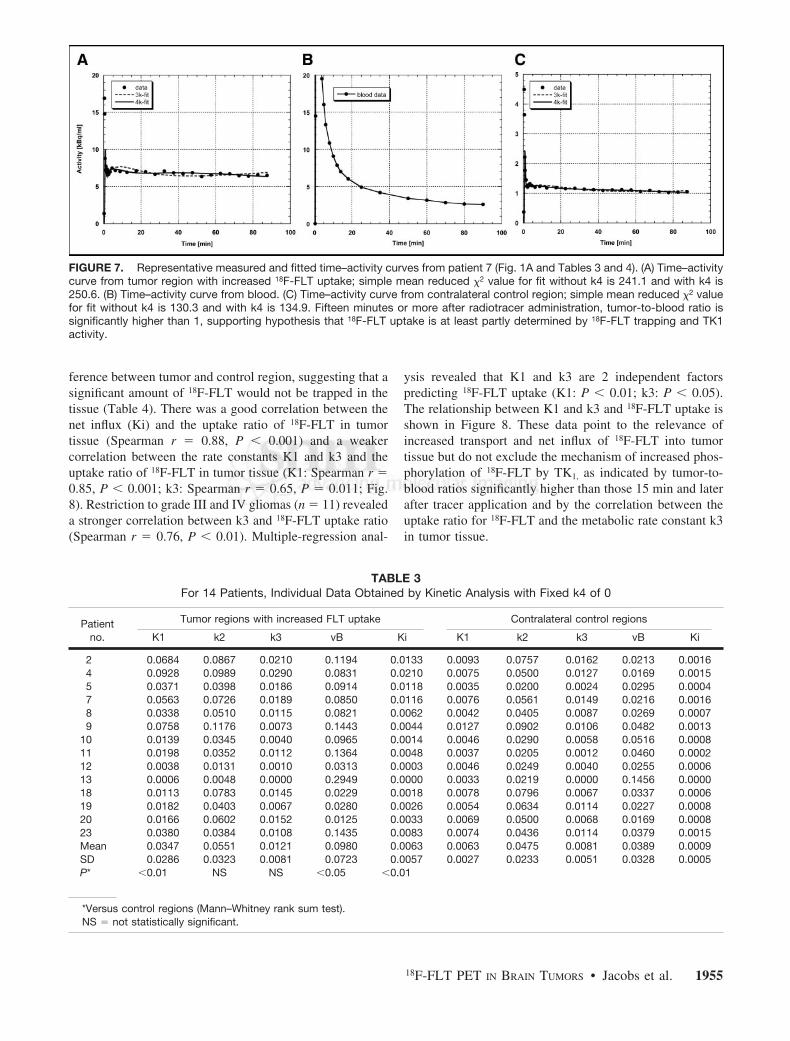
ference between tumor and control region, suggesting that asignificant amount of 18F-FLT would not be trapped in thetissue (Table 4). There was a good correlation between thenet influx (Ki) and the uptake ratio of 18F-FLT in tumortissue (Spearman r � 0.88, P � 0.001) and a weakercorrelation between the rate constants K1 and k3 and theuptake ratio of 18F-FLT in tumor tissue (K1: Spearman r �0.85, P � 0.001; k3: Spearman r � 0.65, P � 0.011; Fig.8). Restriction to grade III and IV gliomas (n � 11) revealeda stronger correlation between k3 and 18F-FLT uptake ratio(Spearman r � 0.76, P � 0.01). Multiple-regression anal-
ysis revealed that K1 and k3 are 2 independent factorspredicting 18F-FLT uptake (K1: P � 0.01; k3: P � 0.05).The relationship between K1 and k3 and 18F-FLT uptake isshown in Figure 8. These data point to the relevance ofincreased transport and net influx of 18F-FLT into tumortissue but do not exclude the mechanism of increased phos-phorylation of 18F-FLT by TK1, as indicated by tumor-to-blood ratios significantly higher than those 15 min and laterafter tracer application and by the correlation between theuptake ratio for 18F-FLT and the metabolic rate constant k3in tumor tissue.
FIGURE 7. Representative measured and fitted time–activity curves from patient 7 (Fig. 1A and Tables 3 and 4). (A) Time–activitycurve from tumor region with increased 18F-FLT uptake; simple mean reduced �2 value for fit without k4 is 241.1 and with k4 is250.6. (B) Time–activity curve from blood. (C) Time–activity curve from contralateral control region; simple mean reduced �2 valuefor fit without k4 is 130.3 and with k4 is 134.9. Fifteen minutes or more after radiotracer administration, tumor-to-blood ratio issignificantly higher than 1, supporting hypothesis that 18F-FLT uptake is at least partly determined by 18F-FLT trapping and TK1activity.
TABLE 3For 14 Patients, Individual Data Obtained by Kinetic Analysis with Fixed k4 of 0
Patientno.
Tumor regions with increased FLT uptake Contralateral control regions
K1 k2 k3 vB Ki K1 k2 k3 vB Ki
2 0.0684 0.0867 0.0210 0.1194 0.0133 0.0093 0.0757 0.0162 0.0213 0.00164 0.0928 0.0989 0.0290 0.0831 0.0210 0.0075 0.0500 0.0127 0.0169 0.00155 0.0371 0.0398 0.0186 0.0914 0.0118 0.0035 0.0200 0.0024 0.0295 0.00047 0.0563 0.0726 0.0189 0.0850 0.0116 0.0076 0.0561 0.0149 0.0216 0.00168 0.0338 0.0510 0.0115 0.0821 0.0062 0.0042 0.0405 0.0087 0.0269 0.00079 0.0758 0.1176 0.0073 0.1443 0.0044 0.0127 0.0902 0.0106 0.0482 0.0013
10 0.0139 0.0345 0.0040 0.0965 0.0014 0.0046 0.0290 0.0058 0.0516 0.000811 0.0198 0.0352 0.0112 0.1364 0.0048 0.0037 0.0205 0.0012 0.0460 0.000212 0.0038 0.0131 0.0010 0.0313 0.0003 0.0046 0.0249 0.0040 0.0255 0.000613 0.0006 0.0048 0.0000 0.2949 0.0000 0.0033 0.0219 0.0000 0.1456 0.000018 0.0113 0.0783 0.0145 0.0229 0.0018 0.0078 0.0796 0.0067 0.0337 0.000619 0.0182 0.0403 0.0067 0.0280 0.0026 0.0054 0.0634 0.0114 0.0227 0.000820 0.0166 0.0602 0.0152 0.0125 0.0033 0.0069 0.0500 0.0068 0.0169 0.000823 0.0380 0.0384 0.0108 0.1435 0.0083 0.0074 0.0436 0.0114 0.0379 0.0015Mean 0.0347 0.0551 0.0121 0.0980 0.0063 0.0063 0.0475 0.0081 0.0389 0.0009SD 0.0286 0.0323 0.0081 0.0723 0.0057 0.0027 0.0233 0.0051 0.0328 0.0005P* �0.01 NS NS �0.05 �0.01
*Versus control regions (Mann–Whitney rank sum test).NS � not statistically significant.
18F-FLT PET IN BRAIN TUMORS • Jacobs et al. 1955
Tables 3 and 4 give the individual data of the kineticanalysis obtained from the tumor and reference regions of14 patients with and without inclusion of k4.
DISCUSSION
To our knowledge, this is the first clinical study to includekinetic modeling in a systematic comparison of 18F-FLTPET with 11C-MET PET in human gliomas. We demon-strate, first, that absolute uptake of 18F-FLT is lower thanthat of 11C-MET (SUV, 1.3 � 0.7 vs. 3.1 � 1.0) and that theuptake ratios for tumor to normal brain are higher (4.9 � 3.0vs. 2.3 � 0.8) because of the low uptake of 18F-FLT in
normal brain; second, that sensitivity for the detection oftumor is lower for 18F-FLT than for 11C-MET (78.3% vs.91.3%), especially in low-grade gliomas; third, that in in-dividual patients, 18F-FLT, 11C-MET PET, and gadolinium-enhanced MRI give complementary information on the trueextent of the tumor; fourth, that 18F-FLT is taken up pre-dominantly in tumor regions with a disrupted blood–brainbarrier; and fifth, that a variable combination of differentprocesses, such as increased transport and phosphorylationand blood–brain barrier disruption, leads to 18F-FLT accu-mulation.
For the management of malignant gliomas, it is of theutmost importance to detect those areas where the tumorprogresses into the neighboring tissue, because recurrenceof the tumor—and the fate of the patient—highly dependson the extent and activity of this proliferation zone. Thisarea should therefore be the main target of invasive diag-nostic and therapeutic strategies. Often, these regions can-not be clearly distinguished from edema or necrosis bymorphologic imaging modalities such as CT or MRI, andthey may escape detection by 18F-FDG PET because of thehigh-energy metabolism of normal gray matter obscuringsubtle increases of 18F-FDG uptake in tumorous tissue withlow cellular density (22). 11C-MET therefore has been in-troduced to better delineate the extent of gliomas because itsselective transport into tumorous tissue results in a highcontrast to normal brain where uptake of this tracer is low.However, the short half-life of this tracer does not permitevaluation of protein synthesis, and therefore, the increaseduptake is probably related more to microvessel density (5)than to cellular proliferation. Labeled nucleotides, such as
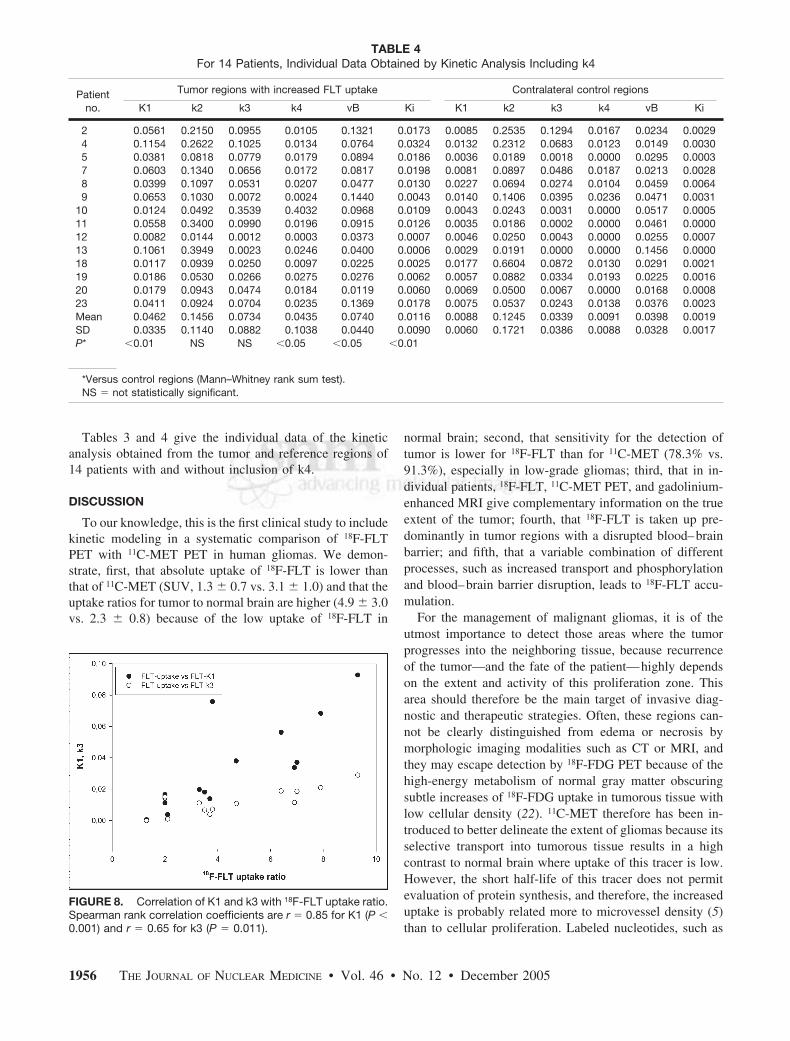
TABLE 4For 14 Patients, Individual Data Obtained by Kinetic Analysis Including k4
Patientno.
Tumor regions with increased FLT uptake Contralateral control regions
K1 k2 k3 k4 vB Ki K1 k2 k3 k4 vB Ki
2 0.0561 0.2150 0.0955 0.0105 0.1321 0.0173 0.0085 0.2535 0.1294 0.0167 0.0234 0.00294 0.1154 0.2622 0.1025 0.0134 0.0764 0.0324 0.0132 0.2312 0.0683 0.0123 0.0149 0.00305 0.0381 0.0818 0.0779 0.0179 0.0894 0.0186 0.0036 0.0189 0.0018 0.0000 0.0295 0.00037 0.0603 0.1340 0.0656 0.0172 0.0817 0.0198 0.0081 0.0897 0.0486 0.0187 0.0213 0.00288 0.0399 0.1097 0.0531 0.0207 0.0477 0.0130 0.0227 0.0694 0.0274 0.0104 0.0459 0.00649 0.0653 0.1030 0.0072 0.0024 0.1440 0.0043 0.0140 0.1406 0.0395 0.0236 0.0471 0.0031
10 0.0124 0.0492 0.3539 0.4032 0.0968 0.0109 0.0043 0.0243 0.0031 0.0000 0.0517 0.000511 0.0558 0.3400 0.0990 0.0196 0.0915 0.0126 0.0035 0.0186 0.0002 0.0000 0.0461 0.000012 0.0082 0.0144 0.0012 0.0003 0.0373 0.0007 0.0046 0.0250 0.0043 0.0000 0.0255 0.000713 0.1061 0.3949 0.0023 0.0246 0.0400 0.0006 0.0029 0.0191 0.0000 0.0000 0.1456 0.000018 0.0117 0.0939 0.0250 0.0097 0.0225 0.0025 0.0177 0.6604 0.0872 0.0130 0.0291 0.002119 0.0186 0.0530 0.0266 0.0275 0.0276 0.0062 0.0057 0.0882 0.0334 0.0193 0.0225 0.001620 0.0179 0.0943 0.0474 0.0184 0.0119 0.0060 0.0069 0.0500 0.0067 0.0000 0.0168 0.000823 0.0411 0.0924 0.0704 0.0235 0.1369 0.0178 0.0075 0.0537 0.0243 0.0138 0.0376 0.0023Mean 0.0462 0.1456 0.0734 0.0435 0.0740 0.0116 0.0088 0.1245 0.0339 0.0091 0.0398 0.0019SD 0.0335 0.1140 0.0882 0.1038 0.0440 0.0090 0.0060 0.1721 0.0386 0.0088 0.0328 0.0017P* �0.01 NS NS �0.05 �0.05 �0.01
*Versus control regions (Mann–Whitney rank sum test).NS � not statistically significant.
FIGURE 8. Correlation of K1 and k3 with 18F-FLT uptake ratio.Spearman rank correlation coefficients are r � 0.85 for K1 (P �0.001) and r � 0.65 for k3 (P � 0.011).
1956 THE JOURNAL OF NUCLEAR MEDICINE • Vol. 46 • No. 12 • December 2005
tritiated thymidine, have been widely used in experimentalmodels to quantitate tumor DNA synthesis (23). Moreover,11C-thymidine was shown to be especially useful as animaging agent for determining tumor proliferation (24), butthe short half-life and the necessary complex analysis ofdata due to large amounts of labeled molecules limited theapplication of this tracer in the clinical workup of patientswith brain tumors. With 18F-FLT, a tracer was introduced(6) that has a half-life well suited for clinical application.Additionally, trapping of the product phosphorylated bythymidine kinase, the target enzyme, permits the analysis ofaccumulation kinetics in a 3-compartment model. The highcorrelation to thymidine uptake suggests that 18F-FLT ac-cumulation is a reliable measure of the salvage pathway ofDNA synthesis (15,25). As a consequence, this compoundhas found many applications in oncology (26) and, despitesome limitations, is widely accepted as a marker for tumorcell proliferation. However, despite the advantage of a lowuptake of 18F-FLT in normal brain, only a few studies onbrain tumors have been reported.
The most detailed analysis so far was one recently re-ported on 25 patients with newly diagnosed (n � 7) orpreviously treated (n � 18) glioma. The study used 18F-FLTand 18F-FDG PET, as well as Ki-67 staining in a subgroupof patients (27). This study showed a rapid 18F-FLT uptake,peaking at 5–10 min after application and remaining stableup to 75 min; excellent delineation of WHO grades III andIV tumors, with low absolute uptake (mean SUV, 1.33) butexcellent image contrast (tumor-to-normal ratio, 3.85); noappreciable 18F-FLT uptake in WHO grade II gliomas andstable lesions; and a high correlation of 18F-FLT SUV withKi-67 expression as an indication that 18F-FLT is a surro-gate marker for tumor proliferation in high-grade gliomas(27). Our results are in accordance with the findings of Chenet al. (27) with regard to low SUV, low uptake in normalbrain, and resulting high tumor-to-normal ratios. Moreover,our study, in being the first to compare 18F-FLT uptake with11C-MET uptake, apply kinetic analysis to the 3-compart-ment model of 18F-FLT uptake in a larger group of patientswith various gliomas, and differentiate between transportand increased tracer retention associated with tumor prolif-eration, extends these findings. Our results also extendprevious findings with 2-11C-thymidine applying sequential11C-CO2 and 11C-thymidine scans and analysis of filtereddata in a 5-compartment model (24,28). Two types of tissuecompartments could be identified by the 3 imaging param-eters: tissue compartments with elevated gadolinium en-hancement, elevated 11C-MET uptake, and elevated 18F-FLTuptake (here, disruption of the blood–brain barrier is themost likely cause of 11C-MET and 18F-FLT uptake) andtissue compartments with positive 11C-MET and 18F-FLTuptake and without obvious disruption of the blood–brainbarrier, at least not as depicted by gadolinium-enhancedMRI (here, 18F-FLT and 11C-MET uptake is most likely dueto increased transport of nucleosides and amino acids intothe tumor). The facts that k2 is not significantly different
between tumor and control regions and that k3 correlateswith FLT uptake suggests that phosphorylation and trappingalso play a role in 18F-FLT uptake. In summary, the regionaldistribution of 18F-FLT uptake with and without positivecontrast enhancement on MRI and with and without accu-mulation of 11C-MET suggests the presence of various tis-sue compartments in which 18F-FLT accumulation is due tothe breakdown of the blood–brain barrier, increased trans-port, increased proliferation, or a variable combination ofthese components.
In all positive tumors, the gadolinium-enhanced volumeson MRI were smaller than the volumes with significantlyincreased accumulation of 18F-FLT or 11C-MET, indicatingan increased transport of these tracers into active tumoroustissue even before the blood–brain barrier breaks downsubstantially. Because the transport characteristics of fluor-inated nucleosides would not lead one to expect a substan-tial uptake without a disrupted blood–brain barrier, ourfindings might also suggest 18F-FLT as the more sensitivemarker for blood–brain barrier disruption, and it may wellbe that subtle blood–brain barrier leakage is not depicted asgadolinium enhancement and 3-dimensional volumetry.Nevertheless, for both tracers a correlation between theincreased transport and the proliferation rate has been dem-onstrated (2–4,6,28). Because k3 showed no statisticallysignificant difference between tumor and control region, ourdata do not permit the clear conclusion that 18F-FLT accu-mulates significantly in gliomas as a consequence of phos-phorylation and irreversible trapping in proliferating cells.With k3 values significantly greater than zero in the controlregion, our data may even suggest Ki as the more robustparameter, in which case the normal brain is very low.However, because we observed a significant correlationbetween the uptake ratio of 18F-FLT and the metabolic rateconstants K1 and k3 (Fig. 8), these data indicate that FLTuptake is due to a combination of factors, including in-creased transport and phosphorylation. Including a k4 in ouranalysis minimally altered the goodness of fit (Fig. 7), butwhether k4 plays a substantial role is unresolved and de-serves further investigation.
In some tumor regions, 18F-FLT does not accumulatedespite increased uptake of 11C-MET. This discrepancymight be due to the selectivity of thymidine kinase as thetarget of 18F-FLT for the salvage pathway of DNA synthesis(15,25,29). In tumor cell lines using de novo DNA synthe-sis, the proliferation rate might be underestimated by thistracer (30). The fact that this patient population was heter-ogeneous, with 9 of 23 patients pretreated by radiationtherapy, might have had some influence on the state ofthe blood–brain barrier with subsequent alteration of 18F-FLT uptake.
CONCLUSION
This study demonstrated that 18F-FLT is a promisingtracer for the detection and characterization of brain tumors.
18F-FLT PET IN BRAIN TUMORS • Jacobs et al. 1957

Compared with 18F-FDG, 18F-FLT has the advantage ofhigh uptake in tumors in relation to the low background innormal brain tissue. Compared with 11C-MET, the longerhalf-life of 18F-FLT permits the follow-up of increasedtransport into tumor cells. Our preliminary data in a rela-tively small and heterogeneous patient population do notsupport the clear conclusion that analysis of glioma cellproliferation, which is the target for evaluation of earlytreatment effects in humans, is possible. However, the studyindicated that 18F-FLT uptake differentiates low-grade fromhigh-grade gliomas; that 18F-FLT uptake is due to a com-bination of factors, including increased transport and phos-phorylation; and that 18F-FLT PET might provide informa-tion on the extent and activity of a glioma additional to thatprovided by MRI and 11C-MET. Further studies might findfeasible the determination of typical signatures of variousbrain tumors and the assessment of the value of 18F-FLT asa tracer for early evaluation of treatment effects in patientswith gliomas.
ACKNOWLEDGMENTS
This work was supported in part by the Deutsche For-schungsgemeinschaft (DFG-Ja98/1-2); Ministerium furSchule, Wissenschaft und Forschung NRW (MSWF 516-40000299); Center for Molecular Medicine Cologne(CMMC-TV46); Max-Planck Society; and 6th FW EUgrant EMIL (LSHC-CT-2004-503569).
REFERENCES
1. Jacobs AH, Dittmar C, Winkeler A, Garlip G, Heiss WD. Molecular imaging ofgliomas. Mol Imaging. 2002;1:309–335.
2. Chung JK, Kim YK, Kim SK, et al. Usefulness of 11C-methionine PET in theevaluation of brain lesions that are hypo- or isometabolic on 18F-FDG PET. EurJ Nucl Med Mol Imaging. 2002;29:176–182.
3. Langen KJ, Muhlensiepen H, Holschbach M, Hautzel H, Jansen P, Coenen HH.Transport mechanisms of 3-[123I]iodo-alpha-methyl-L-tyrosine in a human gli-oma cell line: comparison with [3H]methyl]-L-methionine. J Nucl Med. 2000;41:1250–1255.
4. Sato N, Suzuki M, Kuwata N, et al. Evaluation of the malignancy of glioma using11C-methionine positron emission tomography and proliferating cell nuclearantigen staining. Neurosurg Rev. 1999;22:210–214.
5. Kracht LW, Friese M, Herholz K, et al. Methyl-[11C]-l-methionine uptake asmeasured by positron emission tomography correlates to microvessel density inpatients with glioma. Eur J Nucl Med Mol Imaging. 2003;30:868–873.
6. Shields AF, Grierson JR, Dohmen BM, et al. Imaging proliferation in vivo with[F-18]FLT and positron emission tomography. Nat Med. 1998;4:1334–1336.
7. Kong XB, Zhu QY, Vidal PM, et al. Comparisons of anti-human immunodefi-ciency virus activities, cellular transport, and plasma and intracellular pharma-cokinetics of 3�-fluoro-3�-deoxythymidine and 3�-azido-3�-deoxythymidine. An-timicrob Agents Chemother. 1992;36:808–818.
8. Sherley JL, Kelly TJ. Regulation of human thymidine kinase during the cellcycle. J Biol Chem. 1988;263:8350–8358.
9. Hengstschlager M, Knofler M, Mullner EW, Ogris E, Wintersberger E, Wawra E.
Different regulation of thymidine kinase during the cell cycle of normal versusDNA tumor virus-transformed cells. J Biol Chem. 1994;269:13836–13842.
10. Toyohara J, Waki A, Takamatsu S, Yonekura Y, Magata Y, Fujibayashi Y. Basisof FLT as a cell proliferation marker: comparative uptake studies with [3H]thy-midine and [3H]arabinothymidine, and cell-analysis in 22 asynchronously grow-ing tumor cell lines. Nucl Med Biol. 2002;29:281–287.
11. Buck AK, Schirrmeister H, Hetzel M, et al. 3-deoxy-3-[(18)F]fluorothymidine-positron emission tomography for noninvasive assessment of proliferation inpulmonary nodules. Cancer Res. 2002;62:3331–3334.
12. Cobben DC, Jager PL, Elsinga PH, Maas B, Suurmeijer AJ, Hoekstra HJ.3�-18F-fluoro-3�-deoxy-L-thymidine: a new tracer for staging metastatic mela-noma? J Nucl Med. 2003;44:1927–1932.
13. Francis DL, Visvikis D, Costa DC, et al. Potential impact of [18F]3�-deoxy-3�-fluorothymidine versus [18F]fluoro-2-deoxy-D-glucose in positron emission to-mography for colorectal cancer. Eur J Nucl Med Mol Imaging. 2003;30:988–994.
14. Wagner M, Seitz U, Buck A, et al. 3�-[18F]fluoro-3�-deoxythymidine ([18F]-FLT)as positron emission tomography tracer for imaging proliferation in a murineB-cell lymphoma model and in the human disease. Cancer Res. 2003;632681–2687.
15. Rasey JS, Grierson JR, Wiens LW, Kolb PD, Schwartz JL. Validation of FLTuptake as a measure of thymidine kinase-1 activity in A549 carcinoma cells.J Nucl Med. 2002;43:1210–1217.
16. Machulla HJ, Blocher A, Kuntzsch M, Piert M, Wei R, Grierson JR. Simplifiedlabeling approach for synthesizing 3�-deoxy-3�-[18F]fluorothymidine ([18F]FLT).J Radioanal Nucl Chem. 2000;243:843–846.
17. Wodarski C, Eisenbarth J, Weber K, Henze M, Haberkorn U, Eisenhut M.Synthesis of 3�-deoxy-3�-[18F]fluoro-thymidine with 2,3�-anhydro-5�-O-(4,4�-di-methoxytrityl)-thymidine. J Labelled Compds Radiopharm. 2000;43:1211–1218.
18. Kracht LW, Miletic H, Busch S, et al. Delineation of brain tumor extent with[11C]L-methionine positron emission tomography: local comparison with stereo-tactic histopathology. Clin Cancer Res. 2004;10:7163–7170.
19. Herholz K, Holzer T, Bauer B, et al. 11C-Methionine PET for differentialdiagnosis of low-grade gliomas. Neurology. 1998;50:1316–1322.
20. Shields AF, Grierson JR, Muzik O, et al. Kinetics of 3�-deoxy-3�-[F-18]fluoro-thymidine uptake and retention in dogs. Mol Imaging Biol. 2002;4:83–89.
21. Visvikis D, Francis D, Mulligan R, et al. Comparison of methodologies for the invivo assessment of 18FLT utilisation in colorectal cancer. Eur J Nucl Med MolImaging. 2004;31:169–178.
22. Herholz K, Pietrzyk U, Voges J, et al. Correlation of glucose consumption andtumor cell density in astrocytomas: a stereotactic PET study. J Neurosurg.1993;79:853–858.
23. Livingston RB, Hart JS. The clinical applications of cell kinetics in cancertherapy. Annu Rev Pharmacol Toxicol. 1977;17:529–543.
24. Eary JF, Mankoff DA, Spence AM, et al. 2-[C-11]thymidine imaging of malig-nant brain tumors. Cancer Res. 1999;59:615–621.
25. Schwartz JL, Tamura Y, Jordan R, Grierson JR, Krohn KA. Monitoring tumorcell proliferation by targeting DNA synthetic processes with thymidine andthymidine analogs. J Nucl Med. 2003;44:2027–2032.
26. Been LB, Suurmeijer AJ, Cobben DC, Jager PL, Hoekstra HJ, Elsinga PH.[(18)F]FLT-PET in oncology: current status and opportunities. Eur J Nucl MedMol Imaging. 2004;31:1659–1672.
27. Chen W, Cloughesy T, Kamdar N, et al. Imaging proliferation in brain tumorswith 18F-FLT PET: comparison with 18F-FDG. J Nucl Med. 2005;46:945–952.
28. Wells JM, Mankoff DA, Eary JF, et al. Kinetic analysis of 2-[11C]thymidine PETimaging studies of malignant brain tumors: preliminary patient results. MolImaging. 2002;1:145–150.
29. Dittmann H, Dohmen BM, Kehlbach R, et al. Early changes in [18F]FLT uptakeafter chemotherapy: an experimental study. Eur J Nucl Med Mol Imaging.2002;29:1462–1469.
30. Spyratos F, Ferrero-Pous M, Trassard M, et al. Correlation between MIB-1 andother proliferation markers: clinical implications of the MIB-1 cutoff value.Cancer. 2002;94:2151–2159.
1958 THE JOURNAL OF NUCLEAR MEDICINE • Vol. 46 • No. 12 • December 2005


![Parametric [11c]flumazenil images 3.pdf · Parametric [11C]flumazenil images | 51INTRODUCTION [11C]Flumazenil (FMZ) is a well known positron emission tomography (PET) tracer, which](https://static.fdocuments.us/doc/165x107/5e6cc96120477523c50be581/parametric-11cflumazenil-images-3pdf-parametric-11cflumazenil-images-51introduction.jpg)


![Preclinical evidence that 3'-Deoxy-3'-[18F]Fluorothymidine ...cancerres.aacrjournals.org/content/canres/early/2016/10/20/0008... · 1 Preclinical evidence that 3'-Deoxy-3'-[18F]Fluorothymidine](https://static.fdocuments.us/doc/165x107/5a79e6197f8b9a5c3a8dd3c9/preclinical-evidence-that-3-deoxy-3-18ffluorothymidine-preclinical-evidence.jpg)


![Serial [18F]Fluorothymidine (FLT)PET/CT as a Biomarker of ...](https://static.fdocuments.us/doc/165x107/618c5455bb5093755a3be15e/serial-18ffluorothymidine-fltpetct-as-a-biomarker-of-.jpg)