
1187 Corniche El Nil - Cairo Annual Report
190
Annual Report
Transcript of 1187 Corniche El Nil - Cairo Annual Report

Annual Report1187 Corniche El Nil - Cairo
Tel.: 25945000 - Fax: 25945137www.nbe.com.eg


6ABOUT US
8OUR MISSION
10BOARD OF DIRECTORS
14CHAIRMAN’S STATEMENT
16OUR STRATEGY
18PERFORMANCE AS OF JUNE 2019
23OVERVIEW OF KEY OPERATIONS
CONTENTS
CONTENTS
4

44BALANCE SHEET AS OF JUNE 30, 2019
45INCOME STATEMENT
46DIVIDENDS
47CASH FLOW STATEMENT
50CHANGES IN SHAREHOLDERS’ EQUITY
54NOTES TO THE FINANCIAL STATEMENTS
134NBE PRESENCE WORLDWIDE
140SOCIAL RESPONSIBILITY
2018 / 20192018 / 2019 5

The National Bank of Egypt (NBE) is the oldest commercial bank in Egypt. Since its establishment in June 1898 with a capital of GBP 1 mn, NBE has never been indifferent to Egypt’s causes or concerns. For more than a hundred years, it has been the lead supporter of Egypt’s national economy through its contribution to the finance of national mega projects.
Throughout its long history, NBE’s functions and roles have continually developed in line with the economic and political changes that Egypt has witnessed. Since its inauguration, NBE was responsible for issuing banknotes and running the government’s accounts. During the 1950s, NBE assumed the central bank’s duties. Besides carrying out the functions of the central bank in the areas where the latter had no branches, in the 1960s, it acted purely as a commercial bank. Moreover, since the mid-1960s, NBE has been in charge of issuing and managing savings certificates on behalf of the government. NBE commands market shares of 29.2% of total assets, 29.3% of total deposits, and 29.5% of total loans in the Egyptian banking sector.
NBE has one of the largest network of branches, offices, and units, totaling 483 nationwide. In addition, NBE has a vital presence in most continents such as National Bank of Egypt (UK) Limited, National Bank of Egypt – Khartoum (the Republic of Sudan), its branches in New York (United States of America) and Shanghai (People’s Republic of China), and representative offices in Johannesburg (South Africa), Dubai (United Arab Emirates), and Addis Ababa (Republic of Ethiopia), besides NBE’s subsidiary, NBE-DIFC LTD, at Dubai International Financial Center, as well as a worldwide network of correspondent banks mostly located in Europe, Egypt’s largest trading partner.
NBE has always been keen to play an effective role in financial intermediation and financing various sectors, in addition to rendering up-to-date banking services and products that are perfectly tailored to meet its esteemed customers’s needs and demands with the aim to maintain their invaluable confidence and the Bank’s leadership in the local banking market. Additionally, the Bank constantly upgrades its branch network and e-channels while enhancing the skills of its human resources through a set of advanced training programs in Egypt and abroad.
ATMSNATIONWIDE
THE LARGEST MARKET SHARE OF TOTAL DEPOSITS IN THE BANKING
SECTOR29.2% 483 19,245
4,097POS
29.3%
THE LARGEST MARKET SHARE OF
TOTAL ASSETS IN THEBANKING SECTOR
NUMBER OF BRANCHES, OFFICES AND UNITS
(INCLUDING 4 ELECTRONIC SERVICE
BRANCHES)
About UsNational Bank of Egypt
6

2018 / 20192018 / 2019 7

“To remain the leading entity in the Egyptian banking sector. It aims to maximize the efficiency of financial intermediation and promote financial inclusion while safeguarding depositors’ funds and maximizing returns to shareholders. This in return supports the development of the national economy and enhances the stability of the financial system.”
OurMission
8

2018 / 20192018 / 2019 9

Board of Directors
10

2018 / 20192018 / 2019 11

Hisham Ahmed Okasha
Chairman
Dalia Abdallah Mohamed El BazDeputy Chairman
Yehia Abou El-Fotouh IbrahimDeputy Chairman
12

Gaber Gad NassarBoard Member
Ahmed Mohamed HelmyBoard Member
Tarek Fathy Abdel-halim KandilBoard Member
Sahar Mohamed Ali El-salabBoard Member
Ali Fahmy Ibrahim ElSaiediBoard Member
Ali Mohamed Ali FaramawyBoard Member
2018 / 20192018 / 2019 13

On behalf of myself and NBE’s board of directors, I present you with the annual report for the fiscal year 2018/2019, which reflected concerted efforts to maintain NBE’s leadership and firmly place it at the top of the banking sector. NBE realized unique results and remarkable achievements, reflecting its development strategy and targeted strategic pillars, which helped NBE spur growth rates and accomplish steady records. This reinforced NBE’s role as a major supporter of the state’s strategic trends, economic objectives, public policies, and relevant fiscal and economic reform trajectories and plans.
The Egyptian economy continued to reap the fruits of the economic reform program, restoring its position at international and regional levels. Egypt’s financial performance was commended by international institutions and applauded globally for the implemented fiscal and economic reforms. Egypt’s economy was rated among the best-performing emerging economies worldwide, and is forecasted to continue growing to compete with larger economies. Economic indicators reflect the robust performance achieved in the current fiscal year. GDP grew to a record 5.6% as of June 2019, compared to 5.3% YoY, and inflation fell to 9.4% as of June 2019 against 14.4% YoY. NBE managed to make noticeable progress in its pursuit to implement the diversification strategy, and was committed to achieving digitalization to sustain growth and prosperity in the future and to establish and adopt the “sustainable development” strategy in its policies and corporate practices. Furthermore, NBE embraced its social and environmental functions as an integral part of its valuable work.
At the level of financial results, NBE managed to achieve the highest profits among all banks operating in the Egyptian banking sector. Net profit before tax reached EGP 33.7 bn, while net profit after tax hit EGP 20.2 bn as of June 2019 against EGP 10.11 bn YoY, with a growth rate of 100%. Total financial position progressed by EGP 70.4 bn, to reach EGP 1.61 trillion as of June 2019 versus EGP 1.54 trillion YoY, with a growth rate of 4.6%. Shareholders’ equity rose to EGP 110 bn as of June 2019, compared to EGP 92 bn YoY. Moreover, NBE made a qualitative leap in total loan portfolio during the year under review to reach EGP 545 bn as of June 2019 against EGP 457 bn YoY, with a growth rate of 19% and a market share of 29.5%. Furthermore, deposits grew 15% in the current fiscal year to hit EGP 1.171 trillion as of June 2019, against EGP 1.015 trillion YoY, with a market share of 29.3%.
NBE’s extensive corporate loan portfolio reached EGP 413 bn as of June 2019 versus EGP 367.5 bn YoY, with a growth rate of 12.5%. Notably, NBE plays a significant role in creating a favorable investment environment in Egypt and in increasing growth opportunities for several projects in different major sectors, such as oil, power, electricity, gas, telecommunications, air transport, tourism,
and contracting. NBE had a prominent pioneering role in financing these sectors.
NBE’s achievements in financing large corporates were crowned by a number of awards, most notably:
According to Bloomberg’s assessment of banks’ performance in 2019, NBE ranked first in the Egyptian market in terms of loan syndication as an administrative agent, mandated lead arranger, and book runner. Moreover, NBE was awarded Best Trade Finance Provider in Egypt in 2018 by the Asian Banker, and Best Commercial Bank in North Africa in 2019 by Global Brands. NBE also won 14 awards from EMEA Finance as the top African bank in 2018 in terms of loan syndication, financial consultancies, restructuring, and securitization.
NBE continued to focus on SMEs, where total SMEs loan portfolio grew 32% as of June 2019 to reach EGP 58 bn. against EGP 44 bn YoY. Total SME portfolio customers accounted for 71,000, with an increase of 11,000 customers YoY and a monthly growth average of 952 customers. The portfolio comprised EGP 37.4 bn within the framework of CBE’s Small and Micro Enterprises Initiative, thus benefiting about 41,387 customers. Moreover, the industrial sector acquired 36% of SMEs portfolio, i.e., EGP 20.5 bn. Geographically, NBE expanded in all governorates, especially Upper Egypt, which grabbed 45% of total SME customers, amounting to 32,300 customers. To promote financial inclusion, NBE targeted microfinance brackets, where facilities were extended to five microfinance institutions (MFIs), with a total of EGP 2.2 bn.
The total retail banking portfolio grew 61% to account for EGP 73 bn as of June 2019, compared to EGP 45.5 bn YoY. Digitalization was the sector’s dominant strategic feature, where NBE opened the first electronic service branch in Egypt, bringing the number of electronic service branches to four. This is in addition to the electronic banking products which form a part of the Bank’s strategic plan. NBE launched new products and services, including NBE’s contactless cards, in coordination with global institutions. Moreover, NBE developed the payment and collection system by introducing QR Codes in electronic wallets to be used by customers and merchants. NBE also expanded in electronic wallet services, where the number
Chairman’sStatement
14

of Phone Cash wallets reached 1.57 mn during the year under review, with an increase of 193,000 wallets and transactions, amounting to 6.86 mn. Furthermore, total tax receipts accounted for EGP 26.93 bn in cash, with an 82.5% increase, while total customs receipts reached EGP 10.92 bn with a 66.9% increase. This is in addition to expanding the number of credit cards to reach 1.08 mn, and developing existing services to cater to the needs of all brackets of society. Additionally, NBE has the largest network of branches and ATMs nationwide, with 483 branches, offices, and units. The number of ATMs expanded to 4,097 as of June 2019 against 3,996 YoY, with an increase of 101 ATMs, accounting for one-third of the ATM market in Egypt. The POS network expanded to reach 19,245 terminals as of June 2019. This massive development helped NBE obtain the Best Retail Bank in North Africa in 2019 from Global Brands, and the Best Retail Bank in Egypt from Asian Banker.
Total proceeds of non-performing loans (NPLs) portfolio accounted for EGP 937.3 mn, comprising EGP 334.8 mn from non-performing customers (on-balance sheet) and EGP 602.5 mn from non-performing customers (previously classified as off-balance sheet customers). Debt workout (settlements and rescheduling) was carried out for 882 non-performing customers (on- and off-balance sheet), whose total debts accounted for EGP 4.9 bn. The ratio of NPLs to total loans reached 1.6% in 2019, compared to 1.9% in 2018.
To satisfy our Bank’s expansion plans and create future cadres, and believing in NBE’s role as a national institution that courts the best human resources, NBE managed to attract 1,680 new employees during the FY 2018/2019 to meet the network expansion plan. NBE trains and develops its human resources from the outset of employment through specialized training courses. About 105,000 training opportunities were provided to 17,000 employees, accounting for 92% of NBE’s total staff.
Upholding its belief in the importance of social responsibility, NBE spared no effort in supporting social, educational, medical, and economic events. Total donations made by NBE amounted to nearly EGP 1.526 bn to cater to the needs of the society during the year under review. NBE focused its policy on supporting four main pillars, namely: health, education, culture, and development of underprivileged areas and slums, while combating poverty.
Finally, I would like to extend my sincere gratitude and appreciation to our customers and partners for their trust and support and to all of NBE’s employees, who are a major asset to build upon as we move forward. I am confident that each staff member seeks to attain sustainable success and new achievements year after year. We are mindful of our vision and strategic objectives, and look forward to sustaining our leadership in the banking sector. With this in mind, NBE managed to maintain its role as the largest banking institution in Egypt, while preserving the integrity of its financial structure and developing customers’ deposits as one of the national assets that contributes to sustainable economic development.
2018 / 20192018 / 2019 15

NBE’s objectives and vision are based on the following strategic pillars, and we strive to achieve them in an effective and efficient manner
• Focusing on expanding the financial inclusion strategy by targeting new segments of unbanked customers and offering new products and services, while streamlining procedures, increasing promotional campaigns, and diversifying distribution channels;
• Continuously developing the digital banking system by employing the latest technologies to create and deliver new products, in addition to expanding the scope of mobile banking services and enhancing work via smart branches;
• Improving margins to increase profitability by targeting low-cost deposits and focusing on the most profitable products of loans and deposits;
• Continuing to follow the concentration risk mitigation strategy by targeting the reduction of concentration rates in loan portfolio and diversifying sources of finance, especially in foreign currency;
• Maximizing other revenues, excluding interests, by reviewing the banking tariff of fees and commissions, focusing on cross-selling, divesting from non-strategic investments, and selling of assets that devolved to the Bank;
• Continuing to support society by activating state initiatives, assuming social responsibility, and supporting the implementation of state initiatives, especially mortgage finance, SMEs, and community development, as an integral part of NBE’s strategy that aims to contribute to social development and reduce unemployment rates.
Our Strategy
16

2018 / 20192018 / 2019 17

Performance as of June 2019
18

2018 / 20192018 / 2019 19

Net Profit (EGP mn.)
Net Interest Income (EGP mn.)
Total Assets (EGP bn.)
JUNE 16
JUNE 15
JUNE 16
JUNE 17
JUNE 17
JUNE 17
JUNE 18
JUNE 18
JUNE 18
JUNE 19
JUNE 19
JUNE 19
20,205
55,332
1,614
10,111
23,321
1,543
13,434
33,783
1,365
12,469
22,582
703
20%
35%
32%
20

Total Shareholders' Equity (EGP mn.)
Total Customers' Deposits (EGP bn.)
Total NPLs (EGP bn.)
JUNE 16 JUNE 17 JUNE 18 JUNE 19
8.9
8.58.6
5.3
JUNE 16
JUNE 16
JUNE 17
JUNE 17
JUNE 18
JUNE 18
JUNE 19
JUNE 19
109,869
1,171
92,249
1,015
85,934
862
38,649
559
42%
28%
28%
2018 / 20192018 / 2019 21

22

Overview of Key Operations
2018 / 20192018 / 2019 23

NBE assumes a pioneering role in corporate banking in Egypt, as the Bank funds development and infrastructure projects of the national economy and optimally utilizes liquidity. From this perspective, NBE duly maintains its strategy of portfolio diversification, taps different economic sectors, oils the wheels of production, and stirs credit extension by supporting strategic commercial industries. NBE also invests in developing the skill set of its staff in all units and works to create a new brand of leadership.
NBE adopts a marketing strategy geared towards attracting a large number of new customers to be added to the portfolio, along with raising corporate lending ratios across a wide range of key economic sectors.
To demonstrate, the large corporate loan portfolio and syndicated loans of NBE increased by EGP 46 bn in FY 2018/19 to reach EGP 414 bn as of June 2019, compared to EGP 367.5 bn YoY, with a growth rate of 12.6%. Growth was prominent in the following sectors.
(EGP mn.)
SectorDirect facilities
June 2018 June 2019 Growth %
Trade finance 8,805 14,349 63%
Contracting 6,829 10,497 54%
Infrastructure projects 87,171 114,482 31%
Food 4,508 5,087 13%
Oil 155,794 165,898 6%
NBE participated in 14 syndicated loans amounting to EGP 45.8 bn during FY 2018/19, where NBE's market share reached EGP 13.6 bn.
NBE won many awards for arranging syndicated loans during FY 2018/19
• According to Bloomberg’s performance assessment of banks in Africa, NBE ranked first in the Egyptian banking market in terms of loan syndication in 2018.
• In a new achievement, NBE received 15 international awards, including 14 from Europe, Middle East, Africa (EMEA) Finance, as the best bank in the field of syndicated loans, financial advisory, restructuring, and securitization in Africa in 2018.
• Furthermore, NBE obtained the award of best loan in the Middle East from the Export Credit Agency for the loan extended to Middle East Oil Refinery Company (Midor).
• According to Bloomberg’s global syndicated loans rankings in the third quarter of 2019, NBE ranked first as the best book runner, lead arranger, and facility agent of syndicated loans, totaling EGP 28 bn.
• NBE moved to seventh place in the Middle East region, and the same position across Africa for syndicated loans, where the Bank acted as facility agent, following international institutions and banks.
Large Corporate
24

2018 / 20192018 / 2019 25

26

Small and medium enterprises (SMEs) play a pivotal role in achieving national economic and social objectives. The state highly values developing SMEs, which act as a catalyst for implementing an integrated and balanced economic development, creating job opportunities, curbing unemployment, greasing the wheels of production, and promoting financial inclusion.
Accordingly, this year, total SME loan portfolio (direct loans) witnessed an increase of EGP 13.7 bn (i.e., 31.6% growth rate) to reach EGP 57.9 bn. YoY, benefiting 71,200 customers. NBE’s portfolio figures were positively influenced by CBE’s initiatives for financing small and medium enterprises. As for SMEs finance under CBE’s efforts, total outstanding facilities amounted to EGP 37.4 bn. Industry-oriented finance increased EGP 6 bn, representing 44% of the net portfolio increase.
In addition, medium enterprises finance (direct and indirect) amounted to EGP 16.7 bn, with a 36.5% growth rate YoY, representing 26% of the total portfolio and was extended to 857 customers, 111 of which were included under the CBE’s initiative (with an interest rate of 7%), receiving total finance of EGP 1,378 mn.
Additionally, the EGP 45.1 bn small-scale enterprises finance has recorded 71% of the total portfolio and was extended to 47,000 customers, 41,107 of which were under the CBE’s initiative (with an interest rate of 5%), obtaining total finance of EGP 34,154 mn.
Targeting diversified financing that includes different projects according to CBE’s classification, microfinance amounted to EGP 2.1 bn, representing nearly 3.3% of the total portfolio.
To penetrate the market more deeply, enhance financial inclusion, and reach out to smaller finance segments via microfinance, NBE channeled total loans of EGP 2.2 bn (with a net increase of EGP 606 mn), to microfinance institutions (MFIs). In addition, some 8,585 Meeza cards were issued for Al Tadamun Microfinance Foundation as of June 2019. The “payroll” product and Al Ahly Net services were offered to many MFIs.
Nearly EGP 572 mn in transactions from 13 new customers were attributed to NBE branches. The Finance and Investment Forum, organized by B2B company, was coordinated to promote NBE’s banking, financial, and non-financial services. During the Forum, the transactions of 35 customers were courted and directed to the nearest NBE branches to their place of business in order to study their financing needs. This required excellent coordination with the Retail Banking Division and Technical Support Division, as well as branches with the customers’ payroll file.
Small and Medium Enterprises
2018 / 20192018 / 2019 27

Retail
Retail banking is a key pillar in supporting, upgrading, and developing the Bank’s products to cater to the needs of a wide range of its clientele, whether via branches, customer service centers, or other alternative channels nationwide. Meanwhile, NBE continues to refine its customer service.
During the year under review, the retail banking portfolio amounted to EGP 73 bn, growing by EGP 27.7 bn (i.e., 61%) YoY. The number of credit cards increased by 64,000 (i.e., 6%), with the amount of EGP 1.2 bn, compared to the previous FY.
Cards products and services• Titanium MasterCard was launched, and the
e-statements of credit cards were developed in coordination with the relevant divisions to e-mail exclusive offers and privileges to the eligible customer segments.
• Debit cards increased in net by 689,000 (i.e., 16% growth). Utilization of direct debit cards reflected a net increase of EGP 43.2bn this year, growing 36.5% YoY. In addition, NBE launched contactless cards in coordination with the relevant entities after obtaining the CBE’s approval for activation. Moreover, the contactless feature will be added to NBE’s POS after obtaining the relevant entities’ consent.
• Secure code service of debit cards has been developed via automatic registration in the service.
• Total utilization value of NBE’s Platinum debit cards amounted to EGP 7.9 bn (i.e., 56% growth), taking the number of Platinum debit cards up to 78,000 by the end of the year, compared to 62,000 in the previous year.
• Prepaid cards saw a net increase to 1.41 mn (i.e., 99%). Utilizations by prepaid cards demonstrated a net rise of EGP 2.8 bn, growing 167% YoY. Manchester United Prepaid MasterCard and Meeza Prepaid Card were launched.
• Secure code service was added to payroll cards.
• As for Al Ahly Points, cash rewards were added as a new way to exchange points in October 2018. The OPT feature was also introduced to access the reward program website.
Mobile phone payments
The number of Phone Cash mobile payment wallets expanded to record 1.57 mn. Meanwhile, the number of mobile payment wallets, Flous, amounted to 988,000 wallets. Additionally, the number of NBEPay wallets recorded 130,800.
Loan products
The credit policy of secured and unsecured personal loans has been developed as follows:
• A personal Murabaha product is introduced with cash collateral for holders of saving products and certificates in EGP.
• The secured personal loan repayment period was extended to 7 years for new loans.
28

2018 / 20192018 / 2019 29

Total Retail Loans (EGP bn.)
Number of ATMs
JUNE 16 JUNE 17 JUNE 18 JUNE 19
73.2
45.539.5
38.1
24%
JUNE 16 JUNE 17 JUNE 18 JUNE 19
4,097
3,996
3,507
2,728
15%
Internet banking
• Financial transactions via Al Ahly Net service (retail and corporate) increased to record 1,095,629 to the amount of EGP 10.27 bn for retail customers, and 38,035 transactions totaling EGP 5.101 bn for corporate customers.
• The service of purchasing, redeeming, and amending investment certificates, saving certificates, and term deposits was launched, as well as the facility to open sub-accounts for existing customers.
• NBE launched the first phase of the electronic branches, comprising four new branches fully based on self-service banking.
• The number of users of NBE’s smartphone application (NBE Mobile App) increased by 17,086 during 2018/2019, with 204,430 downloads as of June 2019.
• The number of ATMs increased to record 4,097 as of June 30, 2019, compared to 3,996 ATMs YoY.
30

NBE’s investment portfolio in brief as of June 2019• In line with our strategy, which aims to bolster
investment in development projects on one side and maximize the Bank’s financial performance on the other, NBE acted on several pivots, including participation in projects across different economic sectors. This contributed to the growth of the Bank’s investments and ensured optimal utilization. To that end, NBE had equity stakes in 157 projects with total
capital of EGP 16 bn, and investment cost of EGP 18 bn, as of the end of June 2019, in addition to providing credit facilities to such projects worth EGP 13 bn as of June 30, 2019.
• NBE’s investment portfolio by economic sector as of June 30, 2019, was as follows:
SectorNumber of
projects
NBE 's nominal equity participation
Cost of NBE's participation
Relative weight
Financial institutions 25 6.0 6.0 33.5%
Real estate and housing 21 1.6 3.9 21.9%
Banks 6 2.3 2.1 11.7%
Tourism and entertainment
26 1.4 1.4 7.7%
Oil and main resources 16 0.7 0.7 3.7%
Food and beverage 13 0.4 0.4 2.1%
ICT 10 0.2 0.2 1.3%
Construction and building materials
4 0.1 0.1 0.4%
Other 36 3.3 3.2 17.7%
Total 157 16 18 100%
NBE’s investment portfolio encompasses several vital and strategic projects which serve the Bank’s strategy, including but not limited to:
• Banks: National Bank of Egypt (UK) Limited.• Financial institutions: Al Ahly Capital.• ICT: e-finance.• Tourism: Sharm Dreams Holding for Tourism & Hotels.• Real estate and housing: Al Ahly for Real Estate Development.• Construction and building materials: Medcom-Aswan Cement Plant.• Food and agriculture: Al Ahly Company for Land Reclamation and Cultivation.• Oil and main resources: Alexandria National Refining and Petrochemicals Company (ANRPC).• Other sectors: National Navigation Company and medical, trade, distribution companies, etc.
Investment
2018 / 20192018 / 2019 31

Financial institutions
33.5%
Real estate and housing
21.9%
Banks
11.7%
Tourism and entertainment
7.7%
Other
17.7%
Oil and main resources 3.7%
Food and beverage 2.1%
Construction and building materials 0.4%ICT 1.3%
• The above chart shows that financial institutions capture the lion’s share, the highest relative importance among sectors, where NBE holds equity participation, amounting to 34% of its total investment portfolio. Financial institutions also include NBE’s most substantial direct investment, which is its key investment arm, Al Ahly Capital Holding (ACH), controlling 28% of the total portfolio. ACH also holds stakes in 15 companies operating in different areas, including cement, petrochemical, and mortgage finance companies. The real estate and housing sector comes next with a share of 22%, then banks with 12%, tourism with 8%, and oil and main resources with 4%. Other sectors, including medical, trade, distribution companies, etc., account for 18%, and finally, food and beverage with 2%.
• Ninety-two companies in the portfolio (with a total adjusted book value of EGP 14.4 bn, i.e., 98%) generated profits, including companies that did and others that did not declare dividends for the year.
• Actual return on investment (ROI) totaled EGP 954 mn in FY 2018/2019, mainly in the form of cash dividends of EGP 654 mn for 45 companies and banks (with a total adjusted book value of EGP 9.9 bn) and capital gains of EGP 300 mn, representing sale proceeds of equity participation in some companies.
• NBE raised its nominal stakes in some companies, totaling EGP 4.4 bn.
• The Bank’s policy aims to continuously revamp its investment portfolio through divestiture from some projects by selling its equity participation in some companies with a view to generating capital gains and providing opportunities to participate in other new projects that can serve the national economy and help accomplish development plans. The Bank also seeks to restructure insolvent companies, creating healthier entities with the aim of contributing to economic growth.
32

Treasury and Capital Market Division
Treasury and capital market group is responsible for the effective management of NBE's net revenue and realizing a profit margin through reconciling liquidity positions, reserves and interest rates. The Group is also responsible for taking all necessary actions to ensure the compatibility with the overall framework of NBE's risk management and regulatory requirements.
In addition, the Group gives substantial support to investors abroad and assumes a key role in implementing the national economic reform plan and CBE's initiatives.
Main activities• Trading in government debt instruments in primary and secondary markets. NBE is the biggest Egyptian bank in
terms of trading volume in both primary and secondary markets.
• Trading in foreign currency, money markets, derivatives and hedging products.
• Effectively managing NBE's liquidity positions, maintaining appropriate levels of high quality liquid assets (HQLA); managing liquidity gaps and interest rates.
• Developing market products and research.
Main contributions
Contribution to net interest income (NII):
• Treasury's trading assets account for 63% of NBE's total assets.
• Treasury's total return on asset (ROA) reaches 75% of NBE's total ROA.
• Treasury's ROAA is 15.50% versus NBE's total ROAA at 13.2%.
Contribution to commissions:
• Foreign exchange trading: Foreign exchange flow from foreign investors and local markets remarkably increased in 2018/19, realizing FX trading profits of EGP 4.2 bn. in the same year.
• Fixed income instruments trading: Volume of transactions processed in 2018/19 contributed to enhancing NBE's profitability, achieving commissions in the amount of EGP 237.61mn.
2018 / 20192018 / 2019 33

• NBE is keen on diversifying the sources of foreign currency inflow, as it is considered the largest recipient of remittances from Egyptian expatriates. The Bank concluded several significant agreements and deals with key global and regional banks and international financial institutions/agencies. As a result, NBE managed to ramp up medium- and long-term loans to finance various local projects, especially micro, small, and medium-sized enterprises (MSMEs), light industries, and large companies. During the current fiscal year, NBE signed credit lines and facility agreements that exceed USD 1 bn as follows:
- A finance agreement worth € 375 mn was signed with the European Investment Bank (EIB) to finance SMEs.
- A USD 600 mn finance agreement was signed with China Development Bank (CDB) to finance working capital needs.
- 5 Foreign trade finance agreements were signed with the African Export-Import Bank (Afreximbank) totaling USD 1 bn.
- NBE’s BoD approved a foreign trade finance agreement with the Bank’s correspondent Sumitomo Mitsui Banking Corporation (DIFC Branch - Dubai) for the amount of USD 10 mn, which can be gradually increased.
• Total non-performing loan portfolio settlements (excluding retail banking) recorded EGP 937.3 mn, represented by EGP 334.8 mn cash collections from on-balance sheet defaulting customers (including EGP 12.5 mn in settlements-in-kind), and EGP 602.5 mn from defaulting customers previously transferred off-balance sheet (including EGP 148.5 mn in settlements-in-kind).
• Settlement and rescheduling arrangements for debt recovery were concluded with 882 (on and off-balance sheet) defaulting customers assigned to the Debt Recovery Group, with total debts of EGP 4.9 bn (EGP 2.5 bn book balances and EGP 2.4 bn interests in suspense). Total settlements accounted for EGP 2.5 bn.
• Direct non-performing loan portfolio (including retail
banking) amounted to EGP 8.892 bn in June 2019, compared to EGP 8.555 bn YoY.
• Non-performing loans to total loans reached 1.6% as of June 30, 2019, against 1.9% YoY.
• Such decline is mainly attributed to the increase in NBE’s total direct performing loan portfolio.
• Amounts recovered from customers in FY 2018/2019 reached EGP 937.3 mn.
• Ten defalting customers were resuctured , with total debts of EGP 3,350.6 mn, as at the date of reporting their cases to the relevant authority. The facilities extended to customers under restructuring agreements amounted to EGP 212.1 mn (both direct and indirect finance).
International Financial Services Division – International Loans Department
Debt Recovery Group
Portfolio Management and Risk Modelling Methodology Division
As NBE is keen on observing the international practices of portfolio management and risk modeling approaches, and providing support to senior management with respect to business planning and credit risk control, the Bank managed to:• Prepare a quarterly aggregate risk management
report to assess the level of major risks to which the Bank is exposed, and evaluate the necessary capital requirements for tier 1 and tier 2 risks. The report also assesses the availability of additional capital for other risks in excess of the minimum capital requirement.
• Create the “Risk Appetite Framework” report in the year under review to achieve the Bank’s strategic objectives. The report aims to establish a general
framework to define and identify significant risks that NBE is exposed to, and create a common language to discuss such risks at the level of the BoD, senior management, and all business lines.
• Prepare the “Stress Testing” report to give an early warning to the Bank’s management about any unexpected adverse results arising from the Bank’s risk exposure by stress testing the credit portfolio and growth rates.
34

• Develop the Internal Capital Adequacy Assessment Process (ICAAP) in the framework of implementing the second pillar of Basel II, also known as the “Supervisory Review”. This is designed to ensure a mechanism is in place for the comprehensive assessment of capital adequacy in line with the overall risk framework, and NBE’s strategy to maintain adequate levels of capital.
• Currently implement a framework to manage, analyze, and assess risks, “Enterprise Risk Management,” according to a planned schedule, based on three key pillars:
1- Credit risk framework at the level of the customer and portfolio. It encompasses the CreditLens platform for automated spreading and risk grading, and retail
risk modeling. The first phase was expected to be completed by January 2020;
2- Non-credit framework which comprises compliance with Basel requirements, asset and liability management, and liquidity risk management; and
3- Framework of compliance with the International Financial Reporting Standard 9 (IFRS 9) to calculate Expected Credit Losses (ECL), which consists of two phases: a short-term tactical solution and a long-term strategic solution. The first phase was expected to be operational by February 2020.
OOperational risk management saw a remarkable transformation in FY 2018/2019 to ensure that there are effective, proactive mechanisms in place to manage operational risks arising from rolling over new banking services. Such transformation took place in light of implementing financial inclusion, opening new electronic service branches, and coping with cutting-edge global technology in alignment with NBE’s overall strategy.
This year, the Operational Risk Management (ORM) Group’s activities included developing a general framework to identify the operational risk appetite for business units. Such a structure is currently being implemented at NBE’s business units by identifying the type and volume of operational risks that the Bank is willing to accept to achieve its strategic objectives. Minimum and maximum limits are set for acceptable risks. A mechanism is also established to monitor operational risks to ensure that they remain within acceptable risk limits, with a view to identifying weaknesses and introducing the appropriate corrective actions.
NBE exerts continuous efforts to promote its business continuity management (BCM) system. Hence, the Bank managed to expand the scope of its conformity with ISO 22301 for BCM to include all the primary and alternate sites inside Cairo, housing a total of 37 business lines. Additionally, the ISO 22301 certification was renewed with respect to central operational functions for a total of 14 business lines. 351 business continuity plan (BCP) tests were conducted for Head Office divisions at 20 alternate sites across Egypt, including alternative locations for vital activities.
NBE is pushing ahead with its plan to develop the ORM Group’s automated systems in line with the Bank’s initiative to create a comprehensive methodology for managing organizational risks. The program aims to upgrade data accuracy and quality, streamline procedures, and save time and effort in implementing and monitoring the ORM framework. It will also help to enhance managing and monitoring operational losses.
The ORM Group continues to develop human resources, which are the cornerstone of coping with developments in the field of operational risk management. Several ORM employees were enrolled in accredited international certification programs specialized in information system risk management and operational risk management. They have also participated in global and local conferences and seminars so as to open channels of communication and exchange experience with other ORM experts and specialists, thereby remaining apprised of the latest banking developments, achieving financial inclusion, and adopting FinTech.
As part of the ORM Group’s plan to develop a second line of leaders, a number of its team members were nominated to participate in the “Future Leaders” program carried out by the Egyptian Banking Institute (EBI) which focuses on developing the technical and leadership skills of participants. Furthermore, ORM employees were enrolled in various training programs to develop their soft, management, and technical skills.
Operational Risk
2018 / 20192018 / 2019 35

• Contributing to developing the K+/KGR systems with the vendor in order to benefit from them.
• Implementing stress testing using bid-ask spreads as liquidity indicators, the turnover ratio for stock portfolios, and introducing a diversification score to depict the diversity of stock portfolios.
• Applying Stressed Value-at-Risk (VaR) to FX swaps and repos, and calculating the Mark-to-Market (MTM) value and expected future value using current exposure.
• Calculating capital requirements for market risk using the standardized approach.
• Developing the liquidity risk simulation, fully measuring its impact on all liquidity indicators (under both normal and stressed conditions), and showing the findings and recommendations required in the Internal Liquidity Adequacy Assessment Process (ILAAP) report.
• Creating the NBE Fixed Interest (NBEFI) indicator for the purpose of assessing the performance of the Bank’s portfolio compared to a market indicator.
• Forecasting deposit balances over the coming periods through time series analysis using the autoregressive moving average model (ARIMA), preparing deposit runoff models, and estimating the ideal weights for allocating demand deposits according to different maturities using the replicating portfolio (RP) approach.
• Calculating the loss-in-value of assets under stress using the haircut model, and developing the equilibrium real exchange rate (ERER) model.
• Measuring compliance with Basel IV with respect to assessing market data used in internal models.
• Preparing reports on economic external early warning indicators and analyzing economic reports published by the International Monetary Fund (IMF).
• Conducting market risk model validations, preparing and developing backtesting and profit and loss (P&L) attribution tests, and assessing the impact of unfavorable movements in interest rates on the Bank’s earnings and economic value.
Governance is a system of relationships between a bank’s management, the board of directors (BoD), shareholders, and other stakeholders, setting a clear definition of powers and responsibilities for each of them. It tackles the method adopted by the bank’s BoD and senior management to direct and oversee its business and daily activities. Good corporate governance is not an end in itself; it is a means to ensure the sound performance of financial institutions and the banking sector in general.
NBE is a pioneer in the adoption of good governance practices. This is crystallized by how the BoD and senior management direct and oversee NBE’s business and daily activities. Given the importance of a robust corporate governance framework in promoting business growth
and maximizing profits, NBE is always dedicated to applying the best international practices of corporate governance.
NBE releases an annual governance report to document its corporate governance framework, in order to uphold the highest governance standards based on the best international practices and instructions by the relevant regulators. The governance report provides an overview of the BoD roles and responsibilities. It also depicts the effectiveness and evaluates the performance of the BoD, and shows the method by which the BoD actually applies corporate governance.
Market Risk Division
Corporate Governance and Compliance
RESPONSIBILITY
ACCOUNTABILITY
DISCLOSURE
FAIRNESSAND EQUALITY
INTEREST CONFLICT MANAGEMENT
BALANCE
TRANSPARENCY
CODE OF ETHICS
36

Regulatory Compliance
NBE’s Regulatory Compliance and Corporate Governance Group is committed to promoting the Bank’s reputation, maintaining its leading role in the banking sector at the local and international levels, and protecting the interests of stakeholders. To that end, it keeps up with the latest regulatory requirements by local and international legislative and regulatory authorities. The Group also uses cutting-edge technology and international standards in implementing compliance best practices. All the policies are updated annually to stay abreast of the latest global systems and developments.
The key responsibility of the Regulatory Compliance and Corporate Governance Group is the efficient management of compliance risks to protect the Bank from any “potential” financial losses “that may occur” as a result of failure to comply with the laws. Compliance risks include exposure to legal risks such as penalties and fines, financial losses, and reputational risks. The Regulatory Compliance Department also helps the BoD and executive management in assuming their responsibilities in terms of compliance and internal control.
The Regulatory Compliance and Corporate Governance Group is a fully independent unit that directly reports to the BoD and Audit Committee. It has all the necessary powers to access all data and information required to perform its duties and report to higher managerial levels.
The Group has established and developed a monitoring program through site inspection and corrective action plans based on risk assessment to identify the level of compliance in all divisions. The current strategy aims at the ongoing development and enrollment of the Group’s staff in the latest training programs to improve their competencies in the areas of compliance, anti-money laundering and countering, financing of terrorism (AML/CFT), as well as related updates. In cooperation with NBE’s Learning and Development, the Regulatory Compliance and Corporate Governance Group took part in providing tailored training programs to promote a culture of compliance among all employees.
Anti-money laundering and combating the financing of terrorism
NBE has introduced state-of-the-art automated systems to keep up with the best practices in the local and international markets. This aims to protect the Bank’s reputation by preventing the use of its business channels or products in any illegal or suspicious activities of money laundering, terrorism finance, or dealing with banned individuals or entities at the local or international level, particularly in light of the advanced techniques employed globally in financial crime in recent years.
The Bank uses leading-edge methods, programs, and techniques to ensure that all transactions processed via NBE are examined and monitored. Integrated electronic systems are utilized to examine all the parties to any banking transaction by checking them against all local and international sanction lists. Advanced programs and systems are designed and put in place to monitor transactions to ensure they fit customers’ financial profiles under the Know Your Customer (KYC) requirements.
NBE has also updated its AML/CFT policies and procedures, which have recently focused on developing the principle of due diligence and applying the principle of KYC to identify high-risk customers. The Regulatory Compliance Department continuously updates policies and procedures to reflect any changes in systems and instructions by local legislative entities and the Financial Action Task Force (FATF).
The Regulatory Compliance and Corporate Governance Group prepares an annual report on the Bank’s AML/CFT activities, which is presented to the BoD for comments and to take the necessary actions where applicable. The report is forwarded to the Egyptian Money Laundering and Terrorist Financing Combating Unit (MLCU), accompanied by the BoD’s remarks and decisions in this regard.
2018 / 20192018 / 2019 37

The Operations Group continued its internal development efforts, which build on the Group’s past achievements that go in tandem with NBE’s comprehensive development strategy. This had a positive impact on several aspects, including the level and speed of performance, which significantly improved, leading to greater customer satisfaction, as planned by NBE’s senior management. The Group’s divisions achieved the following:
• NBE came ahead of other banks and finance companies participating in the mortgage finance initiative throughout the year, finishing first at the end of June 2019.
• NBE was the first national bank to receive the national prepaid card “Meeza” certification at three levels: Idemia, Gemalto, and G&D.
• The Bank began to switch from contact to contactless cards, starting with the Platinum Debit MasterCard.
• The number of government and corporate entities using NBE’s payroll services rose to 4,634, against 4,309 in the previous year (nearly 4,028,708 cards). Total salary payments spiked 44.99% to EGP 238.69 bn versus last year’s figure of EGP 164.61 bn.
• Tax collections in cash jumped to EGP 28.66 bn compared with EGP 15 bn YoY. In addition, customs proceeds rose to EGP 12.68 bn, compared to last year’s figure of EGP 6.5 bn. The value of claims and bills amounted to EGP 27.8 bn, compared to EGP 16.3 bn YoY.
• NBE was chosen as the best custodian in Egypt in terms of performance and asset servicing, according to Global Custodian Magazine’s survey, overtaking major banks in the Egyptian market and MENA region.
• Tax Authority collections by cheques exceeded EGP 139.2 bn (nearly 463,000 cheques), generating more than EGP 91.3 mn in low-cost deposits as a result of investing these funds before being credited to the Tax Authority’s Treasury Single Account (TSA) at CBE.
• NBE’s total foreign currency resources (from foreign currencies sold to the Bank) denominated in USD during the period from July 1, 2018, to June 20, 2019, amounted to USD 11,284 mn.
• Estate operations were centralized as of February 21, 2019, for existing estates and starting from March 3, 2019, for new estates. As a pioneer in the banking industry, NBE was the first bank in Egypt to automate estate files by linking the estate operations at branches and the relevant divisions to the Centralized Estate Department
Operations Group
38

NBE offers optimal solutions and applications that significantly improve the banking services delivered to our customers and various state institutions, strengthening NBE’s position at the forefront of the Egyptian and regional banking market. The IT Division’s key achievements in this regard are:
• Offering certain banking services through the electronic service branches, created to serve customers electronically in a shorter amount of time. Interactive screens were designed to show an interactive promotional content of the Bank’s services, and e-forms were developed to automatically process customers’ applications without filling in paper forms. Additionally, cash, cheque, and similar transactions can be carried out through interactive teller machines (ITMs).
• Completing the automation of collateralized loan repricing at renewal, which aims to link the pricing of retail collateralized loans to the relevant collateral’s applicable interest rate. Pricing is updated upon the automatic renewal of the collateral.
• Developing a mobile application to manage the board meetings of National Bank of Egypt (UK) Limited.
• Carrying out ACH tokenization by encrypting card data for transfers through internet banking.
• Executing government finance collections in favor of the CBE via ACH.
• Implementing a system for salaries in foreign currencies.
• Developing the gas loan and gas operations applications that enable gas companies to upload files for opening accounts, paying installments, and monitoring the status of the companies’ files and customer accounts.
• Launching the “SMS change installments” system, which sends SMS messages to notify customers of the change in the amount of their loan installments.
• Developing and executing a program to send SMS messages to customers at all NBE branches in case of
opening a new account or confirming an existing one.
• Activating the feature of receiving remittances via the national payment cards Meeza.
• Developing the estate automation system which aims to regulate and monitor the liquidation of customers’ estates and automatically links branches to the Centralized Estate Unit.
• Suspending the issuance of savings certificates printouts at NBE branches.
• Automating securities transactions starting from the moment the customer visits the branch up to carrying out the sale/purchase transactions by establishing a link with the Egyptian Exchange (EGX) and CBE to process securities (shares/bonds/T-bills) transactions via Flexcube.
• Initiating the creation of a comprehensive database to collect and analyze data and information in light of CBE’s keenness to promote financial inclusion.
• Completing the required settlements related to the National Payment Scheme (NPS), Meeza.
• Making the “sweeping” service available to enable the replenishment of an account from the customer’s other accounts if the balance is insufficient to carry out a debit transaction when cashing cheques and paying loan installments, due credit card payments, and mandatory fees.
• Creating a dashboard to monitor the monthly indicators of Al Ahly Net service and the behavior of customers subscribing to the service.
Information Technology (IT)
2018 / 20192018 / 2019 39

During FY 2018/2019, NBE continued paying great attention to its human resources and focused on enhancing and developing their competencies. Hence, NBE recruited skilled staff and provided them with training courses and programs to sharpen their skills and broaden their knowledge. NBE scaled up its partnership with prominent global institutes and universities to organize high-level training programs aimed at further developing the skills of young leaders to create and qualify a promising generation of new bankers for leading positions. NBE’s dedication to its staff helped achieve outstanding results, as NBE launched several initiatives to develop its workforce, most importantly:
• Conducting the training plan encompassing specialized technical, soft skills, and managerial programs, as well as other programs for English language, postgraduate studies, and professional certificates. A 105,000 training opportunities were provided to 17,000 trainees, representing 92% of the Bank’s overall staff.
• To keep up with technological advancements and digital transformation, NBE’s HR continues to provide first-class programs and applications in the area of FinTech and digital transformation. Some 3,694 training opportunities in 97 IT and digital transformation training topics were offered during the year under review.
• In line with NBE’s policy to support SMEs, whose role is vital in spurring economic growth, the Bank paid great attention to improving the technical, soft, and management skills of staff in the field of SME finance. 7,067 opportunities were provided to 1,786 trainees, i.e., 88% of total employees working in this field, in addition to 6,842 training opportunities through e-learning.
• To enhance the skills and expertise of regional and branch managers as well as customer service officers, a training path to develop their selling skills was launched. Thirty-six regional and sub-region managers were trained, as well as 389 branch managers and 256 customer service officers.
• A training path to develop management and leadership skills was initiated. Training was given to 685 middle management employees, and 40 management and senior management trainees.
• In collaboration with the Egyptian Banking Institute (EBI), 3,440 training opportunities were offered to 2,913 employees in 117 training topics covering all areas of banking, as well as management and leadership competencies.
• A summer training program was offered to university students. NBE is driven by its social responsibility and aspiration to create a trained and qualified generation for the labor market in general, and the banking sector in particular. Some 777 students were introduced to the banking profession and offered practical training at NBE’s departments and branches for five weeks.
• Additional benefits were introduced, and events were organized to increase the staff ’s sense of loyalty and and instill a culture of belonging. Benefits included life insurance on employees granted loans, developing and automating the staff healthcare system, the digitalization of HR systems, and launching the HR interactive automated assistant, “HR Chatbot”.
Human Resources (HR)
40

2018 / 20192018 / 2019 41

42
Financial
Statements
2018 / 20192018 / 2019 43

Note No.
30/6/2019EGP mn
30/6/2018EGP mn
Cash and balances with Central Banks 15 29 397 74 578
Due from banks 16 490 507 524 255
Treasury bills and other governmental notes 17 271 244 297 262
Trading financial assets 18 338 407
Loans and advances to banks, net 19 2 454 1 865
Loans and advances to customers, net 20 514 173 430 780
Financial derivatives 21 292 36
Financial investments
Available for sale investments 22 151 599 44 855
Held to maturity investments 22 103 216 127 277
Investments in subsidiaries and associates 22 7 770 7 779
Other assets 23 37 320 29 400
Investment property 23 2 2
Fixed assets, net (after accumulated depreciation) 24 5 697 5 101
Total assets 1 614 009 1 543 597
Liabilities and shareholders’ equity
Liabilities
Due to banks 25 140 989 282 586
Customers` deposits 26 1 170 592 1 014 833
Financial derivatives 21 228 255
Other loans 27 139 033 114 512
Other liabilities 28 41 794 33 563
Other provisions 29 8 088 2 606
Pension benefits' liabilities 30 3 416 2 993
Total liabilities 1 504 140 1 451 348
Assets
Separate Balance sheet statement as at June 30, 2019
44

Note No.
30/6/2019EGP mn
30/6/2018EGP mn
Interest income on loans and similar income (6) 183 978 151 390
Interest expense on deposits and similar expense (6) (128 646) (128 069)
Net interest income 55 332 23 321
Fees and commissions income (7) 7 604 8 167
Fees and commissions expense (7) (804) (771)
Net fees and commissions income 6 800 7396
Dividends income (8) 681 980
Net trading income (9) 1 411 823
(Loss) profit from financial investments (22) (2 636) 883
Impairment charge on credit losses (12) (4 228) (40)
Administrative expenses (10) ( 20 198) (13 018)
Other operating (expenses) incomes (11) (3 478) 1 197
Profit before income tax 33 684 21 542
Income tax expenses (13) (13 479) (11 431)
Net profit for the year 20 205 10 111
Earnings per share (EGP) (14) 0.49 0.33
The attached notes from (1) to (39) are an integral part of these separate financial statements.
Note No.
30/6/2019EGP mn
30/6/2018EGP mn
Shareholders’ equity
Paid-up capital 32 35 000 35 000
Reserves 33 24 864 15 406
CBE subordinate-loan differences between nominal value and present value 33 29 800 31 732
Retained earnings 20 205 10 111
Total shareholders’ equity 109 869 92 249
Total liabilities and shareholders’ equity 1 614 009 1 543 597
Contingent liabilities and commitments
Letters of credit, guarantee and other commitments 35 608 168 463 385
The attached notes from (1) to (39) are an integral part of these separate financial statements.
Separate Income Statement for the year ended June 30, 2019
45 2018 / 20192018 / 2019

Statement of proposed profit distribution for the year ending 30/6/2019
30/6/2019EGP mn
30/6/2018EGP mn
Net profit for the year (from income statement) 20 205 10 111
Deduct:-
Profit from selling fixed assets transferred to capital reserve in conformity with article No 40 for the Law No. 159 for the year 1981
(6) (22)
IFRS (9) risk reserve - (6 926)
Net profit available for distribution 20 199 3 163
To be distributed as follows:
Legal Reserve 2 020 1 009
General reserve 1 818 215
Employees´ profit share 3 027 194
Shareholders´ dividends* 13 334 1 745
Total 20 199 3 163
* Proposed to be transferred, an amount of EGP 11,858 mn from the share of government's net profit at 30 June 2019 to the supportive reserve after excluding the following:
- An amount of EGP 1000 mn cash dividends to the shareholders.
- An amount of EGP 474 mn paid in accordance with the agreement of subordinated loan which used in increasing the bank's paid- up capital.
- An amount of EGP 2 mn represents bank's net accrued interest related to the 5% governmental bonds ,which settled in government's share of net profit.
46

Separate cash flow statement for the year ending 30/6/2019
Note No. 30/6/2019EGP mn
30/6/2018EGP mn
Cash flows from operating activities
Net profit for the year before tax 33 684 21 542
Adjustments to reconcile net profit to cash flows from operating activities:
Fixed assets depreciation (24) 1 238 1 059
Profit from selling fixed assets (11) (6) (22)
Premium amortization for available for sale and held to maturity bonds
(22) (11 867) (257)
Impairment charge on customers' loans and advances
(20) 4 209 325
Impairment charge on banks' loans and advances 6 -
Pension benefits' liabilities (30) 565 581
Revaluation differences of impairment in foreign currencies
(20) (511) (99)
Reversal of financial investments' Impairment (22) 2 774 176
Reversal of charges on other provision (29) 6 740 12
Revaluation differences of other provisions in foreign currencies
(29) (45) (3)
Potential claims provision no longer required (29) - (369)
Legal claims provision no longer required (29) (369) (95)
Overseas branches foreign currency translation differences
(107) (11)
Operating profits before changes in assets and liabilities from operating activities.
36 311 22 839
Net decrease (increase) in assets
47 2018 / 20192018 / 2019

Note No. 30/6/2019EGP mn
30/6/2018EGP mn
Obligatory reserve balances with Central Banks (15) 48 064 (38 364)
Due from banks (16) (24 662) 10 250
Treasury bills (17) (3 596) (36 905)
Trading financial assets (18) 69 (120)
Loans and advances to banks (19) (595) (909)
Loans and advances to customers (20) (86 073) (53 770)
Financial derivatives, net (21) (141) 71
Other assets (23) (9 539) (1 387)
Net increase (decrease) in liabilities
Due to banks (25) (141 597) (13 406)
Paid pension benefits (30) (142) (116)
Customers deposits (26) 155 759 153 118
Other liabilities (28) 5 572 7 230
Used in other provision (29) (27) (11)
Paid income taxes (13) (11 036) (10 155)
Net cash flows (used in)/from operating activities (31 633) 38 365
Payments to acquire fixed assets and fixtures of branches
(24) (1 838) (1 849)
Proceeds from sale of fixed assets (24) 10 23
"Proceeds from sale of financial investments (other than trading financial assets)"
(22) 29 758 31 454
Purchase of financial investments (other than trading financial assets)
(22) (100 674) (8 567)
Payments for question of subsidiaries and associates
(22) (2 660) (129)
Net cash flows (used in) provided from investing activities
(75 404) 20 932
Cash flows from financing activities
Proceeds from other loans (27) 33 411 31 875
48

Note No. 30/6/2019EGP mn
30/6/2018EGP mn
Payment from other loans (27) (10 822) (8 881)
Dividends paid (693) (1 976)
Net cash flows from financing activities 21 896 21 018
Net (decrease) increase in cash and cash equivalents during the year
(85 141) 80 315
Cash and cash equivalent at the beginning of the year
520 866 440 551
Cash and cash equivalent at the end of the year 435 725 520 866
Cash and cash equivalents are represented in the following:
Cash and balances with central banks (15) 29 397 74 578
Due from banks (16) 490 507 524 255
Treasury bills and other governmental notes (17) 271 244 297 262
Obligatory reserve balance with Central Banks (15) (14 126) (62 190)
Amounts due from banks with maturity of more than three months
(16) (94 307) (69 645)
Treasury bills with maturity more than three months
(17) (246 990) (243 394)
Cash and cash equivalent at the end of the year 435 725 520 866
The attached notes from (1) to (39) are an integral part of these separate financial statements.
49 2018 / 20192018 / 2019

Separate statement of changes in shareholders’ equity for the year ending 30/6/2019
Paid-up capital
General banking risks
reserve
Legal reserve
"Generalreserve"
Capital reserve
Supportive reserve
"Specialreserve"
Cash flow hedge
reserve
"AFS investments changes in fair value reserve"
Difference between the nominal and
present value of subordinated
loan
Foreign currency
translation differences for overseas
branches
"IFRS 9 risk
reserve"
Retained earnings Total
Balance at the beginning of the year as of 01/07/2017
28 650 3 247 3 556 33 22 - 403 (48) 2 854 33 365 418 - 13 434 85 934
Transferred to reserves
- 1 426 1 342 1 065 11 7 514 - - - - 100 - (11 458) -
Shareholders' dividends - - - - - - - - - - - - (1 017) (1 017)
Employees' dividends - - - - - - - - - - - - (959) (959)
Paid-up capital increase 6 350 - - - - ( 6 350) - - - - - - - -
Net changes in reserves of AFS financial investments (after tax)
- - - - - - - - (102) - - - - (102)
Net changes in reserves of financial derivatives
- - - - - - - (74) - - - - - (74)
Movement of the year for overseas branches' foreign translation differences
- - - - - - - - - - (11) - - (11)
CBE subordinated loan differences between nominal value and present value
- - - - - - - - - (1 633) - - - (1 633)
Net profit - - - - - - - - - - - - 10 111 10 111
Balance as at 30/06/2018
35 000 4 673 4 898 1 098 33 1 164 403 (122) 2 752 31 732 507 - 10 111 92 249
50

Separate statement of changes in shareholders’ equity for the year ending 30/6/2019
Paid-up capital
General banking risks
reserve
Legal reserve
"Generalreserve"
Capital reserve
Supportive reserve
"Specialreserve"
Cash flow hedge
reserve
"AFS investments changes in fair value reserve"
Difference between the nominal and
present value of subordinated
loan
Foreign currency
translation differences for overseas
branches
"IFRS 9 risk
reserve"
Retained earnings Total
Balance at the beginning of the year as of 01/07/2017
28 650 3 247 3 556 33 22 - 403 (48) 2 854 33 365 418 - 13 434 85 934
Transferred to reserves
- 1 426 1 342 1 065 11 7 514 - - - - 100 - (11 458) -
Shareholders' dividends - - - - - - - - - - - - (1 017) (1 017)
Employees' dividends - - - - - - - - - - - - (959) (959)
Paid-up capital increase 6 350 - - - - ( 6 350) - - - - - - - -
Net changes in reserves of AFS financial investments (after tax)
- - - - - - - - (102) - - - - (102)
Net changes in reserves of financial derivatives
- - - - - - - (74) - - - - - (74)
Movement of the year for overseas branches' foreign translation differences
- - - - - - - - - - (11) - - (11)
CBE subordinated loan differences between nominal value and present value
- - - - - - - - - (1 633) - - - (1 633)
Net profit - - - - - - - - - - - - 10 111 10 111
Balance as at 30/06/2018
35 000 4 673 4 898 1 098 33 1 164 403 (122) 2 752 31 732 507 - 10 111 92 249
51 2018 / 20192018 / 2019

Separate statement of changes in shareholders’ equity for the year ending 30/6/2019
Paid-up capital
General banking risks
reserve
Legal reserve
"Generalreserve"
Capital reserve
Supportive reserve
"Specialreserve"
Cash flow hedge
reserve
"AFS investments changes in fair value reserve"
Difference between the nominal and
present value of subordinated
loan
Foreign currency
translation differences for overseas
branches
"IFRS 9 risk
reserve"
Retained earnings Total
Beginning balance as of 01/07/2018
35 000 4 673 4 898 1 098 33 1 164 403 (122) 2 752 31 732 507 - 10 111 92 249
Shareholders ' dividends - - 1 009 216 21 1 246 - - - - 6 926 ( 9 418) -
Employees' dividends - - - - - - - - - - - - (499) (499)
Paid-up capital increase - - - - - - - - - - - - (194) (194)
Net changes in reserves of AFS financial investments (after tax)
- - - - - - - 5 - - - - 5
Net changes in reserves of financial derivatives
- - - - - - - 142 - - - - - 142
Movement of the year for overseas branches' foreign translation differences
- - - - - - - - - - (107) - - (107)
CBE subordinated loan differences between nominal value and present value
- - - - - - - - - (1 932) - - - (1 932)
Net profit - - - - - - - - - - - - 20 205 20 205
Balance as at 30/06/2019
35 000 4 673 5 907 1 314 54 2 410 403 20 2 757 29 800 400 6 926 20 205 109 869
52

Separate statement of changes in shareholders’ equity for the year ending 30/6/2019
Paid-up capital
General banking risks
reserve
Legal reserve
"Generalreserve"
Capital reserve
Supportive reserve
"Specialreserve"
Cash flow hedge
reserve
"AFS investments changes in fair value reserve"
Difference between the nominal and
present value of subordinated
loan
Foreign currency
translation differences for overseas
branches
"IFRS 9 risk
reserve"
Retained earnings Total
Beginning balance as of 01/07/2018
35 000 4 673 4 898 1 098 33 1 164 403 (122) 2 752 31 732 507 - 10 111 92 249
Shareholders ' dividends - - 1 009 216 21 1 246 - - - - 6 926 ( 9 418) -
Employees' dividends - - - - - - - - - - - - (499) (499)
Paid-up capital increase - - - - - - - - - - - - (194) (194)
Net changes in reserves of AFS financial investments (after tax)
- - - - - - - 5 - - - - 5
Net changes in reserves of financial derivatives
- - - - - - - 142 - - - - - 142
Movement of the year for overseas branches' foreign translation differences
- - - - - - - - - - (107) - - (107)
CBE subordinated loan differences between nominal value and present value
- - - - - - - - - (1 932) - - - (1 932)
Net profit - - - - - - - - - - - - 20 205 20 205
Balance as at 30/06/2019
35 000 4 673 5 907 1 314 54 2 410 403 20 2 757 29 800 400 6 926 20 205 109 869
53 2018 / 20192018 / 2019

Notes to the separate financial statements
For the year ending 30/6/2019
1- General information National Bank of Egypt (S.A.E) was established as a commercial bank on 25/6/1898 and operates in conformity with Law No. 88 for 2003 in Arab Republic of Egypt and head office is located in Cairo.
National Bank of Egypt (S.A.E) provides retail, corporate and investment banking services in Arab Republic of Egypt through its head office in Cairo and (483) branches, domestic financial units, representative offices in Johannesburg (South Africa), Dubai (United Arab of Emirates) and Addis Ababa (Ethiopia) and through branches in New York (United States), Shanghai (China). The bank has 20 771 employees at June 30,2019.
2- Summary of significant accounting policies
The principal accounting policies applied in the preparation of these financial statements are set out below. These policies have been consistently applied to all years presented, unless otherwise stated.
A. Basis of preparation of the separate financial statements
The separate financial statements have been prepared in accordance with Egyptian Accounting Standards issued on 2006 and its amendments and Central Bank of Egypt instructions approved by its Board of Directors on 16 December 2008. And its appendices of explanatory instructions in April 2009. Under the historical cost convention, as modified by the revaluation of trading financial assets and liabilities, financial assets and financial liabilities classified at inception at fair value through profit and loss, available for sale investments, and all financial derivatives contracts.
B. Foreign currency translationB/1 Functional and reporting currency
Financial statement items for overseas branches balances are measured using the main economic environment currency where the branch` activities are in (functional currency). The financial statements of the Bank are presented in Egyptian pounds, which is the Bank’s functional and reporting currency.
B/2 Transactions and balances in foreign currencies
The Bank maintains its accounting records in Egyptian pounds. Foreign currency transactions during the year are translated into Egyptian pound using the prevailing exchange rates on the date of the transaction.
Monetary assets and liabilities denominated in foreign currencies are re-evaluated at the end of each year at the prevailing exchange rates on that date. Foreign exchange gains and losses resulting from settlement of such transactions and valuation differences are recognized in the income statement under the following line items:
• Net trading income or net income of the financial instruments classified at inception in fair value through the profit and loss of trading assets / liabilities or those classified at inception in fair value through profit and loss according to their type.
• Shareholders’ equity for financial derivatives which are eligible for qualified hedge for cash flows or qualified hedge for net investment.
• Other operating income (expenses) for the remaining items.
Changes in the fair value of the financial instruments with monetary nature in foreign currencies, classified as investments available for sale (debt instruments), are analyzed into valuation differences resulting from changes in amortized cost of the instrument, differences resulting from changes in the prevailing exchange rates or differences resulting from changes in the instrument`s fair value. The valuation differences resulting from the change in amortized cost are recognized in income statement within ‘’Interest income on loans and similar income’’. The differences resulting from the changes in the exchange rates are recognized in “Other operating income (expenses) ‘’, whereas the change in fair value (fair value reserve/financial investments available for sale) are recognized within shareholders` equity.
The revaluation differences resulting from items other than those with monetary nature include the profit and losses resulting from the change of the fair value such as the equity instruments held in fair value through profit and loss. The revaluation differences resulting from equity instruments classified as financial investments available for sale are recognized within the fair value reserve in the shareholders` equity.
B/3 Overseas branches
Financial position/ Results of overseas branches` are translated to the bank’s reporting currency (if these branches do not operate in a rapidly inflated environment) which is different to its functional currency as follows:
- Assets and liabilities for each presented balance sheet of foreign branches are translated using the balance sheet closing rate.
54

- Revenues and expenses for each foreign branch` income statement are translated using average exchange rates unless this average is not reasonable approximate of the cumulative effect of the prevailing rates on transactions dates. In which case, revenues and expenses are translated at the dates of transactions
- Resulted foreign currencies translation are recognized in the shareholders` equity as (foreign currency translation differences). In addition, exchange differences arising from foreign branches revaluation of net investment, loans and financial instruments assigned for hedging this investment are also carried forward to shareholders` equity within foreign currency translation differences caption. Such amounts are recognized in income statement as “other operating income (loss)” when disposing the foreign branch.
C. Financial assetsThe Bank classifies its financial assets in the following categories: Financial assets designated at fair value through profit or loss; loans and receivables; held-to-maturity investments; and available-for-sale financial investment. Management determines the classification of its investments at initial recognition.
C/1 Financial assets designated at fair value through profit or loss
Which include trading financial assets. The financial instrument is classified on the basis that it is held for trading if it is acquired or inquired principally for the purpose of selling in the short term or if it is a part of a portfolio of identical financial instruments that are managed together for which there is an evidence of recent actual pattern of short term profit making.
C/2 Loans and advances
Loans and advances are non-derivative financial assets with fixed or determinable payments that are not quoted in an active market, other than:
- Those that the bank intends to sell immediately or in the short term which are classified as trading, or those that the bank upon initial recognition designated as at fair value through profit or loss.
- Those that the bank upon initial recognition designates as available for sale.
- Those for which the Bank may not recover substantially all of its initial investment, other than because of credit deterioration.
C/3 Held to maturity financial investment
Held to maturity investments are non-derivative financial
assets that carry fixed or determinable payments and where the bank has the intention and the ability to hold to maturity. Any sale of a significant amount, not close to the date of its maturity, would result in the reclassification of all held to maturity investments as available for sale except cases of necessity.
C/4 Available for sale financial investment
Available for sale investments are non-derivatives financial assets that are intended to be held for an indefinite period of time, which may be sold in response to needs for liquidity or changes in interest rates, exchange rates, or equity prices.
C/5 Subsidiaries
Which are all entities (including special purpose entities/SPEs) which the Bank has owned directly or indirectly the control to govern it’s financial and operating policies. Generally, the bank owns accompanying shareholding of more than one half of the voting rights. The existence and effect of potential voting rights that are currently exercisable or convertible are considered when assessing whether the Bank has the ability to control the entity or not.
C/6 Associates
Which are all entities over which the Bank has owned directly or indirectly significant influence but not reach the extent of control, generally the bank owns accompanying shareholding between 20% and 50% of the voting rights.
The acquisition method of accounting is used to account for the purchase of the entities by the Bank. The cost of an acquisition is measured at the fair value, the assets incurred by the bank accounted for the purchase process, equity instruments issued, the liabilities incurred by the bank or the liabilities assumed on behalf of the acquired company at the date of acquisition, plus any costs directly related to the acquisition.
- Net assets including the identifiable contingent liabilities assumed in a business combination are measured initially at their fair values at the acquisition date, irrespective of any non-controlling interest. The excess of the acquisition cost over the Bank’s share of the fair value of the identifiable net assets acquired is recorded as goodwill. If the acquisition cost is less than the Bank’s share of the fair value of the identifiable net assets, the difference is recognized directly in the income statement as “Other operating income(expenses)”,
The cost method is applied to account for investment in associates and subsidiaries in the separate financial
55 2018 / 20192018 / 2019

statement. whereby, investments are recorded at acquisition cost including any goodwill deducting any impairment and dividends are recorded in the income statement in adoption of the distribution of these profits and evidence of the Bank right to collect them.
The followings are applied on financial assets:
- Purchase and sale transactions of the financial assets designated at fair value through profit and loss, held-to-maturity financial investments and available-for-sale investments shall be recognized same as the financial assets way of recognition at the date of trading on which the bank is committed to purchase or sell the asset.
- Financial assets are initially recognized at fair value plus transaction costs for all financial assets not carried at fair value through profit and loss while Financial assets carried at fair value through profit and loss are initially recognized at fair value, and transaction costs are expensed in the income statement as “Net trading income “
- Financial assets are derecognized when the rights to receive cash flows from the financial assets have expired or when the bank transfers substantially all risks and rewards of the ownership to another party, while a financial liability is derecognized when they are extinguished that is when the obligation is discharged or cancelled or expired.
- Available for sale financial investments and financial assets designated at fair value through profit and loss are subsequently measured at fair value. While loans and advances and held to maturity investments are measured subsequently at amortized cost.
- Gains and losses arising from changes in fair value of the financial assets designated at fair value through profit and loss are recognized in income statement during the year it occurred, while gains and losses arising from changes in fair value of available for sale financial investments are recognized directly in shareholders equity in “AFS investments changes in fair value reserve” until the financial assets are either sold, or became impaired at which time, the cumulative gain or loss previously recognized in equity is recognized in profit or loss.
- Interest income measured at amortized cost and gains and losses arising from foreign currency available for sale monetary assets are recognized in income statement, dividends related to available for sale equity instruments are recognized in the income statement when the right to receive payment has been established.
- The fair values of quoted investments in active markets are based on current Bid Prices. If there is
no active market for a financial asset, or no current demand prices available the Bank measures fair value using valuation techniques. These include the use of recent arm’s length transactions, discounted cash flow analysis, option pricing models and other valuation techniques commonly used by market participants, if the Bank has not been able to estimate the fair value of the equity instrument classified as available for sale, the value is measured at cost less any impairment.
- Available for sale investments that would have met the definition of loans and advances (bonds or loans) at initial recognition may be reclassified out to loans and advances or to financial assets held to maturity, as appropriate, for which the Bank has the intent and ability to hold these financial assets in the foreseeable future or till maturity date. The financial asset is reclassified at its fair value on the date of reclassification, and any profits or losses that have been recognized previously in equity, are treated based on the following:
1. If the reclassified financial asset has a fixed maturity date, the gains or losses are amortized over the remaining life of the investment held to maturity using the effective interest rate method. The differences between the amortized cost and the maturity date value are amortized over the remaining life of the financial asset by using the effective interest rate method. In case of subsequent impairment of the financial asset after reclassification, any gain or loss previously recognized in equity is recycled directly to the profits and losses.
2. In case of financial asset has infinite life, any previously recognized profit and loss in equity will remain until the sale of the asset or its disposal, in which it will be reclassified to profits and losses, in case of subsequent impairment of the financial asset after reclassification, any gain or loss previously recognized in equity is recycled directly to the profits and losses.
- If the bank adjusts its estimates of payments or receipts of financial asset that in return adjusts the carrying amount of the asset (or group of financial assets) to reflect the actual cash inflows and the change in this estimate, the carrying value is recalculated based on the present value of estimated future cash flows at the effective yield of the financial instrument and the differences are recognized in profit and loss.
- In all cases, if the bank reclassifies a financial asset according to the above criteria and increases its estimates of proceeds of future cash flow due to an increase in the recovered cash of these proceeds, this increase adjusts the effective interest rate of the asset starting from the reclassification date only without affecting the investment book value at the reclassification date.
56

D. Offsetting Between Financial Instruments
Financial assets and liabilities are offset when there is a legally enforceable right to offset the recognized amounts and there is an intention to settle on a net basis, or realize the asset and settle the liability simultaneously.
Agreements of repos & reverse repos are shown by the net in the financial statement in treasury bills and other governmental notes
E. Derivative Financial Instruments and Hedge Accounting
- Derivatives are recognized initially, at contract date and subsequently, at fair value. Fair values are recognized according to quoted market prices in active markets, the recent market deals, or using the valuation techniques including discounted cash flow models and option pricing models, as appropriate. Derivatives are classified as financial assets when the fair value is positive and as financial liabilities when the fair value is negative.
- The derivatives embedded in other financial instruments, such as the conversion option of convertible bonds into shares, are treated as separate derivatives when the economic features and risks are not closely related to the host contract provided that the host contract is not classified at fair value through profit and loss. These embedded derivatives are measured at the fair value with changes in fair value recognized in the income statement as ‘Net trading income’. The embedded derivatives will not be accounted for separately if the Bank determines to designate the entire hybrid contract as at fair value through profit and loss.
- The profit and loss arising from the fair value is recognized depending on whether the derivative is designed to be a hedge instrument and the nature or the hedged item. The Bank designates certain derivatives as one of the follows:
• Hedges for the fair value risk of the recognized assets and liabilities or the confirmed commitments (Fair Value Hedges)
• Hedges for the highly future expected cash flow risks attributable to a recognized asset or liability or attributable to a forecasted transaction (Cash flow hedges).
• Hedges of net investment in foreign operations (Net investment hedge)
The hedge accounting is adopted for the derivatives designed in a hedging relationship if they meet the following criteria.
At the inception of the hedging relationship, the Bank documents the relationship between the hedging instrument and the hedged item, along with its risk management objectives and its strategy for undertaking various hedge transactions. Furthermore, at the inception of the hedge, and on ongoing basis, the Bank documents whether the hedging instrument is expected to be highly effective in offsetting changes in fair values or the cash flow of the hedged item.
E/1 Fair value hedge
Changes in the fair value of derivatives that are designated and qualified as fair value hedges are recognized in profit and loss, together with any changes in the fair value of the hedged asset or liability that is attributable to the hedged risk.
The effective changes in the fair value of the interest rate swaps and related hedged items are accounted for as “Net Interest Income”. The effective changes in the fair value of the futures contracts is accounted for as “Net Trading Income”.
Any ineffectiveness in the above mentioned contracts and related hedged items are accounted for as “Net Trading Income”.
When the hedging instrument does not satisfy the requirement of the hedge accounting, the adjustment to the carrying amount of a hedged item, measured at amortized cost is being amortized through profit and loss over the maturity date. the adjustment to the carrying amount of the equity instrument will remain in equity till its disposal.
E/2 Cash flow hedge
The effective changes in the fair value of derivatives qualified for cash flow hedges are recognized in the shareholders’ equity. All gains and losses arising from the ineffective changes are recognized immediately in income statement as “Net Trading Income”.
The changes accumulated in shareholders’ equity is carried forward to Income Statement in the same periods the hedged item has an effect on the profit and loss. The profit and loss related to the effective part of the currency swaps and options are carried forward to ‘Net Trading Income”.
When the hedging instrument is matured, sold or does not satisfy the requirement of the hedge accounting, the profit or loss accumulated will remain in shareholders’ equity and it will be carried forward to Income Statement when the forecasted transaction is finally recognized. When there is no forecasted transaction to be conducted, the profit or loss accumulated in shareholders’ equity are carried forward immediately to Income Statement.
57 2018 / 20192018 / 2019

E/3 Net investment hedge
Similar to the cash flow hedges, all gains and losses arising from the effective portion of the hedging instrument are recognized in the shareholders’ equity, while all gains and losses arising from the ineffective portion are recognized in income statement. The profit or loss accumulated in shareholders’ equity is carried forward to the Income Statement when the foreign operations are disposed.
E/4 Unqualified derivatives for hedge accounting
All changes in the fair values of derivatives that do not satisfy the requirements of hedge accounting are recognized in the income statement as “Net Trading Income”. all gains and losses arising from the changes in the fair value of the derivatives managed in conjunction with the financial assets and liabilities designated at inception in fair value are recognized in income statement in the line item “Net income of financial instrument designated at inception in fair value”.
F. Income and Expense of Interest Interest income and Expense for all financial instruments except for those classified as held for trading investments or designated at fair value through profit and loss are recognized in ‘’ Interest income on loans and similar income’’ or ‘’ Interest expense on deposits and similar expense’’ in the income statement using the effective interest method.
The effective interest method is a method of calculating the amortized cost of a financial asset or liability and of allocating the interest income or interest expense over the relevant year. The effective interest rate is the rate that exactly discounts estimated future cash payments or receipts through the expected life of the financial instrument or, when appropriate, a shorter period to the net carrying amount of the financial asset or financial liability.
When calculating the effective interest rate, the Bank estimates cash flows considering all contractual terms of the financial instrument (for example, prepayment options) but does not consider future credit losses.
The calculation includes all fees paid or received between the contract`s parties, that represents an integral part of the effective interest rate, the cost of the transaction includes all premiums or discounts.
Once loans or debts are classified as non-performing or impaired, the revenue of interest income will not be recognized but rather, are carried off balance sheet in statistical records and are recognized as revenues according to cash basis as per the following:
- When all arrears are collected for consumer loans, personnel mortgages and micro-finance loans.
- For loans granted to corporate, interest is recognized on cash basis according to the rescheduling agreement conditions until paying 25% from rescheduled payments for a minimum performing period of one year, if the customer continues to perform, the calculated interest will be recognized in interest income (interest on the performing rescheduling agreement balance) without the marginalized before
G. Fees and Commission IncomeFees and commissions charged for servicing a loan or advances are recognized as revenue when the service is provided. Fees and commission on non-performing or impaired loans and debts cease to be recognized as income and are carried off balance sheet in statistical records. These are recognized as revenue, on cash basis, only when interest income on those loans is recognized. Commitment fees and related direct costs for loans and advances where draw down is probable are deferred as this commitment fees represents compensation for the continuing interfere to own the financial asset and recognized as an adjustment to the effective interest on the loan.In case, fees and commission regarding an expired commitment term without issuing the loan are recognized as revenue at the maturity of the commitment term.Fees on the debt instruments that are measured at fair value through profit and loss are recognized as revenue on its initial recognition and syndicated loan fees received by the Bank are recognized when the syndication has been completed and the Bank does not hold any portion of it or holds a part at the same effective interest rate used for the other participants’ portions.Commission and fee arising from negotiating, or participating in the negotiation of a transaction for a third party such as the arrangement of the acquisition of shares or other financial instrument and the purchase or sale of properties are recognized upon completion of the underlying transaction in the income statement.Other management advisory and service fees are recognized based on a relative time –basis throughout the service performing term. Financial planning and custody services fees that are provided on long term are recognized over the year in which the service is provided.
H. Dividend IncomeDividends are recognized in the income statement when the right to collect it is declared.
58

I. Repurchase agreement and resale agreement
Sold securities subjected to repurchase agreements (Repos) are presented in the financial statements added to treasury bills and other governmental notes balance. Reverse Repos are presented in the financial statements deducted from treasury bills and other governmental notes balance. The difference between sale and buyback (repurchase) price is stated as interest and accrued over the life of the agreements using the effective interest rate method.
J. Impairment of Financial AssetsJ/1 Financial assets recognized at amortized cost
On each balance sheet date, the bank estimates whether there is an objective evidence that a financial asset or group of financial assets is impaired. An impairment loss will be recognized provided that there was an objective evidence of impairment as a result of one or more events that occurred after the initial recognition of the asset (a “loss event/s”) and these loss events has an impact on the estimated future cash flows of the financial asset or group of financial assets that can be reliably estimated.
The bank considers any of the following indicators to determine the existence of substantive evidence for impairment losses:
• Significant financial difficulties of the borrower or the debtor.
• Violation of the loan agreement conditions such as non-payment.
• Expected bankruptcy or liquidation lawsuit of the borrower or re-structuring the amount of finance granted.
• Deterioration of the borrower competitive position.• For economic or legal reasons related to the financial
difficulties of the borrower, the bank grants benefits and concessions may not be granted in normal circumstances
• Impairment in the value of collaterals.
• Deterioration of creditworthiness.
An objective evidence of impairment loss for a group of financial assets is an observable data indicating a measurable decrease in the estimated future cash flows from this group of financial asset since its initial recognition although such decrease cannot be measurable on each asset separately for example the increasing in the number of default cases for a particular banking product.
The bank estimates the period between a losses occurring and its recognition for each specific portfolio,
in general it varies between 3 to 12 months.
The Bank first estimates whether an objective evidence of impairment exists individually for financial assets that are individually significant, and individually or collectively for financial assets that are not individually significant, taking into the consideration the following:
• If the bank determines that no objective evidence that an impairment loss has been incurred on a financial asset considered individually, whether significant or not, then the bank includes that financial asset in a group of financial assets with a similar credit risk characteristics and assess collectively the whole group for impairment according to the historical default ratios.
• An individually impairment test is made for a financial asset if there is an objective evidence of impairment for this financial asset. If the impairment occurred, then this asset will be separated from group of financial assets that are collectively evaluated for impairment.
• If the result of the previous assessment did not recognize impairment loss, then this asset will be added to the group of financial assets.
Impairment loss is calculated by the difference between the assets` carrying amount and the present value of estimated future cash flows excluding future expected credit loss that have not been incurred yet, discounted at the financial assets’ original effective interest rate. And the carrying value of the financial asset is reduced through using “impairment loss provision”, the credit loss impairment charge is recognized in the income statement.
In case of loan, or held to maturity financial assets carry variable interest rate, the discount rate used for measuring any impairment loss is the effective interest rate according to the contract when there is an objective evidence of impairment loss. For practical purposes, the bank may measure the impairment loss according to the instrument’s fair value using a declared market price.
The present value of estimated futures cash flow of a collateralized financial asset should reflect the proceeds from the collateral’s foreclosing after deducting any relevant costs.
For the purposes of a collective evaluation of impairment, financial assets are grouped on the basis of similar credit risk characteristics as the group’s grading process of the bank bases on the type of asset, industry, geographical location, collaterals type, past-dues and other relevant factors.Those characteristics are relevant to the estimation of future cash flows of each group of assets by being an indicators of the debtors’ ability of payment amounts due according to contractual terms of assets under study.
59 2018 / 20192018 / 2019

When the impairment for a group of financial asset is assessed according to the historical default ratios, the estimated future cash flow of the group of financial asset is collectively evaluated according to the Bank’s assets contractual cash flows and the historical loss of the of assets. the historical loss of assets is amended according to the current observable data that reflects the effects of current circumstances that did not affect the period on which the historical loss is determined and also to remove the effects of the historical circumstances that are no longer exist. The bank has to ensure that the estimation of changes in cash flows of group of financial assets reflects the changes in relative trustable data from period to period, such as, changes in unemployment rates, property prices, settlement status, or other indicative factors that may affect the changes in the probability of group losses and their magnitude. The Bank reviews the methodologies and assumptions used for estimation of future cash flow on a periodic basis.
J/2 Available for sale investments
On each balance sheet date, the bank estimates whether there is an objective evidence that a financial asset or group of financial assets classified as available-for-sale or held to maturity is impaired. For equity instrument classified as available for sale investment, impairment is recognized when the instrument’s fair value decline below its acquisition cost and this decline considered as a significant and a prolonged.
The decline in value is considered significant for the equity instruments, if it reaches 10% of the financial instrument’s book value, and it is considered as a prolonged decline, if it continues for more than 9 months. When the mentioned evidence is available, the accumulated loss in equity is carried forward to income statement. The impairment of equity instrument recognized in income statement is not reversed if any fair value increase occurred in a subsequent period, but if any increase in the fair value of debit instrument classified as available for sale was objectively related to an event subsequent to the impairment recognition in income statement, the impairment is reversed through profit and loss.
K. Investment property Investments property represents lands and buildings owned by the bank in order to obtain rental revenue or capital gains. Consequently, these investments do not include properties used by the bank for its operations and activities or the assets reverted to the bank as settlement of debts. The accounting treatment used for fixed asset is the same applied for investment property.
L. Intangible AssetsL/1 Software (computer programs)The expenses related to upgrading or maintenance of computer programs, are to be recognized as expenses in income statement, when incurred. The expenses directly related to a specific software program and subjected to the bank’s control and expected to produce economic benefits exceeding its cost for more than one year, are to be recognized as an intangible asset. The direct expenses include cost of software upgrading staff and a suitable portion of respective overhead expenses.
The expenses leading to an increase or expansion of computer software performance beyond their original specifications are recognized as an upgrading cost and are added to the original software cost.
The cost of computer software recognized as an asset shall be amortized over the expected useful life, but not exceeding three years.
L/2 Other intangible assetsOther intangible assets are intangible assets other than goodwill and computer software (for instance: trademarks, license, and benefits of rental agreement).
Other intangible assets are recognized at acquisition cost and amortized over its estimated useful life using straight-line method or according to expected economic benefits. Other intangible assets with indefinite useful life are not subjected to amortization; however, it will be tested for impairment annually and charged to income statement if any.
M. Fixed AssetsLands and buildings comprise mainly in head office, branches and offices. All fixed assets are reported at historical cost minus depreciation and impairment losses. The historical cost includes the expenditures directly related to the acquisition of fixed assets items.
Subsequent costs are included in the asset’s carrying value or are recognized as a separate asset, as appropriate, only when it is probable that future economic benefits associated with the item will flow to the Bank and the cost of the item can be measured reliably. Maintenance and repair expenses are charged to other operating expenses during the year in which they are incurred.
Leasehold improvements are charged as an expense on income statement. Automated integrated machinery (computer software).
Land is not depreciated. Depreciation of other assets is calculated using the straight-line method to allocate their cost to their residual values over their estimated useful lives, as follows:
60

Building 20 years
Furniture 4 years
Fixture and fittings 10 years
Vehicles 5 years
Automated integrated machinery (computer
software)4 years
Vault doors 10 years
N. Impairment of Non-Financial AssetsAssets with indefinite useful life other than goodwill are not amortized however, it will be tested for impairment annually. Depreciable assets shall be reviewed for impairment, whenever there are events or changes in circumstances indicating that the book value may not be recoverable.
An impairment loss is recognized and the asset`s value is reduced for the amount by which the asset`s carrying amount exceeding its recoverable amount. The recoverable amount is the higher of an asset`s net selling value or the value in use. For impairment test purposes, Assets are attributed to the lowest level of cash generating unit(s) and the recognized impairment of non-financial assets is reviewed to determine reversal of impairment to income statement on each balance sheet date.
O. Cash and Cash EquivalentsFor the purposes of the cash flows statement, cash and cash equivalents comprise balances with maturity of three months from the date of acquisition, balances with Central banks over the obligatory reserve outline, due from banks and treasury bills and other governmental notes.
P. Other ProvisionsProvisions for restructuring costs and legal claims are recognized when the Bank has a legal or a present constructive obligation as a result of past events; where it is more likely to use the bank’s resources to settle these obligations that can be reliably estimated.
Where there are similar obligations, a cash outflow is determined in order to settle these obligation as a group and a provision is recognized even if the probability of a cash outflow with respect to any obligation in the group is minimal. Provisions totally or partially no longer required are reversed in other operating income (expense).
The present value of the expected payments required to settle obligations with maturity one year after balances sheet date are measured using a suitable interest rate
to the settled obligation maturity, excluding the effect of applicable tax rate and reflecting the time value of money.
In case the maturity is less than one year, then the estimated amount of the obligation is determined, unless having a significant effect, then the present value is used instead.
Q. Financial Guarantees ContractsThe financial guarantees contracts are contracts issued by the bank as a guarantee for loans or overdrafts granted by other entities to the bank’s customers, which obligate the bank to pay certain compensation to the beneficiary for the loss incurred due to a default of the debtor on maturity date aligning with the debt instrument conditions. These financial guarantees are granted to the banks, corporations, financial institutions and other entities on behalf of the bank’s customers.
It is initially recognized in the financial statement at fair value which reflects the guarantee fees on the date of granting. Subsequently, the Bank’s obligation shall be measured by the initially recognized value less guarantee fees amortization, which is reported in the income statement using the higher of a straight-line method over the guarantee useful life or the best estimate of the required payment settlement of any financial obligation resulted from the financial guarantee on the balance sheet date. These estimates are mainly based on management experience with similar transactions and historical losses. Any increase in the obligations resulted from the financial guarantee, is recognized in income statement in “other operating income (expenses)” caption.
R. Employee’s BenefitsEmployee’s benefits include all financial and nonfinancial benefits provided by the bank to its employees for their offered services.
R/1 Short-term Employee’s BenefitsShort-term employees’ benefits include salaries and wages, social insurance subscription fees, paid annual leave, bonus (if accrued within 12 months from the financial period ends) and non-financial benefits (as healthcare, housing utilities, transportation, free and subsided services provided to current employees).
Short-term employees’ benefits are charged to the income statement as an expense for the period in which the service was provided to the bank’s employees who are entitled to receive these benefits.
R/2 Early termination-service’s Benefits
Early termination-service’s benefits include accrued benefits for the employees who were early terminated aligning with the approved regulations by board of
61 2018 / 20192018 / 2019

directors’. The bank recognizes the cost of such benefits at the effective date of early termination according to the optional early termination scheme in which the expenses are charged to the income statement for the period in which these benefits are accrued.
R/3 Pension benefits-specific subscription scheme
Social insurance:Pension benefits represent the bank’s contribution of the social insurance paid to the social insurance authority on behalf of its employees according to the Law of the Social Insurance No. (79) for the year of 1975 and its amendments. As the bank pays its contribution in the social insurance authority for each period. This contribution is charged to the income statement in salaries and wages reported in the general and administrative expenses caption for the period in which the bank’s employees provide their services. The bank’s obligation regarding the settlement of pension benefits is considered as a specific subscription scheme therefore no additional obligation regarding employee’s pension benefits is charged on the bank expect its contribution of social insurance that is accrued for the authority by the bank on behalf of its employee.
Special Insurance FundThe bank pays the fund’s share (the special insurance fund) from the determined annual variable wages according to the fund’s articles of association which enclose on paying the annual member’s subscription fees which is equal to six months of the employees shares The fund provides the determined one-installment benefit in cases of (Retirement in 60’s age, Death, Early termination and Resignation) in addition to post-retirement monthly pension for ten years varied according to the employee job ranking. The bank’s obligation of payment these benefits is considered as a specific subscription scheme.
R/4 Other Post-service’s benefits-healthcareThe bank provides healthcare benefits for pensioners after service ends, customarily on condition; the benefits are accrued whenever the employee is in service for 20 years. Generally, the healthcare commitment is considered as a specific subscription scheme. The recognized liability in the balance sheet regarding the pensioner’s healthcare system is measured at the present value of the determined liabilities on balance sheet’s date after deducting the fair value of the regulation’s assets and debiting (crediting) unrealized actuarial reconciliations of profits (losses) as well as the cost of the additional benefits regarding prior service terms.
An independent actuary who applies the Projected Unit Credit Method calculates the liability of the annually
determined benefits system (future cash flows expected to be paid). The present value of the determined benefits system liability is measured through deducting these expected future cash flows to be paid by applying the rate of return of high quality corporate bonds or the rate of return of government bonds in the same currency to be used in payment of benefits and which have almost the same maturity period as the pension benefits liabilities regarding these benefits.
Calculated gains (losses) resulting from changes and adjustments in actuarial estimates and assumptions are to be deducted from (the losses added to) the income statement if they do not exceed 10% of the determined benefit system’s assets value or 10% of the determined benefit system’s liability whichever is higher. In case gains (losses) rise above-mentioned percentage then the increase shall be deducted (added) in the income statement. The costs of previously mentioned-service are directly recognized in the income statement within administrative expenses caption unless the amendments of the retirements’ regulations are conditional to the remaining of the employee in services for a specific period of time.
R/5 Other post-employment benefits
The bank provides benefits for pensioners after service ends. Generally, the accrual of these benefits are conditional to, the remaining of the employees in service till the retirement age and the completion of a minimum period of service. The expected costs of these benefits are to be accrued over the employment period of time by adopting an accounting method similar to the method adopted in the specific subscription scheme.
P. Income TaxThe income tax on the profit and loss for the year includes both the current and deferred taxes. Income tax is recognized in the income statement except for income taxes relating to equity items that are recognized directly in the equity.
The income tax is recognized based on the net taxable income, using the applicable tax rate on the balance sheet date, in addition to prior years’ tax adjustments.
Deferred taxes arising from the temporary time differences between the book value of assets and liabilities allied with the accounting principle and the value allied with tax principles are recognized according to the expected manner to realize or settle the value of assets and liabilities using the applicable tax rate on the date of balance sheet.
The bank’s deferred tax assets are recognized when there is a weighted probability of realizing a taxable net profit in the future whereby this asset can be utilized. The deferred tax assets are reduced by the estimated
62

amount of the unrealized taxable profit in the following years. However, in case of increasing in the estimated taxable profit, the deferred tax assets will increase to the extent of previous reduction.
P. Borrowings The accrued loans by the bank are recognized initially at fair value net of transaction costs incurred. Loan is subsequently reported at amortized cost. Any difference between the net proceeds and the settlement value is recognized in the income statement over the borrowing’ period using the effective interest rate method.
3. Financial Risk ManagementThe bank, as a result of the exercised activities, is exposed to various financial risks. Since the basis of financial activity is to accept risks; some risks or risks grouped together are analyzed, evaluated and managed altogether. The bank intends to achieve a convenient balance between the risk and the return and to reduce the probable adverse effects on the bank’s financial performance. The most important type of risk is credit risk, market risk, liquidity risk and other operating risks. The market risk comprises of foreign currency exchange rates risk, rate of return risk and other pricing risks. The bank’s risk management policies are designed to identify, analyze these risks, set limits to the risk and control them through reliable methods and up-to-date information systems. The bank regularly reviews its risk management policies and systems and amend them to reflect the changes in market, products and services and emerging best practice.
Those risks are managed by risk department in the light of policies approved by Board of Directors. The risk department determines, evaluates and hedge the financial risks, in close collaboration with the bank’s various operating units, and the Board of Directors provides written principles for the overall risk management, in addition to a written policies covering specific risk areas, like credit risk, foreign currency exchange rate risk, rate of return risk, and the using of financial derivative and non–derivative instruments. Moreover, the risk department is independently responsible for a periodical review of risk management and control environment.
A. Credit Risk The bank is exposed to a credit risk, which is the risk arising from the default of one party. The credit risk is considered to be the most significant risk for the bank, therefore the risk department manages its risk exposure carefully. The credit risk is essentially represented in the lending activities which result in loans, advances and investing activities that leads to the arising of a debit instrument included in the bank’s financial assets.
The credit risk is also found in off balance sheet financial instruments, such as loan commitment. The managing and monitoring process on credit risk is centralized at credit risk management team at credit risk department that reports to Board of Directors and Head units on a regular basis.
A/1 Credit risk measurement
Loans and advances to banks and customersIn measuring credit risk for loans and advances to customers and banks, the bank reflects three components:
Probability of default by the customer or a third party on their contractual obligations.
The current position and the future weighted evolution from which the bank derive the exposure at default.
Loss given default.
The daily activities of the bank`s business involve measurement of credit risk which reflects the expected loss (the expected loss model) required by Basel committee on banking supervision, the operating measures may contradict with the impairment charge under the Egyptian Accounting Standard no. (26), which are based on the losses incurred on balance sheet data (the incurred losses model) rather than the expected losses (Note A/3)
The Bank evaluates the probability of default for each customer using internal evaluation techniques in order to separately categorize the eligibility of different types customers. These techniques are updated by considering the statistical analysis and the personal judgment of the credit officer to reach a convenient eligibility rating.
The bank’s customers are segmented into four eligibility rating. The bank’s eligibility rating scale, which is shown as below, assesses the probability of default for each eligibility rating category, which essentially means that credit positions migrate between the mentioned categories as the assessment of their probability of default changes. The assessment techniques are reviewed and updated whenever it’s necessary. Further, the bank periodically assesses the performance of the eligibility rating techniques and its predictability of the default cases.
*The Bank’s internal classification categories:
Rating Description of the grade
1 Performing loans
2 Regular watching
3 Watch list
4 Non-performing loans
63 2018 / 20192018 / 2019
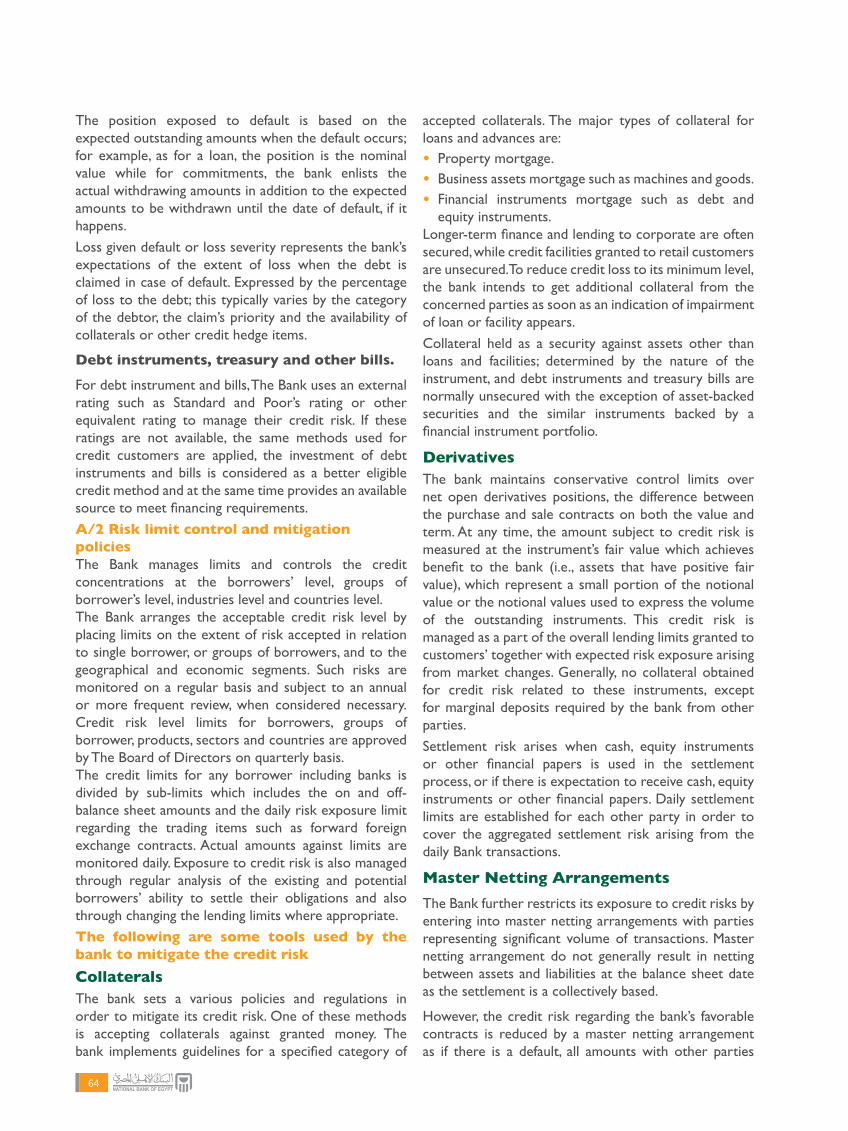
The position exposed to default is based on the expected outstanding amounts when the default occurs; for example, as for a loan, the position is the nominal value while for commitments, the bank enlists the actual withdrawing amounts in addition to the expected amounts to be withdrawn until the date of default, if it happens.
Loss given default or loss severity represents the bank’s expectations of the extent of loss when the debt is claimed in case of default. Expressed by the percentage of loss to the debt; this typically varies by the category of the debtor, the claim’s priority and the availability of collaterals or other credit hedge items.
Debt instruments, treasury and other bills.
For debt instrument and bills, The Bank uses an external rating such as Standard and Poor’s rating or other equivalent rating to manage their credit risk. If these ratings are not available, the same methods used for credit customers are applied, the investment of debt instruments and bills is considered as a better eligible credit method and at the same time provides an available source to meet financing requirements.
A/2 Risk limit control and mitigation policiesThe Bank manages limits and controls the credit concentrations at the borrowers’ level, groups of borrower’s level, industries level and countries level.The Bank arranges the acceptable credit risk level by placing limits on the extent of risk accepted in relation to single borrower, or groups of borrowers, and to the geographical and economic segments. Such risks are monitored on a regular basis and subject to an annual or more frequent review, when considered necessary. Credit risk level limits for borrowers, groups of borrower, products, sectors and countries are approved by The Board of Directors on quarterly basis.The credit limits for any borrower including banks is divided by sub-limits which includes the on and off-balance sheet amounts and the daily risk exposure limit regarding the trading items such as forward foreign exchange contracts. Actual amounts against limits are monitored daily. Exposure to credit risk is also managed through regular analysis of the existing and potential borrowers’ ability to settle their obligations and also through changing the lending limits where appropriate.
The following are some tools used by the bank to mitigate the credit riskCollateralsThe bank sets a various policies and regulations in order to mitigate its credit risk. One of these methods is accepting collaterals against granted money. The bank implements guidelines for a specified category of
accepted collaterals. The major types of collateral for loans and advances are: • Property mortgage.• Business assets mortgage such as machines and goods. • Financial instruments mortgage such as debt and
equity instruments.Longer-term finance and lending to corporate are often secured, while credit facilities granted to retail customers are unsecured. To reduce credit loss to its minimum level, the bank intends to get additional collateral from the concerned parties as soon as an indication of impairment of loan or facility appears.
Collateral held as a security against assets other than loans and facilities; determined by the nature of the instrument, and debt instruments and treasury bills are normally unsecured with the exception of asset-backed securities and the similar instruments backed by a financial instrument portfolio.
DerivativesThe bank maintains conservative control limits over net open derivatives positions, the difference between the purchase and sale contracts on both the value and term. At any time, the amount subject to credit risk is measured at the instrument’s fair value which achieves benefit to the bank (i.e., assets that have positive fair value), which represent a small portion of the notional value or the notional values used to express the volume of the outstanding instruments. This credit risk is managed as a part of the overall lending limits granted to customers’ together with expected risk exposure arising from market changes. Generally, no collateral obtained for credit risk related to these instruments, except for marginal deposits required by the bank from other parties.
Settlement risk arises when cash, equity instruments or other financial papers is used in the settlement process, or if there is expectation to receive cash, equity instruments or other financial papers. Daily settlement limits are established for each other party in order to cover the aggregated settlement risk arising from the daily Bank transactions.
Master Netting Arrangements The Bank further restricts its exposure to credit risks by entering into master netting arrangements with parties representing significant volume of transactions. Master netting arrangement do not generally result in netting between assets and liabilities at the balance sheet date as the settlement is a collectively based.
However, the credit risk regarding the bank’s favorable contracts is reduced by a master netting arrangement as if there is a default, all amounts with other parties
64

using the master netting arrangement is terminated and settled. The value of the credit risk exposure arising from derivatives instrument subject to master netting agreement is changed in short term as it is affected by each transaction subject to this agreement.
Credit-related commitmentsThe primary purpose of credit-related commitments is to ensure that funds are available to customer when required. Guarantees and standby letters of credit carry the same credit risks as loans.
Documentary and commercial letters of credit – which are issued by the Bank on behalf of its customer by which a third party grants the right to draw within a stipulated limit subjected to a specific terms and conditions that are collateralized by the goods under shipment. Therefore, a lower risk than a direct loan is carried.
Credit-related commitments represent the unused portion of the authorized granting for credit limit of loans, collaterals or letters of credit. With respect to credit risk arising from credit-related commitments, the Bank is exposed to a probable loss of an amount equal to the total unused commitment. However, the expected weighted amount of loss is less than the unused commitments, as the most of credit-related commitments are contingent liabilities for customers with specific credit criteria. The
Bank monitors the maturity term of the credit-related commitments because the longer-term commitments generally have a greater degree of credit risk than the shorter-term commitments.
A/3 Impairment and provisioning policies
The internal rating systems described in Note (A-1) focus more on credit-quality planning at the inception of lending and investment activities. Otherwise, impairment losses recognized at the balance sheet date for financial reporting purposes and based on objective evidence of impairment allied with this note criteria and due to the different applicable methodologies, the amounts of incurred impairment losses charged to the financial statements are usually lower than the amount determined from the expected loss model that is used in calculating the impairment loss provision and for CBE regulations purposes Note (A-4).
The impairment loss provision reported in the balance sheet at the end of the year is derived from the four internal rating grades. However, the majority of the impairment loss provision derived from the last two ratings. The following table illustrate the percentage of in-balance sheet items regarding loans and advances and their relevant impairment provision for each internal rating category:
Bank’s rating30/6/2019 30/6/2018
Loans andadvances %
Impairmentprovision %
Loans andadvances %
Impairmentprovision %
Performing loans 75.2 13.5 72.9 4.5
Regular watch 20.9 35.7 21,7 33,4
Special watch 2.2 25.7 3,5 33,2
Non-performing loans 1.7 25.1 1,9 28,9
100 100 100 100
The Bank’s internal rating assists management to determine whether objective evidence of impairment exists under EAS 26, based on the following criteria set by the Bank:
- Significant financial difficulties of the borrower or the debtor.
- Breach of loan conditions like non-payment - Expected bankruptcy or liquidation lawsuit of the borrower or re-structuring the amount of finance granted.
- Deterioration of the borrower competitive position. - For economic or legal reasons related to the financial difficulties of the borrower, the bank grants benefits and concessions may not be granted in normal circumstances.
Deterioration of creditworthinessThe Bank’s policies require review of all financial assets (that exceed specific materiality) at least annually or more whenever required, the impairment charge for the individually evaluated accounts is measured by assessing case by case incurred losses at balance sheet date. These policies are applied on all individual account with a specific materiality. Generally, these assessments comprise the current collaterals, the probability of collaterals acquisition and the expected proceeds from those accounts.
65 2018 / 20192018 / 2019

A collective impairment loss provision for a group of similar assets is provided using the available historical experience, personal judgment and statistical techniques.
A/4 Pattern of measure banking general riskIn addition to the four categories of credit rating indicated in note (A/1) the management makes more categories in shape of more detailed subgroups in accordance with the CBE requirements, Assets exposed to credit risk in these categories are classified according to detailed conditions and terms depending on customer’s information about, his activities, financial position and his regularity of making payment.
The Bank calculates the provisions required for impairment of assets exposed to credit risk, including credit-related commitments on the basis of determined rates by CBE. In case, the provision required for impairment losses as per CBE regulations exceeds the provision required for financial statements preparation purposes according to the EAS, this increase shall be reduced from “the retained earnings” caption and carried forward to the “general Banking risk reserve” caption in equity. This reserve is amended in a regular basis by increasing or decreasing, as it always shall be equivalent to the amount of increase between the two provisions. This reserve is not available for distribution.
The following are categories of institution worthiness according to internal ratings compared to CBE ratings and rates of required provision for impairment of assets exposed to credit risk:
CBE Rating Category Provision % Internalrating Internal categorization
1 Low risk 0 1 Performing loans
2 Average risk 1 1 Performing loans
3 Satisfactory risk 1 1 Performing loans
4 Reasonable risk 2 1 Performing loans
5 Acceptable risk 2 1 Performing loans
6 Marginally acceptably risk 3 2 Regular watching
7 Watch list 5 3 Watch list
8 Substandard 20 4 Non-performing loans
9 Doubtful 50 4 Non-performing loans
10 Bad debt 100 4 Non-performing loans
66

A/5 Maximum limits for credit risk before collaterals
Credit risky items' exposure in the balance sheet: 30/6/2019EGP mn
30/6/2018EGP mn
Treasury bills and other governmental notes 271 244 297 262
Due from banks 490 507 524 255
Loans and advances to banks (1) 2 459 1 865
Loans and advances to customers:
Individual loans:
Overdrafts 5 188 6 722
Credit cards 5 028 3 845
Personal loans 54 040 28 745
Mortgage loans 7 807 4 417
Auto loans 1 171 1 780
Total Individual loans (2) 73 234 45 509
Corporate loans:
Overdrafts 163 677 146 127
Direct loans 242 006 189 874
Syndicated loans 63 277 73 613
Total Corporate loans (3) 468 960 409 614
Total loans to customers and banks (1+2+3) 544 653 456 988
Financial derivative instruments 292 36
Financial investments:
Debt instruments 245 595 163 385
Other assets* 20 760 14 627
Total credit risk exposure items 1 573 051 1 456 553
* Represented in the amount of the current accrued revenues.
67 2018 / 20192018 / 2019
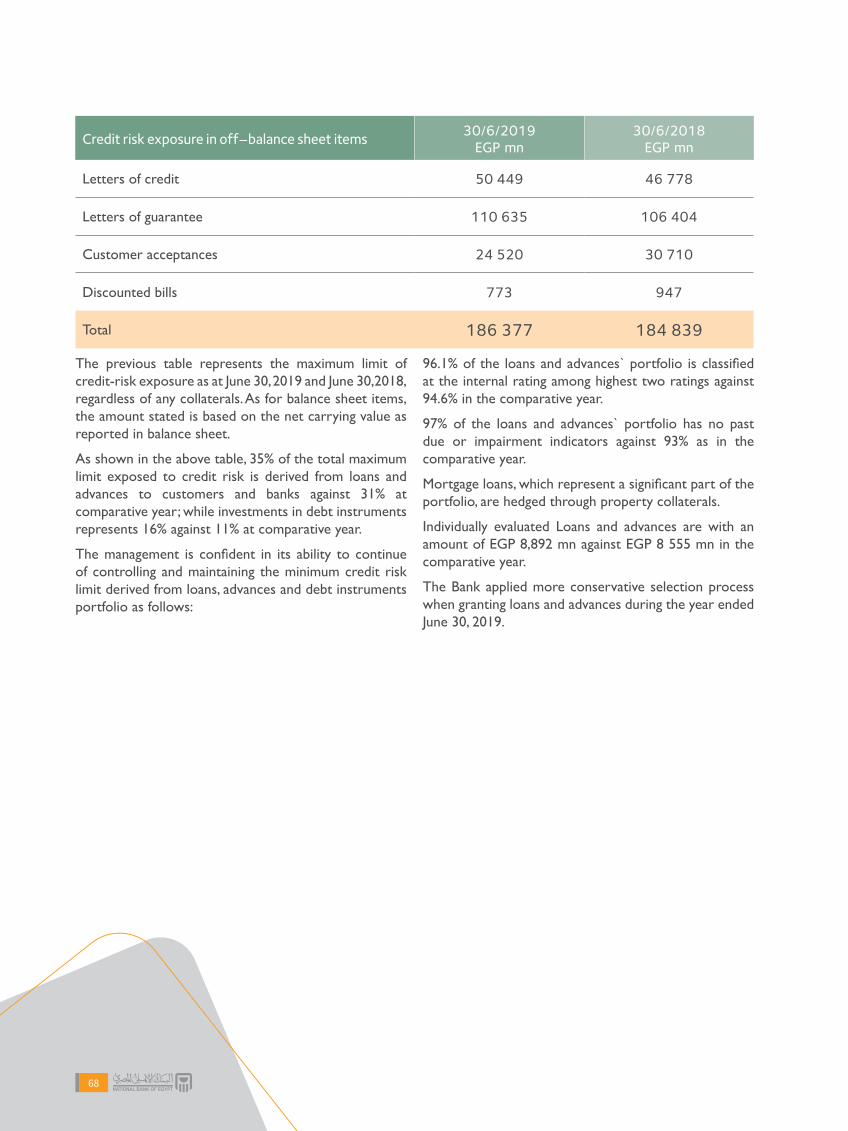
Credit risk exposure in off-balance sheet items 30/6/2019EGP mn
30/6/2018EGP mn
Letters of credit 50 449 46 778
Letters of guarantee 110 635 106 404
Customer acceptances 24 520 30 710
Discounted bills 773 947
Total 186 377 184 839
The previous table represents the maximum limit of credit-risk exposure as at June 30, 2019 and June 30,2018, regardless of any collaterals. As for balance sheet items, the amount stated is based on the net carrying value as reported in balance sheet.
As shown in the above table, 35% of the total maximum limit exposed to credit risk is derived from loans and advances to customers and banks against 31% at comparative year; while investments in debt instruments represents 16% against 11% at comparative year.
The management is confident in its ability to continue of controlling and maintaining the minimum credit risk limit derived from loans, advances and debt instruments portfolio as follows:
96.1% of the loans and advances` portfolio is classified at the internal rating among highest two ratings against 94.6% in the comparative year.
97% of the loans and advances` portfolio has no past due or impairment indicators against 93% as in the comparative year.
Mortgage loans, which represent a significant part of the portfolio, are hedged through property collaterals.
Individually evaluated Loans and advances are with an amount of EGP 8,892 mn against EGP 8 555 mn in the comparative year.
The Bank applied more conservative selection process when granting loans and advances during the year ended June 30, 2019.
68

A/6 Loans and advancesLoans and advances are summarized as follows according to credit worthiness:
Items
30/6/2019EGP mn
30/6/2018EGP mn
Loans and advances tocustomers
Loans and advances to
banks
Loans and advances tocustomers
Loans and advances to
banks
Neither having past dues nor subject to impairment 523 686 2 459 422 071 1 865
Having past due but not subject to impairment 9 616 - 24 497 -
Subject to impairment 8 892 - 8 555 -
Total 542 194 2 459 455 123 1 865
Less: (24 957) (5) (21 445) -
Impairment loss provision
Net*517 237 2 454 433 678 1 865
*this net amount is before excluding the interest in suspense and the unearned discounts.
The total impairment provision of loans and advances reached to EGP 24,957 mn against EGP 21,445 mn in the comparative year including an amount of EGP 6,278 mn against EGP 6,208 mn in the comparative year representing individually impaired loan and the remaining
amount of EGP 18,679 mn against EGP 15,237 mn in the comparative year, represents a collective impairment loss provision for credit-portfolio. Note (20) includes further information about impairment loss provision of loans and advances to banks and customers.
A/6-1- Loans and advances neither having past due nor subject to impairment The credit quality of the loans and advances portfolio that are neither having past dues nor subject to impairment are evaluated using the bank’s internal rating.
Collateralized loans are not considered subject to impairment for the non-performing category after taking into consideration the collectability of these collaterals.
69 2018 / 20192018 / 2019

30/6/2019 EGP mn 30/6/2019 EGP mn
Assessment
Individual Corporate Total Loans and
Advances toCustomers
Total Loans and Advancesto BanksOverdraft Credit Cards Personal Loans Mortgages Auto Loans Overdraft Direct Loans Syndicated Loans
1.Performing 4 811 2 182 28 324 - 970 130 514 190 277 48 067 405 145 2 459
2.Regular watching 377 1 926 24 631 7 660 130 30 483 32 898 12 091 110 196 -
3.Watch list - - - - - 1 486 5 948 911 8 345 -
Total 5 188 4 108 52 955 7 660 1 100 162 483 229 123 61 069 523 686 2 459
30/6/2018 EGP mn 30/6/2018 EGP mn
Assessment
Individual Corporate Total Loans and
Advances toCustomers
Total Loans and Advancesto Banks
Overdraft Credit Cards Personal Loans Mortgages Auto Loans Overdraft Direct Loans Syndicated Loans
1.Performing 6 722 3 140 28 089 4 319 1 711 118 386 133 957 53 025 349 349 1 865
2.Regular watching - - - - - 26 405 22 583 11 982 60 970 -
3.Watch list - - - - - 651 11 101 - 11 752 -
Total 6 722 3 140 28 089 4 319 1 711 145 442 167 641 65 007 422 071 1 865
70

30/6/2019 EGP mn 30/6/2019 EGP mn
Assessment
Individual Corporate Total Loans and
Advances toCustomers
Total Loans and Advancesto BanksOverdraft Credit Cards Personal Loans Mortgages Auto Loans Overdraft Direct Loans Syndicated Loans
1.Performing 4 811 2 182 28 324 - 970 130 514 190 277 48 067 405 145 2 459
2.Regular watching 377 1 926 24 631 7 660 130 30 483 32 898 12 091 110 196 -
3.Watch list - - - - - 1 486 5 948 911 8 345 -
Total 5 188 4 108 52 955 7 660 1 100 162 483 229 123 61 069 523 686 2 459
30/6/2018 EGP mn 30/6/2018 EGP mn
Assessment
Individual Corporate Total Loans and
Advances toCustomers
Total Loans and Advancesto Banks
Overdraft Credit Cards Personal Loans Mortgages Auto Loans Overdraft Direct Loans Syndicated Loans
1.Performing 6 722 3 140 28 089 4 319 1 711 118 386 133 957 53 025 349 349 1 865
2.Regular watching - - - - - 26 405 22 583 11 982 60 970 -
3.Watch list - - - - - 651 11 101 - 11 752 -
Total 6 722 3 140 28 089 4 319 1 711 145 442 167 641 65 007 422 071 1 865
71 2018 / 20192018 / 2019
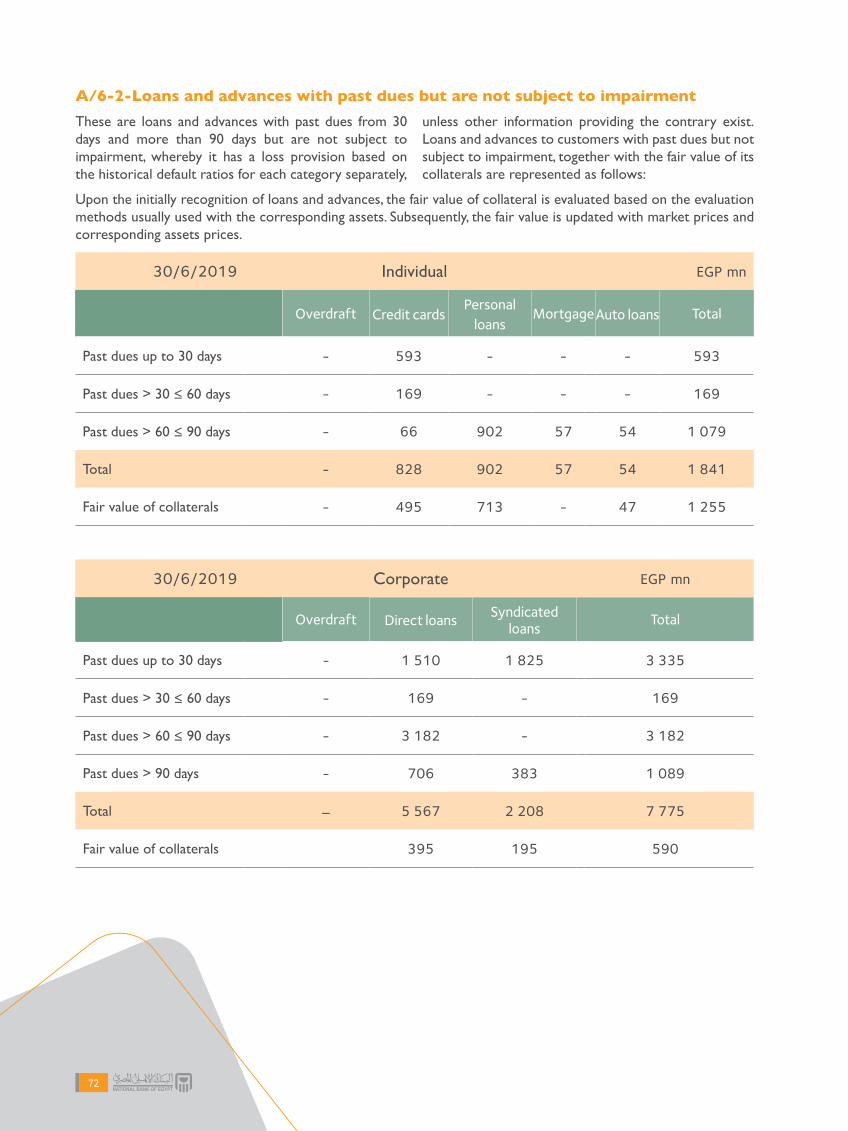
A/6-2-Loans and advances with past dues but are not subject to impairment These are loans and advances with past dues from 30 days and more than 90 days but are not subject to impairment, whereby it has a loss provision based on the historical default ratios for each category separately,
unless other information providing the contrary exist. Loans and advances to customers with past dues but not subject to impairment, together with the fair value of its collaterals are represented as follows:
Upon the initially recognition of loans and advances, the fair value of collateral is evaluated based on the evaluation methods usually used with the corresponding assets. Subsequently, the fair value is updated with market prices and corresponding assets prices.
30/6/2019 Individual EGP mn
Overdraft Credit cards Personal
loansMortgageAuto loans Total
Past dues up to 30 days - 593 - - - 593
Past dues > 30 ≤ 60 days - 169 - - - 169
Past dues > 60 ≤ 90 days - 66 902 57 54 1 079
Total - 828 902 57 54 1 841
Fair value of collaterals - 495 713 - 47 1 255
30/6/2019 Corporate EGP mn
Overdraft Direct loans Syndicatedloans
Total
Past dues up to 30 days - 1 510 1 825 3 335
Past dues > 30 ≤ 60 days - 169 - 169
Past dues > 60 ≤ 90 days - 3 182 - 3 182
Past dues > 90 days - 706 383 1 089
Total - 5 567 2 208 7 775
Fair value of collaterals 395 195 590
72
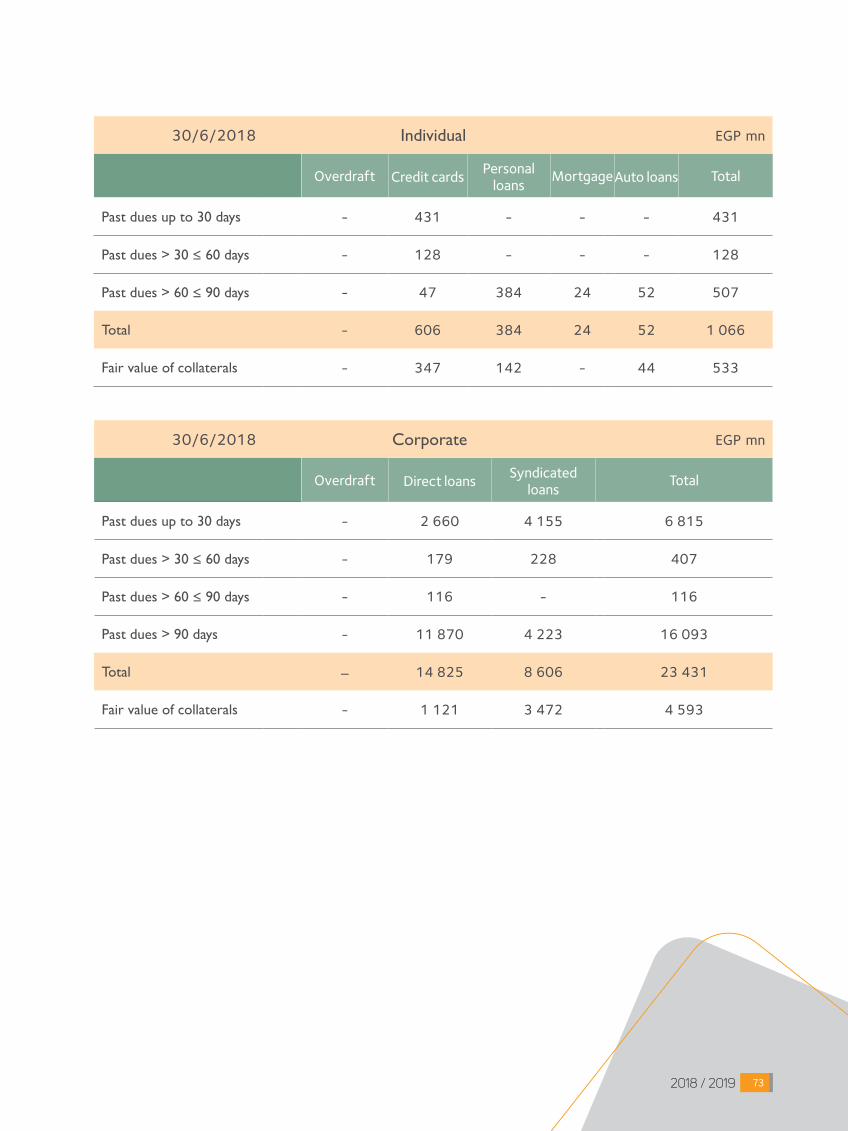
30/6/2018 Individual EGP mn
Overdraft Credit cards Personalloans
MortgageAuto loans Total
Past dues up to 30 days - 431 - - - 431
Past dues > 30 ≤ 60 days - 128 - - - 128
Past dues > 60 ≤ 90 days - 47 384 24 52 507
Total - 606 384 24 52 1 066
Fair value of collaterals - 347 142 - 44 533
30/6/2018 Corporate EGP mn
Overdraft Direct loans Syndicatedloans
Total
Past dues up to 30 days - 2 660 4 155 6 815
Past dues > 30 ≤ 60 days - 179 228 407
Past dues > 60 ≤ 90 days - 116 - 116
Past dues > 90 days - 11 870 4 223 16 093
Total - 14 825 8 606 23 431
Fair value of collaterals - 1 121 3 472 4 593
73 2018 / 20192018 / 2019

Loans and advances to customers subjected to impairment on an individual basisThe balance of loans and advances subject to impairment on an individual basis without taking into consideration the cash flow from collateral, reached an amount of EGP 8,892 mn (comparative year: EGP 8,555 mn).
The following is a breakdown of the gross amount of loans and advances subject to impairment on an individual basis.
30/6/2019 EGP mn
Individual Corporate
Item Overdraft Creditcard
Personalloans
Mortgage Autoloans
Overdraft Direct loans Syndicatedloans
Otherloans
Total
Loans and advances
subject to impairment
on an individual
basis
- 92 183 90 17 1 194 7 316 - - 8 892
Fair value of
collaterals- 66 82 - 14 114 3 627 - - 3 903
30/6/2018 EGP mn
Individual Corporate
Item Overdraft Creditcard
Personalloans
Mortgage Autoloans
Overdraft Direct loans Syndicatedloans
Otherloans
Total
Loans and advances
subject to impairment
on an individual
basis
- 99 272 73 18 685 7 408 - - 8 555
Fair value of
collaterals- 65 24 - 13 47 3 711 - - 3 860
74

Restructured loans and advances Restructuring activities include extension of payment arrangements, implementation of the obligatory management programs and adjustments and deferment of payment. The implementation of restructuring policies depends on an indicators or criteria of a highly probability of continuous payment based on the management personal judgment. Such policies are reviewed on a regular basis. Restructuring is commonly applied to long-term loans, especially the loans for customers financing. The renegotiated loans have reached an amount of EGP 1,355 mn.
Item 30/6/2019EGP mn
30/6/2018EGP mn
Loans and advances to customers Corporate:
Overdraft 1 355 62
A/7 Debt instruments, treasury bills, and other governmental notesThe following table represents the analysis of debt instruments, treasury bills, and other governmental notes at the end of the year, according to Moody `s rating with a stable future outlook.
Rating Treasury bills and othergovernmental notes Investments in securities EGP mn
B2 271 244 244 753 515 997
A/8 Acquisition of collaterals during the year
Type of asset Book valueEGP mn
Land and buildings 108
Property assets 3
Total 111
Acquired assets are classified in the balance sheet under “other assets” caption. The Bank, as practical, sells such assets.
75 2018 / 20192018 / 2019

A/9 Concentration of risks of financial assets with credit risk exposureGeographical segments
The following table represents an analysis of the Bank’s main credit risks limits at its book value distributed by geographical region at the end of the current year.
Description Greater CairoAlexandria, Delta,
Sinaiand Canal
Upper Egypt
Other Countries
Total EGP mn
Treasury bills & other governmental notes 270 828 - - 416 271 244
Loans and advances to banks 2,217 - - 242 2,459
Loans and advances to customers
Individual loans
Overdraft 3 778 1 117 293 - 5 188
Credit cards 3 649 1 202 177 - 5 028
Personal loans 26 533 19 150 8 357 - 54 040
Mortgages 5 889 744 1 174 - 7 807
Auto-loans 824 332 15 - 1 171
Loans to Corporate
Overdraft 141 148 20 302 2 227 - 163 677
Direct loans 214 795 16 300 10 911 - 242 006
Syndicated loans 61 222 2 055 - - 63 277
Financial derivatives - - - 292 292
Financial investments (debit instruments) 245 545 - - 50 245 595
Other assets* 20 710 - - 50 20 760
Total at the end of reporting year 997 138 61 202 23 154 1050 1 082 544
Total at the end of the comparative year 865 950 47 408 18 079 861 932 298
*Represented in current earned revenues.
76
B/Market risksThe Bank is exposed to market risks embodied in the fair value fluctuations or the future cash flows arising from the changes in market rates. Market risks are derived from the open positions of interest rate, currency rates and the equity products, as each of them is exposed to a general and special market movements as well as to changes in the sensitivity level of market rates or prices such as interest rates, exchange rates and equity instrument rates. The Bank separates its exposure to market risk, either for trading or non-trading portfolios.
The management of market risks arising from trading or non-trading activities is centralized in the Bank’s Market Risk management department which is monitored by two separate teams. periodical reports on market risks are submitted to the Board of Directors and the heads of business unit on a regular basis.
Trading portfolios include position derived from the Bank’s direct dealing with customers or market, while non-trading portfolios are primly derived from interest rate management of assets and liabilities related to retail transactions. These portfolios include foreign currency risks and equity instruments arising from held-to-maturity investments and available-for-sale investments.
B/1 Market risk measurement techniquesAs part of market risk management, the Bank perform several hedging strategies and enters into interest rate swaps in order to balance the inherent risks of debt instruments and fixed-rates long term loans, if the fair value option is applied.
The following are the most important measurement methodologies applied to control the market risks.
Value at riskThe Bank applies “Value at Risk” methodology for trading and non-trading portfolios in order to estimate the market risks of the current positions and the maximum limit of expected loss, based on a number of assumptions for various changes in market conditions. The Board of Directors sets a limits for the value at risk that the Bank can tolerate for trading and non-trading separately. Such limits are daily monitored by the Bank’s Market Risks Department.
Value at risk is a statistical prospect for the expected loss of the current portfolio arising from the market’s adverse circumstances. It states the maximum value the Bank may lose using a specific confidence coefficient
(99%). Consequently, the statistical probability of (1%) indicates that the actual loss may be greater than the expected value at risk. The value at risk model assumes a defined retention period (one day) before closing the open positions. The model also assumes that the market’s move will follow, during the retention period, the same pattern of movement that occurred during the previous day. The Bank estimates the previous movement on the basis of the information for the past five years. The Bank applies such historical changes in the rates, prices and indicators to the current positions directly – this method known as the historical simulation. Actual outputs should also be monitored on a regular basis to measure the correctness of assumptions and the factors used to calculate the value at risk. Usage of this method does not prevent the losses to exceed these limits in case of larger movement within the market.
Since value at risk is considered a basic component of the Bank’s monitoring system on market risk, the Board of Directors’ sets the limits of the value at risk for each of trading and non-trading transactions to be divided on the units of activity. The actual values at risk are compared with the limits set by the Bank and daily reviewed by the Bank’s Market Risk Department.
The quality of the value at risk model is persistently monitored through reinforcement testing for results of the value at risk of trading portfolio. Results of these tests are reported to senior management and Board of Directors.
Stress testingStress testing provide an indication of the potential size of losses that could arise under the severe adverse circumstances. Stress testing is designed to be appropriate to the business activities using standard analyses for specific scenarios.
Stress testing performed by the Bank’s Market Risk Department includes testing for the stress of risk factors whereby a groups of severe movements are applied to each risk type and the developing market’ stress is tested. Developing markets are subject to severe movements and special stress tests including potential events that affect specific positions or areas, such as the results from floating a currency in a specific region. The senior management and Board of Directors review stress testing outputs.
77 2018 / 20192018 / 2019

B/2 Summary of value at riskTotal value at risk according to the risk type
12 months till 30/6/2019 12 months till 30/6/2018
Average Higher Lower Average Higher Lower
Exchange rates risk 471 836 17 155 296 5
Interest rate risk 17 840 20 753 15 486 12 415 19 336 6 143
Interest rate risk for portfolio managed by others
- 0.6 - - 0.3 -
Equity risk (trading) 3 5 1 4 5 2
Equity risk (strategic) 51 69 38 46 74 6
Risk for portfolios managed by others
5 8 1 8 10 5
Value at risk of the trading portfolio according to the risk typeEGP mn
12 months till 30/6/2019 12 months till 30/6/2018
Average Higher Lower Average Higher Lower
Exchange rates risk 471 836 17 155 296 5
Interest rate risk for portfolios managed by others
- 0.6 - - 0.3 -
Equity risk 3 5 1 4 5 2
Risk for portfolios managed by others
5 8 1 8 10 5
Value at risk for non-trading (strategic) portfolio according to risk typeEGP mn
12 months till 30/6/2019 12 months till 30/6/2018
Average Higher Lower Average Higher Lower
Interest rate risk 17 840 20 753 15 486 12 415 19 336 6 143
Equity risk (strategic) 51 69 38 46 74 6
-The increase in value at risk, especially the interest rate risk, is related to the increase in the sensitivity of interest rates in the international financial markets. The three previous results of value at risk are calculated separately from the specific positions and the markets’ historical movements. Total values at risk for trading and non-trading do not form the Bank’s value at risk, due to the correlation between the types of risks and types of portfolios and its subsequent various impacts.
78

B/3 Foreign exchange rate volatility risk
The Bank is exposed to volatility in the foreign currency exchange rates in terms of the bank’s financial position and cash flows. The Board of Directors has set limits for foreign currencies based on the total value of each position at the end of the day and also during the day
for the monitored on spot positions. The following table summarizes the bank’s exposure to the risks of volatility in foreign exchange rates at the end of the year. This table includes the carrying value of the financial instruments categorized by its component currencies:
The concentration of currency risk of financial instruments
EGP mn
As at end of thecurrent year
EGP *USD EUR GBP SwissFranc
JPY SAR Othercurrencies
Total
Financial asset
Cash and balances with central banks
25 954 2 639 191 37 7 1 470 98 29 397
Due from Banks 365,435 121 774 1 952 591 8 33 414 300 490 507
Treasury bills and governmental notes
218 922 43 303 9 019 - - - - - 271 244
Trading financial assets
338 - - - - - - - 338
Loans and advances to banks
1 316 1 119 19 - - - - - 2 454
Loans and advances to customers
303 708 209 349 1 116 - - - - - 514 173
Financial derivatives 289 3 - - - - - - 292
Financial investments
Available for sale
116 152 35 389 58 - - - - - 151 599
Held to maturity
91 841 11 375 - - - - - - 103 216
Investments in associates
624 - - - - - - - 624
Other financial assets 46 886 1 381 - - - - - - 48 267
Total financial assets
1 171 465 426 332 12 355 628 15 34 884 398 1 612 111
* Overseas branches included in USD column.
**This item does not include other contingent liabilities, as well as it is distributed based on the balances only.
79 2018 / 20192018 / 2019

As at end of thecurrent year
EGP *USD EUR GBP SwissFranc
JPY SAR Othercurrencies
Total
Financial liabilities
Due to banks 1 483 136 702 482 869 1 - 1 248 204 140 989
Customers deposit
983 088 174 236 11 357 1 242 90 5 362 212 1 170 592
Financial derivatives
- 228 - - - - - - 228
Other loans 20 354 112 727 5 305 - - 647 - - 139 033
Other liabilities 11 637 2 792 - - - - - - 14 429
Total financial liabilities
1 016 562 426 685 17 144 2 111 91 652 1 610 416 1 465 271
Net of financial positions
154 903 (353) (4 789) (1 483) (76) (618) (726) (18) -
Credit related commitments **
35 150 109 495 36 058 172 461 1 871 952 2 217 -
As at end of the comparative year
Total financial assets
999 088 520 456 12 658 734 34 18 948 224 1 534 160
Total financial liabilities
870 634 530 412 19 739 2 672 109 760 1 686 333 1 426 345
Net of financial positions
128 454 (9 956) (7 081) (1 938) (75) (742) (738) (109) -
Credit related commitments **
28 507 111 756 39 617 320 468 2 095 504 1 572 -
* Overseas branches included in USD column.
**This item does not include other contingent liabilities, as well as it is distributed based on the balances only.
80

B/4 Interest rate riskThe Bank is exposed to the effects of fluctuations in the levels of the prevailing market’s interest rates which is the interest rate risk for cash flows represented in the volatility of future cash flows of a financial instrument due to changes in the instrument’s interest rate. The interest rate risk for fair value is the risk of fluctuations in the instrument’s value due to the changes in market’s interest rates. The interest margin may increase due to these changes, while the profits may decrease, in case of unexpected movements occur.
The Board of Directors sets limits for the level of difference when re-pricing the interest rate held by the bank; whereby monitored by Assets & Liabilities Department collaborated with Treasury Department on a daily basis.
The following table summarizes the Bank’s exposure to the risk of fluctuations in interest rates including the carrying value of financial instruments distributed based on the price of re-pricing dates or maturity dates whichever is earlier.
EGP mn
30/6/2019Up to 1 month
More than 1 - 3 months
More than 3
months – 1 year
More than 1 - 5
years
More than 5 years
Total
Sensitive assets to interest rate for non-trading portfolio
Cash and balances with Central banks with interest 385 848 18 776 5 160 - - 409 784
Due from Banks 107 842 3 774 37 317 - - 148 933
Treasury bills and other governmental notes
37 185 51 762 180 001 - - 268 948
Bonds and other financial instruments 1 535 19 218 58 034 216 567 25 336 320 690
Performing loans and advances 242 699 99 266 51 316 122 188 47 551 563 020
Performing loans with a floating interest rate guaranteed by a residential property.
- 575 - - - 575
Performing loans with a fixed interest rate guaranteed by a residential property
50 91 422 2 393 10990 13 946
Non-performing loans - - - - 846 846
Other assets (sensitive to interest rate) 13 411 10 903 18 846 5 383 10 48 553
Total 788 570 204 365 351 096 346 531 84 733 1 775 295
Interest-rate swap 18 885 12 684 14 560 4 218 - 50 347
Interest (1) 807 455 217 049 365 656 350 749 84 733 1 825 642
Total non-sensitive assets to interest rate and held for trading purpose 87 219
Total assets 1 912 861
81 2018 / 20192018 / 2019

EGP mn
30/6/2019 Up to 1month
More than 1 - 3
months
More than 3
months –1 year
More than 1 - 5
years
More than 5years
Total
Sensitive liabilities to interest rate
Demand deposits and current accounts
87 762 10 648 31 946 44 972 - 175 328
Saving Deposits 86 462 16 358 49 073 81 789 - 233 682
Time and notice deposits 79 084 23 080 16 185 9 135 128 127 612
Saving certificates 63 925 39 979 111 238 600 509 4 678 820 329
Due to banks 209 185 1 163 12 306 26 - 222 680
Issued debt securities - - - 4 - 4
Long-term loans 23 489 46 608 52 030 7 062 1 985 131 174
Other liabilities (sensitive to inters rate) 20 426 3 450 19 297 5 328 - 48 501
Total 570 333 141 286 292 075 748 825 6 791 1 759 310
Interest-rate swap 24 154 24 833 1 951 - - 50 938
Total sensitive liabilities to interest rate and Interest-rate swap (2)
594 487 166 119 294 026 748 825 6 791 1 810 248
Total non-sensitive liabilities to interest rate 81 140
Total liabilities 1 891 388
Net current gap (1)-(2) 212,968 50 930 71 630 (398 076) 77 942 15 394
82

30/6/2018 Up to 1month
More than 1 - 3
months
More than 3
months –1 year
More than 1 - 5
years
More than 5years
Total
Sensitive assets to interest rate for non-trading portfolio
Cash and balances with Central banks with interest 131 885 224 823 5 464 - - 362 172
Due from Banks 173 200 7 747 6 110 - - 187 057
Treasury bills and other governmental notes
36 638 83 490 209 173 - - 329 301
Bonds and other financial instruments 2 359 10 426 41 179 142 944 27 864 224 772
Performing loans and advances 172 742 97 620 51 084 85 344 71 035 477 825
Performing loans with a variable interest rate guaranteed by a residential property.
- 543 - - - 543
Performing loans with a fixed interest rate guaranteed by a residential property
29 50 235 1 319 6 156 7 789
Non-performing loans - - - - 3 063 3 063
Other assets (sensitive to interest rate) 17 767 14 440 3 475 6 502 952 43 136
Total 534 620 439 139 316 720 236 109 109 070 1 635 658
Interest-rate swap 5 244 8 756 14 113 38 204 - 66 317
Interest (1) 539 864 447 895 330 833 274 313 109 070 1 701 975
Total non-sensitive assets to interest rate and held for trading purpose 115 802
Total assets 1 817 777
83 2018 / 20192018 / 2019

30/6/2018 Up to 1month
More than 1 - 3
months
More than 3
months –1 year
More than 1 - 5
years
More than 5years
Total
Sensitive liabilities to interest rate
Demand deposits and current accounts 40 910 5 857 17 571 25 675 - 90 013
Saving Deposits 73 515 13 901 41 702 69 494 - 198 612
Time and notice deposits 92 688 28 482 24 356 8 944 621 155 091
Saving certificates 28 006 59 018 301 109 305 467 5 596 699 196
Due to banks 370 774 21 615 6 927 - - 399 316
Issued debt securities - - - 5 - 5
Long-term loans 16 102 33 280 48 021 8 053 2 411 107 867
Other liabilities (sensitive to inters rate) 18 679 1 655 12 262 6 606 3 845 43 047
Total 640 674 163 808 451 948 424 244 12 473 1 693 147
Interest-rate derivatives contracts 22 047 41 063 3 443 - - 66 553
Total sensitive liabilities to interest rate and Interest-rate derivatives contracts (2)
662 721 204 871 455 391 424 244 12 473 1 759 700
Total non-sensitive liabilities to interest rate 61 633
Total liabilities 1 821 333
Net current gap (1)-(2) (122 857) 243 024 (124 558) (149 931) 96 597 (57 725)
84

C - Liquidity riskThe liquidity risk is the risk for which the bank is exposed to encounter difficulties in meeting its obligations associated with its financial liabilities at maturity date. and replacing the funds when withdrawn ; Consequently it may fail to meet obligation related to repay depositors and meet lending commitments.
Liquidity risk managementThe Bank’s liquidity risk control is carried out by the Bank’s Assets and Liabilities Management Department collaborated with the Treasury Department and iclude the following:• The daily funding is managed by monitoring the future
expected cash flows in order ensure the ability of fulfilling all requirements. This inculdes replenishment of funds as they mature or as borrowed by customers. The Bank maintains access to the global capital markets to ensure that his objective is achieved.
• Maintaining a portfolio of highly marketable assets, which can easily be liquidated to meet any unexpected interruption in cash flows.
• Monitoring liquidity ratios compared to the internal requirements of the Bank and the Central Bank of Egypt’s requirements.
• Managing of concentration and profile of loans maturities.
For monitoring and reporting purposes, the cash flows for the next day, week and month is measured and projected. These periods are the key periods for liquidity Department. The starting point for these projections is represented in the analysis of the contractual maturities of financail liabilities and expected collection dates of financial assets.Assets and Laibilities Management Department collaborated with the Treasury Department monitor the inconsistenccy of medium-term assets with the level and type of the unutilized portion of loan commitments, and also the extent of use of overdraft facilities with the effect of contingent liabilities such as letters of guarantees and documentary credits.
Financing approach
Sources of liquidity are reviewd by a separate team in the Assets and Liabilities Management Department collaborated with the Treasury Department in order to provide a wide diversification within currenceis, geographical regions, resources, products, and maturites.
Cash flows derivatives
Derivatives settled on a net basis
The Bank’s derivatives settled on net basis include:
• Foreign exchange derivatives: currency option in/over the counter, and forward currency contracts.
• Interest rate derivatives: foreign currency swaps, cross currency contracts, Interest-rate swap, in/over the
counter, forward contracts and other contracts.
Derivatives settled with grossDerivatives settled with total include:
• Foreign exchange derivatives: Cross currency contracts, foreign currency swap.
• Interest rate swap, interest rate and foreign currency swap contracts together.
D - Fair value of assets and financial liabilitiesD/1 Financial instruments measured at fair value
Due from banks
The fair value of overnight deposits designated at floating interest rate is represented in its nominal value. The expected fair value of the deposits designated a floating interest rate is measured based on the discounted cash flows by using the prevailing capital market’s nominal value of debts with similar credit risk and similar maturity date.
Loans & advances to banks
Loans & advances to banks are represented in loans other than deposits with banks. The expected fair value of Loans & advances is measured at the discounted value of future cash flows expected to be collected. Cash flows are discounted using the current market rate in order to determine the fair value.
Loans & advances to customers
Loans & advances are stated in net terms after deducting the impairment loss provision. The expected fair value of Loans & advances is represented in the discounted value of future cash flows expected to be collected. Cash flows are discounted using the current market rate in order to determine the fair value
Investment in securities
Investment in securities include only held to maturity interest-bearing assets. Available for sale assets are evaluated at fair value except for the equity instruments that the bank hasn’t been able to evaluate its fair value to a reliable extent. The fair value of financial assets held to maturity is determined based on the market prices or broker rates. If such data were not available then the fair value is measured using the prevailing capital market’s prices for marketable securities with similar credit features, maturity dates as well as similar rates.
Due to other banks and customers
The estimated fair value of deposits with unspecified maturity date, which includes non- interest bearing deposits, is represented in the amount to be paid on demand.
85 2018 / 20192018 / 2019

The fair value of fixed interest-bearing deposits and the other loans that are not quoted in an active market are determined based on the discounted cash flows by applying interest rates for new debts with a similar maturity dates.
Issued debt instruments
Total fair value is calculated based on current capital markets’ rates. As for securities that have no active market, at first, it is calculated based on the discounted cash flows model using the current interest rate according to the remaining maturity.
D/2 Financial instruments not measured at fair value
Financial investment held to maturity
For bonds, it includes the financial investments held to maturity that are enlisted in the market and measured with amortized cost, as for investment funds, it is assessed using realizable value (fair value) and compared to its cost in order to record whichever is less. In case of a subsequent increase in cost, the previously realized decrease in value will be reversed in the income statement to the extent of the previous decrees.
E - Capital managementThe bank’s objectives for capital management, which include other elements along with the reported equity in the balance sheet, are represented in the following:• Complying with the capital’s legal requirements in
Arab Republic of Egypt and in other countries where the bank’s branches operate.
• Protecting the bank’s ability to continue as going concern and its ability to continue generating revenues for shareholders and other parties dealing with the bank.
• Maintaining a strong capital base to enhance growth of the bank’s operations.
Capital adequacy and capital uses are reviewed according to the requirements of regulatory authorities (Central Bank of Egypt in the Arab Republic of Egypt) on a daily basis by the bank’s management using models based on the guidelines of Basel Committee for Banking Supervision. The required information is submitted to the Central Bank of Egypt on a quarterly basis.
The Central Bank of Egypt requires the following • Maintain the sum of EGP 500 mn as a minimum limit
for issued and paid-up capital.• Maintain a percentage equal to 10% or more as a ratio
between capital elements and the risk-weighted assets and liabilities.
Overseas branches are subject to the banking supervision rules of the countries in which they operate.
The numerator of the capital adequacy ratio consists ofIt includes some deductible / negligible items which are stated in “the supervision instructions regarding the minimum capital adequacy ratio”, Chapter 2, regarding the capital base will be processed later as per the instructions.
These items are deducted from the share capital if its value is negative, otherwise (positive value) are neglected.1. Reserves: which include legal, general, statutory,
supportive, and capital reserves only.2. Noncumulative permanent preferred stocks: the
approval of the CBE is required in order to be enlisted within tier one which meet the listing standards to the additional share capital.
3. Quarterly profit (losses): which are included in the capital base only after the auditor certify this profits, and the General Assembly approves on the dividends in addition to the CBE approval. However, the losses are unconditionally included.
4. The constant share capital after regulatory amendments: it is enlisted in item 1.1 before deducting financial companies’ investments in item (1.3.1.1) taking into consideration the stated regulatory instructions in item 3/8/1/2.
5. Investments must be evaluated periodically, if not, any increase in fair value will be negligible when preparing this statement.
6. Hybrid capital instrument: this item is included after the CBE approval on the characteristic of these instruments and their compliance with the mentioned standards in tier 2. The Central bank of Egypt has the right to enlist only percentage of such instrument.
7. Subordinate loans (deposits): only if not exceed 50% of Tier one after exclusions, on condition of amortizing annually 20% of its value for the last 5 years of its maturity.
8. Must not exceed 1.25% of total credit risk for risk-weighted assets and regular contingent liabilities, as also impairment loss provisions for loans, credit facilities and irregular contingent liabilities must be sufficient to meet obligations for which this provision was formed.
9. Share capital before regulatory amendments: it includes paid up capital, reserves, retained earnings after goodwill deduction and treasury shares.
10. In case of, the bank has not achieved net profit and there are no retained earnings, then it is obligatory to deduct the reserve by 50% from Tier one, and 50% from Tier two.
11. The extension limit of the predetermined placement in risk-weighted countries: this amount must be included based on the model number 720 considering
86

the placement in overseas, taking into account adjusting the capital base which is determined in the previously mentioned statement as per the calculated value mentioned above.
The following table summarize components of share and subordinate capital and capital adequacy ratios:
Capital adequacy ratio is prepared based on the consolidated financial statement (as a group of finance companies)
Items* 30/6/2019 30/6/2018
Total capital base after exclusions 122 334 108 930
1 Tier one after exclusions 94 456 82 231
1.1 Share capital after exclusions (Common Equity-CETI) 50 443 47 939
1.1.1 Issued and paid capital 35 000 35 000
1.1.3 Goodwill - -
1.1.4 Reserves 10 065 7 310
1.1.5 IFRS (9) standard risk reserve 6 926 6 926
1.1.6 Retained Earnings (Loss) 284 111
1.2 Additional share capital 44 013 34 292
1.2.2 Quarterly retained earnings 14 144 2 492
1.2.3 Non-controlling interest 70 68
1.2.4Differences between nominal value and present value (subordinate loan)
29 800 31 732
1.3 Total exclusions of the share capital (1 833) (1 409)
1.3.1 Items to be deducted: (1 173) (1 409)
1.3.1.1Bank investments in finance companies (banks or companies) and insurance companies. (shares - investment fund)
(1 147) (1 404)
1.3.1.1.1The excess over 10% of the company's issued capital for each separate investment.(shares) (-)
(116) (481)
1.3.1.1.2The excess over 10% of the funds- net assets for each separate investment (investment funds).
(279) (280)
1.3.1.1.4 Subordinate loans granted by the bank to other institutions (752) (644)
1.3.1.2 Intangible assets (other than goodwill) (6) (4)
1.3.1.3 Cash flow hedge reserve (20)
87 2018 / 20192018 / 2019
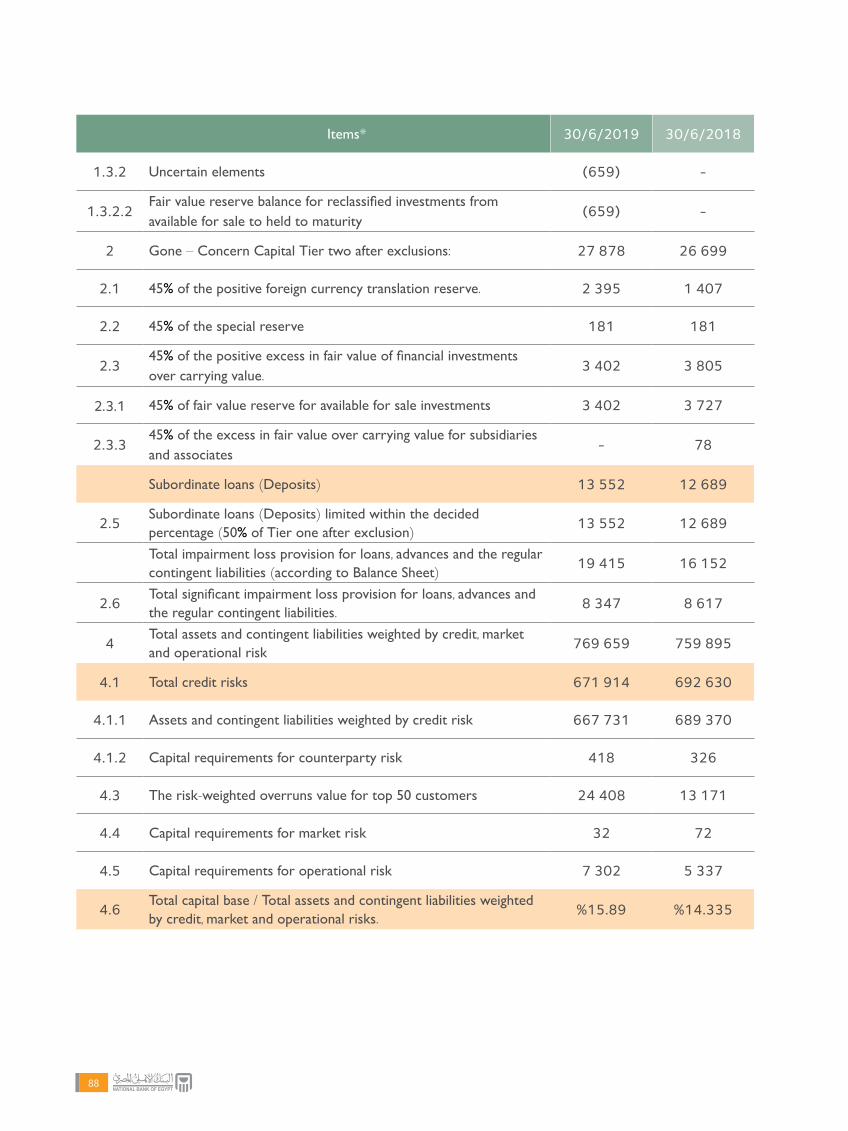
Items* 30/6/2019 30/6/2018
1.3.2 Uncertain elements (659) -
1.3.2.2Fair value reserve balance for reclassified investments from available for sale to held to maturity (659) -
2 Gone – Concern Capital Tier two after exclusions: 27 878 26 699
2.1 45% of the positive foreign currency translation reserve. 2 395 1 407
2.2 45% of the special reserve 181 181
2.345% of the positive excess in fair value of financial investments over carrying value. 3 402 3 805
2.3.1 45% of fair value reserve for available for sale investments 3 402 3 727
2.3.345% of the excess in fair value over carrying value for subsidiaries and associates - 78
Subordinate loans (Deposits) 13 552 12 689
2.5Subordinate loans (Deposits) limited within the decided percentage (50% of Tier one after exclusion) 13 552 12 689
Total impairment loss provision for loans, advances and the regular contingent liabilities (according to Balance Sheet) 19 415 16 152
2.6Total significant impairment loss provision for loans, advances and the regular contingent liabilities. 8 347 8 617
4Total assets and contingent liabilities weighted by credit, market and operational risk 769 659 759 895
4.1 Total credit risks 671 914 692 630
4.1.1 Assets and contingent liabilities weighted by credit risk 667 731 689 370
4.1.2 Capital requirements for counterparty risk 418 326
4.3 The risk-weighted overruns value for top 50 customers 24 408 13 171
4.4 Capital requirements for market risk 32 72
4.5 Capital requirements for operational risk 7 302 5 337
4.6Total capital base / Total assets and contingent liabilities weighted by credit, market and operational risks. %15.89 %14.335
88

Items* 30/6/2019 30/6/2018
1 Tier one of capital after exclusion 94 456 82 231
2 Total exposure in and off balance sheet 1 811 241 1 739 001
Leverage ratio (1/2) 5.21% 4.73%
4. The significant accounting estimates and assumptionsThe Bank uses an estimates and assumptions that affect the disclosed amounts of assets and liabilities in the following year. These estimates and assumptions are evaluated based on the historical experience and other factors including the expectations of future events that are considered reasonable under the circumstances and available information.
A - Impairment losses on Loans & advances
The bank reviews loans & advances portfolio to assess impairment, at least a quarterly basis. The bank applies personal judgment in determining whether the impairment is charged to the income statement, in order to know if there is any reliable data indicating the existence of a measurable decline in the expected future cash flows of the loans’ portfolio even before identifying the decline level in each individual loan of the portfolio. Such evidences may include data indicating the occurrence of a negative change in the ability of a portfolio of borrowers to repay the bank or local or economic circumstances related to default of the bank’s assets.
On scheduling future cash flows, the management uses estimates based on the historical experience of losses with credit-risk characteristics including the existence of similar objective evidence of impairment to those contained in the portfolio. The methodology and assumptions used in estimating the amount and timing of future cash flows are reviewed on a regular basis to minimize any differences between estimated and actual losses based on experience.
B - Impairment of available for sale equity instruments
The Bank determines the impairment of the available for sale equity instruments, when the instrument’s fair value decline below its acquisition cost and this decline considered as a significant and a prolonged based on personal judgment, through assessing – among other factors – the usual share price volatility. In addition, impairment is charged when there is an objective evidence on a financial deterioration in the investee company or in its operational and financing activities cash flows, the industrial or sector performance, or in changes in technologies.
If such decline is considered as significant and prolonged and the instrument’s fair value decline below its acquisition cost, then an additional loss is charged by carrying forward the fair value reserve to the income statement.
C - Fair value of derivatives
The fair values of derivative financial instruments not quoted in active markets, are determined using valuation methods. When these methods (such as models) are used to measure the fair values, they are tested and reviewed periodically by qualified personnel who are independent of the method’s drafters. All models are verified before being used and after being tested to ensure that their results reflect actual data and prices that can be compared to the market to the extent that is considered practical. Only reliable data are used in these models; however, areas such as credit risks corresponding to the bank, counterparties, volatility or correlations require management to use estimates. Changes in estimates of these factors may affect the fair value of the financial instrument reported at the date of the balance sheet.
89 2018 / 20192018 / 2019

D - Held to maturity financial investments
The Non-derivative financial assets with fixed or determinable payments and maturity dates are classified as financial investments held to maturity. This classification requires high degree of personal judgment; therefore, the Bank evaluates the intention and ability to hold such investments till maturity. If the Bank fails to hold such investments till maturity, except in certain circumstances such as selling an insignificant amount close to maturity date, then all held to maturity investments will be reclassified to available for sale investment. Accordingly, those investments will be measured at fair value rather than amortized cost; in addition, the classification of any investments under this item will be suspended for two years.
E - Income tax
The Bank is subject to income taxes in several tax districts regarding overseas branches that require using a significant estimate to determine the total provision of the income taxes. There are some accounts and operations that are hard to comprehensively determine the final tax on them.
The Bank records obligations derived from the expected results of tax inspection based on estimates of the emergence probability of additional taxes. When there is a variance between the final taxes’ result and the amounts previously recorded, these variances will affect the income tax and the deferred tax provision for the year in which the variance is identified.
5. Segmental analysisBusiness segmental analysis
It includes operational processes, assets used in providing banking services, management of surrounding risks associated with this business activity which vary from the other business activities and the segmental analysis of operations based on the following banking activities:
Large Corporate and SMEs
It includes the current accounts, deposits, overdrafts, loans, and credit facilities.
Investment
It includes activities such as merging of companies, investments acquisition, financing and restructuring of companies and financial instruments.
Banks
It includes central, local and foreign banks.
Individual
It includes the current accounts, savings, deposits, credit cards, personal loans, mortgages, etc.
Governmental
For assets, it includes treasury bills and governmental bonds, while liabilities include deposits and other governmental loans.
90

91 2018 / 20192018 / 2019

Asset and liability managementIt includes other banking business such as asset and liability management and to treasury management.
Transactions between the business segments are based on the bank’s normal course of business. Assets, liabilities and operational assets and liabilities are included as presented in the Bank’s balance sheet.
EGP mn
30/6/2019 Corporate SME Investment Banks Individual Governmental Other activities Total
Business activity assets 385 896 57 913 17 415 490 507 73 234 515 997 - 1 540 962
Non-classified assets - - - - - - 73 047 73 047
Total Assets 385 896 57 913 17 415 490 507 73 234 515 997 73 047 1 614 009
Business activity liabilities 298 426 - - 140 989 908 054 106 561 - 1 454 030
Non-classified liabilities - - - - - - 50 110 50 110
Total liabilities 298 426 - - 140 989 908 054 106 561 50 110 1 504 140
30/6/2018 Corporate SME Investment Banks Individual Governmental Other activities Total
Business activity assets 343 125 44 011 16 990 524 255 45 509 459 577 - 1 433 467
Non-classified assets - - - - - - 110 129 110 129
Total Assets 343 125 44 011 16 990 524 255 45 509 459 577 110 129 1 543 596
Business activity liabilities 220 230 - - 282 586 808 335 103 773 - 1 414 924
Non-classified liabilities - - - - - - 36 424 36 424
Total liabilities 220 230 - - 282 586 808 335 103 773 36 424 1 451 348
92

EGP mn
30/6/2019 Corporate SME Investment Banks Individual Governmental Other activities Total
Business activity assets 385 896 57 913 17 415 490 507 73 234 515 997 - 1 540 962
Non-classified assets - - - - - - 73 047 73 047
Total Assets 385 896 57 913 17 415 490 507 73 234 515 997 73 047 1 614 009
Business activity liabilities 298 426 - - 140 989 908 054 106 561 - 1 454 030
Non-classified liabilities - - - - - - 50 110 50 110
Total liabilities 298 426 - - 140 989 908 054 106 561 50 110 1 504 140
30/6/2018 Corporate SME Investment Banks Individual Governmental Other activities Total
Business activity assets 343 125 44 011 16 990 524 255 45 509 459 577 - 1 433 467
Non-classified assets - - - - - - 110 129 110 129
Total Assets 343 125 44 011 16 990 524 255 45 509 459 577 110 129 1 543 596
Business activity liabilities 220 230 - - 282 586 808 335 103 773 - 1 414 924
Non-classified liabilities - - - - - - 36 424 36 424
Total liabilities 220 230 - - 282 586 808 335 103 773 36 424 1 451 348
93 2018 / 20192018 / 2019

6. Net interest income
30/6/2018EGP mn
30/6/2019EGP mn
Interest income on loans and similar income:
Loans and advances to:
264 166Banks
38 218 44 290Customers
38 482 44 456
37 773 38 998Treasury bills and governmental notes
19 996 30 353Investment in debt instrument held to maturity and available for sale
55 049 66 667Deposits and current accounts
90 3 504Reverse repo agreements
151 390 183 978
Interest expense on deposits and similar expense:
Deposits and current accounts:
5 091 4 855Banks
119 055 117 485Customers
124 146 122 340
430 527Repo agreements
3 493 5 779Other loans
128 069 128 646
23 321 55 332Net interest income
94

7. Net fees and commissions Income
30/6/2018EGP mn
30/6/2019EGP mn
Fees and commissions income:
4 862 4 265Credit-related fees and commissions
3 305 3 339Other fees
8 167 7 604
Fee and commission expenses:
(771)(804)Fees paid
7 396 6 800Net income from fee and commissions
8. Dividend income
30/6/2018EGP mn
30/6/2019EGP mn
23Trading securities
366366Available for sale securities
599283Subsidiaries and associates.
1329Held to maturity investment fund certificates
980681Total
9. Net trading income
30/6/2018EGP mn
30/6/2019EGP mn
Foreign currency transactions:
1 208 1 735Profit from foreign currency transactions
34 (44)Trading financial investments
(215)(628)(Loss) profit from the valuation of currencies and interest rate contracts
(287)(306)stcartnoc paws ycnerruc ngieroF morf (tfiorp (ssoL)
83 654Profit from derivatives contracts CIRS
823 1 411Net trading income
95 2018 / 20192018 / 2019

10. Administrative expenses
30/6/2018EGP mn
30/6/2019EGP mnStaff costs:
(5 004)(7 350)Salaries and wages
(164)(242)Social insurances
(581)(565)Pension Cost
(7 269)(12 041)Other administrative expenses*
(13 018)(20 198)Total
*Other administrative expenses include the following:
- Improvements on leased assets amounted to EGP 403 mn (30/6/2018: EGP 398 mn).
- Depreciation amounted to EGP 1,239 mn (30/6/2018: EGP 1,059 mn).
- Donations amounted to EGP 1,526 mn (30/6/2018: EGP 881 mn).
- Supplies and services amounted to EGP 6,728 mn (30/6/2018: EGP 3,572 mn).
- Taxes and fees amounted to EGP 1,246 mn EGP (30/6/2018: EGP 1,064 mn)
11. Other operating (expenses) incomes
30/6/2018EGP mn
30/6/2019EGP mn
(55)2 539Profit (losses) from the valuation of monetary assets and liabilities in foreign currencies
(297)(6 727)Other provisions charge
1 549 710Other revenue *
1 197 (3 478)Net of other operating income
*It includes profits from selling fixed assets with an amount EGP 6 mn (30/6/2018: EGP 22 mn)
12. (Charge) impairment on credit losses
30/6/2018EGP mn
30/6/2019EGP mn
(40) (4 227) Loan and advances to customers (Notes 19,20,29)
-(1)Held to maturity financial investments
(40) (4 228) Net of charge impairment on credit losses
96

13. Income tax expenses
30/6/2018EGP mn
30/6/2019EGP mn
(697)(374)Income tax (overseas branches)
(10 734)(13 105)Taxes on treasury bills , bonds and companies’ dividends *
(11 431)(13 479)Total income tax expenses
*The paid amount is EGP 11,036 mn (30/6/2018: EGP 10,155 mn).
Further information regarding deferred tax is presented in note no (31), taxes on the bank’s profits vary from the amount derived from applying the current tax rates as follows:
30/6/2018EGP mn
30/6/2019EGP mn
21 542 33 684Profit before tax
4 847 7 579Applicable tax rate (22.5%)
(952)(3 229)Non- taxable income
1 337 5 166Non- deductible expenses
5 232 9 516Income tax expenses
24.29%28.25%Actual tax rate (excluding taxes on treasury bills' and bonds' yield ,and companies’ dividends)
53.06%40.02%Actual tax rate (including taxes on treasury bills' and bonds' yield ,and companies’ dividends)*
*Actual tax rate includes calculated taxes on treasury bills’ and bonds’ yield, and companies’ dividends divided by the profit before tax.
- Difference between the calculated tax on income statement and the paid tax disclosed in cash flow statement is represented in the calculated tax for the revenues which are unrealized yet, on financial statements date.
14. Basic Earnings per share (EPS)Earnings per share is calculated by dividing the bank’s shareholders net profit on the weighted average of common shares issued during the year, after excluding the weighted shares repurchased by the bank, which held within the treasury shares.
30/6/2018EGP mn
30/6/2019EGP mn
10 111 20 205Net profit for the year
(194)(3 027)Employees` profit share for the year*
9 917 17 178Net profit available for distribution on shareholders (1)
30 181 35 000The weighted average of the issued common shares (2)
0.330.49Basic earnings per share (EGP) (1:2)
*according to the amendment in subject (27) of the bank’s articles of association as detailed in note no. (34)
97 2018 / 20192018 / 2019
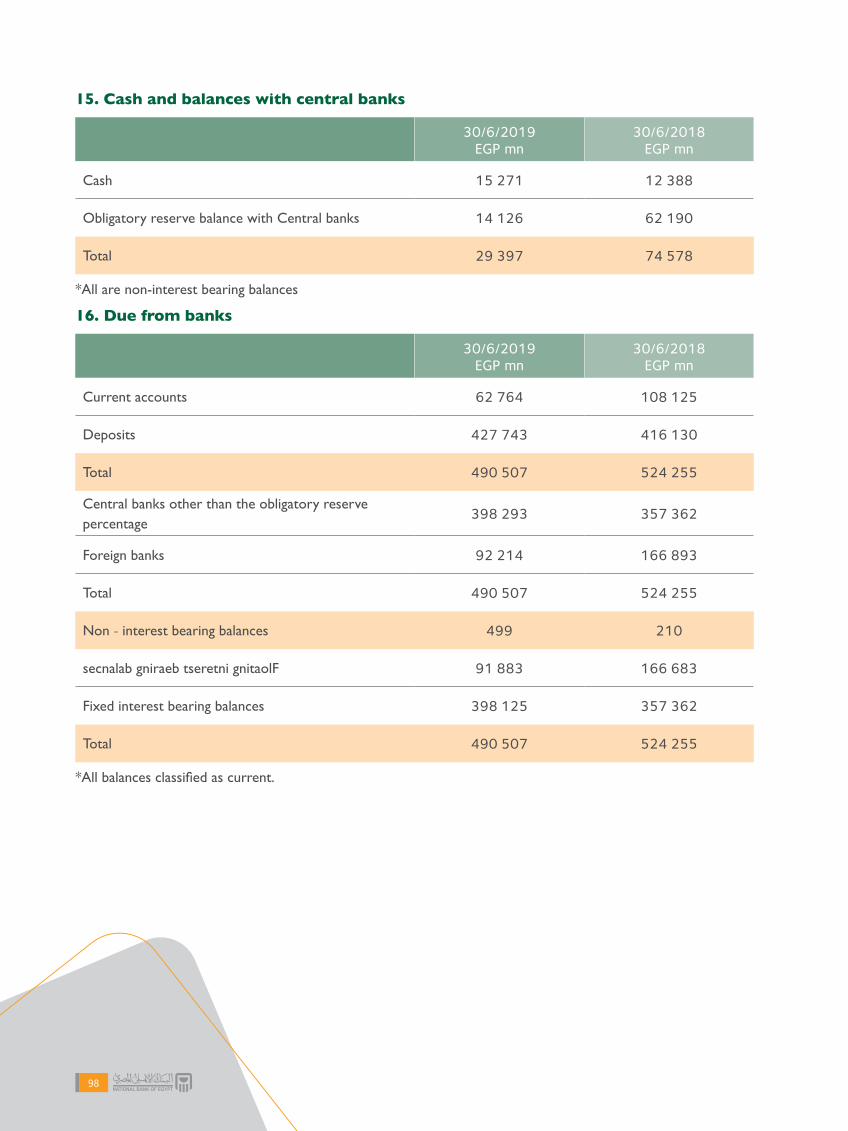
15. Cash and balances with central banks
30/6/2019EGP mn
30/6/2018EGP mn
Cash 15 271 12 388
Obligatory reserve balance with Central banks 14 126 62 190
Total 29 397 74 578
*All are non-interest bearing balances
16. Due from banks
30/6/2019EGP mn
30/6/2018EGP mn
Current accounts 62 764 108 125
Deposits 427 743 416 130
Total 490 507 524 255
Central banks other than the obligatory reserve percentage 398 293 357 362
Foreign banks 92 214 166 893
Total 490 507 524 255
Non - interest bearing balances 499 210
secnalab gniraeb tseretni gnitaolF 91 883 166 683
Fixed interest bearing balances 398 125 357 362
Total 490 507 524 255
*All balances classified as current.
98

17. Treasury bills and other governmental notes
30/6/2019EGP mn
30/6/2018EGP mn
Treasury bills and other governmental notes 254 318 313 843
Reverse repos 39 117 2 471
Repos (22 191) (19 052)
271 244 297 262
Treasury bills is represented in:
91days maturity 24 786 54 270
182 days maturity 37 275 35 020
273 days maturity 61 517 83 496
364 days maturity 145 225 156 353
Unearned interests for more than 3months (13 953) (14 895)
Unearned interests for less than 3months (532) (401)
254 318 313 843
Repos more than 3 months 39 117 2 471
Reverse repos less than 3 months (22 191) (19 052)
Net Treasury bills 271 244 297 262
99 2018 / 20192018 / 2019

18. Trading financial assets
30/6/2019EGP mn
30/6/2018EGP mn
Equity instruments in local banks and companies 102 154
Portfolios managed by others 236 253
338 407
19. Loans and advances to banks
30/6/2019EGP mn
30/6/2018EGP mn
Term loans 2 459 1 865
Deduct:
provision* (5) -
Net 2 454 1 865
Current balances 242 251
Non-current balances 2 217 1 614
Total 2 459 1 865
*Loans provision related to overseas branches.
20. Loans and advances to customers
30/6/2019EGP mn
30/6/2018EGP mn
Individual
Overdraft 5 188 6 722
Credit cards 5 028 3 845
Personal loans 54 040 28 745
Auto loans 1 171 1 780
Mortgage 7 807 4 417
Total (1) 73 234 45 509
100

Corporate, including loans to SMEs 30/6/2019EGP mn
30/6/2018EGP mn
Overdraft 163 677 146 127
Direct loans 242 006 189 874
Syndicated loans 63 277 73 613
Total (2) 468 960 409 614
Total loans and advances to customers (12+) 542 194 455 123
Less:
Impairment loss provision (24 957) (21 445)
Interest in suspense* (3 064) (2 898)
Unearned discount - -
Net 514 173 430 780
Distributed to:
Current balances 189 134 184 822
Non-current balances 353 060 270 301
Total 542 194 455 123
*An amount of EGP 507 mn has been excluded representing the interest in suspense amount of tourism sector customers’ based on the Central Bank of Egypt initiative (June 30,2018: An amount of EGP 232 mn)
101 2018 / 20192018 / 2019

Impairment loss provision of loans and advances to customers June 30, 2019
Current year Corporate Individual Total
Beginning balance 20 474 971 21 445
Impairment charge 4 067 142 4 209
Amounts written-off during the year (827) (195) (1 022)
Transfers 34 185 219
Amounts recovered during the year 546 71 617
Foreign currencies valuation differences (+/-) (511) - (511)
Ending balance 23 783 1 174 24 957
Corporate
Overdraft Direct loans Syndicated loans Other Loans Total
1 410 22 338 35 - 23 783
Individual
Overdraft Credit cards Personal loans Mortgages Total
3 41 268 862 1 174
EGP mn
102

Impairment loss provision of loans and advances to customers June 30, 2018
Current year Corporate Individual Total
Beginning balance 20 321 689 21 010
Impairment charge 300 25 325
Amounts written-off during the year (781) (13) (794)
Transfers (152) 188 36
Amounts recovered during the year 885 82 967
Foreign currencies valuation differences (+/-) (99) - (99)
Ending balance 20 474 971 21 445
Corporate
Overdraft Direct loans Syndicated loans Other Loans Total
814 19 643 17 - 20 474
Individual
Overdraft Credit cards Personal loans Mortgages Total
3 52 406 510 971
21. Financial derivative Cash flow hedge derivatives*
30/6/2019 Notional amount Assets Liabilities
Foreign currency swap 7 353 3 14
Cross currency swap 7 426 289 57
Interest rate swap 41 064 - 157
Total 292 228
30/6/2018 Notional amount Assets Liabilities
Foreign currency swap 11 265 1 57
Cross currency swap 525 35 4
Interest rate swap 57 957 - 194
Total 36 255
*All balances classified as current
EGP mn
EGP mn
103 2018 / 20192018 / 2019
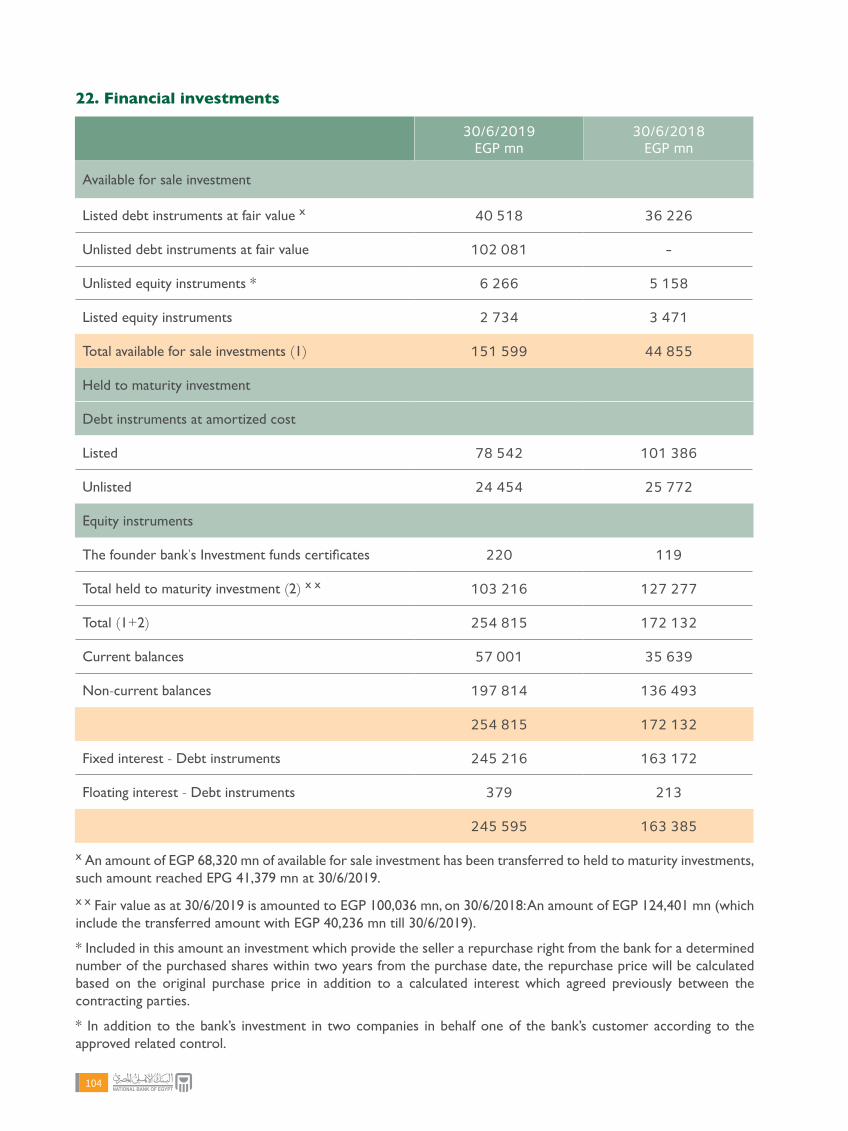
22. Financial investments
30/6/2019EGP mn
30/6/2018EGP mn
Available for sale investment
Listed debt instruments at fair value x 40 518 36 226
Unlisted debt instruments at fair value 102 081 -
Unlisted equity instruments * 6 266 5 158
Listed equity instruments 2 734 3 471
Total available for sale investments (1) 151 599 44 855
Held to maturity investment
Debt instruments at amortized cost
Listed 78 542 101 386
Unlisted 24 454 25 772
Equity instruments
The founder bank’s Investment funds certificates 220 119
Total held to maturity investment (2) x x 103 216 127 277
Total (1+2) 254 815 172 132
Current balances 57 001 35 639
Non-current balances 197 814 136 493
254 815 172 132
Fixed interest - Debt instruments 245 216 163 172
Floating interest - Debt instruments 379 213
245 595 163 385
x An amount of EGP 68,320 mn of available for sale investment has been transferred to held to maturity investments, such amount reached EPG 41,379 mn at 30/6/2019.
x x Fair value as at 30/6/2019 is amounted to EGP 100,036 mn, on 30/6/2018: An amount of EGP 124,401 mn (which include the transferred amount with EGP 40,236 mn till 30/6/2019).
* Included in this amount an investment which provide the seller a repurchase right from the bank for a determined number of the purchased shares within two years from the purchase date, the repurchase price will be calculated based on the original purchase price in addition to a calculated interest which agreed previously between the contracting parties.
* In addition to the bank’s investment in two companies in behalf one of the bank’s customer according to the approved related control.
104

The following is the financial investments’ movement during the year:
Available for sale investments
EGP mn
Held-to-maturity investments
EGP mn
TotalEGP mn
Beginning Balance on July 1, 2018 44 855 127 277 172 132
Additions 100 349 325 100 674
Deductions (selling - redemption) (4 977) (24 569) (29 546)
Movement of changes in fair value (90) - (90)
Impairment loss (221) (1) (222)
Amortization of governmental bonds' premium/(discounts) 12 184 196
Accrued revenue of zero coupon bonds 11 671 - 11 671
Ending balance on June 30 2019 151 599 103 216 254 815
Available for sale
investmentsEGP mn
Held-to-maturity investments
EGP mn
TotalEGP mn
Beginning Balance on July 1, 2017 46 516 148 438 194 954
Additions 4 977 3 350 8 327
Deductions (selling - redemption) (6 655) (24 678) (31 333)
Movement of changes in fair value 26 - 26
Impairment losses (99) - (99)
Premium (discounts) amortization of bonds 90 167 257
Ending balance on June 30, 2018 44 855 127 277 172 132
105 2018 / 20192018 / 2019

Investments in subsidiaries and associates movement during the year represented as follows
30/6/2019EGP mn
30/6/2018EGP mn
Beginning balance 7 779 7 737
Additions 2 660 128
Deductions (117) (6)
Transfers - (3)
Impairment loss charges (2 552) (77)
Ending balance 7 770 7 779
(Losses) profits of financial investments
30/6/2019EGP mn
30/6/2018EGP mn
Profits from selling available for sale investment 123 211
Impairment losses of available for sale equity instruments (221) (99)
Profit from selling investments in subsidiaries and associates - 817
Impairment losses in subsidiaries and associates (2 552) (77)
Profit from selling held to maturity investments 14 31
Total (2 636) 883
106

Financial investments – continued Investments in subsidiaries and associates June 30, 2019
No. Name Share % Book valueAvailable financial
statement
Company's assets
Company's liabilitieswithout
shareholders' equity
Company's revenues
Profit (losses) of
the companyCurrency
Subsidiaries companies
1National Bank Of Egypt - NBE (Uk) 100.00% 1 083 30/6/2018 1 471 1 321 55 6 £
2NBE -Dubaï international Financial center.DIFC
100.00% - 31/12/2018 2 - 1 -2 USD
3 Al Ahly for mortgage 99.08% 248 31/12/2018 722 499 108 19 EGP
4National Bank Of Egypt - El Khartoum
99.00% 300 31/12/2018 2 953 1 581 1 132 969 SDG
5 Al-Ahly Capital Holding Co. 98.95% 4 947 31/12/2018 8 910 138 819 499 EGP
6 El Ahly for leasing 98.50% 296 31/12/2018 2 628 2 155 714 85 EGP
7 Al Ahly for exchange 99.20% 124 31/12/2018 119 3 2 047 - 9 EGP
8Dream Land Co. For Urban Development
71.70% - 31/12/2009 2 102 1 412 162 16 EGP
9 Dream Land Co. For Meeting 71.70% - 31/12/2009 298 252 - - 14 EGP
10 Dream Land Markets Co. 71.70% - 31/12/2009 110 83 - -7 EGP
11 Dream Land Health Resort Co. 71.70% - 31/12/2009 456 117 407 251 EGP
12 Forsan Dream Land 71.70% - 31/12/2009 210 130 - - 15 EGP
13Dream Land Pyramids Co. For Golf
71.70% - 31/12/2009 984 592 103 - 33 EGP
14 Upper Egypt for food industries 70.87% 28 31/12/2018 109 42 14 1 EGP
15 Ahly for trading in securities 60.50% - 31/12/2018 6 - 1 - EGP
16National Melamine And Urea Formaldehyde Co. 54.56% - 31/12/2018 36 1 1 - EGP
17Rady Group for touristic investment
52.05% - 31/12/2016 52 28 - - EGP
18The Egyptian Co. For Asset Management & Investment
50.00% 120 31/12/2018 3 823 3 273 41 64 EGP
Total Subsidiaries 7 146
EGP mn
107 2018 / 20192018 / 2019

No. Name Share % Book valueAvailable financial
statement
Company's assets
Company's liabilitieswithout
shareholders' equity
Company's revenues
Profit (losses) of
the companyCurrency
Associate companies
19The Egyptian Salts And Mineral's Co (Emisal) 49.84% 30 31/12/2018 561 243 572 83 EGP
20 Egy Marble 41.34% - 31/12/2009 23 22 4 - EGP
21International Electrical Produscts
41.33% - 31/12/2009 263 154 134 1 EGP
22 Egy House 41.33% - 31/12/2009 34 50 3 -5 EGP
23 Dream Park 41.33% - 31/12/2008 422 218 69 8 EGP
24 International Electronics 41.33% - 31/12/2006 376 318 14 -9 EGP
25 Egy Serv. 40.00% 1 31/12/2018 131 50 232 41 EGP
26Al Ahly Real Estate Development Co. 40.00% 32 31/12/2017 5 267 4 913 473 15 EGP
27 National Navigation Co. 39.91% - 31/12/2018 466 130 101 20 USD
28National Co. For Housing For Pro. Syndicates
39.57% 64 31/12/2018 207 28 19 4 EGP
29 Imbt 39.38% - 31/12/2018 111 103 - -3 EGP
30Al Ahly For Projects And Medical Services
39.00% 51 31/12/2018 191 35 42 3 EGP
31Oriental Resorts For Touristic Dev. 34.86% - 31/12/2017 114 70 5 - 13 EGP
32 Mena Tele. Co. (Menatel) 33.96% - 31/12/2018 21 17 - 3- EGP
33Real Estate Egyptian Consortium (conslidated) 33.95% - 31/03/2019 672 492 25 7 EGP
34Nile Holding Com. For Inv.& Dev. 33.33% 50 30/09/2018 261 - 36 33 EGP
35 Maspiro CO. FOR URBAN Dev. 33.33% 30 31/12/2018 186 45 32 13 EGP
36El Sherouk For Markets & Commercial Stores
32.00% - 31/12/2018 112 37 259 9 EGP
37Upper Egypt For Investment Co. 30.59% - 31/12/2017 130 - 2 - EGP
38 Horizon For Inv. & Ind. Dev. 30.08% 26 30/09/2018 820 566 536 5 EGP
39Multi Trade Holding-Luxembourg
30.00% - 31/12/2013 1 - - - Euro
40Misr Aswan For Fishing Hunting And Fabricating
28.85% - 31/12/2017 23 5 33 1 EGP
41Port Said National Food Security Co, 28.82% - 31/12/2017 3 1 - - EGP
42Al Ektesadia For Housing And Reconstruction
28.52% 9 31/12/2018 155 49 39 18 EGP
108

No. Name Share % Book valueAvailable financial
statement
Company's assets
Company's liabilitieswithout
shareholders' equity
Company's revenues
Profit (losses) of
the companyCurrency
43Multi-Investment International Co. 27.00% - 31/12/2018 92 20 14 -9 EGP
44The Universal Co For Cellulose Products
27.00% - 31/12/2009 259 188 - - EGP
45New Ismailia For Investment And Tourism Co. 25.17% - 31/12/2017 44 25 5 -3 EGP
46Al Montazah For Tourism & Investment Co. 24.95% - 31/12/2018 530 404 25 -8 EGP
47Development industrial Free Zone (East port-said) 24.47% - 31/12/2015 49 5 2 - EGP
48Concord National Investments Limited - Isle of man
24.26% - 31/12/2016 - - - - USD
49Misr Company For Financial Investment
23.47% - 31/12/2018 64 11 12 -4 EGP
50 Samcrete Development 22.99% 75 30/09/2018 1 944 1 495 121 14 EGP
51Alexandria Company For Petroleum Additives (Acpa) 22.86% - 31/12/2018 243 84 482 18 EGP
52October For Development & Real-Estate Investment Co. 21.74% 20 31/12/2018 239 47 18 1 EGP
53Commercial Inter. Investment Company (Ciic) 20.87% 70 31/12/2018 486 91 30 11 EGP
54Elshorouk Co.For Moulds And Metallurgical Products
20.62% - 31/12/2018 18 4 2 - EGP
55El tahrer for investment parking (TECO) 20.60% - 31/12/2018 608 368 96 - 23 EGP
56 Al Ahly Co. For Agricultural 20.00% 150 31/12/2018 926 13 69 32 EGP
57Upper Egypt For Touristic & Real-Estate Development
20.00% - 31/12/2018 21 3 - -4 EGP
58 Air Cairo 20.00% - 31/12/2018 162 155 196 - 17 USD
59Elnabila For Investment And Development Tourist
20.00% - 31/12/2014 348 370 39 - 8 EGP
60Suez Building Materials Urban And Tourist Development Co. 20.00% 2 31/12/2018 53 35 21 6 EGP
61International Systems For Development & Property Investment
20.00% - 31/12/2011 - - - - EGP
62 Ismailia Whole Markets Co. 20.00% 2 31/12/2018 15 1 7 1 EGP
63 Fawry Dahb E-Payment 20.00% 12 31/12/2018 29 9 96 21 EGP
Total Associate 624
7,770
109 2018 / 20192018 / 2019
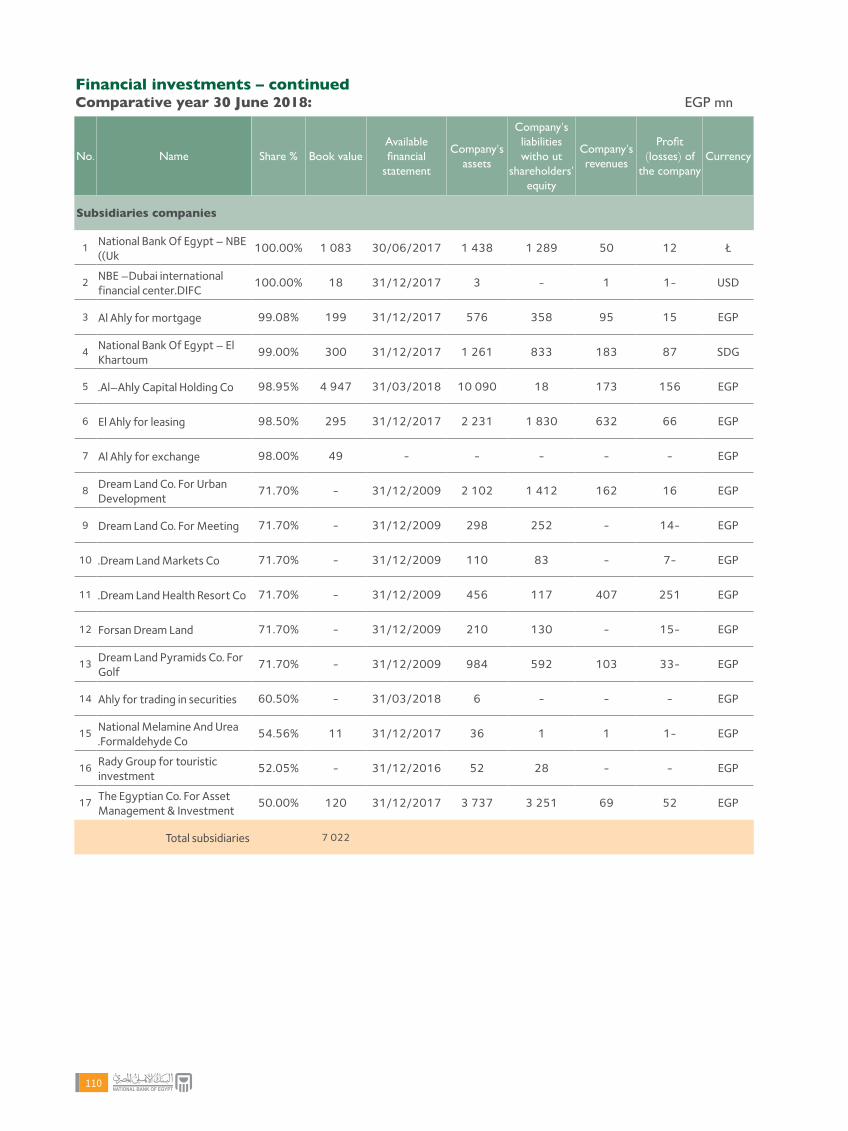
Financial investments – continuedComparative year 30 June 2018: EGP mn
No. Name Share % Book valueAvailable financial
statement
Company's assets
Company's liabilitieswitho ut
shareholders' equity
Company's revenues
Profit (losses) of
the companyCurrency
Subsidiaries companies
1 National Bank Of Egypt - NBE((Uk
100.00% 1 083 30/06/2017 1 438 1 289 50 12 £
2 NBE -Dubai internationalfinancial center.DIFC
100.00% 18 31/12/2017 3 - 1 1- USD
3 Al Ahly for mortgage 99.08% 199 31/12/2017 576 358 95 15 EGP
4 National Bank Of Egypt - ElKhartoum
99.00% 300 31/12/2017 1 261 833 183 87 SDG
5 .Al-Ahly Capital Holding Co 98.95% 4 947 31/03/2018 10 090 18 173 156 EGP
6 El Ahly for leasing 98.50% 295 31/12/2017 2 231 1 830 632 66 EGP
7 Al Ahly for exchange 98.00% 49 - - - - - EGP
8 Dream Land Co. For UrbanDevelopment
71.70% - 31/12/2009 2 102 1 412 162 16 EGP
9 Dream Land Co. For Meeting 71.70% - 31/12/2009 298 252 - 14- EGP
10 .Dream Land Markets Co 71.70% - 31/12/2009 110 83 - 7- EGP
11 .Dream Land Health Resort Co 71.70% - 31/12/2009 456 117 407 251 EGP
12 Forsan Dream Land 71.70% - 31/12/2009 210 130 - 15- EGP
13 Dream Land Pyramids Co. ForGolf
71.70% - 31/12/2009 984 592 103 33- EGP
14 Ahly for trading in securities 60.50% - 31/03/2018 6 - - - EGP
15 National Melamine And Urea.Formaldehyde Co
54.56% 11 31/12/2017 36 1 1 1- EGP
16 Rady Group for touristicinvestment
52.05% - 31/12/2016 52 28 - - EGP
17 The Egyptian Co. For AssetManagement & Investment
50.00% 120 31/12/2017 3 737 3 251 69 52 EGP
Total subsidiaries 7 022
110
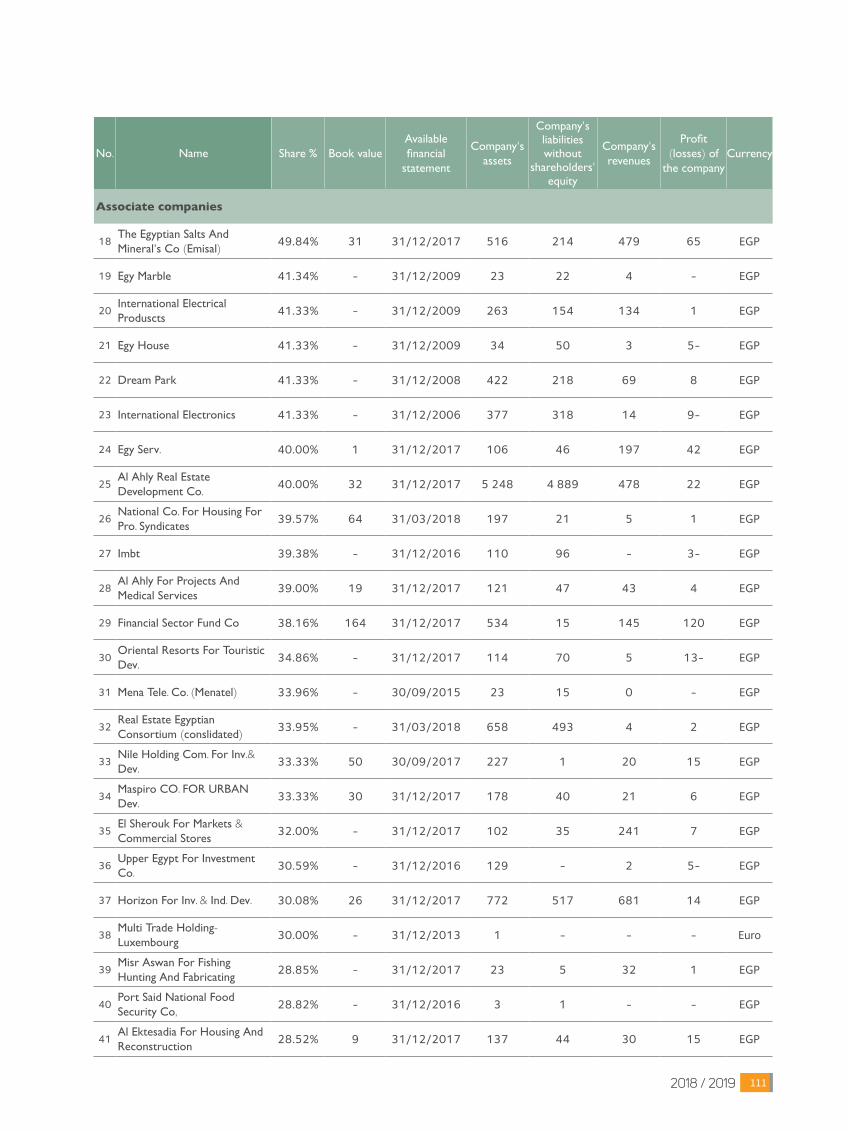
No. Name Share % Book valueAvailable financial
statement
Company's assets
Company's liabilitieswithout
shareholders' equity
Company's revenues
Profit (losses) of
the companyCurrency
Associate companies
18The Egyptian Salts And Mineral's Co (Emisal) 49.84% 31 31/12/2017 516 214 479 65 EGP
19 Egy Marble 41.34% - 31/12/2009 23 22 4 - EGP
20International Electrical Produscts
41.33% - 31/12/2009 263 154 134 1 EGP
21 Egy House 41.33% - 31/12/2009 34 50 3 5- EGP
22 Dream Park 41.33% - 31/12/2008 422 218 69 8 EGP
23 International Electronics 41.33% - 31/12/2006 377 318 14 9- EGP
24 Egy Serv. 40.00% 1 31/12/2017 106 46 197 42 EGP
25Al Ahly Real Estate Development Co. 40.00% 32 31/12/2017 5 248 4 889 478 22 EGP
26National Co. For Housing For Pro. Syndicates
39.57% 64 31/03/2018 197 21 5 1 EGP
27 Imbt 39.38% - 31/12/2016 110 96 - 3- EGP
28Al Ahly For Projects And Medical Services
39.00% 19 31/12/2017 121 47 43 4 EGP
29 Financial Sector Fund Co 38.16% 164 31/12/2017 534 15 145 120 EGP
30Oriental Resorts For Touristic Dev. 34.86% - 31/12/2017 114 70 5 13- EGP
31 Mena Tele. Co. (Menatel) 33.96% - 30/09/2015 23 15 0 - EGP
32Real Estate Egyptian Consortium (conslidated) 33.95% - 31/03/2018 658 493 4 2 EGP
33Nile Holding Com. For Inv.& Dev. 33.33% 50 30/09/2017 227 1 20 15 EGP
34Maspiro CO. FOR URBAN Dev. 33.33% 30 31/12/2017 178 40 21 6 EGP
35El Sherouk For Markets & Commercial Stores
32.00% - 31/12/2017 102 35 241 7 EGP
36Upper Egypt For Investment Co. 30.59% - 31/12/2016 129 - 2 5- EGP
37 Horizon For Inv. & Ind. Dev. 30.08% 26 31/12/2017 772 517 681 14 EGP
38Multi Trade Holding-Luxembourg
30.00% - 31/12/2013 1 - - - Euro
39Misr Aswan For Fishing Hunting And Fabricating
28.85% - 31/12/2017 23 5 32 1 EGP
40Port Said National Food Security Co, 28.82% - 31/12/2016 3 1 - - EGP
41Al Ektesadia For Housing And Reconstruction
28.52% 9 31/12/2017 137 44 30 15 EGP
111 2018 / 20192018 / 2019

No. Name Share % Book valueAvailable financial
statement
Company's assets
Company's liabilitieswithout
shareholders' equity
Company's revenues
Profit (losses) of
the companyCurrency
42Multi-Investment International Co. 27.00% - 31/12/2016 94 4 36 34 EGP
43The Universal Co For Cellulose Products
27.00% - 31/12/2009 259 188 - - EGP
44New Ismailia For Investment And Tourism Co. 25.17% - 31/12/2015 46 22 17 7 EGP
45Al Montazah For Tourism & Investment Co. 24.95% - 31/12/2017 530 396 13 -10 EGP
46Development industrial Free Zone (East port-said) 24.47% - 31/12/2013 48 3 1 - EGP
47Concord National Investments Limited - Isle of man
24.26% - 31/12/2016 - - - - USD
48Misr Company For Financial Investment
23.47% - 31/12/2017 68 11 13 - EGP
49 Samcrete Development 22.99% 75 31/12/2017 1 789 1 354 195 47 EGP
50Alexandria Company For Petroleum Additives (Acpa) 22.86% - 31/12/2017 230 89 433 11 EGP
51Economic Islamic Trade And Distribution Co. 21.94% - 31/12/2017 2 2 - - EGP
52October For Development & Real-Estate Investment Co. 21.74% 20 31/12/2017 239 42 35 5 EGP
53Commercial Inter. Investment Company (Ciic) 20.87% 70 31/12/2018 496 91 6 2 EGP
54Elshorouk Co.For Moulds And Metallurgical Products
20.62% - 31/12/2017 18 5 2 - EGP
55El tahrer for investment parking (TECO) 20.60% - 31/12/2017 640 376 95 -25 EGP
56Upper Egypt For Manufacturing Food Materials
20.17% - 31/12/2016 121 92 82 -3 EGP
57 Al Ahly Co. For Agricultural 20.00% 150 31/12/2017 914 19 50 35 EGP
58Upper Egypt For Touristic & Real-Estate Development
20.00% - 31/12/2017 25 2 - -5 EGP
59 Air Cairo 20.00% - 30/09/2017 162 125 126 1 USD
60 Multitrading & Stores Co. 20.00% - 31/12/2017 155 88 3 094 11 EGP
61Elnabila For Investment And Development Tourist
20.00% - 31/12/2014 348 259 39 -8 EGP
62Suez Building Materials Urban And Tourist Development Co. 20.00% 2 31/12/2017 55 34 15 8 EGP
63InterNational Systems For Development & Investment
20.00% - 31/12/2011 - - - - EGP
64 Ismailia Whole Markets Co. 20.00% 2 31/12/2017 18 4 3 1 EGP
65 Fawry Dahb E-Payment 20.00% 12 31/12/2017 9 2 30 6 EGP
Total associates 757
Total subsidiaries and associates
7 779
112

23. Other assets
30/6/2019EGP mn
30/6/2018EGP mn
Accrued revenues x 20 760 14 627
Prepaid expenses 106 85
Advance payments for the purchase of fixed assets 1 607 917
Assets reverted to the bank as settlement of debts * 3 731 4 749
Insurances and custodies 129 162
Memorial coins 1 1
Others** 10 986 8 859
Total 37 320 29 400
x An amount of EGP 507 mn has been excluded representing the interest in suspense amount of tourism sector customers’ based on the Central Bank of Egypt initiative (30/6/2018: an amount of EGP 232 mn).
*After excluding an amount EGP 2,110 mn (30/6/2018: EGP 1,398 mn).
** After excluding an amount of EGP 1,323 mn (30/6/2018: EGP 1,435 mn).
"Others" item includes:
- Accrued interest of certificates issued on behalf of National Investment Bank amounted to EGP 4,502 mn (30/6/2018: EGP 3,008 mn).
- An amount of EGP 474 mn for the subordinate loan’s installment and accrued interest.
- An amount of EGP 580 mn for taxes on salaries and wages.
- An amount of EGP 175 mn for settlement of general sector companies’ debits listed in the good faith agreement.
113 2018 / 20192018 / 2019

23/1- Investment property
Cost Depreciationfor the year
Accumulated depreciation as at
30/06/2019
Net book value30/06/2019
Building No. 10, Emraa El Noury street, Banha, Al Qaliubiya
2 - 1 1
Building No. 174, Al Nozha street 1 - - 1
Total 3 - 1 2
Cost Depreciationfor the year
Accumulated depreciation
as at30/06/2018
Net book value30/06/2018
Building No. 10, Emraa El Noury street, Banha, Al Qaliubiya 2 - 1 1
Building No. 174, Al Nozha street 1 - - 1
Total 3 - 1 2
114

115 2018 / 20192018 / 2019
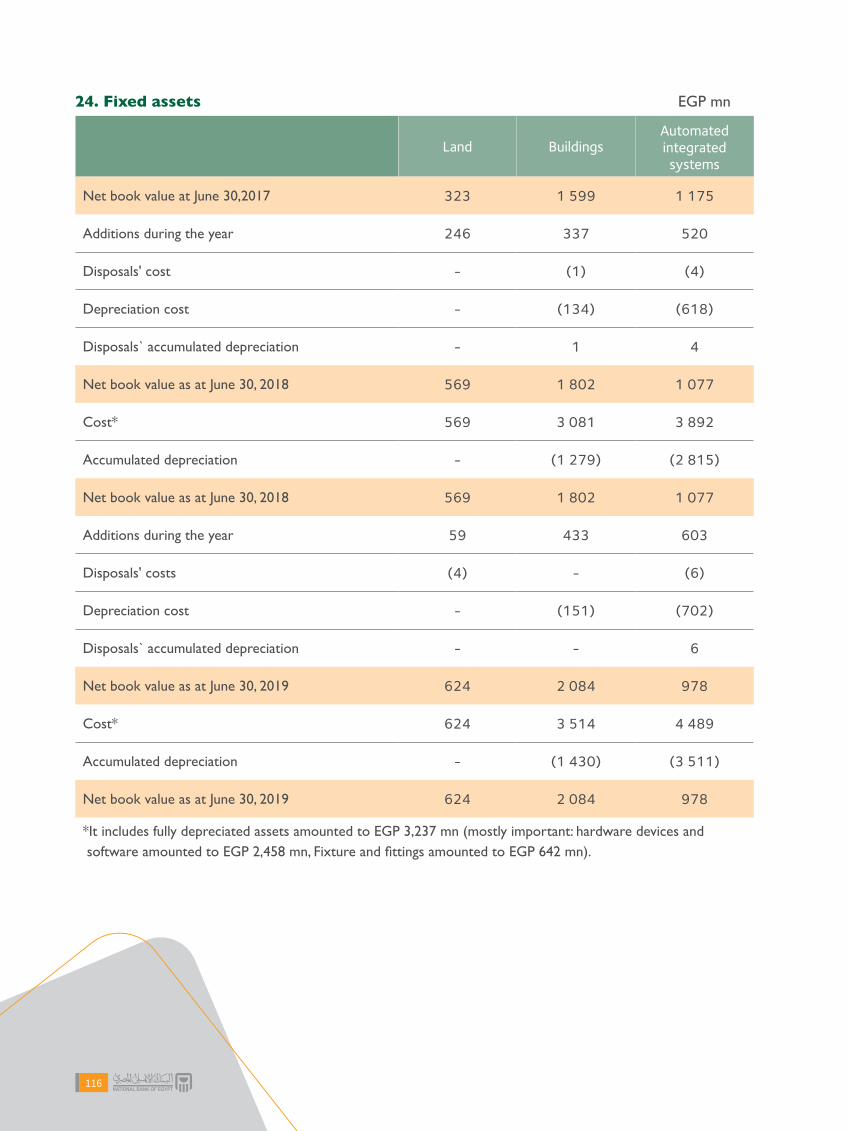
24. Fixed assets EGP mn
Land Buildings Automated integrated
systemsVehicles Fixtures and fittings Vault rooms' doors Furniture Total
Net book value at June 30,2017 323 1 599 1 175 87 845 - 283 4 312
Additions during the year 246 337 520 24 477 - 245 1 849
Disposals' cost - (1) (4) (11) - - - (16)
Depreciation cost - (134) (618) (30) (148) - (129) (1 059)
Disposals` accumulated depreciation - 1 4 10 - - - 15
Net book value as at June 30, 2018 569 1 802 1 077 80 1 174 - 399 5 101
Cost* 569 3 081 3 892 195 1 744 9 1 161 10 651
Accumulated depreciation - (1 279) (2 815) (115) (570) (9) (762) (5 550)
Net book value as at June 30, 2018 569 1 802 1 077 80 1 174 - 399 5 101
Additions during the year 59 433 603 53 437 - 253 1 838
Disposals' costs (4) - (6) (1) - - - (11)
Depreciation cost - (151) (702) (32) (186) - (167) (1 238)
Disposals` accumulated depreciation - - 6 1 - - - 7
Net book value as at June 30, 2019 624 2 084 978 101 1 425 - 485 5 697
Cost* 624 3 514 4 489 247 2 181 9 1 414 12 478
Accumulated depreciation - (1 430) (3 511) (146) (756) (9) (929) (6 781)
Net book value as at June 30, 2019 624 2 084 978 101 1 425 - 485 5 697
*It includes fully depreciated assets amounted to EGP 3,237 mn (mostly important: hardware devices and software amounted to EGP 2,458 mn, Fixture and fittings amounted to EGP 642 mn).
116

24. Fixed assets EGP mn
Land Buildings Automated integrated
systemsVehicles Fixtures and fittings Vault rooms' doors Furniture Total
Net book value at June 30,2017 323 1 599 1 175 87 845 - 283 4 312
Additions during the year 246 337 520 24 477 - 245 1 849
Disposals' cost - (1) (4) (11) - - - (16)
Depreciation cost - (134) (618) (30) (148) - (129) (1 059)
Disposals` accumulated depreciation - 1 4 10 - - - 15
Net book value as at June 30, 2018 569 1 802 1 077 80 1 174 - 399 5 101
Cost* 569 3 081 3 892 195 1 744 9 1 161 10 651
Accumulated depreciation - (1 279) (2 815) (115) (570) (9) (762) (5 550)
Net book value as at June 30, 2018 569 1 802 1 077 80 1 174 - 399 5 101
Additions during the year 59 433 603 53 437 - 253 1 838
Disposals' costs (4) - (6) (1) - - - (11)
Depreciation cost - (151) (702) (32) (186) - (167) (1 238)
Disposals` accumulated depreciation - - 6 1 - - - 7
Net book value as at June 30, 2019 624 2 084 978 101 1 425 - 485 5 697
Cost* 624 3 514 4 489 247 2 181 9 1 414 12 478
Accumulated depreciation - (1 430) (3 511) (146) (756) (9) (929) (6 781)
Net book value as at June 30, 2019 624 2 084 978 101 1 425 - 485 5 697
*It includes fully depreciated assets amounted to EGP 3,237 mn (mostly important: hardware devices and software amounted to EGP 2,458 mn, Fixture and fittings amounted to EGP 642 mn).
117 2018 / 20192018 / 2019

25. Due to banks
30/6/2019EGP mn
30/6/2018EGP mn
Current accounts 3 006 2 253
Deposits 137 983 280 333
140 989 282 586
Central Bank of Egypt 91 898 160 507
Local banks 42 430 56 408
Foreign banks 6 661 65 671
140 989 282 586
Non-interest bearing balances 1 820 1 102
secnalab gniraeb tseretnI 139 169 281 484
140 989 282 586
Current balances 137 348 281 751
Non-current balances 3 641 835
140 989 282 586
118

26. Customer’s deposits
30/6/2019EGP mn
30/6/2018EGP mn
Demand deposits 169 509 82 644
Time and notice deposits 120 022 143 058
Certificates of deposit 641 009 582 621
Saving deposits 233 686 198 612
Other deposits 6 366 7 898
Total 1 170 592 1 014 833
30/6/2019EGP mn
30/6/2018EGP mn
Non-interest bearing balances 54 159 48 023
Floating interest bearing balances 262 506 204 810
Fixed interest bearing balances 853 927 762 000
1 170 592 1 014 833
Corporate 267 604 209 491
Individual 902 988 805 342
1 170 592 1 014 833
Current balances 482 256 340 511
Non-current balances 688 336 674 322
1 170 592 1 014 833
119 2018 / 20192018 / 2019

27. Other loans
Interest rate 30/6/2019EGP mn
30/6/2018EGP mn
Social Fund for Developmental Projects 2%:8.75 % 5,177 6 031
Commercial International Bank (March 2024) Floating 219 145
Danish government Without 118 91
Subordinate loan as part of EL Mohandes Bank merge (October 2019)
Without 1 300 1 197
Subordinate loan as part of Tegareyoon Bank merge (January 2022)
Without 244 225
Two soft-term loans signed between the Egyptian government and the Italian government (UNIDO) (November 2036)
1% 185 208
European Investment Bank (September 2031) Floating 19 451 13 820
National Investment Bank (as part of WB and the IDA loans) (July 2032)
0.88% 295 384
African Development Bank (August 2019) Floating 176 567
African Export-Import Bank (April 2020) Floating 8 910 10 047
Nordea Bank (June 2023) Without 73 102
Royal Bank (October 2020) Without 315 573
Danske bank – Copenhagen (December 2025) Without 38 47
Japan Bank for International Cooperation (May 2046) Floating 647 703
French Agency (May 2030) Floating 955 1 143
Loans from international institutions financing banks (February 2028)
10.25% 57 65
China Development Bank (February 2024) Floating 24 056 15 205
Eco Spanish Foundation (September 2037) Floating 57 47
European Bank for reconstruction and development EBRD (May 2023)
Floating 4 695 5 873
Saudi fund grant for development (November 2021)
5% annually from the date of transfer
till the date of re-loan and then
2%anually
38 61
120

Interest 30/6/2019EGP mn
30/6/2018EGP mn
Sanad mutual fund (USD 15 mn) (July 2024) Floating 348 402
Arab Trade Finance Program Ever Grow Specialized Fertilizers Co.(March 2023)
Floating 219 318
Emirates NBD (February 2020) Floating 13 339 11 788
Standard Chartered (December 2019) 3.45% 3 341 3 578
Credit Suisse-London (August. 2019) 3.21% 437 513
Subordinate deposit amounted to EGP 13 Billion (August 2026)* Without 4 188 3 575
Subordinate deposit 2 amounted to EGP 16 Billion (December 2026)* Without 4 897 4 180
Subordinate deposit 3 amounted to EGP 14 Billion (March 2027)* Without 4 116 3 513
Green climate fund (June 2027) Floating 452 537
RAKBank (July. 2019) 3.82% 501 537
National Bank of Abu Dhabi-Dubai (FAB) (October 2021) Floating 25 059 20 571
Deutsche bank AG-London Floating - 1 789
UBAF-Paris (August 2019) Floating 468 1 620
JP Morgan London (December 2019) Floating 4 177 264
Credit Suisse-Zurich (August. 2019) 3.21% 1 253 1 340
Union Bank (Pakistan)-Dubai (August 2019) 4% 133 513
Noor Bank (July 2019) 4% 1 253 1 342
Commerzbank (November 2018) 3.8% - 563
121 2018 / 20192018 / 2019
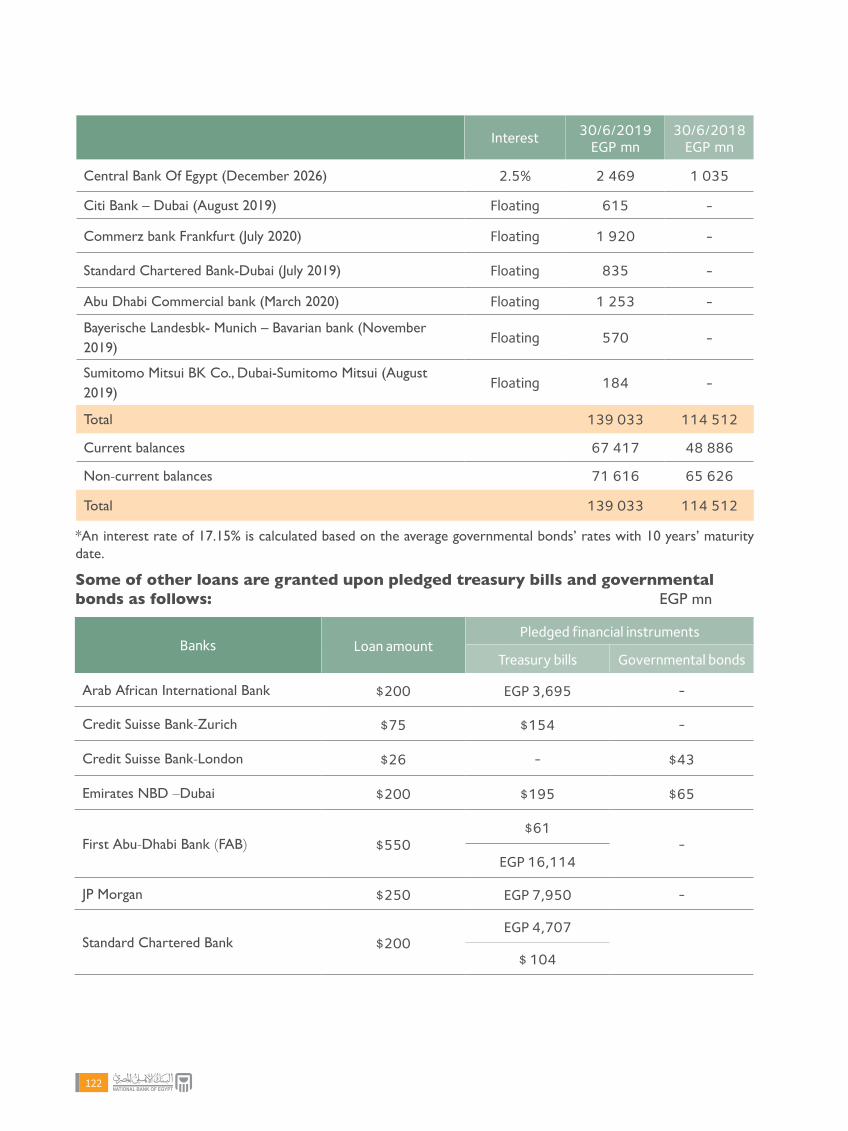
Interest 30/6/2019EGP mn
30/6/2018EGP mn
Central Bank Of Egypt (December 2026) 2.5% 2 469 1 035
Citi Bank – Dubai (August 2019) Floating 615 -
Commerz bank Frankfurt (July 2020) Floating 1 920 -
Standard Chartered Bank-Dubai (July 2019) Floating 835 -
Abu Dhabi Commercial bank (March 2020) Floating 1 253 -
Bayerische Landesbk- Munich – Bavarian bank (November 2019)
Floating 570 -
Sumitomo Mitsui BK Co., Dubai-Sumitomo Mitsui (August 2019)
Floating 184 -
Total 139 033 114 512
Current balances 67 417 48 886
Non-current balances 71 616 65 626
Total 139 033 114 512
*An interest rate of 17.15% is calculated based on the average governmental bonds’ rates with 10 years’ maturity date.
Some of other loans are granted upon pledged treasury bills and governmental bonds as follows: EGP mn
Banks Loan amountPledged financial instruments
Treasury bills Governmental bonds
Arab African International Bank $200 EGP 3,695 -
Credit Suisse Bank-Zurich $75 $154 -
Credit Suisse Bank-London $26 - $43
Emirates NBD –Dubai $200 $195 $65
First Abu-Dhabi Bank (FAB) $550$61
-EGP 16,114
JP Morgan $250 EGP 7,950 -
Standard Chartered Bank $200EGP 4,707
$ 104
122

28. Other Liabilities
30/6/2019EGP mn
30/6/2018EGP mn
Accrued payable 13 624 13 391
Prepaid revenues 394 414
Accrued expenses 5 042 1 692
Fixed assets’ purchase’ creditors 805 768
Creditors 4 602 4 442
Stamp tax liabilities 18 67
Other credit balances * 17 309 12 789
Total 41 794 33 563
Other credit balances includes the following:• An amount of EGP 15 mn represents the stamp taxes regarding some of merged banks’ customers included in
credit balances before the merge and it will be settled when issuing the final courts’ orders.• An amount of EGP 44 mn represents differences between nominal value and present value of the subordinated
loans from CBE derived from the merge of El Mohandes and El Togareen banks (June 30,2018: EGP 167 mn). • An amount of EGP 397 mn represents the public sector’s restructuring fund (June 30,2018: EGP 393 mn)• An amount of EGP 2,274 mn represents tax calculated on treasury bills (June 30,2018: EGP 2,480 mn)• An amount of EGP 3,297 mn represents tax reserve of governmental bonds. (June 30,2018: EGP 1,025 mn)• An amount of EGP 582 mn represents taxes on salaries and wages.• An amount of EGP 207 mn represents 20% of the retained amounts for the industrial pollutions’ reduction loan’.• An amount of EGP 555 mn represents stamp reserve for credit facilities balances.• An amount of EGP 1,070 mn represents remittances ACH • An amount of EGP 429 mn represents checks for collection. • An amount of EGP 238 mn represents Tax Authority check’s proceeds.
123 2018 / 20192018 / 2019

29. Other provisions
30/6/2019 EGP mn
Beginningbalance
Charge of otherprovisions
Exchange revaluationdifference
Used during the
yearTransfers Adjustments
Provisions no longerrequired
ProceedsEndingbalance
Provision for other claims
571 6 693 (7) (19) (17) (697) - - 6 524
Provision for legal claims
880 34 (26) (7) (12) 96 (369) - 596
Provision for contingent liabilities
1 155 13 (12) (1) (187) - - - 968
Total 2 606 6 740 (45) (27) (216) (601) (369) - 8 088
30/6/2018 EGP mn
Beginningbalance
Charge of otherprovisions
Exchange revaluationdifference
Used during the
yearTransfers Adjustments
Provisions no longerrequired
ProceedsEndingbalance
Provision for other claims
373 208 (1) - (28) 388 (369) - 571
Provision for legal claims
1 530 89 3 (4) 30 (673) (95) - 880
Provision for contingent liabilities
1 521 (285) (5) (6) (70) - - - 1 155
Total 3 424 12 (3) (10) (68) (285) (464) - 2 606
124

30. Pension benefits’ liabilities
30/6/2019EGP mn
30/6/2018EGP mn
Obligations included in balance sheet:
Pension healthcare benefits 3 416 2 993
Amounts recognized in the income statement:
Pension healthcare benefits 565 581
Pensions benefits
The recognized amounts in balance sheet is determined as follows:
The present value of unfunded liabilities’ 3 416 2 993
3 416 2 993
The liabilities movement during the year is represented as follows:
Beginning balance 2 993 2 528
Current service Cost 85 107
Interest cost 480 474
Benefits paid (142) (116)
3 416 2 993
31. Deferred income tax Deferred income tax on deferred tax differences is fully calculated based on the liabilities method using the effective tax rate.
Deferred tax assets derived from carried forward tax losses are not recognized unless it is probable that there are future tax profits from which the carried forward tax losses can be utilized.
The bank does not offset deferred tax assets and deferred tax liabilities unless; the bank has a legally enforceable right to offset current tax assets against current tax liabilities and whenever the deferred income taxes levied by the same taxation authority.
Deferred tax assets and liabilities:
The deferred tax assets’ and liabilities’ movement and balances are as follows
Deferred tax assets and liabilities balances
Deferred tax assets Deferred tax liabilities
June 30, 2019EGP mn
June 30, 2018EGP mn
June 30, 2019EGP mn
June 30, 2018EGP mn
Fixed assets - - 201 198
Provisions (other than impairment loss provision for loans)
201 198 - -
Total taxable asset (liability) 201 198 201 198
125 2018 / 20192018 / 2019

Movement of deferred tax assets and liabilities
Deferred tax assets Deferred tax liabilities
June 30, 2019EGP mn
June 30, 2018EGP mn
June 30, 2019EGP mn
June 30, 2018EGP mn
Beginning balance 198 173 198 173
Additions 3 25 3 25
Ending balance 201 198 201 198
Not recognized deferred tax assets
Deferred tax assets are not recognized for the following items:
June 30, 2019EGP mn
June 30, 2018EGP mn
Impairment loss provision for loans (excluding 80% of the amount charged during the year) 204 59
Deferred tax assets regarding the above mentioned items are not recognized due to the lack of reasonable assurance that this account can be utilized/ or a proper conformity level that there are a future taxable profits enough to utilize these assets.
32. Capital - Extra Ordinary General Assembly approved on December 25, 2014 the increase of the authorized capital to EGP 30 000 mn and increased the paid up capital with an amount of EGP 5 752 mn transferred from shareholders` equity reserves to reach EGP 15 000 mn divided on EGP 15 000 mn shares with EGP 1 par value for each paid share, also amended the primary statues with that increase. It has been published in official Egyptian newspaper (Al- Waqa`a al Masrya) on 19/01/ 2015 and in Banks record at 20/01/2015.
- Extra Ordinary General Assembly approved on February 26, 2017 the increase of the authorized capital to EGP 50 000 mn and increased the paid up capital with an amount of EGP 13 650 mn transferred from shareholders` equity reserves to reach EGP 28 650 mn, divided to 28 650 mn share with EGP 1 par value for each paid share and also amended the primary statues with that increase. It has been published in official Egyptian newspaper (Al- Waqa`a al Masrya) on 18/04/ 2017 and in Banks commercial register at 20/04/2017.
- Extra Ordinary General Assembly approved on February 13, 2018 the increase of The issued and paid up capital with an amount of EGP 6 350 mn transferred from the supportive reserves to reach EGP 35 000 mn and also amended the primary statues with that increase. It has been published in official Egyptian newspaper (Al- Waqa`a al Masrya) on 01/04/ 2018 and in Banks commercial register at 04/04/2018.
33. ReservesLegal reserve
According to bank’s articles of Association 10% of the yearly net profit (after excluding profits from sale of fixed assets) is replenished to increase legal reserve until it reaches 100% of the Bank’s capital.
General reserve
According to the bank’s articles of Association a 10% of the yearly net profit available for dividends distribution (after the exclusion of the legal reserve share) is retained to replenish the general reserve.
Capital reserve
Includes the proceeds from sale of fixed assets (Capital revenues). This reserve is used to enhance the bank’s capital base and increase the issued and paid-up capital.
126

Supportive reserve
According to the bank’s articles of association which enclose that “if the ministry of finance has not acquired it’s share then it would be fully redirected to the supportive reserve”. This reserve is also used to enhance the bank’s capital base and increase the issued and paid-up capital.
Special reserve
The special reserve includes previous years’ revaluation differences of available for sale investment in foreign currency. In addition to, the difference between impairment loss provision and the provision based on the credit worthiness at the first adoption of financial statements as of 30 June 2010.
Fair value reserve-AFS investment (After Tax)
It includes revaluation differences of available for sale investments which derived from the change in fair value represented in market prices for each investment separately whether by profit or loss.
General Banking risks reserve
CBE’s instructions obligate on forming a general banking risks reserve to meet differences between (impairment loss provision and loans and advances provision based on credit worthiness for the same year).
As well as, 10% of assets reverted to the bank that has been in bank`s records and not disposed for 5 years.
IFRS (9) risk reserve
According to the International Financial Reporting Standard (IFRS 9) and the Central Bank of Egypt instructions issued at 28 January 2018 And it`s appendices of explanatory instructions in 26 February 2019.A risk reserve for IFRS (9) standard has been formed by 1% of the total weighted credit risks deducted from the net profit after tax for the year ended 30 June 2018.This reserve is included in the share bank’s capital within the capital base. At the beginning of the implementation, Special reserve-credit, General Banking risk reserve and IFRS 9 risk reserve will be all included in General risk reserve, which will be used in the actual implementation of the standard, otherwise it’s use will be restricted to CBE approval.
Reserves
June 30, 2019EGP mn
June 30, 2018EGP mn
Legal reserve 5 907 4 898
General reserve 1 314 1 098
IFRS 9 risk reserve 6 926 -
Capital reserve 54 33
Supportive reserve 2 410 1 164
Special reserve * 403 403
Fair value reserve- AFS investment (After tax) 2 757 2 752
Foreign currency translation differences for overseas branches
400 507
Cash flow hedge reserve 20 (122)
General Banking risk reserve ** 4 673 4 673
Total 24,864 15 406
127 2018 / 20192018 / 2019

*Special reserve includes an amount of EGP 296 mn representing the difference between impairment provision and the provision based on the credit worthiness at the first adoption of rules issued by CBE on 30 June 2010 for preparation and presentation of financial statements. The remaining value is amounted to EGP 106 mn representing the revaluation differences of available for sale investment in foreign currencies. The use of this reserve is restricted, unless approval obtained from CBE.
**The general banking risk reserve is represented in impairment of provision with an amount of EGP 3,397 mn against an amount of EGP 3,783 mn in Comparative year and also in assets reverted to the bank as settlement of debts with an amount of EGP 1,267 mn.
The movement in fair value reserve - AFS investment (after tax)
June 30, 2019EGP mn
June 30, 2018EGP mn
Beginning balance 2 752 2 854
Total sale movements (200) (765)
Total revaluation (91) 229
Amortization' movement of FV reserve for AFS bonds transferred to HTM. 296 434
Ending balance 2 757 2 752
Capital reserve
June 30, 2019EGP mn
June 30, 2018EGP mn
Beginning balance 33 22
Transferred from last year net profit 21 11
Ending balance 54 33
Cash flow hedge reserve movement
June 30, 2019EGP mn
June 30, 2018EGP mn
Beginning balance (122) (48)
Movement during the year 142 (74)
Ending balance 20 (122)
128

Supportive reserve
June 30, 2019EGP mn
June 30, 2018EGP mn
Beginning balance 1 164 -
Transferred from last year net profit 1 246 7 514
Bank's capital increase - (6 350)
Ending balance 2 410 1 164
Differences between nominal value and present value of the subordinated loans
As a part of enhancing the bank’s capital base, The Central Bank of Egypt has granted the National Bank of Egypt the following subordinate loans:
Granting date Loans amountEGP mn
Present valueEGP mn
Differences between nominal value and
present valueEGP mn
24 August 2016 13 000 4 188 8 812
29 December 2016 16 000 4 897 11 103
20 March 2017 14 000 4 115 9 885
Total 43 000 13 200 29 800
34. Profit dividendsProfit dividends are not recorded until they are approved by the Shareholders’ General Assembly held at the Central Bank of Egypt. Earnings per share is amounted to EGP 0.49 For the financial year ended 30 June 2019, with total amount of EGP 17,178 mn against an amount of EGP 9,917 mn in the comparative year.
The Board of Directors has proposed – as of the bank’s articles of Association - that the Shareholder’ General Assembly should distribute an amount of EGP 3,027 mn to the staff profit share (2018: the actual dividends are amounted to EGP 194 mn).
129 2018 / 20192018 / 2019

35. Contingent liabilities and commitmentsA/ Loans, guarantees and advances commitments
June 30, 2019EGP mn
June 30, 2018EGP mn
Customers acceptances 24 520 30 710
Letters of guarantee 110 635 106 404
Letters of credit (import and export) 50 449 46 779
Other contingent liabilities** 421 791 278 545
Discounted bills 773 947
Total 608 168 463 385
**The net sales of investment certificates group (A, B, C) according to the ministerial decision no.199 for the year 1993 article no, (2) are represented in the transferred proceeds of investment certificates with an amount of EGP 420,133 mn from the National Investment Bank.
B/Capital Commitments
Commitments for the financial investment not required to be paid till June 30,2019 are amounted to EGP 707 mn (June 30,2018: EGP 762 mn). The value of commitments regarding fixed assets’ purchase contracts and branches’ construction that are not implemented till the balance sheet date are amounted to EGP 1,531 mn (June 30,2018: EGP 959 mn).
36. Transactions with related partiesThe Bank is an affiliate of the Ministry of Finance (Arab Republic of Egypt), which owns 100% of the bank’s common shares.
The bank has entered into many transactions with related parties through the bank’s normal course of business these transactions include loans and deposits
A) seiraidisbus) seitrap detaler ot secnavda dna snaoL(setaicossa dna
June 30, 2019EGP mn
June 30, 2018EGP mn
Loans and advances to customers
Loans at year end 2 536 2 279
Interest income on loans 357 510
Due from banks
Balances at year end 1 686 5 422
Interest income on due from banks 83 74
Loans and advances to banks
Loans at year end 752 797
Interest income on loans 34 28
Other assets 2 701 2 701
130

B) Deposits from related parties June 30, 2019EGP mn
June 30, 2018EGP mn
Due to customers
Deposits at year end 187 227
Interest expense on deposits and similar expense 12 12
Due to banks
Balances at year end 2 852 3 219
Interest expense on due to banks 120 101
C)Employee monthly average for the top 20 management' employees
June 30, 2019EGP mn
June 30, 2018EGP mn
Monthly (average) 0.3 0.2
37. Mutual fundsa. NBE’s First Mutual Fund with Accumulated Return has
been established by CBE’s approval dated 14/7/1993 and license No. 25 issued by Capital Market Authority on 26/6/1994. The Fund started business on 4/9/1994.Capital Market Authority approved amending the Fund into a mutual fund with a periodic and accumulated return as well as splitting its nominal value to become EGP 10 on 6/11/2007. Al Ahly Mutual Fund Management company operates the Fund. The number of certificates as at 30/06/2019 reached 1,120,266 certificates with market value of EGP 46 mn. NBE’s share on the same date reached 717,040 certificates. This share consists of 125,980 held till the end of the Fund’s maturity certificates with a market value of EGP 5 mn, and 591,060 available for sale financial investments certificates with a market value of EGP 24 mn, as per the declared rates on 2/07/2109. According to the amended prospectus at 1/4/2016,the Bank shall receive 7.5 per thousand annually of the fund’s net assets value against supervision fees and other administrative services performed by the Bank, excluding the fees of management service companies with 1.5 per ten thousand. The bank obtained EGP 0.34 mn total commission for the year ended 30/06/2019.
b. NBE’s Second Mutual Fund with a Periodic Return has been established by CBE’s approval dated 14/7/1993 and license No. (70) Issued by Capital Market Authority on 12/6/1995. The Fund started business on 3/10/1995 and being operated by Al Ahly financial investment Management company. The number of certificates as at 30/06/2019 reached 788,297
certificates with a market value of EGP 54 mn. NBE’s share on the same date reached 345,240 certificates represented in 76,477 held till the end of the Fund’s maturity certificates with a market value of EGP 5 mn and available for sale financial investments amounting to 268,763 certificates with a market value of EGP 18 mn, as per the declared rates on 02/07/2019. Pursuant to the Fund’s management contract and the prospectus, the Bank shall obtain 7.5 per thousand annual commissions and fees against supervision on the Fund and the other administrative services performed by the Bank, excluding the fees of management service companies with 1.5 per ten thousand. The bank has obtained EGP 0.408 mn total commission for the year ended 30/06/2019.
c. NBE’s Third Mutual Fund with a Periodic and Accumulated Return has been established by CBE’s approval dated 15/3/2005 and license No. 334 issued by Financial Regulatory Authority on 12/5/2005. The Fund started business on 9/8/2005 and being operated by HC Securities and Investment company. The number of certificates as at 30/06/2019 reached 312,465 certificates with a market value of EGP 43 mn. NBE’s share on the same date reached 37,021 certificates represented in held till the end of Fund’s maturity certificate with a market value of EGP 5 mn, as per the declared rates on 02/07/2019. Pursuant to the Fund’s management contract and the prospectus, the Bank shall obtain 4 per thousand annually of the Fund’s net asset value against supervision on the Fund and other administrative services performed by the
131 2018 / 20192018 / 2019
Bank, providing that the bank pays all fees regarding the management service company according to the contract endorsed between them. The bank has obtained EGP 0.172 mn total commission for the year ended 30/06/2019.
d. NBE’s Fourth Cash Return Fund with Daily Accumulated Return has been established by CBE’s approval dated 1/12/2005 and license No. 345 issued by Capital Market Authority on 26/3/2006. The Fund started business on 30/4/2006 and being operated by Al Ahly financial investment Management company. The number of certificates as at 30/06/2019 reached 47,010,428 certificates with a market value of EGP 12,805 mn. NBE’s share on the same date reached 951,475 certificates with a market value of EGP 259 mn, as per the declared rates on 02/07/2019. Pursuant to the Fund’s management contract and the prospectus, the Bank shall obtain 3 per thousand annual commissions and fees against supervision on the Fund and other administrative services performed by the Bank. The bank has obtained EGP 30 mn total commission for the year ended 30/06/2019.
e. NBE’s Fifth Mutual Fund with Accumulated Return has been established by CBE’s approval dated 15/3/2005 and license No. (386) issued by Capital Market Authority on 13/2/2007. The Fund started business on 20/5/2007 and being operated by Al Ahly financial investment Management company. The number of certificates as at 30/06/2019 reached 2,031,774 certificates with a market value of EGP 24 mn. NBE’s share on the same date reached 440,029 certificates with a market value of EGP 5 mn, as per the declared rates on 02/07/2019. Pursuant to the Fund’s management contract and the prospectus, the Bank shall obtain 4 per thousand annual commissions and fees against supervision on the Fund and other administrative services performed by the Bank, providing that the bank pays all fees regarding the management service company according to the contract endorsed between them. The bank has obtained EGP 0.096 mn total commission for the year ended 30/06/2019.
f. NBE’s and Al Baraka Bank’s Sixth Mutual Fund with Periodic and Accumulated Return (Bashaier) has been established by CBE’s approval dated 5/7/2007 and license No. 432 issued by Financial Regulatory Authority on 31/12/2007. The Fund started business on 10/2/2008 and being operated by Al Ahly Financial Investment Management company. The number of certificates as at 30/06/2019 reached 1,527,437 certificates with a market value of EGP 117 mn.
NBE’s share on the same date reached 33,856 held to maturity certificates with a market value of EGP 260 mn and 65,0000 available for sale financial investments certificates with a market value of EGP 50 mn as per declared rates on 02/07/2019. Pursuant to the Fund’s management contract and the prospectus. The Bank shall obtain 3.75 per thousand annual commissions and fees against supervision on the Fund and other administrative services performed by the Bank, excluding the fees of management service companies with 1.5 per ten thousand. The bank has obtained EGP 0.452 mn total commission for the year ended 30/06/2019.
g. NBE’s Seventh Mutual Fund with Accumulated and Periodic Return (the Fund of Egyptian Funds) has been established by CBE’s approval dated 6/1/2009 and license No. 513 issued by Capital Market Authority on 19/5/2009. The Fund started business on 29/7/2009. It is operated by Prime holing for securities and investment. The number of certificates as at 30/06/2019 accounted for 154,329 certificates with a market value of EGP 22 mn. NBE’s share on the same date reached 35,488 certificates with a market value of 5 mn. As per declared rates on 02/07/2019. Pursuant to the Fund’s management contract and the prospectus, the Bank shall obtain 3.75 per thousand annual commissions and fees against supervision on the Fund and the other administrative services performed by the Bank, providing that the bank shall pay all fees related to the management service company according to the contract endorsed between them. The bank has obtained EGP 0.079 mn total commission for the year ended 30/06/2019.
h. NBE’s eighth EL-Waed Mutual Fund with quarterly fixed income has been established by CBE’s approval dated 14/11/2010 and license No. 636 issued by Capital Market Authority on 23/5/2011. The Fund started business on 16/10/2011.Al Ahly Financial Investment Management co. operates it. The number of certificates as at 30/06/2019 reached 464,078 certificates with a market value of EGP 769 mn. NBE’s share on the same date reached 11,616 certificates with a market value of EGP 19 mn. In addition to available for sale financial investments amounting to 84,154 certificates with a market value of EGP 139 mn. This reflects the declared rates on 02/07/2019. Pursuant to the Fund’s management contract amended on 03/04/2016 and the prospectus, the Bank shall obtain 2 per thousand annual commissions and fees against supervision on the Fund, excluding the fees of the management service company with 0.05 per thousand as well as
132

commissions and fees against supervision on the Fund and the other administrative services performed by
the Bank. The bank has obtained EGP 1.5 mn total commission for the year ended 30/06/2019.
38. Significant eventsThe final International Financial Reporting Standard (IFRS 9) was issued on July,2014. The Central Bank of Egypt has issued instructions to banks to commit with the standard requirements on 28 January,2018. However, the explanatory instructions were issued on 26 February,2019 to explain that the standard implementation will be effective starting from 1st July, 2019.Also the recognition and measurement principles for financial assets, financial liabilities and impairment of financial assets. This may have an impact on the recognition and measurement rules for certain financial assets starting from 1st July,2019.
39. Comparative figuresThe Bank has amended the comparative figures to conform with the classification of financial statements of the current fiscal year.
Chief Financial Officer
Wael Abou-Ali
Deputy Chairman
Dalia El Baz
Deputy Chairman
Yehia Abou El-Fotouh
Chairman
Hisham Ahmed Okasha
2018 / 20192018 / 2019 133

NBE’S
PRESENCE WORLDWIDE
134
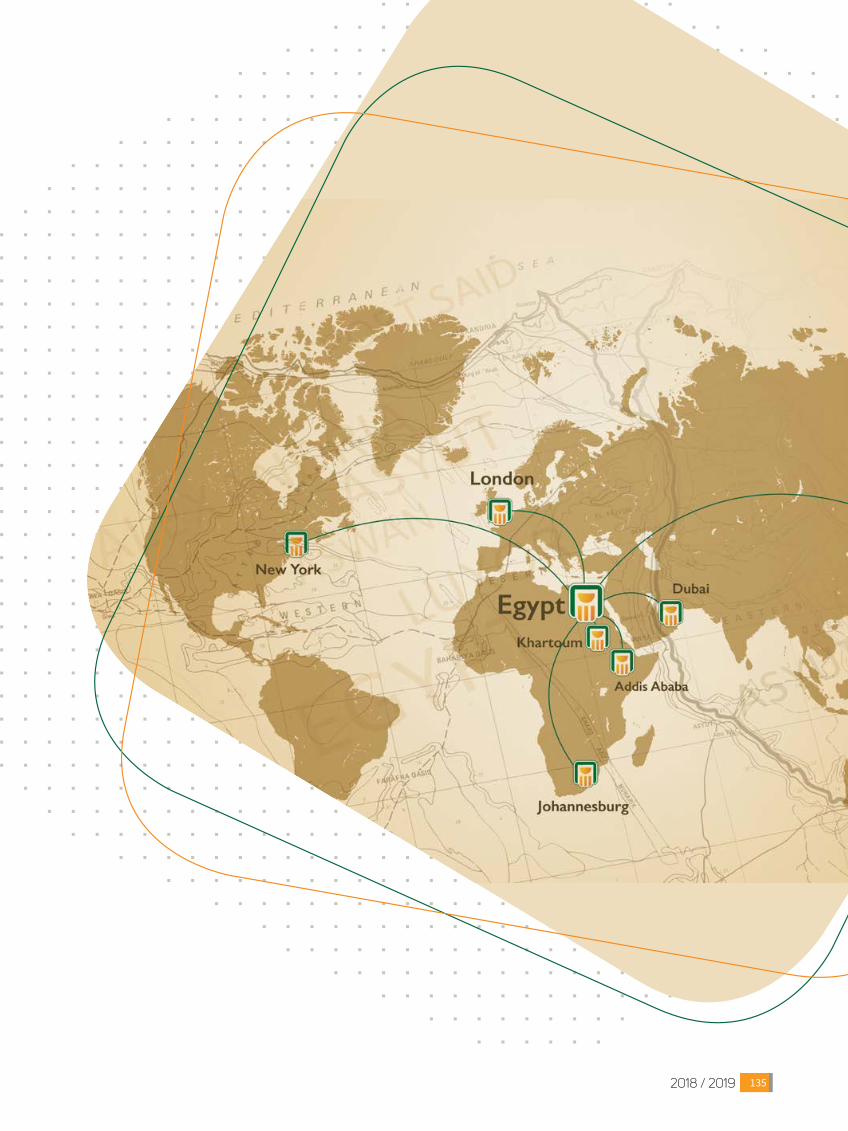
2018 / 20192018 / 2019 135
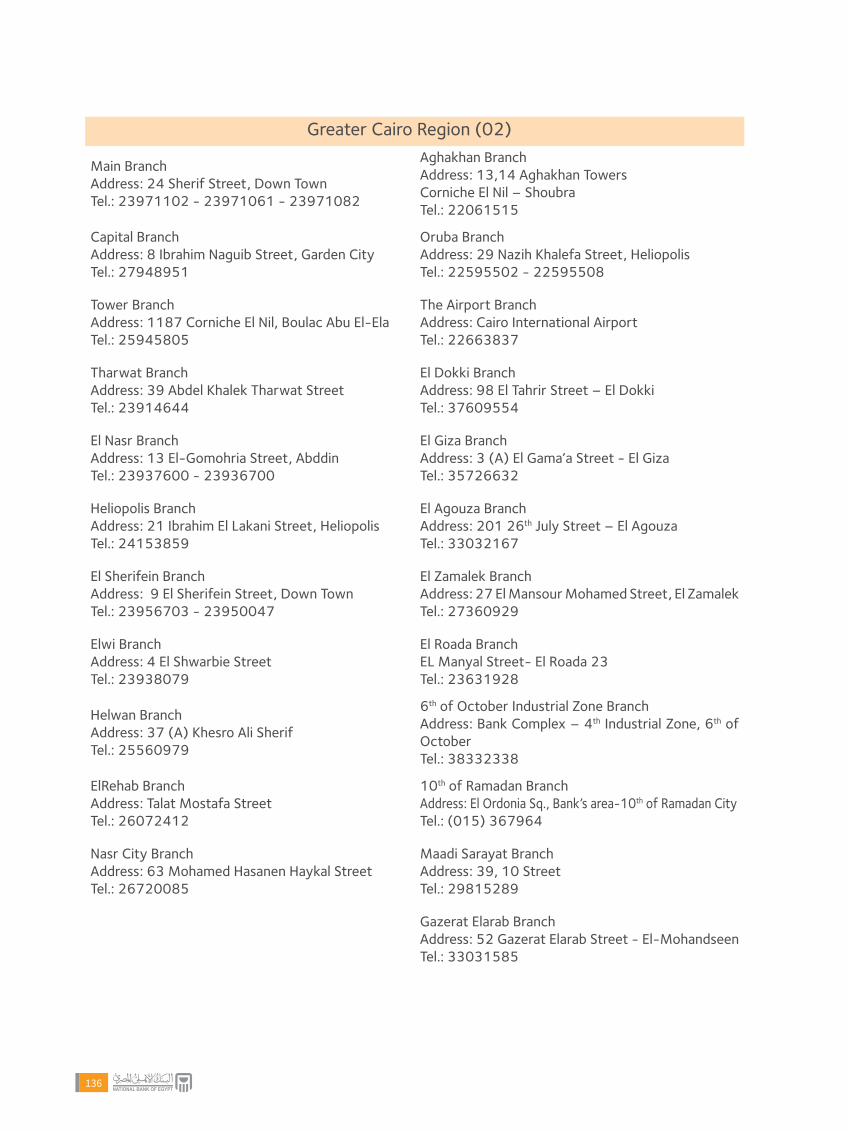
Greater Cairo Region (02)Aghakhan BranchAddress: 13,14 Aghakhan TowersCorniche El Nil – ShoubraTel.: 22061515
Main BranchAddress: 24 Sherif Street, Down TownTel.: 23971102 - 23971061 - 23971082
Oruba BranchAddress: 29 Nazih Khalefa Street, HeliopolisTel.: 22595502 - 22595508
Capital Branch Address: 8 Ibrahim Naguib Street, Garden CityTel.: 27948951
The Airport BranchAddress: Cairo International Airport
Tel.: 22663837
Tower BranchAddress: 1187 Corniche El Nil, Boulac Abu El-Ela Tel.: 25945805
El Dokki BranchAddress: 98 El Tahrir Street – El Dokki
Tel.: 37609554
Tharwat BranchAddress: 39 Abdel Khalek Tharwat StreetTel.: 23914644
El Giza Branch Address: 3 (A) El Gama’a Street - El GizaTel.: 35726632
El Nasr BranchAddress: 13 El-Gomohria Street, AbddinTel.: 23937600 - 23936700
El Agouza Branch Address: 201 26th July Street – El AgouzaTel.: 33032167
Heliopolis BranchAddress: 21 Ibrahim El Lakani Street, Heliopolis Tel.: 24153859
El Zamalek BranchAddress: 27 El Mansour Mohamed Street, El ZamalekTel.: 27360929
El Sherifein BranchAddress: 9 El Sherifein Street, Down Town Tel.: 23956703 - 23950047
El Roada BranchEL Manyal Street- El Roada 23Tel.: 23631928
Elwi Branch Address: 4 El Shwarbie StreetTel.: 23938079
6th of October Industrial Zone Branch Address: Bank Complex – 4th Industrial Zone, 6th ofOctoberTel.: 38332338
Helwan Branch Address: 37 (A) Khesro Ali SherifTel.: 25560979
10th of Ramadan Branch Address: El Ordonia Sq., Bank’s area-10th of Ramadan CityTel.: (015) 367964
ElRehab BranchAddress: Talat Mostafa StreetTel.: 26072412
Maadi Sarayat BranchAddress: 39, 10 StreetTel.: 29815289
Nasr City BranchAddress: 63 Mohamed Hasanen Haykal StreetTel.: 26720085
Gazerat Elarab BranchAddress: 52 Gazerat Elarab Street - El-MohandseenTel.: 33031585
136

Greater Cairo Region (02)
Alexandria BranchAddress: 24, 26 Salah Salem Street, El AttareenTel.: 4852286
Bourg El Arab Branch Address: Banks’ Area - Bourg El Arab CityTel.: 4593459
Mahtet El Raml Branch Address: 15 El Ghorfa El Togariya Street, ConcordTowerTel.: 4878420
Smouha Club Branch Address: Smouha Sporting ClubTel.: 4258300
Damanhour BranchAddress: El Gomhouria Street - DamanhourTel.: 045 / 3312205
Marsa Matrouh Branch Adress: El Galaa StreetTel.: 046/ 4935500
Lower Egypt Region El Mahala El Kobra Branch Address: 6 Moheb StreetTel.: 040 / 2230565 - 040 / 2245127
El Mansoura Branch Address: 167 El Gomhouria Street Tel.: 2262156
Tanta BranchAddress: 2 El Geish StreetTel.: 040 / 3419096
El Zagazig Branch Address: 36 Saad Zaghloul Street – ManshiyetAbaza
Tel.: 055 / 2303084(Shebin El Koum Branch (048Address: 4 El Geish Street Tel.: 048 / 2228247 - 048 / 2224327
Canal, Sinai and Red Sea Region Ismailia BranchAddress: El Tahrir and Khaled Ibn El Walid StreetsTel.: 064 / 3910689 – 3910385
Sharm El Sheikh BranchAddress: Banks Street, Om El Sayed PlateauTel.: 069 / 3662323
Suez BranchAddress: 5 Hafez Ibrahim StreetTel.: 062 / 3335732
El Arish Branch Address: 23rd july street, El-maleh SquareTel.: 068 / 3350676
Port Said Branch Address: 52 El Gomhouria Street Tel.: 066 / 3323629
Hurghada BranchAddress: El Kawthar Neighborhood, Banks ComplexTel.: 065 / 3453011
Demyat BranchAddress: 29 Elbahr StreetTel.: 057 / 2245038
Upper Egypt Region Qena BranchAddress: Haridy StreetTel.: 096 / 5349100
Aswan Branch Address: Corniche El Nil, AswanTel.: 097 / 2325573
Luxor Branch Address: 3 Corniche El Nil Street Tel.: 095 / 2370177
Assiut Branch Address: Tala’t Harab SquareTel.: 088 / 2351500
2018 / 20192018 / 2019 137

NBE’s Presence Worldwide
Arab Republic of Egypt
Head Office1187 Corniche El Nil- CairoP.O.BOX 11611 NBE UN 20069Tel.: 25945000 - Fax: 25945137E-mail: [email protected] page: www.nbe.com.eg
London
National Bank of Egypt (UK) Ltd
Trafalgar House, 11 waterloo Place, London SW1Y 4AU.
Tel.: +(4420) 7389 1200/280 Fax: +(4420) 79308882
Swift: NBEGGB2L
E-mail: [email protected] [email protected]
Home Page: www.nbeuk.com
DubaiNBE (DIFC) Limited
405 Gate Building, Level 4 West Wing,
Dubai International Financial Centre
P.O. Box 506595 | Dubai | U.A.E.
Tel.: +(971) 4 386-8177
E-mail: [email protected]
KhartoumNational Bank of Egypt (Khartoum)
Alamarat.Africa Road & Street NO.49 - KHARTOUM
P.O.BOX 7641 Postal Code 11123
Tel.: + (249) 183 484812 - 183 484822
Swift: NBEKSDKH
E-mail: [email protected]
138

2018 / 20192018 / 2019 139
NBE’s Presence WorldwideNew York
National Bank of Egypt, New York Branch40 East 52nd Street New York, N.Y 10022 U.S.A.Tel.: +(1212) 3268157 - 3268109Fax: +(1212) 3268111 - 4213496E-mail: [email protected] Page: www.nbeny.com
Shanghai
National Bank of Egypt, Shanghai BranchMarine Tower, Room 12 B07 1 Pudong Avenue, Shanghai, 200120,ChinaTel: +(8621) 68861889 Fax: +(8621) 68860864E-mail: [email protected]
Johannesburg
National Bank of Egypt, Rep. Office (Johannesburg), South AfricaOxford Manor, 196 Oxford Road, Illovo 2196 Johannesburg ,P.O. BOX 55402 Northlands 2116 JohannesburgTel.: +(2711) 2680500 - 2680501 Fax: +(2711) 2680502E-mail: [email protected]
Dubai
National Bank of Egypt, Rep. Office (Dubai- U.A.E.) EL Sheikh Zayed Road, Park Place Tower,14th Floor , Unit No. 1401, Dubai. Tel.: +97143266266 Fax: +97143266233E-mail: [email protected]
Addis Ababa
National Bank of Egypt, Rep. Office (Addis Ababa), EthiopiaSub Bole City Kebele 03, Gulf AzizBuilding no.(5-001), Room no. (401), Addis Ababa, Ethiopia. Tel.: (+251) 912 608521 - 116 670242Fax:(+251) 116 670234E-mail: [email protected]

SOCIAL
RESPONSIBILITY
140

2018 / 20192018 / 2019 141

The National Bank of Egypt (NBE) is committed to supporting Egypt’s Vision 2030 and its alignment with the global sustainable development goals (SDGs) according to which development is attained through human efforts. in order to achieve socio-economic development and realize the welfare of Egyptian citizens in all aspects of their daily life, NBE is continuously dedicated to meeting the healthcare, educational, and economic needs of Egyptians, as well as the development of underprivileged areas and slums. The Bank assumes this vital role to have a positive impact on Egyptian society. Thereby, it exerts relentless efforts to directly reach out to targeted beneficiaries to make a significant difference in the lives of Egyptians, as evidenced by the large number of social responsibility projects undertaken by NBE. Being Egypt’s oldest and most instrumental banking institution in serving the national economy, NBE is justifiably the “People’s Bank,” particularly as it is one of the first banking and economic institutions to realize the importance of its role in serving society. NBE’s total contributions over the last five years have exceeded EGP 6 bn, mainly directed to healthcare, education, development of underprivileged areas and slums, and combating poverty. Additionally, the Bank assists people with special needs, promotes culture, protects our heritage, and supports female breadwinners. NBE’s ability to undertake its corporate social responsibility (CSR) role is directly proportionate to its annual profits. As the Bank generated unprecedented profits over recent years, it was thereby able to increase its CSR contributions and eventually took the lead among all Egyptian banking and economic institutions. This is evidenced by NBE’s numerous CSR contributions which exceeded EGP 1.2 bn in FY 2018/2019, most importantly:
Healthcare - EGP 100 mn to Ahl Masr Hospital for the treatment of trauma and burn victims to contribute to building the hospital’s ground floor;
- EGP 50 mn to Baheya Foundation for Early Detection and Treatment of Breast Cancer to contribute to the treatment of patients;
- EGP 30 mn to Ain Shams Specialized University Hospital to upgrade 11 rooms with the capsule technology;
- EGP 36.1 mn to complete equipping Al-Joud Foundation’s Al Nas Children Hospital;
- EGP 10 mn to develop and buy equipment and devices for Students Hospital, Cairo University;
- EGP 6.3 mn to Kasr Al-Ainy Faculty of Medicine, Cairo University, to provide the equipment and devices needed for operating rooms at the Ear, Nose, and Throat (ENT) Department;
- EGP 2 mn to the Egyptian College for Critical Care Physicians to support the national project for cardiac arrest treatment and prevention ;
- EGP 1.9 mn to the Clinical and Chemical Pathology Department at Kasr Al- Ainy Faculty of Medicine;
- EGP 32 mn to contribute to building and equipping Urologic Surgery Hospital, Tanta University;
- EGP 20 mn to Ayadi Al-Mostakbal Oncology Center in Alexandria to contribute to the cost of chemotherapy and purchase a radiotherapy machine;
- EGP 7 mn to the Ministry of Health and Population to contribute to the comprehensive health insurance national project in Port Said;
- EGP 3.5 mn to Urology and Nephrology Center, Mansoura University, to purchase 10 renal dialysis machines, in addition to EGP 5 mn to support diabetic research;
- EGP 39.15 mn to assist Shefaa Al-Orman Hospital in equipping phases 1 & 2 of the hospital;
- EGP 25 mn to Magdi Yacoub Heart Foundation for the treatment and research of cardiovascular diseases to fund children’s heart surgeries and organize a charity marathon to support the Foundation;
- EGP 16.65 mn to Faculty of Medicine, Sohag University, to develop and equip the cardiothoracic surgery division;
- EGP 12 mn to purchase equipment for Oncology Hospital, Assiut University; and
- EGP 6 mn for the treatment of hepatitis C virus (HCV) patients by donating to NBE’s charity association in cooperation with Misr El Kheir Foundation.
Education - EGP 100 mn to the Ministry of Higher Education and Scientific Research to grant scholarships to postgraduate students to study abroad;
- EGP 100 mn to the Ministry of Planning, Monitoring, and Administrative Reform to contribute to the Ministry’s activities;
- EGP 15 mn to Zewail City of Science and Technology to offer 80 scholarships to students across Egypt who cannot afford the tuition fees and to upgrade the City’s playing fields;
An enduring commitment to enhance Egyptian livesNBE’s corporate social responsibility role in the last five years
142

- EGP 10.29 mn to Qualifications Development Bank (QDB) to offer vocational training to 700 trainees;
- EGP 5 mn to the Academy of Arts to develop and convert its outer walls into a book market similar to Soor El-Azbakeya (El-Azbakeya Wall) book market;
- EGP 4 mn to the Arab Academy for Science Technology and Maritime Transport (AASTMT) to support its Rally Vol. 3; and
- EGP 2 mn to participate in the first pilot model of the industrial apprenticeship system at the Vocational Training Center (VTC) (in Asmarat) at the first pilot model operating project.
Combating poverty - EGP 151.2 mn to develop four of Egypt’s most underprivileged villages through Misr El Kheir Foundation;
- EGP 150 mn to the Central Military Region to complete phase 2 of the project “Ahalina 2”;
- EGP 20 mn to the fund established to honor martyrs, victims, and those injured or reported missing as a result of military, terrorist, or security operations;
- EGP 2 mn to help women in Sinai and Bir Al Abd through Misr El Kheir Foundation;
- EGP 50 mn to continue to develop Bashayer El Kheir 2 project in Gheit El Enab area in Alexandria through the North Military Region;
- EGP 50 mn to contribute to establishing the youth housing project (Suez houses) through the Third Field Army in Suez;
- EGP 25 mn to Dar Al-Orman Association to reconstruct the homes of the most disadvantaged families as part of “Support a Poor Village Project”;
- EGP 18 mn to pay off the debts of Gharemeen (low-income individuals imprisoned over small debts) in cooperation with Misr El Kheir Foundation through NBE’s charity association;
- EGP 5 mn to distribute Ramadan food packs to the most impoverished areas across all governorates as part of “For Our Country Egypt” campaign; and
- EGP 3.23 mn to provide insurance under the Egyptian Certificate Aman to 1,291 breadwinners through Dar Al-Orman Association.
NBE’s role in supporting people with special needs
- EGP 10 mn to Alhassan Foundation for Differently Abled Inclusion to purchase customized wheelchairs for people with physical disabilities; and
- EGP 5.1 mn to the Egyptian Advance Society for Persons with Autism and Other Disabilities (ADVANCE) to cover the expenses of students in need and to support a project for training, rehabilitating, and employing disabled and autistic youth.
Other - EGP 50 mn to support Tahya Misr Fund;
- EGP 50 mn to promote the World Youth Forum;
- EGP 6 mn to contribute to implementing the Khedivial Cairo restoration project; and
- EGP 5 mn to develop key basic infrastructure services in Aswan governorate.
NBE’s contributions to healthcare reached EGP 1.8 bn. These contributions were mainly directed to developing and equipping a large number of public, university, and teaching hospitals and institutes and specialized medical centers across different governorates (such as Kasr Al-Ainy Hospital – Cairo University, Ain Shams University Hospital, Students Hospital – Cairo University, Sohag University Hospital, Banha University Hospital, Mansoura University Hospital, Assiut University Hospital, Tanta University Hospital, etc.). Intensive care units (ICUs) and operating rooms needed for the hospitals were provided. Diagnostic and treatment devices were purchased and delivered to be used by professionals who were well trained under the supervision of the NBE Community Support Programs Committee. This ensures the consistent and proper operation and maintenance of such devices, especially as they are used to serve citizens free of charge. Such contributions are offered to alleviate the burden of patients, especially low-income individuals, and to guarantee that they receive appropriate top-notch medical services.
2018 / 20192018 / 2019 143

Ahl Masr Foundation for Development is the first non-profit developmental foundation dedicated to preventing and treating trauma and burns. It aims to make a radical change in the concept of charity, volunteering, and healthcare in Egypt. An amount of EGP 100 mn was contributed to building the hospital’s ground floor (comprising emergency room, laboratories, outpatient clinics, radiology rooms, a pharmacy, a cafeteria, a helicopter landing pad, etc.).
Ahl Masr Hospitalfor the treatment of trauma and burns
144

In view of the significant nationwide role played by the Baheya Foundation in the treatment of breast cancer patients for free, a donation of EGP 50 mn was made to the Foundation to contribute to the treatment of patients and offer them efficient and swift services.
Baheya Foundationfor Early Detection and Treatment of Breast Cancer
2018 / 20192018 / 2019 145

One of the largest hospitals in the country, Ain Shams Specialized Hospital has 800 beds and 15 operating rooms. It serves nearly one mn patients every year in all specializations for a small fee. An amount of EGP 30 mn was donated to the hospital for state-of-the-art upgrading and furnishing of five operating rooms with the capsule technology to provide efficient services to its patients.
Ain ShamsSpecialized University Hospital
146

Al-Joud Foundation, a charity, non-profit and non-governmental organization, owns and operates Al Nas Children Hospital in Shobra El-Kheima, which is located in a central position to five main governorates: Cairo, Giza, Dakahlia, Qalyubia, and Menoufia. A donation of EGP 36.1 mn was made to purchase equipment for the cardiac catheterization unit, post-cardiac catheterization intensive care unit, and the children’s open heart surgery operating room.
Al-Joud Foundation’sAl Nas Children Hospital
2018 / 20192018 / 2019 147

NBE donated EGP 10 mn to develop the Students Hospital – Cairo University and buy endoscopes, ultrasound (sonar) devices, intensive care equipment, and an audiometer in order to enhance the hospital’s services.
Students Hospital Cairo University
148

NBE contributed EGP 6.3 mn to the Ear, Nose, and Throat (ENT) Department at Kasr Al-Ainy Faculty of Medicine to buy equipment and devices needed in the operating room. These include an instrument for aural polyps removal, an instrument for nose and paranasal sinuses removal, a stereotactic device for skull base surgeries, a device for measuring the seventh cranial nerve activity, a full unit for endoscopy of ear and nose, as well as some other equipment.
Kasr Al-Ainy Faculty of MedicineENT Department
2018 / 20192018 / 2019 149

NBE donated EGP 1.898 MM. to the Clinical and Chemical Pathology Department at Kasr Al-Ainy Faculty of Medicine to purchase an image analysis device to serve patients free of charge at Cairo University hospitals, receive a larger number of patients and mitigate months-long waiting time which can be life threatening especially for cancer patients, as the device helps in early detection.
Kasr Al-Ainy Faculty of Medicine the Clinical and Chemical Pathology Department
150

NBE donated EGP 2 mn to the Egyptian College for Critical Care Physicians to contribute to the “Save Your Life” project, which benefits nearly 33,000 citizens through medical convoys that select potential cardiac arrest victims. This encompasses carrying out a clinical examination, an electrocardiogram (ECG), and lab tests. The project was executed in three governorates: Menoufia, Port Said, and Beni Sueif.
The Egyptian Collegefor Critical Care Physicians
Kasr Al-Ainy Faculty of Medicine the Clinical and Chemical Pathology Department
2018 / 20192018 / 2019 151

Tanta University hospitals are among the large hospitals that serve the Delta region and adjacent areas. Its hospitals are committed to offering free medical and healthcare services to their patients. A donation of EGP 32 mn was made to contribute to building and equipping a cutting-edge urologic surgery hospital. It will include eight capsules for the operating room, and endoscopes to serve more than 18 mn Egyptians in the Delta region and adjacent governorates.
The Urologic Surgery Hospital Tanta University
152

Ayadi Al-Mostakbal Oncology Center offers its services free-of-charge to nearly 800 patients of all ages on a daily basis. It provides treatment to patients in Alexandria, Marsa Matrouh, and Beheira governorates. An amount of EGP 20 mn was donated to supply, install, and operate a radiotherapy machine and contribute to the cost of chemotherapy.
Ayadi Al-MostakbalOncology Center in Alexandria
2018 / 20192018 / 2019 153

NBE donated EGP 7 mn to the Ministry of Health and Population to contribute to the national comprehensive health insurance project in Port Said hospitals to purchase the equipment needed in outpatient clinics, laboratories, the furnishing required for accommodation, as well as a clinic paging system.
The Ministry of Healthand Population
154

Mansoura’s Urology and Nephrology Center is one of the leading and largest scientific and medical hubs in the Middle East, specializing in artificial kidneys, kidney transplantation, and urologic cancer surgeries. The center offers its services free-of-charge to patients with renal failure, urologic diseases, cancer, and congenital disabilities. An amount of EGP 3 mn was donated to purchase 10 renal dialysis machines for the center. An additional amount of EGP 500,000 was given to the center to assist in the research of using stem cells in the treatment of diabetes.
Mansoura’s Urologyand Nephrology Center
2018 / 20192018 / 2019 155

NBE donated EGP 39.15 mn to Shefaa Al-Orman Hospital in Luxor for the purchase of equipment needed to finish phases one and two. This will enable the hospital to offer top-notch integrated medical services (including a blood bank, cell and gene therapy unit, etc.) to save the lives of thousands of patients in Upper Egypt, and alleviate their burden by providing the best possible medical services free-of-charge.
Shefaa Al-Orman Hospital in Luxor
156

Magdi Yacoub Heart Foundation helps save thousands of heart patients for free. Cardiovascular diseases cause the death of mn of patients every year. The Foundation was created to meet the urgent need for free treatment to serve Egyptians and offer first-class healthcare according to the highest medical global standards. An amount of EGP 20 mn was donated to carry out 200 children’s heart surgeries. An additional EGP 5 mn was generated by organizing a marathon for NBE’s staff for the benefit of the Foundation.
Magdi YacoubHeart Foundation
2018 / 20192018 / 2019 157

Sohag is one of Egypt’s poorest governorates. With a population of more than five mn, Sohag is home to villages that were locally and globally classified as among Egypt’s most impoverished. In light of the scarcity of specialized medical centers in the governorate, families were forced to travel outside their area to seek medical treatment. NBE donated EGP 16.651 mn to Sohag University Hospital to develop the cardiothoracic department and end waiting lists.
The cardiothoracic surgery department at the Faculty of Medicine, Sohag University
158

The Oncology Hospital at Assiut University receives thousands of patients every month due to the widescale prevalence of the disease. In order to assist the hospital in offering its services to patients efficiently, a total amount of EGP 12 mn was donated to purchase two devices that will help determine the radiation therapy dosage and limit radiation to sensitive organs that are directly adjacent to the tumors, which may otherwise cause severe damage to the body’s vital functions.
Oncology Hospital Assiut University
The cardiothoracic surgery department at the Faculty of Medicine, Sohag University
2018 / 20192018 / 2019 159

NBE donated EGP 6 mn to contribute to the treatment of HCV patients through the mechanism agreed upon with the Misr El Kheir Foundation.
NBE’s charity associationcombating hepatitis C virus (HCV)
160

Education is the cornerstone of human development. It creates an environment conducive to people being capable of building and developing their countries. This is achievable by enhancing education elements to prepare generations that are scientifically and ethically qualified and able to shoulder these responsibilities in the future. NBE has given support to various universities, including Benha University, Mansoura University, and the Arab Academy for Science Technology & Maritime Transport (AASTMT). This is in addition to enhancing several public schools in many governorates, in terms of both buildings and facilities, as well as HR. A protocol has been signed with the Ministry of Higher Education and Scientific Research to arrange overseas scholarships for Egyptian students and scholars in a variety of educational and scientific research fields. The protocol is intended to develop human resources competencies using state-of-the-art educational and scientific systems in tandem with high technology, to ultimately produce high-caliber scientific cadres contributing positive and sustainable input to the whole society. Another protocol was concluded with the Ministry of Planning, Monitoring, and Administrative Reform, to leverage the efficiency of government administrative bodies and establish a nanotechnology center at Zewail City for Science and Technology.
NBE, the largest supporterof education with total contributions of EGP 950 mn
2018 / 20192018 / 2019 161

NBE donated EGP 100 mn to the Ministry of Higher Education and Scientific Research to arrange overseas scholarships for high-achieving postgraduate students and scholars. Candidates are selected from all over Egypt, according to specific criteria set by a specialized committee to choose the best of the best.
Ministry of Higher Educationand Scientific Research
162
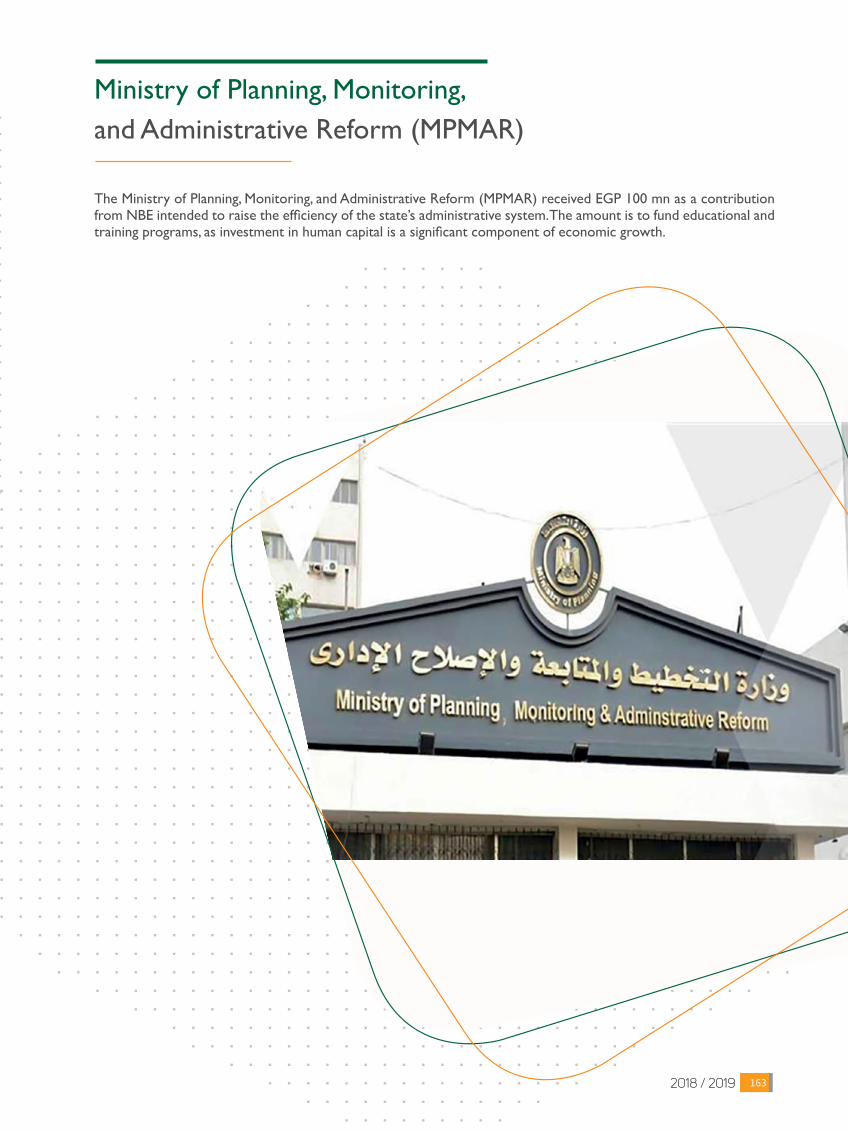
The Ministry of Planning, Monitoring, and Administrative Reform (MPMAR) received EGP 100 mn as a contribution from NBE intended to raise the efficiency of the state’s administrative system. The amount is to fund educational and training programs, as investment in human capital is a significant component of economic growth.
Ministry of Planning, Monitoring,and Administrative Reform (MPMAR)
2018 / 20192018 / 2019 163

NBE provided assistance to Zewail City for Science and Technology, with the aim to provide quality education to talented students who cannot afford the tuition fees. The donated sum amounted to EGP 10 mn, covering 80 scholarships for students from all over the country. Moreover, EGP 5 mn was made available to upgrade the playing fields and utilize the vast vacant spaces allocated for planting fructiferous trees, in order to generate additional income for Zewail City and enrich scientific research. The areas will be used as a testing ground for research work on fertilizers and irrigation techniques.
Zewail Cityfor Science and Technology
164

Qualifications Development Bank (QDB) contributes to raising the level of vocational training in Egypt in terms of skills, competencies, and meeting of international training standards. A donation of EGP 10,291 mn was given to QDB to provide 700 trainees with advanced vocational training programs. The donation was also directed to allocate a fund as a seed for furnishing top graduates with tools and equipment bags that help them start a freelance business or apply for jobs.
QualificationsDevelopment Bank (QDB)
2018 / 20192018 / 2019 165

In collaboration with the Academy of Arts, NBE linked the Academy services to the surrounding areas to lift the cultural level of their residents, providing those residents and the Academy students with its cultural services. A donation totaling EGP 5 mn was made to contribute to developing and transforming the Academy fence in front of the main gate into a book market similar to the El-Azbakeya Fence book market.
Academyof Arts
166

The Entrepreneurship Center of Arab Academy for Science, Technology, and Maritime Transport (AASTMT) is a center for youth development specializing in entrepreneurship and innovation. The center aims to build a generation of young entrepreneurs and positively impact the Egyptian and Arab economies by encouraging innovative initiatives and private business functioning throughout all colleges and premises of the Academy. The Entrepreneurship Rally is one of the largest entrepreneurial competitions in Egypt, as it is a pioneering program in organizing enterprises. Accordingly, an amount of EGP 4 mn was donated to support the center’s Rally Vol. 3.
Arab Academy for Science, Technology and Maritime Transport (AASTMT)
2018 / 20192018 / 2019 167

NBE donated EGP 4 mn to participate in a pilot model of an apprenticeship system based on productive applied training, at the Vocational Training Center (VTC), Asmarat area, affiliated to the Productivity and Vocational Training Department (PVTD) (public sector). The donation came as part of the three-year operating plan, in cooperation with Bishara Textile and Garment Manufacturing Co. (BTM) (private sector).
Project to operate a pilot apprenticeship systemat the Vocational Training Center (Asmarat area)
168

Project to operate a pilot apprenticeship systemat the Vocational Training Center (Asmarat area)
Broadening its perspective, NBE aims to establish integrated housing communities that encompass everything any family may need. These include health and sports services and schooling, such as the Bashayer El-Kheir 1 & 2 project in Alexandria, and the Ahalina project at El Salam district in Cairo. NBE also targets the development of the neediest villages nationwide. Such support will promote society, grease the wheels of progress, and create a favorable environment by providing houses, clean water, and suitable job opportunities. These are the prerequisites of a decent life for Egyptians. Accordingly, there is a need for a roadmap for the development of underprivileged areas and slums, which may pose a hazard to the potential progress of the whole society. It is currently necessary to replace these areas with residential zones containing all services for the citizens who deserve to lead a safe and peaceful life, helping them face everyday hardships.
NBE’s contributions to the development of unplanned slums exceeded EGP 3 bn, including:
Fighting poverty is not merely a matter of building houses
2018 / 20192018 / 2019 169

The strategic partnership between NBE and the Misr El-Kheir Foundation (MEK) had the most significant impact on the inhabitants of underdeveloped villages, whose lives have changed for the better. Under NBE-MEK Protocol, the second phase of developing four communities, totaling EGP 151.19 mn, is underway in Minya Governorate (two villages: Dafsh and Astall), Ismailia Governorate (Al Manayef), and Menofia Governorate (Zawyat Razin). Developments cover education, health care, social solidarity, and activities to improve standards of living. They also encompass NBE’s pioneering initiatives to support livestock breeding in poor villages.
Developingfour neediest villages via MEK
170

NBE made donations of EGP 150 mn to the Central Military Region to complete the second phase of the Ahalina 2 project. A population of nearly 10,000 people will benefit from the project, which encompasses a mosque, a nursery, a post office, a medical center, an elementary education school, an administrative service area, two commercial service areas, as well as a service area and another school.
Ahalina project: El Salam First district
2018 / 20192018 / 2019 171

Given the fund’s significant role, which requires assistance to deliver its mission to casualties of war and terrorist operation and victims’ families, NBE made a donation of EGP 20 mn to the fund to offer all services of care and support in all aspects of life.
The fund for honoring martyrs, victims, missing persons, and casualties of war, terrorist, and security operations, and their families
172

The fund for honoring martyrs, victims, missing persons, and casualties of war, terrorist, and security operations, and their families
The Northern Military Region, Alexandria, started to implement the second phase of the project to continue the development of the Gheit El Enab area. NBE directed EGP 50 mn funding to continue carrying out some additional works of the Bashayer El Kheir 2 project, comprising 2,000 housing units with retail stores under the blocks of flats and parking areas.
The development of Bashayer El Kheir 2 projectat Gheit El Enab, Alexandria, by the Northern Military Region
2018 / 20192018 / 2019 173
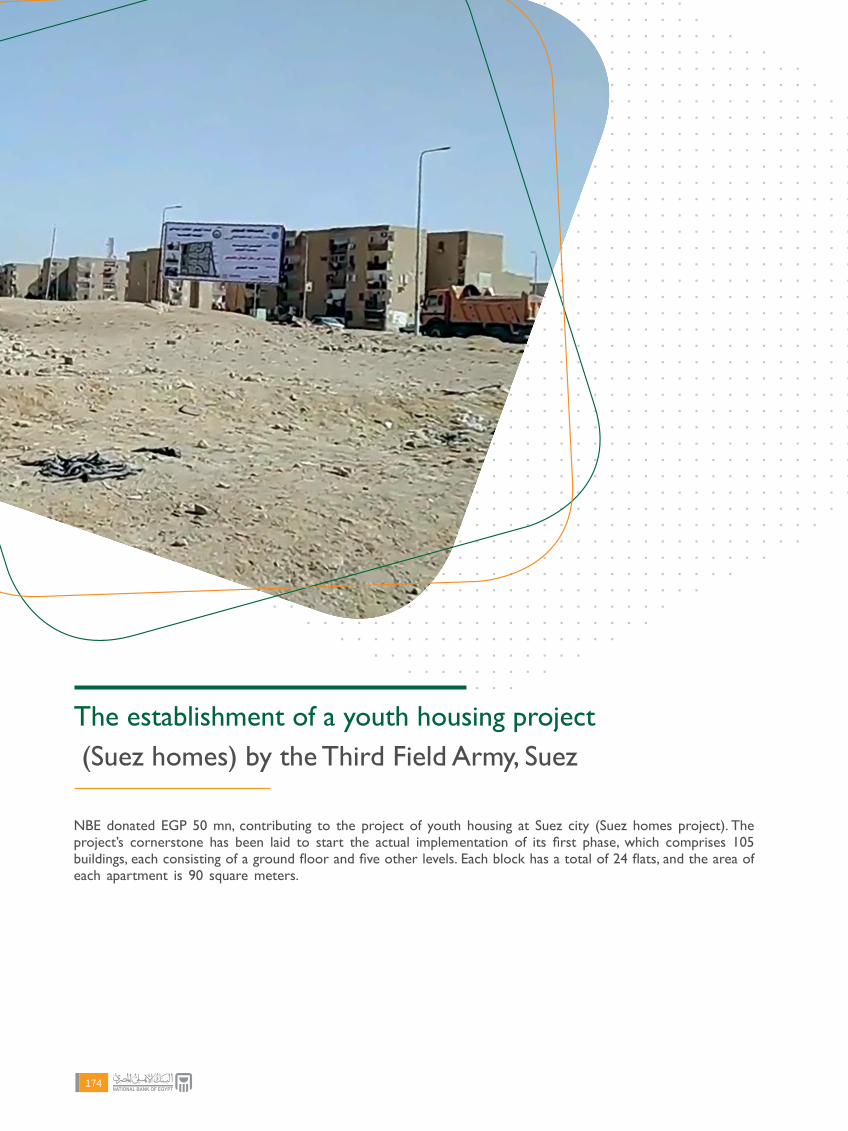
NBE donated EGP 50 mn, contributing to the project of youth housing at Suez city (Suez homes project). The project’s cornerstone has been laid to start the actual implementation of its first phase, which comprises 105 buildings, each consisting of a ground floor and five other levels. Each block has a total of 24 flats, and the area of each apartment is 90 square meters.
The establishment of a youth housing project (Suez homes) by the Third Field Army, Suez
174

NBE gave a donation of EGP 2 mn to Sinai and Bir Al Abd women through MEK. The donation was made to finance the Bir Al Abd projects that extend to include various Bedouin handicrafts, to assist and help women, and to add value to society. To this end, the products made by 2,000 ladies were distributed to NBE staff on Mother’s Day.
MEKBir Al Abd
2018 / 20192018 / 2019 175

NBE cooperated with the Al Orman Association in implementing the Support a Poor Village project to reconstruct the houses of the neediest households, through a grant of EGP 25 mn. Home repairs included the following interventions: roofing, plastering, ceramic tile flooring, plumbing, power supplying, painting, installing doors and windows, furnishing, etc.
Al Orman Association Support a Poor Village projectto reconstruct the houses of the neediest families
176

Al Orman Association Support a Poor Village projectto reconstruct the houses of the neediest families
NBE donated EGP 3,227,500 for the Al Orman Association to issue Aman Insurance Certificates to 1,291 breadwinners in Qena and Assiut governorates. The Certificates are issued through NBE branches.
Al OrmanAssociation
2018 / 20192018 / 2019 177

In light of the initiative of the NBE charity association to pay off the debts of Gharmeen/Gharmat (low-income men/women imprisoned over small debts), NBE donated EGP 18 mn to pay off the debts of Gharmeen/Gharmat. The donation is granted through a particular mechanism adopted in collaboration with MEK to ensure that both Gharmeen and Gharmat across Egypt benefit from the donation indiscriminately.
NBE charity association“Gharmeen” debt repayment
178

NBE is dedicated to alleviate some of the burdens of the residents of the neediest areas across Egypt. Consequently, NBE gave an EGP 5 mn donation to distribute food packs to the most needy regions under said campaign during the holy month of Ramadan.
For our CountryEgypt campaign
2018 / 20192018 / 2019 179

NBE pays great attention to people with disabilities, as they form an integral part of society. NBE helps them integrate into society by providing assistance that facilitates their everyday lives and increases their self-independence. Such attention was embodied in NBE’s initiative to support the organizations that aim at integrating people with special needs into society as follows:
NBE’s initiative to support people with special needs
180

Advance is a non-governmental organization (NGO) that was founded by the families of people with autism and other similar developmental disorders. These volunteers aim to secure their children’s future by providing them with integrated care, including treatment, education, and training, to enhance their self-independence and inclusion in society. A donation of EGP 5.045 mn was directed to cover the tuition fees of low-income students and support a project for training, rehabilitating, and employing young people with disabilities or autism.
Egyptian Advance Societyfor Persons with Autism and Other Disabilities (Advance)
2018 / 20192018 / 2019 181

The Foundation provides customized wheelchairs to physically disabled people to be rehabilitated along with their families to overcome the challenges they encounter. The customized wheelchairs, designed according to each case’s size and type of injury, allow each one to make use of their abilities, add value to society, and become active members. NBE made an EGP 10 mn donation for the purpose of assisting physically disabled people move with ease.
Alhassan Foundationfor Differently Abled Inclusion
182
نتشارك
¥hóæ°U
037037
In light of NBE’s role to promote national economy and in continuation of supporting Long Live Fund’s current and future initiatives and projects, NBE donated EGP 50 mn to the Fund.
Long Live Egypt(Tahya Misr) Fund
2018 / 20192018 / 2019 183

Emphasizing the crucial role of young people in shaping our country’s future, NBE supported the World Youth Forum with an amount of EGP 50 mn.
World YouthForum
184

NBE provided EGP 6 mn in support of the Cairo governorate to contribute to implementing the Khedivial Cairo development project.
Cairo governorateKhedivial Cairo development
2018 / 20192018 / 2019 185

Given the significance of developing Aswan’s public squares, NBE cooperated with Aswan governorate to qualify to receive numerous numbers of tourists by providing a total amount of EGP 5 mn dedicated to the development of the governorate’s vital infrastructure.
Aswan Governorate
186

2018 / 20192018 / 2019 187


Annual Report1187 Corniche El Nil - Cairo
Tel.: 25945000 - Fax: 25945137www.nbe.com.eg