117Cover - RFID Lab
32
INFORMATION TECHNOLOGY RESEARCH INSTITUTE WORKING PAPER SERIES University of Arkansas Fayetteville, Arkansas 72701 http://itri.uark.edu Note: distribution in any form (electronic, hardcopy, other) is strictly prohibited. An electronic copy of the paper may be downloaded legally at http://itri.uark.edu ITRI-WP117-0808 RFID As Electronic Article Surveillance (EAS): Feasibility Assessment Issued: 08.08.2008
Transcript of 117Cover - RFID Lab
INFORMATION TECHNOLOGY RESEARCH INSTITUTE
WORKING PAPER SERIES
University of Arkansas Fayetteville, Arkansas 72701
http://itri.uark.edu
Note: distribution in any form (electronic, hardcopy, other) is strictly prohibited. An electronic copy of the paper may be downloaded legally at http://itri.uark.edu
ITRI-WP117-0808
RFID As Electronic Article Surveillance (EAS): Feasibility Assessment
Issued:
08.08.2008
The World’s Leading Source for the Supply Chain Profession.
RFID As Electronic Article Surveillance (EAS):
Feasibility Assessment
Justin Patton and Bill C. HardgraveInformation Technology Research InstituteSam M. Walton College of BusinessUniversity of Arkansas
VOLUNTARY INTERINDUSTRYC O M M E R C E S O L U T I O N SInformation Technology Research Institute

Aknowledgements
Sponsors This research would not be possible without the financial support of:
• Council of Supply Chain Management Professionals (CSCMP) • Voluntary Interindustry Commerce Solutions (VICS) Association • Dillard’s • Procter & Gamble
We appreciate and applaud these companies for sponsoring research that benefits retailing, supply chain, and manufacturing. As industry associations, CSCMP and VICS are taking leadership roles in investigating the transformational use and benefits of RFID for their members and the industry at large. We also acknowledge the very valuable contributions of Sensormatic and Checkpoint for their equipment and domain expertise.
Authors Justin Patton and Bill C. Hardgrave Information Technology Research Institute Sam M. Walton College of Business University of Arkansas

Table of Contents Executive Summary 1 Overview 2 Electronic Article Surveillance (EAS) 2 Radio Frequency EAS 2 Acousto-Magnetic EAS 3 Ultra-High Frequency EAS 4 Baseline Scenarios 6 Results of Baseline Scenario I: One Tagged Item Along Six Paths 8
Results Summary—Baseline Scenario I 10 Results of Baseline Scenario II: One Tag At Three Orientations and Six Paths 10
Results Summary—Baseline Scenario II 12
Results of Baseline Scenario III: One Tagged Shoebox 13 Results Summary—Baseline Scenario III 14
Results of Baseline Scenario IV: Fifty Tagged Items in a Shopping Bag Along Six Paths 14
Results Summary—Baseline Scenario IV 17
Summary and Discussion—Baseline Scenarios 17
Shoplifting Scenarios 18 Results of Shoplifting Scenario I: Fifty Items in a Booster Bag 19
Results of Shoplifting Scenario II—One Tagged Shoe, Worn 20 Results of Shoplifting Scenario III—One Tagged Shirt, Worn 21 Results of Shoplifting Scenario IV: One Tagged Item Under Hat 22 Results of Shoplifting Scenario V: Ten Tagged Items, Running Through Portal 22 Results of Shoplifting Scenario VI: One Tagged Item Held Close To Body 23 Results of Shoplifting Scenario VII: One Tagged Item in a Bag of Untagged Clothes 24 Summary and Discussion—Shoplifting Scenarios 25
Summary—Testing Results 26 List of Figures
Figure 1: Perimeter EAS Equipped Store Layout 2 Figure 2: Paths through Read Field (All Systems) 6 Figure 3: RF-EAS and RFID Tag Orientations 7 Figure 4: AM Tag Orientations 8
List of Graphs Graph 1: Baseline Scenario I—Performance by System 8 Graph 2: Baseline Scenario I—Performance by Lane 9 Graph 3: Baseline Scenario I—Performance by Height 10 Graph 4: Baseline Scenario II—Performance by System 11 Graph 5: Baseline Scenario II—Performance by Lane 11 Graph 6: Baseline Scenario II—Performance by Height 12 Graph 7: Baseline Scenario II—Performance by Orientation 13 Graph 8: Baseline Scenario III—Performance by System 14 Graph 9: Baseline Scenario IV—Performance by System 15 Graph 10: Baseline Scenario IV—Performance by Lane 16 Graph 11: Baseline Scenario IV—Performance by Height 17 Graph 12: Shoplifting Scenario I—Performance by System 20 Graph 13: Shoplifting Scenario II—Performance by System 21 Graph 14: Shoplifting Scenario III—Performance by System 21 Graph 15: Shoplifting Scenario IV—Performance by System 22 Graph 16: Shoplifting Scenario V—Performance by System 23 Graph 17: Shoplifting Scenario VI—Performance by System 24 Graph 18: Shoplifting Scenario VII—Performance by System 24
List of Photographs Photograph 1: RF-EAS Hard Tag 3 Photograph 2: RF-EAS Label Tag 3 Photograph 3: RF-EAS Portal 3 Photograph 4: AM Label Tag 3 Photograph 5: AM Hard Tag 3 Photograph 6: AM Portal 4 Photograph 7: RFID Item Level Tag 4 Photograph 8: RFID Standard Footprint Tag 4 Photograph 9: UHF RFID Portal 5 Photograph 10: Tagged Shoebox used in Baseline Scenario 3 13 Photograph 11: Standard Shopping Bag with 50 Items 14 Photograph 12: Booster Bag with 50 Items 19

1
EXECUTIVE SUMMARY The purpose of this study with participation from the Council of Supply Chain Management Professionals (CSCMP), the Voluntary Interindustry Commerce Solutions (VICS) Association, Dillard’s, and Procter & Gamble, was to determine the feasibility of Class 1 Generation 2 UHF RFID as a potential sales floor level theft deterrent system. To fully comprehend this feasibility, the technical performance capabilities of standard UHF RFID tags and readers were compared to two common existing electronic article surveillance (EAS) technologies—acousto-magnetic (AM) and radio frequency electronic article surveillance (RF-EAS)—at an exit door portal to provide a reference. A variety of baseline tests were performed on all the technologies, and then a series of shoplifting scenarios were investigated. The baseline tests were designed to provide some controlled feedback on the general functionality of the respective technologies; the shoplifting scenarios provided insight into the technologies’ uses in a realistic, albeit simulated, environment (but were not designed to necessarily defeat the technologies). Overall, RFID performed satisfactorily in the baseline and shoplifting scenarios—enough to warrant further investigation of RFID as a theft deterrent system. This report details the baseline tests, shoplifting scenarios, and results. We caution the reader to remember that the purpose of this study is to investigate the feasibility of UHF RFID as an EAS system—it is not a study to compare the two leading forms of EAS to each other, or to compare existing technologies to UHF RFID. No attempt was made to find optimal system performance (UHF RFID, RF-EAS, or AM). Existing EAS technologies were used merely to provide a reference level of current system performance with which to best judge the unique strengths and weaknesses of UHF RFID. The testing design and execution of the common baseline tests and shoplifting scenarios were focused solely on providing insight into the practical performance of UHF RFID as a perimeter EAS system.
2
OVERVIEW
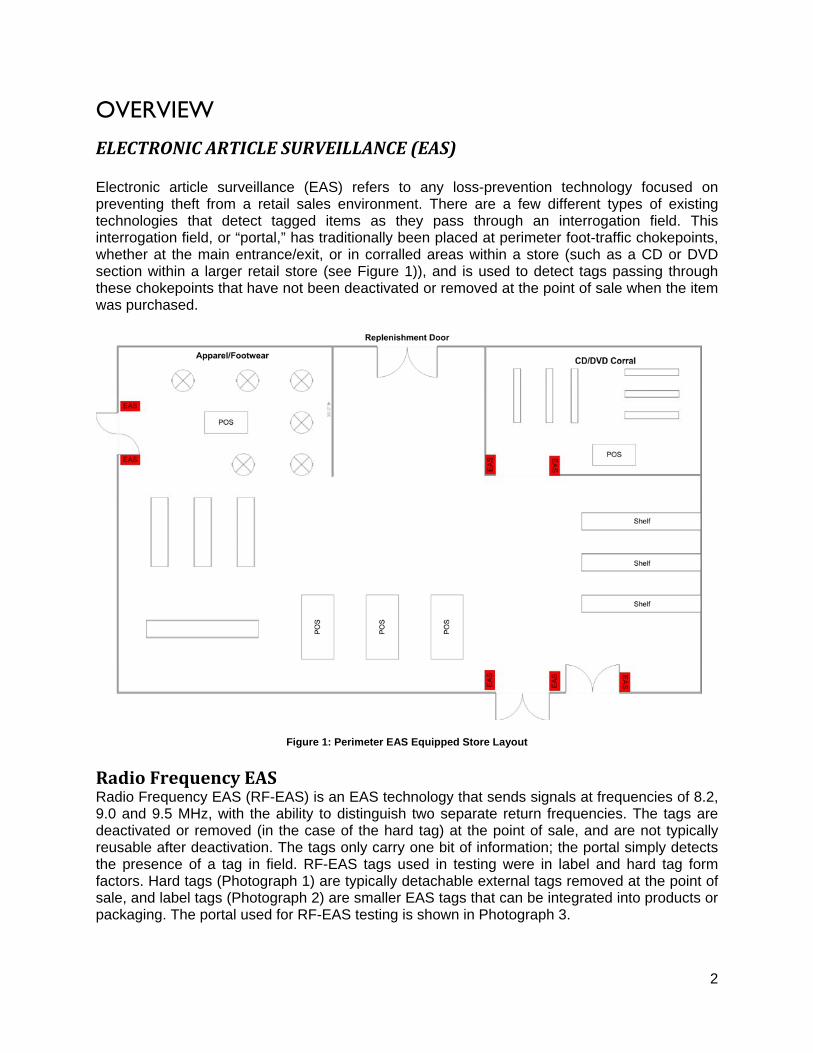
ELECTRONIC ARTICLE SURVEILLANCE (EAS) Electronic article surveillance (EAS) refers to any loss-prevention technology focused on preventing theft from a retail sales environment. There are a few different types of existing technologies that detect tagged items as they pass through an interrogation field. This interrogation field, or “portal,” has traditionally been placed at perimeter foot-traffic chokepoints, whether at the main entrance/exit, or in corralled areas within a store (such as a CD or DVD section within a larger retail store (see Figure 1)), and is used to detect tags passing through these chokepoints that have not been deactivated or removed at the point of sale when the item was purchased.
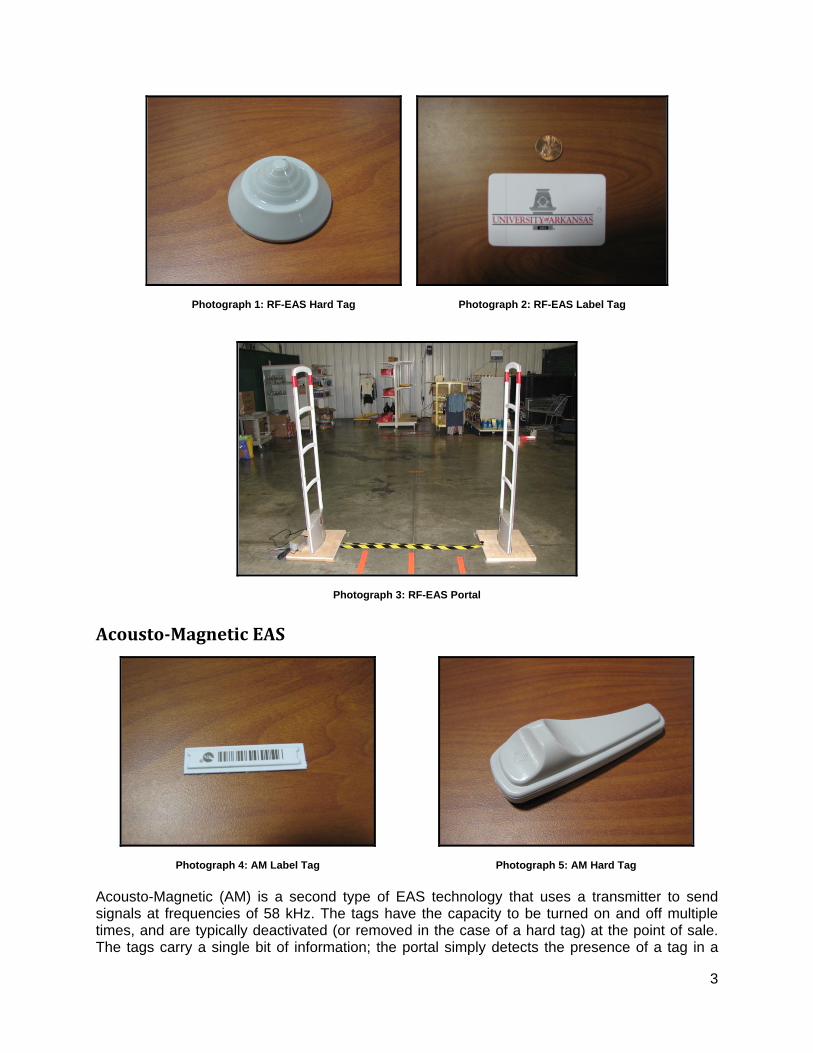
Figure 1: Perimeter EAS Equipped Store Layout Radio Frequency EAS Radio Frequency EAS (RF-EAS) is an EAS technology that sends signals at frequencies of 8.2, 9.0 and 9.5 MHz, with the ability to distinguish two separate return frequencies. The tags are deactivated or removed (in the case of the hard tag) at the point of sale, and are not typically reusable after deactivation. The tags only carry one bit of information; the portal simply detects the presence of a tag in field. RF-EAS tags used in testing were in label and hard tag form factors. Hard tags (Photograph 1) are typically detachable external tags removed at the point of sale, and label tags (Photograph 2) are smaller EAS tags that can be integrated into products or packaging. The portal used for RF-EAS testing is shown in Photograph 3.
3
Photograph 1: RF-EAS Hard Tag
Photograph 2: RF-EAS Label Tag
Photograph 3: RF-EAS Portal
AcoustoMagnetic EAS
Acousto-Magnetic (AM) is a second type of EAS technology that uses a transmitter to send signals at frequencies of 58 kHz. The tags have the capacity to be turned on and off multiple times, and are typically deactivated (or removed in the case of a hard tag) at the point of sale. The tags carry a single bit of information; the portal simply detects the presence of a tag in a
Photograph 4: AM Label Tag
Photograph 5: AM Hard Tag
4
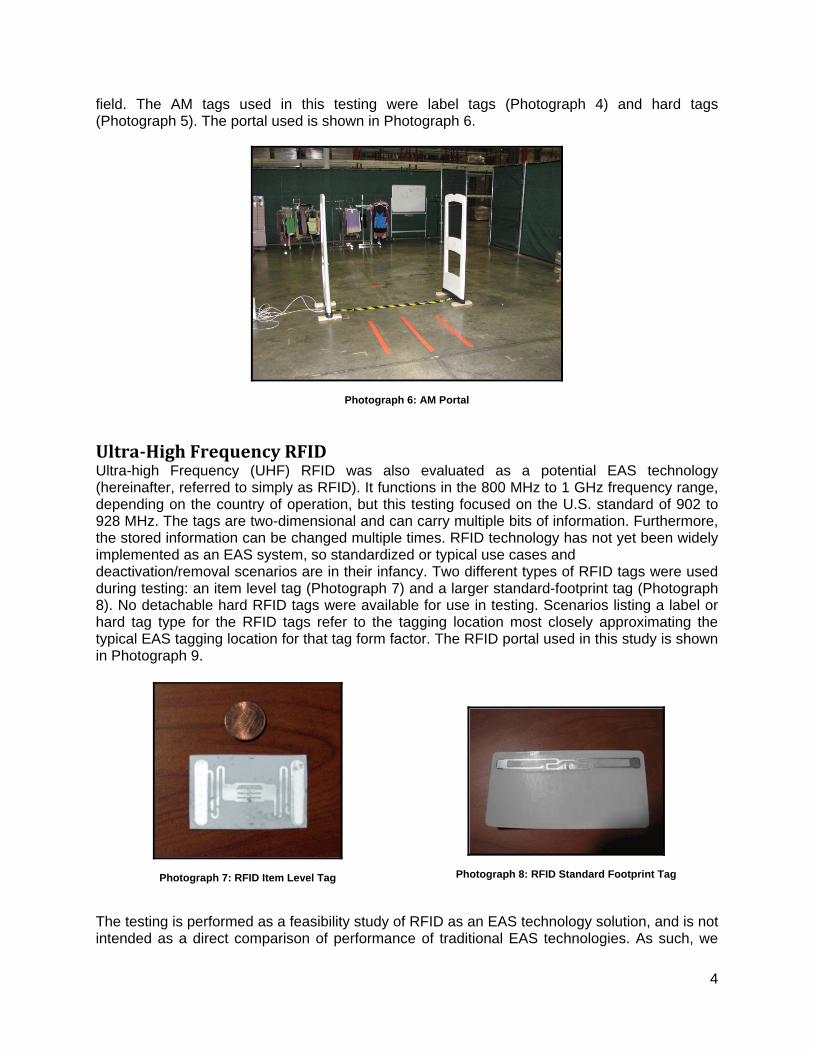
field. The AM tags used in this testing were label tags (Photograph 4) and hard tags (Photograph 5). The portal used is shown in Photograph 6.
Photograph 6: AM Portal
UltraHigh Frequency RFID Ultra-high Frequency (UHF) RFID was also evaluated as a potential EAS technology (hereinafter, referred to simply as RFID). It functions in the 800 MHz to 1 GHz frequency range, depending on the country of operation, but this testing focused on the U.S. standard of 902 to 928 MHz. The tags are two-dimensional and can carry multiple bits of information. Furthermore, the stored information can be changed multiple times. RFID technology has not yet been widely implemented as an EAS system, so standardized or typical use cases and deactivation/removal scenarios are in their infancy. Two different types of RFID tags were used during testing: an item level tag (Photograph 7) and a larger standard-footprint tag (Photograph 8). No detachable hard RFID tags were available for use in testing. Scenarios listing a label or hard tag type for the RFID tags refer to the tagging location most closely approximating the typical EAS tagging location for that tag form factor. The RFID portal used in this study is shown in Photograph 9.
Photograph 7: RFID Item Level Tag
Photograph 8: RFID Standard Footprint Tag
The testing is performed as a feasibility study of RFID as an EAS technology solution, and is not intended as a direct comparison of performance of traditional EAS technologies. As such, we

5
Photograph 9: UHF RFID Portal
have not identified individual performances of the EAS systems. Rather, in all situations, we have taken the best performance of the EAS tags (from both RF-EAS and AM) as the comparison to RFID. For all tests, interrogation portals (to simulate entry/exit door portals) were set up using each of the three technologies (AM, RF-EAS, RFID). It is likely that results can be affected by the width of the portal, if one were trying to compare the performance of each of the three technologies. However, our purpose was not to determine which of the three technologies works best under various conditions (e.g., a 4’ portal, 10’ portal, etc.), so we tested at the only width that was within implementation specifications for all three—in this case, a 6’ width. The technologies, where applicable, were tuned to that width. The common 6’ width allowed us to control this variable for all three technologies for baseline purposes, and to demonstrate the feasibility of RFID in the shoplifting scenarios.

6
Figure 2: Paths through Read Field (All Systems)
BASELINE SCENARIOS Simple baseline testing scenarios were chosen to flesh out the technical capabilities of the different systems in their respective interrogation portals. The baseline testing scenarios were chosen to establish performance capabilities in standardized, repeatable tests. The scenarios chosen are as follows:
1. One tagged item along multiple paths within the interrogation portal; 2. One tag at multiple orientations and along multiple paths within the interrogation portal; 3. One tagged shoe in a shoebox; 4. Fifty tagged and bagged items along multiple paths within the portal.
In each of these scenarios, a hard tag and a label were used for EAS, and two tag types—a smaller item-level inlay (Photograph 7), and a more commonly used standard footprint inlay (Photograph 8)—were used for the RFID testing. Testing scenarios are made up of individual tests, one for each variable. Each test consisted of 30 test runs. A “test run” consists of one pass through the portals. A brief introduction to each follows, and each is given a more complete treatment in its respective section of the report below. The first baseline test involved carrying a tagged item (a shirt on a plastic hanger) through the interrogation portal. Since the interrogation portals were symmetrical along the path of travel for each of the three technologies tested, the tagged item was moved through the portal along six different paths, as shown in Figure 2. There are six “paths” through the portal, each identified by one of three “heights” and two “lanes”. The two lanes are: a center lane that travels along the
7
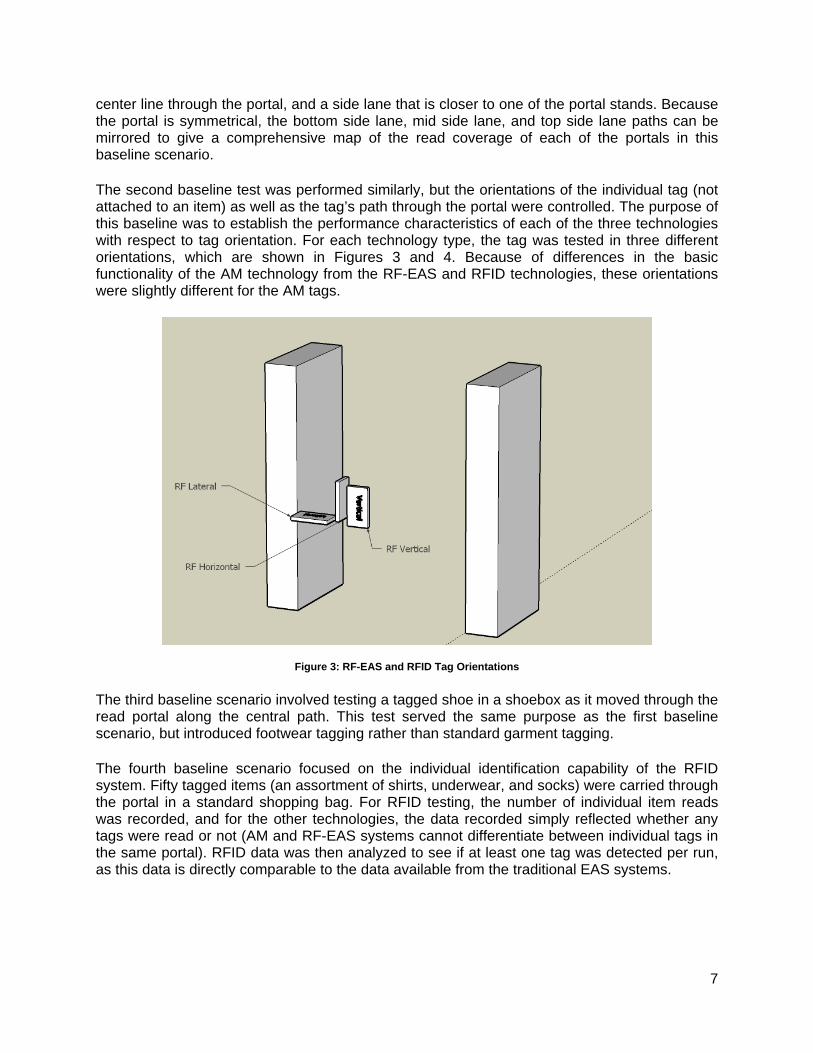
center line through the portal, and a side lane that is closer to one of the portal stands. Because the portal is symmetrical, the bottom side lane, mid side lane, and top side lane paths can be mirrored to give a comprehensive map of the read coverage of each of the portals in this baseline scenario. The second baseline test was performed similarly, but the orientations of the individual tag (not attached to an item) as well as the tag’s path through the portal were controlled. The purpose of this baseline was to establish the performance characteristics of each of the three technologies with respect to tag orientation. For each technology type, the tag was tested in three different orientations, which are shown in Figures 3 and 4. Because of differences in the basic functionality of the AM technology from the RF-EAS and RFID technologies, these orientations were slightly different for the AM tags.
Figure 3: RF-EAS and RFID Tag Orientations The third baseline scenario involved testing a tagged shoe in a shoebox as it moved through the read portal along the central path. This test served the same purpose as the first baseline scenario, but introduced footwear tagging rather than standard garment tagging. The fourth baseline scenario focused on the individual identification capability of the RFID system. Fifty tagged items (an assortment of shirts, underwear, and socks) were carried through the portal in a standard shopping bag. For RFID testing, the number of individual item reads was recorded, and for the other technologies, the data recorded simply reflected whether any tags were read or not (AM and RF-EAS systems cannot differentiate between individual tags in the same portal). RFID data was then analyzed to see if at least one tag was detected per run, as this data is directly comparable to the data available from the traditional EAS systems.

8
Graph 1: Baseline Scenario I—Performance by System
Figure 4: AM Tag Orientations
Results of Baseline Scenario I: One Tagged Item Along Six Paths Performance by the system in Graph 1 represents combined data from all of the tag types used (i.e., hard and label tags for EAS; standard footprint and item-level tags for RFID), and all of the paths traveled through the portal. Each tag was carried through the portal on each path 30
9
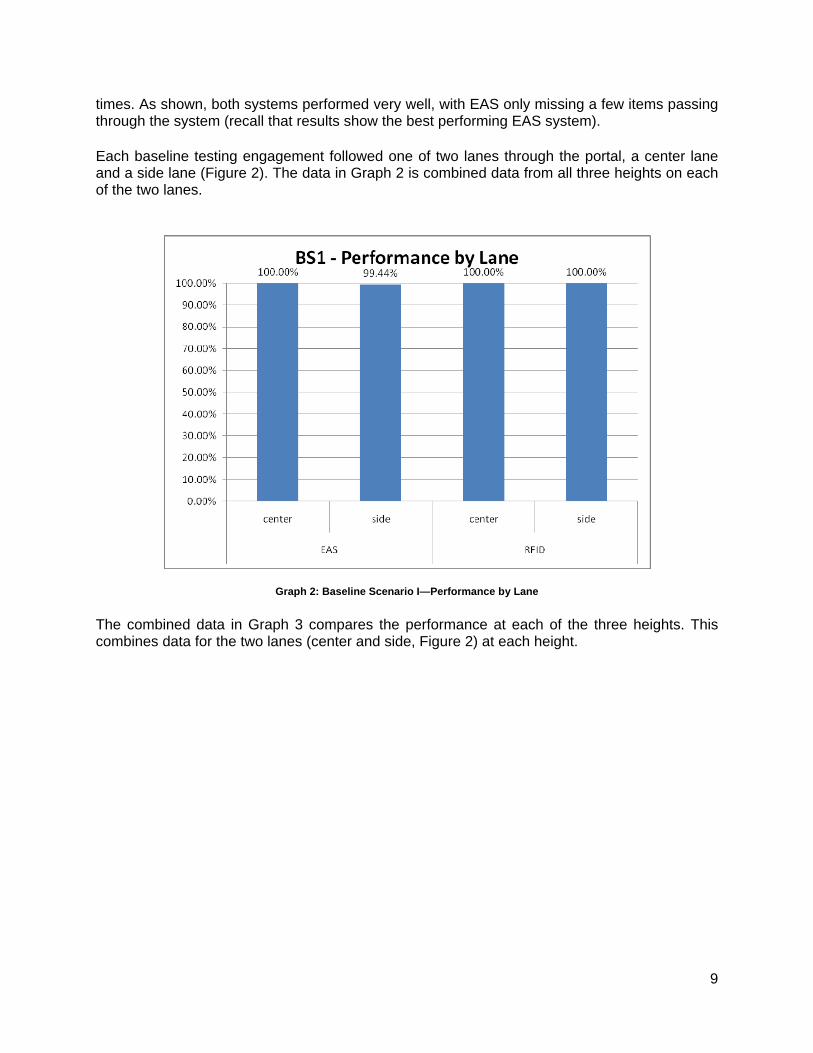
times. As shown, both systems performed very well, with EAS only missing a few items passing through the system (recall that results show the best performing EAS system). Each baseline testing engagement followed one of two lanes through the portal, a center lane and a side lane (Figure 2). The data in Graph 2 is combined data from all three heights on each of the two lanes.
Graph 2: Baseline Scenario I—Performance by Lane The combined data in Graph 3 compares the performance at each of the three heights. This combines data for the two lanes (center and side, Figure 2) at each height.

10
Graph 3: Baseline Scenario I—Performance by Height
Results Summary—Baseline Scenario I RFID appeared to be least affected by variances in travel height and distance through the portals. Because one tagged item with minimal interference was moving through the portal, and because at a 6’ portal width the UHF field is very strong, the tags performed well. Some variation was seen in the EAS technologies’ performances due to tag height, and side lanes performed better than center lanes, as expected, because the tag is closer to the antenna.
Results of Baseline Scenario II: One Tag At Three Orientations and Six Paths Performance by the system in Graph 4 represents combined data from all of the tag types used in all orientations along all of the paths traveled through the portal. Each tag type was carried through the portal in each orientation along each path 30 times. As demonstrated, the EAS systems missed a few tags passing through the portal; the RFID system read 100%.

11
Graph 4: Baseline Scenario II—Performance by System Each baseline testing engagement followed one of two lanes through the portal, a center lane and a side lane (Figure 2). The data in Graph 5 is combined data from all three heights on each of the two lanes.
Graph 5: Baseline Scenario II—Performance by Lane
12
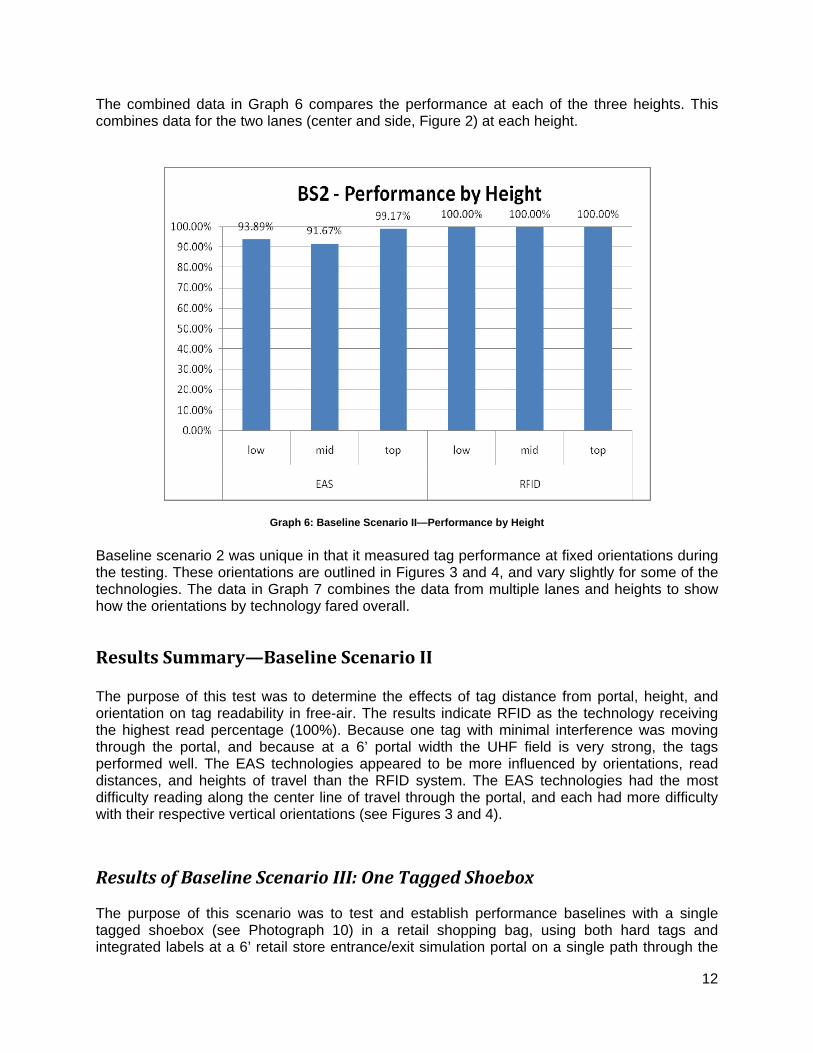
The combined data in Graph 6 compares the performance at each of the three heights. This combines data for the two lanes (center and side, Figure 2) at each height.
Graph 6: Baseline Scenario II—Performance by Height Baseline scenario 2 was unique in that it measured tag performance at fixed orientations during the testing. These orientations are outlined in Figures 3 and 4, and vary slightly for some of the technologies. The data in Graph 7 combines the data from multiple lanes and heights to show how the orientations by technology fared overall.
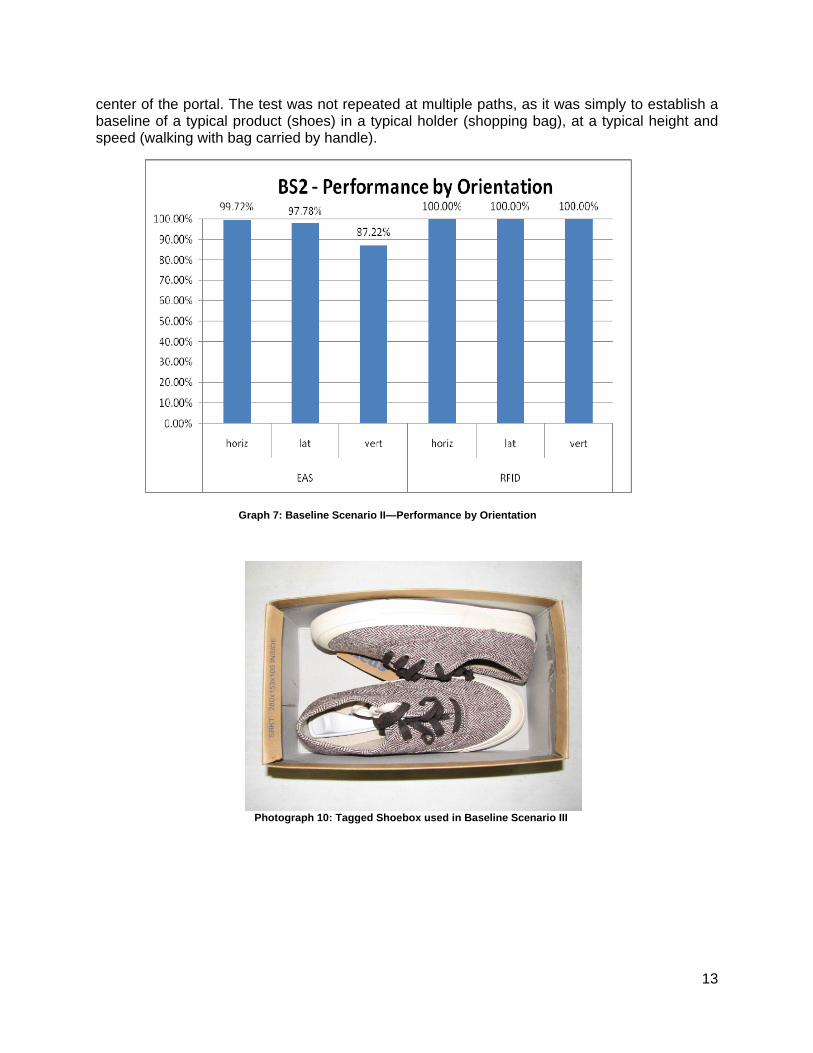
Results Summary—Baseline Scenario II The purpose of this test was to determine the effects of tag distance from portal, height, and orientation on tag readability in free-air. The results indicate RFID as the technology receiving the highest read percentage (100%). Because one tag with minimal interference was moving through the portal, and because at a 6’ portal width the UHF field is very strong, the tags performed well. The EAS technologies appeared to be more influenced by orientations, read distances, and heights of travel than the RFID system. The EAS technologies had the most difficulty reading along the center line of travel through the portal, and each had more difficulty with their respective vertical orientations (see Figures 3 and 4). Results of Baseline Scenario III: One Tagged Shoebox The purpose of this scenario was to test and establish performance baselines with a single tagged shoebox (see Photograph 10) in a retail shopping bag, using both hard tags and integrated labels at a 6’ retail store entrance/exit simulation portal on a single path through the
13
Graph 7: Baseline Scenario II—Performance by Orientation
Photograph 10: Tagged Shoebox used in Baseline Scenario III
center of the portal. The test was not repeated at multiple paths, as it was simply to establish a baseline of a typical product (shoes) in a typical holder (shopping bag), at a typical height and speed (walking with bag carried by handle).

14
BS3 ‐ Performance by System
0%
10%
20%
30%
40%
50%
60%
70%
80%
90%
100%
EAS RFID
100% 100%
Photograph 11: Shopping Bag with 50 Items
Performance by system in Graph 8 represents combined data from all of the tag types. As shown, both systems were successful.
Graph 8: Baseline Scenario III—Performance by System
Results Summary—Baseline Scenario III A tagged shoe in a shoebox was chosen as a common EAS tagged item, and the travel path chosen was middle height along the center lane (center of portal, see Figure 2). All systems read well. Even though the tag was inside the heel of the shoe, read rates were still high, as shoe material and packaging do not seem to greatly affect the readability of each of the technologies tested. Results of Baseline Scenario IV: Fifty Tagged Items in a Shopping Bag Along Six Paths The purpose of this scenario was to test and establish performance baselines with fifty tagged items placed in a retail shopping bag (see Photograph 11), using both hard tags and integrated labels at a 6’ retail store entrance/exit simulation portal at multiple paths through the portal (Figure 2). This testing emphasizes the differences in the ability to identify individual tags in an RFID system, and the data representation reflects this accordingly. The solid bars on the graphs represent the
15
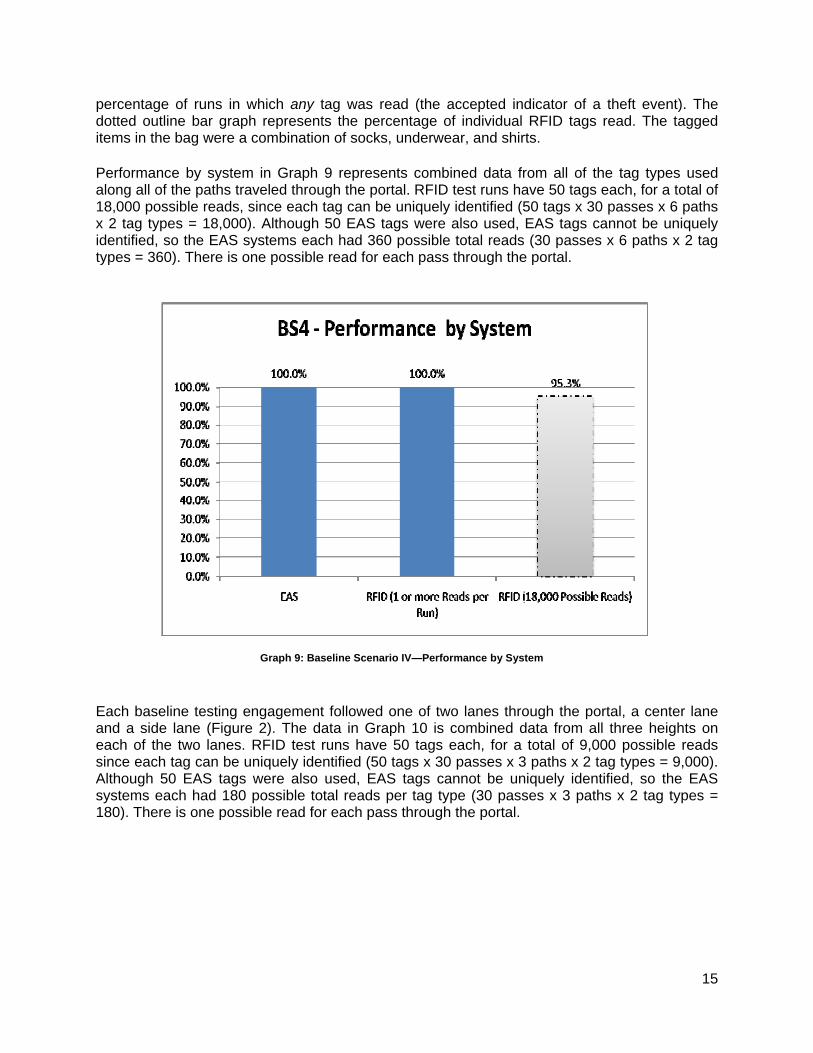
Graph 9: Baseline Scenario IV—Performance by System
percentage of runs in which any tag was read (the accepted indicator of a theft event). The dotted outline bar graph represents the percentage of individual RFID tags read. The tagged items in the bag were a combination of socks, underwear, and shirts. Performance by system in Graph 9 represents combined data from all of the tag types used along all of the paths traveled through the portal. RFID test runs have 50 tags each, for a total of 18,000 possible reads, since each tag can be uniquely identified (50 tags x 30 passes x 6 paths x 2 tag types = 18,000). Although 50 EAS tags were also used, EAS tags cannot be uniquely identified, so the EAS systems each had 360 possible total reads (30 passes x 6 paths x 2 tag types = 360). There is one possible read for each pass through the portal. Each baseline testing engagement followed one of two lanes through the portal, a center lane and a side lane (Figure 2). The data in Graph 10 is combined data from all three heights on each of the two lanes. RFID test runs have 50 tags each, for a total of 9,000 possible reads since each tag can be uniquely identified (50 tags x 30 passes x 3 paths x 2 tag types = 9,000). Although 50 EAS tags were also used, EAS tags cannot be uniquely identified, so the EAS systems each had 180 possible total reads per tag type (30 passes x 3 paths x 2 tag types = 180). There is one possible read for each pass through the portal.
16
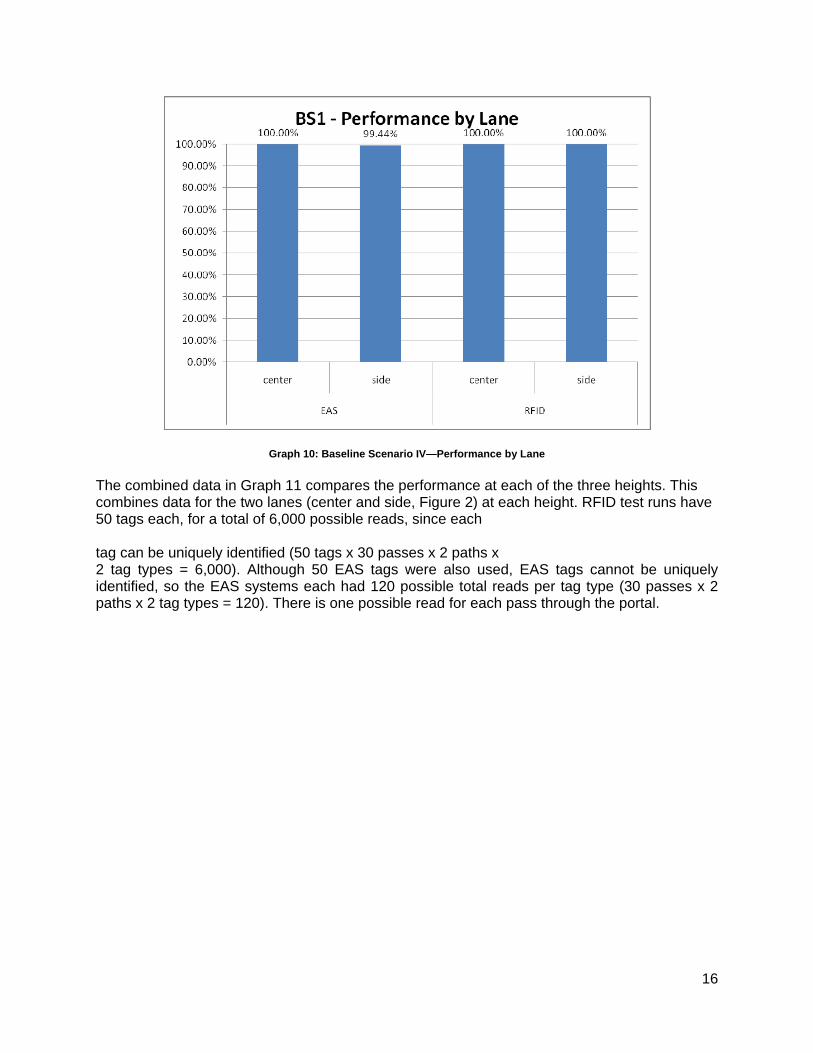
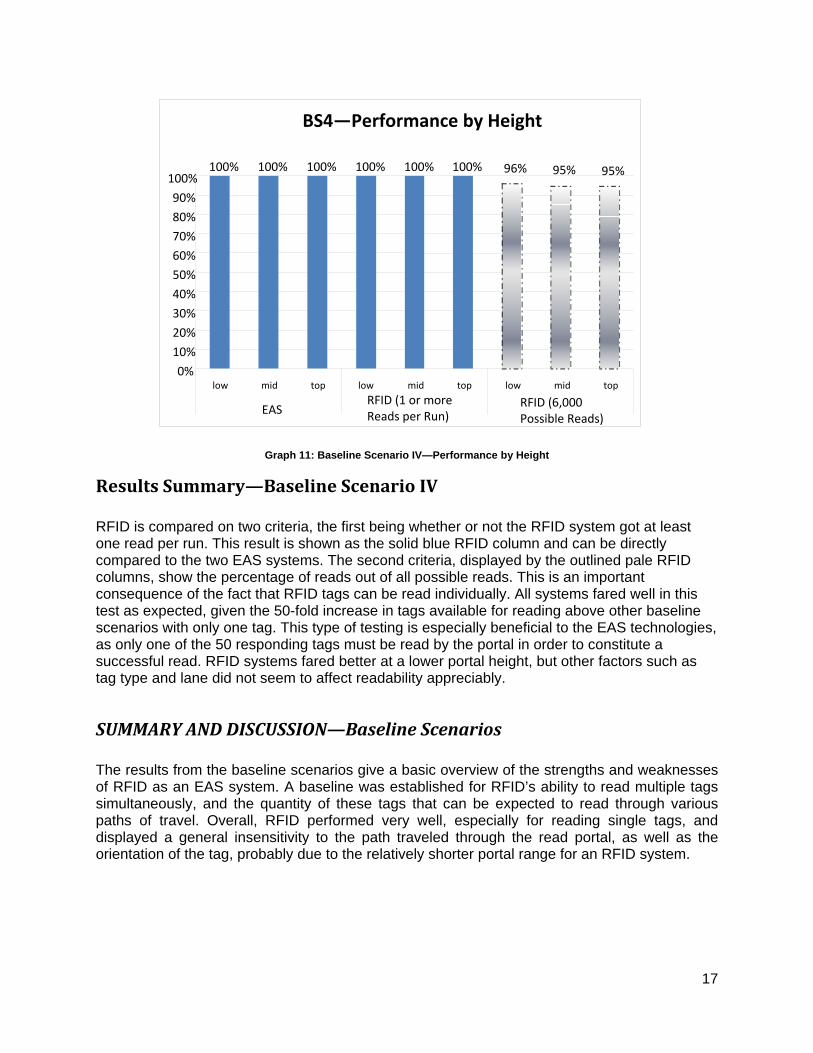
Graph 10: Baseline Scenario IV—Performance by Lane The combined data in Graph 11 compares the performance at each of the three heights. This combines data for the two lanes (center and side, Figure 2) at each height. RFID test runs have 50 tags each, for a total of 6,000 possible reads, since each tag can be uniquely identified (50 tags x 30 passes x 2 paths x 2 tag types = 6,000). Although 50 EAS tags were also used, EAS tags cannot be uniquely identified, so the EAS systems each had 120 possible total reads per tag type (30 passes x 2 paths x 2 tag types = 120). There is one possible read for each pass through the portal.
17
Graph 11: Baseline Scenario IV—Performance by Height
Results Summary—Baseline Scenario IV RFID is compared on two criteria, the first being whether or not the RFID system got at least one read per run. This result is shown as the solid blue RFID column and can be directly compared to the two EAS systems. The second criteria, displayed by the outlined pale RFID columns, show the percentage of reads out of all possible reads. This is an important consequence of the fact that RFID tags can be read individually. All systems fared well in this test as expected, given the 50-fold increase in tags available for reading above other baseline scenarios with only one tag. This type of testing is especially beneficial to the EAS technologies, as only one of the 50 responding tags must be read by the portal in order to constitute a successful read. RFID systems fared better at a lower portal height, but other factors such as tag type and lane did not seem to affect readability appreciably.
SUMMARY AND DISCUSSION—Baseline Scenarios The results from the baseline scenarios give a basic overview of the strengths and weaknesses of RFID as an EAS system. A baseline was established for RFID’s ability to read multiple tags simultaneously, and the quantity of these tags that can be expected to read through various paths of travel. Overall, RFID performed very well, especially for reading single tags, and displayed a general insensitivity to the path traveled through the read portal, as well as the orientation of the tag, probably due to the relatively shorter portal range for an RFID system.
BS4—Performance by Height
100% 100% 100% 100% 100% 100% 96% 95% 95%
0%
10%
20%
30%
40%
50%
60%
70%
80%
90%
100%
low mid top low mid top low mid top EAS
RFID (1 or more Reads per Run)
RFID (6,000 Possible Reads)

18
SHOPLIFTING SCENARIOS Once the baseline scenarios established the capabilities of the different technologies, the focus of testing shifted to simulating several shoplifting scenarios. The purpose of the shoplifting scenarios was not to find ways to defeat various technologies; rather, the purpose was to evaluate the feasibility (performance) of RFID under common shoplifting conditions. Thus, on the advice of several retail loss prevention professionals as well as loss prevention technology providers, the following shoplifting scenarios were deemed to be representative of some typical real-world scenarios:
1. Fifty tagged items in a booster bag (a foil-lined bag); 2. One tagged shoe worn; 3. One tagged shirt worn; 4. One tagged item placed under a hat; 5. Ten tagged items moving through the portal at running speed; 6. One tagged item held close to body; 7. One tagged item placed in the center of a full bag of untagged items.
Unless noted otherwise, each test consisted of 30 test runs. A test run is one pass through the portals. The first shoplifting scenario addressed a specialized tool used by shoplifters: the booster bag. A booster bag was created for the testing by lining the inside of a standard shopping bag with a single layer of aluminum foil. Fifty tagged items (an assortment of shirts, socks, and underwear) were placed in the booster bag and passed through the read portal. RFID testing recorded the number of individual tags that were read, and the other technologies recorded whether or not any of their tags were detected in the portal. RFID data was then analyzed to see if at least one tag was detected per run in order to provide data as to whether a shoplifting attempt was detected, regardless of how many individual tags were seen. Please note: results are expected to vary greatly depending on construction of the bag, number of items contained, and how well the bag is sealed. Again, the purpose was not to determine if a technology could be defeated, but rather to establish a common scenario to investigate the technologies (if defeating all the technologies was the purpose, we could do so—e.g., during initial investigation, it was found that a bag could be constructed containing fewer items that would completely defeat all three technologies). The second shoplifting scenario tested a tagged shoe as the wearer walked through the portal. This scenario simulated a shoplifter stealing footwear by wearing it out of the store, and also simulated a potential circumstance in which an integrated non-removable shoe tag was improperly deactivated. This scenario focused on the low areas of the interrogation portals, and could be extended to other scenarios in which a shoplifter might focus on moving tags close to the floor as a potential bypass of portal fields. The third shoplifting scenario tested the readability of a tagged item that was worn by a shoplifter exiting a store. In all testing, a shirt was tagged in a typical location (close to the collar with both hard tags and labels) and a coat was worn over the tagged shirt. The detection of the tag was noted as the wearer passed through the portal.
19
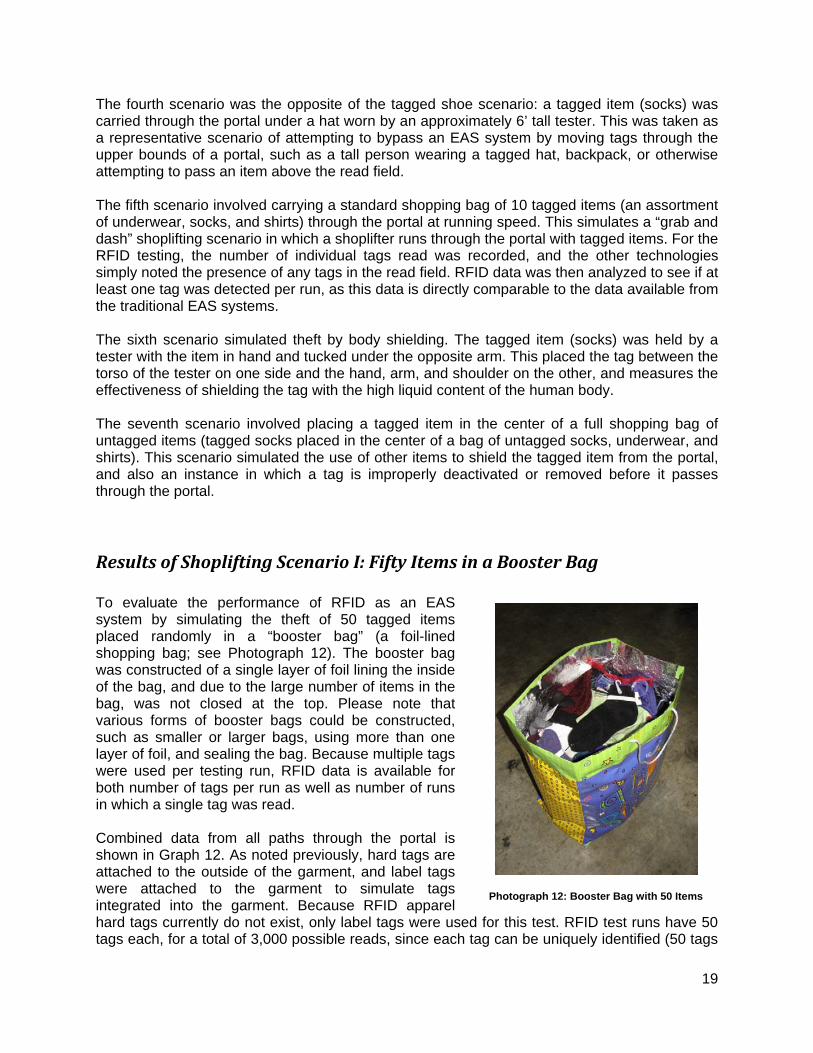
Photograph 12: Booster Bag with 50 Items
The fourth scenario was the opposite of the tagged shoe scenario: a tagged item (socks) was carried through the portal under a hat worn by an approximately 6’ tall tester. This was taken as a representative scenario of attempting to bypass an EAS system by moving tags through the upper bounds of a portal, such as a tall person wearing a tagged hat, backpack, or otherwise attempting to pass an item above the read field. The fifth scenario involved carrying a standard shopping bag of 10 tagged items (an assortment of underwear, socks, and shirts) through the portal at running speed. This simulates a “grab and dash” shoplifting scenario in which a shoplifter runs through the portal with tagged items. For the RFID testing, the number of individual tags read was recorded, and the other technologies simply noted the presence of any tags in the read field. RFID data was then analyzed to see if at least one tag was detected per run, as this data is directly comparable to the data available from the traditional EAS systems. The sixth scenario simulated theft by body shielding. The tagged item (socks) was held by a tester with the item in hand and tucked under the opposite arm. This placed the tag between the torso of the tester on one side and the hand, arm, and shoulder on the other, and measures the effectiveness of shielding the tag with the high liquid content of the human body. The seventh scenario involved placing a tagged item in the center of a full shopping bag of untagged items (tagged socks placed in the center of a bag of untagged socks, underwear, and shirts). This scenario simulated the use of other items to shield the tagged item from the portal, and also an instance in which a tag is improperly deactivated or removed before it passes through the portal.
Results of Shoplifting Scenario I: Fifty Items in a Booster Bag To evaluate the performance of RFID as an EAS system by simulating the theft of 50 tagged items placed randomly in a “booster bag” (a foil-lined shopping bag; see Photograph 12). The booster bag was constructed of a single layer of foil lining the inside of the bag, and due to the large number of items in the bag, was not closed at the top. Please note that various forms of booster bags could be constructed, such as smaller or larger bags, using more than one layer of foil, and sealing the bag. Because multiple tags were used per testing run, RFID data is available for both number of tags per run as well as number of runs in which a single tag was read. Combined data from all paths through the portal is shown in Graph 12. As noted previously, hard tags are attached to the outside of the garment, and label tags were attached to the garment to simulate tags integrated into the garment. Because RFID apparel hard tags currently do not exist, only label tags were used for this test. RFID test runs have 50 tags each, for a total of 3,000 possible reads, since each tag can be uniquely identified (50 tags
20
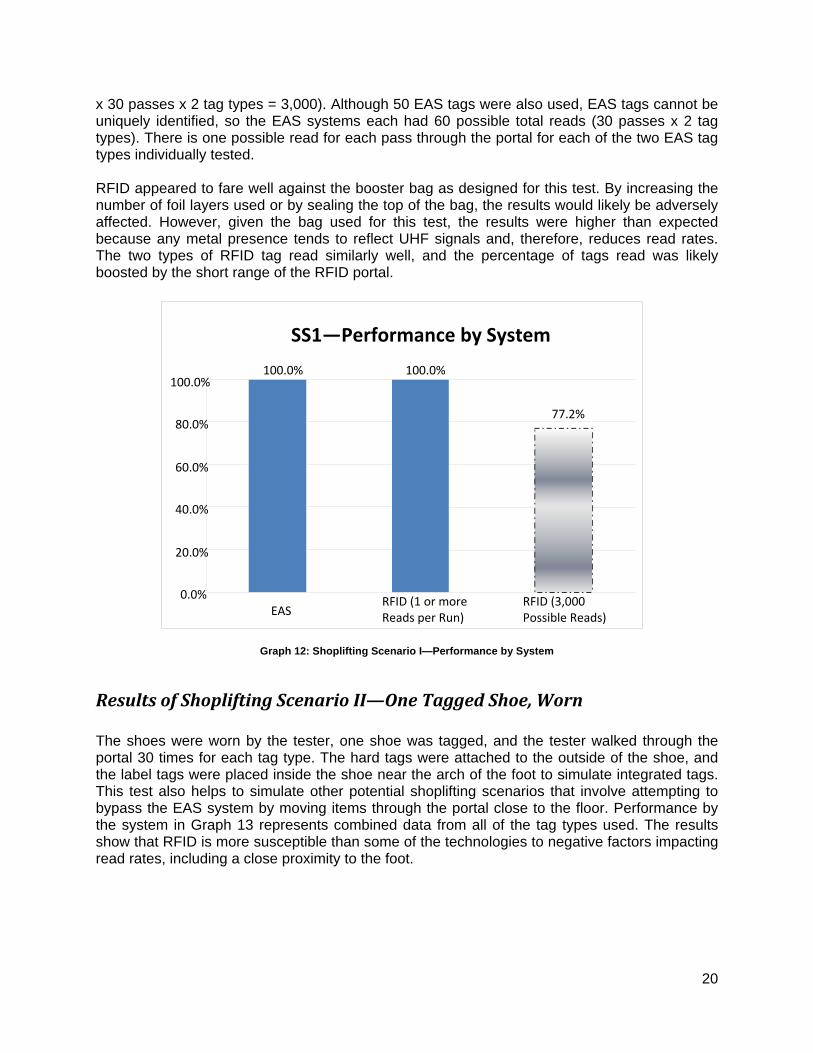
x 30 passes x 2 tag types = 3,000). Although 50 EAS tags were also used, EAS tags cannot be uniquely identified, so the EAS systems each had 60 possible total reads (30 passes x 2 tag types). There is one possible read for each pass through the portal for each of the two EAS tag types individually tested. RFID appeared to fare well against the booster bag as designed for this test. By increasing the number of foil layers used or by sealing the top of the bag, the results would likely be adversely affected. However, given the bag used for this test, the results were higher than expected because any metal presence tends to reflect UHF signals and, therefore, reduces read rates. The two types of RFID tag read similarly well, and the percentage of tags read was likely boosted by the short range of the RFID portal.
Graph 12: Shoplifting Scenario I—Performance by System
Results of Shoplifting Scenario II—One Tagged Shoe, Worn The shoes were worn by the tester, one shoe was tagged, and the tester walked through the portal 30 times for each tag type. The hard tags were attached to the outside of the shoe, and the label tags were placed inside the shoe near the arch of the foot to simulate integrated tags. This test also helps to simulate other potential shoplifting scenarios that involve attempting to bypass the EAS system by moving items through the portal close to the floor. Performance by the system in Graph 13 represents combined data from all of the tag types used. The results show that RFID is more susceptible than some of the technologies to negative factors impacting read rates, including a close proximity to the foot.
SS1—Performance by System
100.0% 100.0%
77.2%
0.0%
20.0%
40.0%
60.0%
80.0%
100.0%
EAS RFID (1 or more Reads per Run)
RFID (3,000 Possible Reads)

21
Graph 14: Shoplifting Scenario III—Performance by System
Graph 13: Shoplifting Scenario II—Performance by System
Results of Shoplifting Scenario III—One Tagged Shirt, Worn The tags were placed around the collar area of a shirt that was worn by the tester, and a jacket was worn over the shirt. The tester passed through the portal 30 times for each tag type. Performance by system in Graph 14 represents combined data from all of the tag types used.
22
This scenario was designed to simulate wearing a tag under another garment for shielding, and walking through an EAS equipped door. The results show that RFID had a more difficult time overall than EAS, probably due to proximity to the body (and the body absorbing the RF energy).
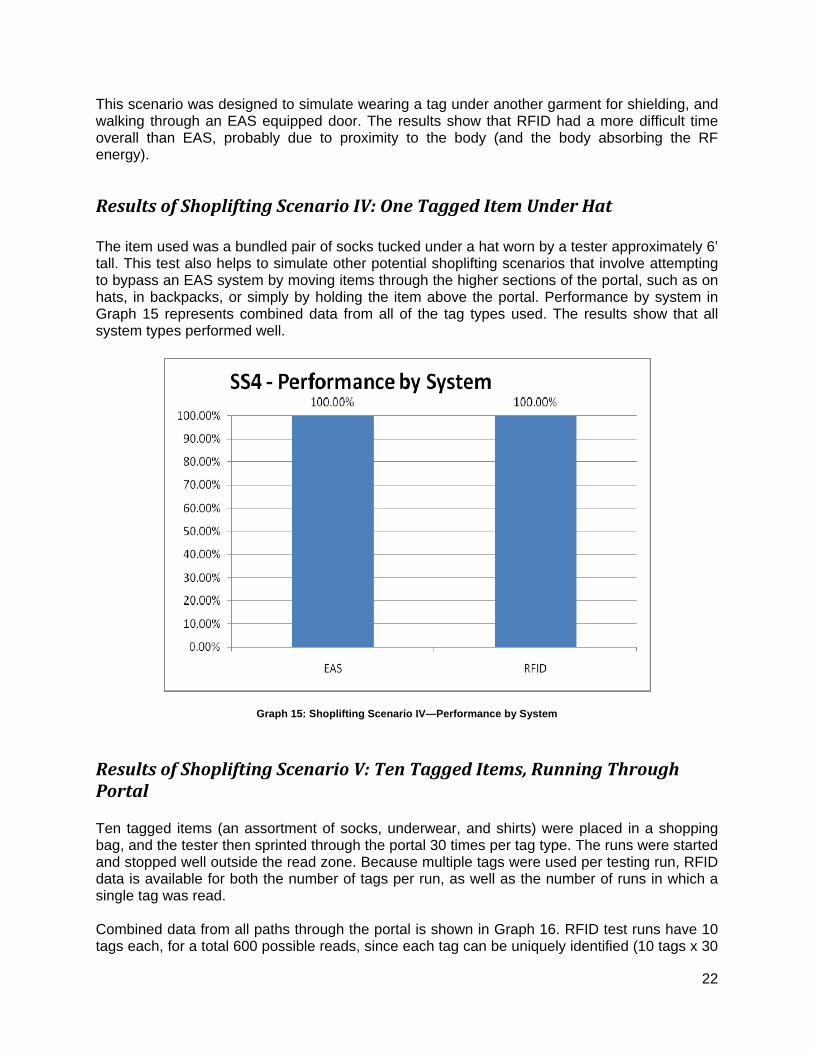
Results of Shoplifting Scenario IV: One Tagged Item Under Hat The item used was a bundled pair of socks tucked under a hat worn by a tester approximately 6’ tall. This test also helps to simulate other potential shoplifting scenarios that involve attempting to bypass an EAS system by moving items through the higher sections of the portal, such as on hats, in backpacks, or simply by holding the item above the portal. Performance by system in Graph 15 represents combined data from all of the tag types used. The results show that all system types performed well.
Graph 15: Shoplifting Scenario IV—Performance by System
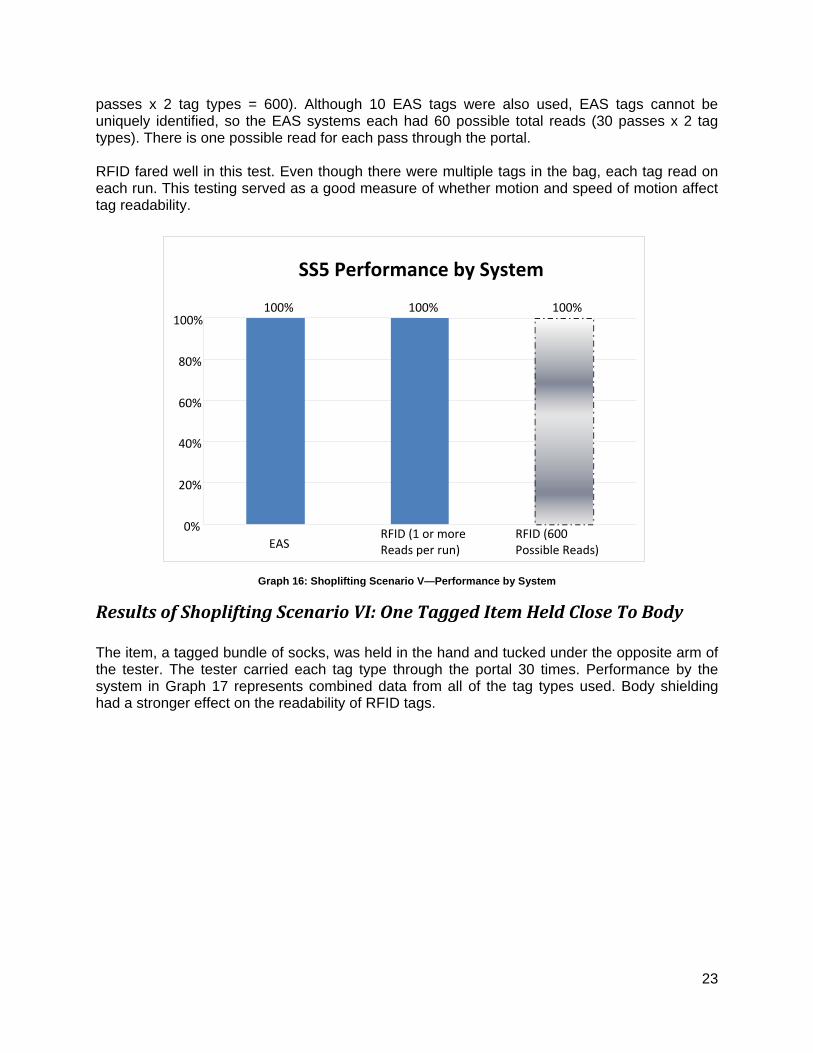
Results of Shoplifting Scenario V: Ten Tagged Items, Running Through Portal Ten tagged items (an assortment of socks, underwear, and shirts) were placed in a shopping bag, and the tester then sprinted through the portal 30 times per tag type. The runs were started and stopped well outside the read zone. Because multiple tags were used per testing run, RFID data is available for both the number of tags per run, as well as the number of runs in which a single tag was read. Combined data from all paths through the portal is shown in Graph 16. RFID test runs have 10 tags each, for a total 600 possible reads, since each tag can be uniquely identified (10 tags x 30
23
passes x 2 tag types = 600). Although 10 EAS tags were also used, EAS tags cannot be uniquely identified, so the EAS systems each had 60 possible total reads (30 passes x 2 tag types). There is one possible read for each pass through the portal. RFID fared well in this test. Even though there were multiple tags in the bag, each tag read on each run. This testing served as a good measure of whether motion and speed of motion affect tag readability.
Graph 16: Shoplifting Scenario V—Performance by System
Results of Shoplifting Scenario VI: One Tagged Item Held Close To Body The item, a tagged bundle of socks, was held in the hand and tucked under the opposite arm of the tester. The tester carried each tag type through the portal 30 times. Performance by the system in Graph 17 represents combined data from all of the tag types used. Body shielding had a stronger effect on the readability of RFID tags.
SS5 Performance by System
100% 100% 100%
0%
20%
40%
60%
80%
100%
EAS RFID (1 or more Reads per run)
RFID (600 Possible Reads)

24
Graph 17: Shoplifting Scenario VI—Performance by System
Results of Shoplifting Scenario VII: One Tagged Item in a Bag of Untagged Clothes There were 10 items in each bag, but only one tagged item in the center of the clothes. Each bag was carried through the portal 30 times. Performance by the system in Graph 18 represents combined data from all of the tag types used. This indicates that other garment items in a shopping bag are not a significant insulator against reads in any of the EAS systems tested.
Graph 18: Shoplifting Scenario VII—Performance by System
25
SUMMARY AND DISCUSSION—Shoplifting Scenarios RFID fared well during most of the scenarios as tested, although body proximity demonstrated an adverse affect on read rates. The most interesting data comes from the scenarios involving running through the portal and the booster bag, because these scenarios involved multiple RFID tags, and we were able to get an index of how much information would be available at the entry/exit portal on the RFID tags leaving the store. Clothing and cloth material were not found to be a significant RFID interferer, and moving the tag through the portal at different heights did not affect the results significantly, either. Item level tags did not perform as well as the standard footprint tags in some of the tests, particularly those that involved proximity to the body; this was expected, due to the smaller form factor of the item level tag. Speed of movement was not found to be a significant cause of decreased performance, either.

26
SUMMARY—TESTING RESULTS
Because the testing was focused on performance at a specific read portal mimicking existing entry/exit door portals for apparel and footwear, it gave a very good overview of the physical performance characteristics of RFID when compared to existing technologies for reference purposes. With this knowledge in hand, in-store use cases can be more readily identified for future testing engagements that focus on particular strengths and weaknesses of RFID. The weaknesses of RFID as identified by this testing are susceptible to proximity to the human body, most likely caused by the body’s high liquid content. It is important to note that this testing is unique among typical RFID testing engagements, in that the portal separation was 6 feet, rather than the typical 8 to 10 feet portal separation seen in most case and pallet RFID testing up to this point. This is an interesting performance trend in item level RFID; item level readability seems to increase at shorter ranges, especially for doorways designed for foot traffic rather than fork-trucks and pallet-jacks. The baseline results can be used as an index of the performance of RFID as a perimeter EAS technology solution (but is not meant to provide a direct comparison of performance of the different technologies because, as stated earlier, different technologies have different optimum ranges). In most instances, RFID performed adequately enough to warrant further investigation.

333 East Butterfield Road, Suite 140Lombard, Illinois 60148-5617 USAPhone +1 630.574.0985 Fax +1 630.574.0989cscmp.org
1009 Lenox Drive - Suite 202Lawrenceville, New Jersey 08648Phone +1 609.620.4590 vics.org
VOLUNTARY INTERINDUSTRYC O M M E R C E S O L U T I O N S