1143913 BIL semi-annual report 2015 UK … · financial statements | Semi-annual Report 2015....
39
Semi-annual Report as at June 30, 2015
Transcript of 1143913 BIL semi-annual report 2015 UK … · financial statements | Semi-annual Report 2015....
Semi-annual Report
as at June 30, 2015

Semi-annual Report as at June 30, 2015
Consolidated management report 5
Consolidated financial statements 19

Consolidated management reportCorporate governance 6
Business Review and Results 1. Highlights of first half 2015 8 2. Consolidated statement of income and consolidated balance sheet 10 3. Outlook 12
Risk Management 1. Key events of 2015 13 2. Credit risk 13 3. Market risk 16 4. Asset quality 17 5. Solvency monitoring 17

Cons
olid
ated
m
anag
emen
t re
port
Cons
olid
ated
fin
anci
al s
tate
men
ts
6 BIL | Semi-annual Report 2015
Corporate governance (as at June 30, 2015 )
Board of DirectorsChairman
François Pauly
Vice Chairman
George Nasra CEO, Precision Capital SA
Members
Hugues Delcourt CEO, Banque Internationale à Luxembourg SAFrank Wagener Honorary ChairmanRobert Glaesener CEO, Trendiction SANicholas Harvey Deputy CEO, Precision Capital SAPascale Toussing 1er Conseiller de Gouvernement, Ministry of FinanceAlbert Wildgen LawyerChristophe Zeeb-Ichter Conseiller de Gouvernement 1ère classe, Ministry of FinanceMichel Scharff Employees’ Delegation, BILSerge Schimoff Employees’ Delegation, BILDonny Wagner Employees’ Delegation, BILFernand Welschbillig Employees’ Delegation, BIL
Strategy CommitteeChairman MembersGeorge Nasra François Pauly Pascale Toussing
Audit and Compliance CommitteeChairman MembersRobert Glaesener Nicholas Harvey Christophe Zeeb-Ichter
Risk CommitteeChairman Vice Chairman MembersFrank Wagener George Nasra François Pauly Pascale Toussing Albert Wildgen
Remuneration and Nominations CommitteeChairman MembersGeorge Nasra Nicholas Harvey Pascale Toussing

Cons
olid
ated
m
anag
emen
t re
port
Cons
olid
ated
fin
anci
al s
tate
men
ts
BIL | Semi-annual Report 2015 7
Management BoardChairman
Hugues Delcourt
Vice Chairman
Pierre Malevez Finance and Risks
Members
Yves Baguet Chief Operations OfficerAdrian Leuenberger Wealth and Investment ManagementMarcel Leyers Corporate and Institutional BankingBernard Mommens Secretary General, Legal & TaxClaude Schon Treasury and Financial MarketsChristian Strasser Retail Banking
Audit
Pia Haas
Cons
olid
ated
m
anag
emen
t re
port
Cons
olid
ated
fin
anci
al s
tate
men
ts
8 BIL | Semi-annual Report 2015
Business Review and Results
1. Highlights of first half 2015The announcement of BIL’s strong financial performance in 2014 confirmed the Bank’s return to profitability. This trend has continued, becoming even stronger during the first half of this year. In parallel, a new strategy has been put in place in order to strengthen the Bank’s positioning within the next five years and ensure its long-term sustainability.
TURNING TOWARDS THE FUTURE: A NEW STRATEGIC FRAMEWORK CALLED BIL2020
The Bank made public in April 2015 the “BIL2020” strategy programme launched in order to strengthen its position as a leading multi-business bank by placing greater focus on innovation and client satisfaction in Luxembourg and in a clearly defined number of international markets.
In Luxembourg, BIL aims to develop its multi-business line banking model and to deepen its ties with its clients, including companies and financial institutions, through a variety of initiatives in retail banking, wealth management 1, corporate & institutional banking and in financial market activities.
Internationally, through its wealth management activities, BIL will focus its growth efforts on a defined number of target markets in 13 countries and regions. Teams of professionals will be able to offer these clients an ever-more relevant service, based on unrivalled knowledge of these markets.
BIL will, as a committed, innovative and responsible bank, remain heavily involved in Luxembourg’s cultural and social life and will strengthen its corporate and social responsibility approach by focussing on three well-defined areas: art & culture, education and innovation.
INTERNATIONAL DEVELOPMENTS
The BIL2020 review reinforced the importance of international wealth management for BIL and paved the way for the Bank’s wealth management activities to concentrate on a number of key markets, notably in Europe and the Middle East. In January 2015, BIL took steps to strengthen its presence in Switzerland by acquiring the Swiss operations of KBL epb. At the same time, Puilaetco Dewaay, KBL epb’s Belgian affiliate, acquired BIL’s Wealth Management business in Belgium. The Swiss transaction will strengthen BIL’s existing Swiss operations and create a sizeable private bank operating from Geneva, Lugano and Zurich.
As part of this strategy, BIL also inaugurated a new branch – BIL Middle East – in Dubai, United Arab Emirates, in March 2015, in the presence of Luxembourg’s Royal Family.
In May, and continuing to apply the newly defined geographic focus, the Bank announced the closure of its Singapore office.
INNOVATION TO PLAY A KEY ROLE IN THE BANK’S EFFORTS
Innovation is a key element of BIL’s strategy for 2020 and will act as a common theme to the Bank’s activities. One of the key signs of BIL’s commitment to innovation during the first half of 2015 was the Bank’s positioning regarding the Financial Technology companies (FinTech) trend, which offer innovative and low-cost alternatives to existing services offered by financial institutions such as banks. BIL was the official banking sponsor of ICT Spring Europe 2015, which focused on the links between FinTech companies, digital strategies and client experiences. BIL also took part in the PwC Banking Day which was held on the topic of “The age of technology and new business models”. In addition, BIL co-organised a conference to discuss “What FinTech means for Luxembourg, What Luxembourg means to FinTech”.
At all of these FinTech events, CEO Hugues Delcourt asserted BIL’s intention to play an active role in the fundamental transformation of the banking sector and of the development of the FinTech sector in Luxembourg.
BIL has also retained innovation as a key principle in other areas, such as its BILjobdating recruitment event. This involved inviting potential recruits through social media to come to an event in which speed-recruitment strategies were used to structure three rounds of interviews. This gave the Bank’s HR department access to recruits who might otherwise not apply and the ability to have a first meeting without the intermediary of paper documents.
BIL is making significant efforts in the area of technology. For example, the BILnet mobile platform is constantly being upgraded in order to bring improved functionality and features to clients. This has included the introduction of Apple’s Touch ID functionality for users of Apple devices, along with a significant update to the BILnet user interface, which can now present similar functionalities regardless of screen size, thus reducing the configuration need from a computer.
1 "Wealth management“ was previously called “private banking”.
Cons
olid
ated
m
anag
emen
t re
port
Cons
olid
ated
fin
anci
al s
tate
men
ts
BIL | Semi-annual Report 2015 9
Strength of commercial franchises
The “Retail, Corporate and Wealth Management” activities have once more turned in a robust performance during the first half of 2015.• Customer deposits were up by 6.3% to reach 14.3 billion
(versus 13.4 billion at year-end 2014) as this commercial franchise continues its development in Luxembourg and abroad.
• Customer funds (assets under management - AuM) increased by 6.7% to 32.8 billion, compared to 30.8 billion at the end of 2014. This change resulted from net new inflows amounting to 0.7 billion and a positive market effect of 1.3 billion.
• Customer loans saw an increase of 5.7% to 11.5 billion compared with 10.8 billion at year-end 2014. BIL has once again confirmed its support to the Luxembourg economy, particularly for corporate and individual customers.
Profitability confirmed
BIL reported a pre-tax income of 130 million in 2015, up 38% as compared to June 2014 (94 million), exceeding 2015
expectations. This result reveals a solid performance from commercial banking activities (+6 million compared with 2014) despite a substantial decrease in financial markets’ contribution (4 million capital gains in 2015 versus 34 million last year). The high contribution of Group Center in 2015 for 58 million (+ 52 million) is mainly due to 66.6 million generated by the sale of Luxempart in January 2015.
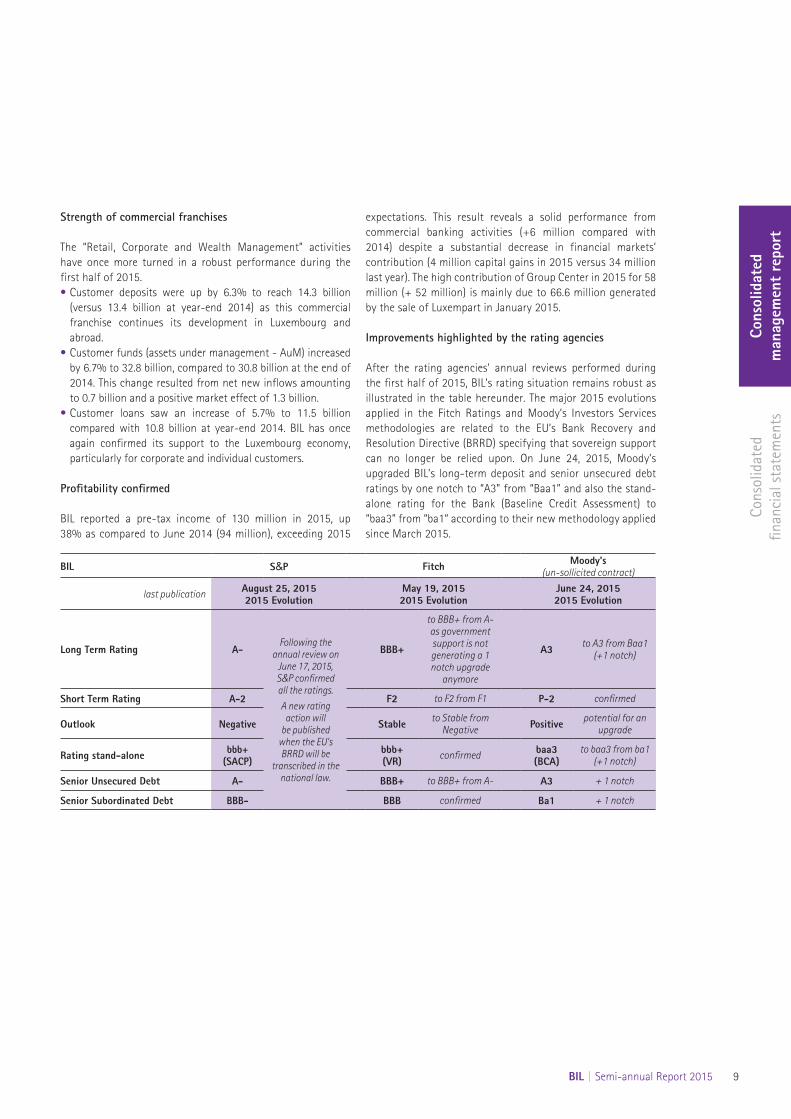
Improvements highlighted by the rating agencies
After the rating agencies’ annual reviews performed during the first half of 2015, BIL’s rating situation remains robust as illustrated in the table hereunder. The major 2015 evolutions applied in the Fitch Ratings and Moody’s Investors Services methodologies are related to the EU’s Bank Recovery and Resolution Directive (BRRD) specifying that sovereign support can no longer be relied upon. On June 24, 2015, Moody’s upgraded BIL’s long-term deposit and senior unsecured debt ratings by one notch to “A3” from “Baa1” and also the stand-alone rating for the Bank (Baseline Credit Assessment) to “baa3” from “ba1“ according to their new methodology applied since March 2015.
BIL S&P Fitch Moody's(un-sollicited contract)
last publication August 25, 20152015 Evolution
May 19, 20152015 Evolution
June 24, 20152015 Evolution
Long Term Rating A-Following the
annual review on June 17, 2015, S&P confirmed all the ratings.A new rating
action will be published
when the EU’s BRRD will be
transcribed in the national law.
BBB+
to BBB+ from A- as government support is not generating a 1 notch upgrade
anymore
A3 to A3 from Baa1 (+1 notch)
Short Term Rating A-2 F2 to F2 from F1 P-2 confirmed
Outlook Negative Stable to Stable from Negative Positive potential for an
upgrade
Rating stand-alone bbb+ (SACP)
bbb+(VR) confirmed baa3
(BCA)to baa3 from ba1
(+1 notch)
Senior Unsecured Debt A- BBB+ to BBB+ from A- A3 + 1 notch
Senior Subordinated Debt BBB- BBB confirmed Ba1 + 1 notch
Cons
olid
ated
m
anag
emen
t re
port
Cons
olid
ated
fin
anci
al s
tate
men
ts
10 BIL | Semi-annual Report 2015
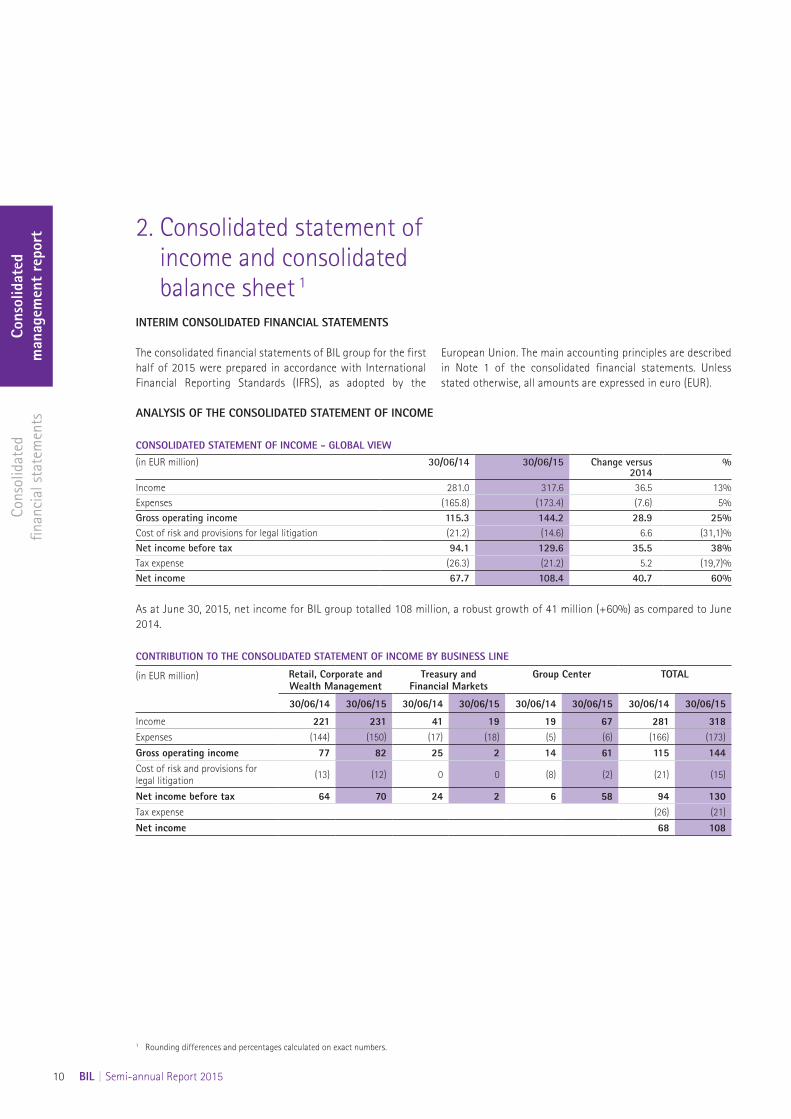
2. Consolidated statement of income and consolidated balance sheet 1
INTERIM CONSOLIDATED FINANCIAL STATEMENTS
The consolidated financial statements of BIL group for the first half of 2015 were prepared in accordance with International Financial Reporting Standards (IFRS), as adopted by the
European Union. The main accounting principles are described in Note 1 of the consolidated financial statements. Unless stated otherwise, all amounts are expressed in euro (EUR).
ANALYSIS OF THE CONSOLIDATED STATEMENT OF INCOME
CONSOLIDATED STATEMENT OF INCOME - GLOBAL VIEW
(in EUR million) 30/06/14 30/06/15 Change versus2014
%
Income 281.0 317.6 36.5 13%Expenses (165.8) (173.4) (7.6) 5%Gross operating income 115.3 144.2 28.9 25%Cost of risk and provisions for legal litigation (21.2) (14.6) 6.6 (31,1)%Net income before tax 94.1 129.6 35.5 38%Tax expense (26.3) (21.2) 5.2 (19,7)%Net income 67.7 108.4 40.7 60%
As at June 30, 2015, net income for BIL group totalled 108 million, a robust growth of 41 million (+60%) as compared to June 2014.
CONTRIBUTION TO THE CONSOLIDATED STATEMENT OF INCOME BY BUSINESS LINE
(in EUR million) Retail, Corporate andWealth Management
Treasury and Financial Markets
Group Center TOTAL
30/06/14 30/06/15 30/06/14 30/06/15 30/06/14 30/06/15 30/06/14 30/06/15
Income 221 231 41 19 19 67 281 318Expenses (144) (150) (17) (18) (5) (6) (166) (173)
Gross operating income 77 82 25 2 14 61 115 144Cost of risk and provisions for legal litigation (13) (12) 0 0 (8) (2) (21) (15)
Net income before tax 64 70 24 2 6 58 94 130Tax expense (26) (21)
Net income 68 108
1 Rounding differences and percentages calculated on exact numbers.
Cons
olid
ated
m
anag
emen
t re
port
Cons
olid
ated
fin
anci
al s
tate
men
ts
BIL | Semi-annual Report 2015 11
Income
Suitable income growth of 37 million (+13%) was supported by the commercial activities as well as by Group Center and confirms the performance already observed during the last two years.
Income from “Retail, Corporate and Wealth Management” activities reached 231 million, up 10 million compared to 2014 (+5%) despite a difficult macroeconomic environment. Assets under Management (AuM) have increased markedly by 6.7% during the first half of 2015, resulting in the correlated evolution of fee and commission income by 7 million. Outstanding loans to customers have increased by 5.7% (+0.6 billion) in the three business lines and accordingly permitted to maintain the level of interest income (128 million) despite a low interest rate environment.
“Treasury and Financial Markets” income decreased by 22 million compared to the first half of 2014, amounting 19 million. The outstanding amount in the bond portfolio stood at 5.8 billion, generating income of 29 million (-2 million compared with 2014). Treasury and Financial Markets desks also contributed 13 million to the income (+4 million compared with 2014) through their active management of the Bank's surplus liquidity, Forex and Correspondent Banking activities. Assets and Liabilities Management contribution regressed by 25 million due to lower capital gains as the Bank maintains a very prudent approach with regards to long term interest rate exposure in a historically low interest rate environment.
"Group Center" activities generated an income of 67 million in 2015, soaring by 48 million compared to 2014. The major element of 2015 income was the capital gains related to the sale of Luxempart announced in January 2015 (+66.6 million). This positive impact was slightly reduced by the provisioning of the first contribution to the “Fonds de garantie des dépôts Luxembourg” and to the “Fonds de resolution Luxembourg” (-3.8 million at the end of June 2015).
Expenses
General expenses totalled 173 million for the first half of 2015, up 5% compared with 2014, mainly explained by commercial activities (+6 million compared to 2014) especially in the Wealth Management segment (5 million). These evolutions are induced by the development of the commercial franchise (e.g BIL Manage Invest, Belair House, Dubai branch). Nevertheless, commercial activities’ cost-income ratio remained stable in 2015 at 65%.
Gross operating income
Gross operating income amounted to 144 million, up 29 million compared with 115 million in 2014, of which 82 million (+5 million versus 2014) from commercial activities, 2 million (-23 million) from financial market activities and 61 million (+47 million) from Group Center.
Cost of risk and impairments
BIL group recorded net provisions on loans and advances of 15 million compared with 21 million in 2014. In 2015, specific value adjustments on loans reached 12 million (7 million in 2014) in accordance with the Bank’s cautious provisioning policy. The Bank posted 3 additional million of collective impairments on its loan books. During the first half of 2014, the Bank added 15 million of collective impairments in anticipation of the Asset Quality Review (AQR) and Stress Test exercises. Impaired loans as a percentage of total loans outstanding amounted to 2.94% in June 2015 versus 2.91% in June 2014, proving the good quality of the Bank’s assets.
Net income before tax
Net income before tax stood at 130 million compared with 94 million in 2014 (+36 million, i.e. +38%).
Tax
The 2015 tax expenses of 21 million correspond to the breakdown of taxable income between the various BIL group entities in jurisdictions with different taxation rates. The level of tax expenses is below 2014, influenced by the non-taxable capital gain of the Luxempart sale.
Net income
At the end of the first half of the year, the Bank generated a good performance with a net profit of 108 million. The Bank reconfirmed its high profitability driven by strategic initiatives and a solid commercial franchise.
Cons
olid
ated
m
anag
emen
t re
port
Cons
olid
ated
fin
anci
al s
tate
men
ts
12 BIL | Semi-annual Report 2015
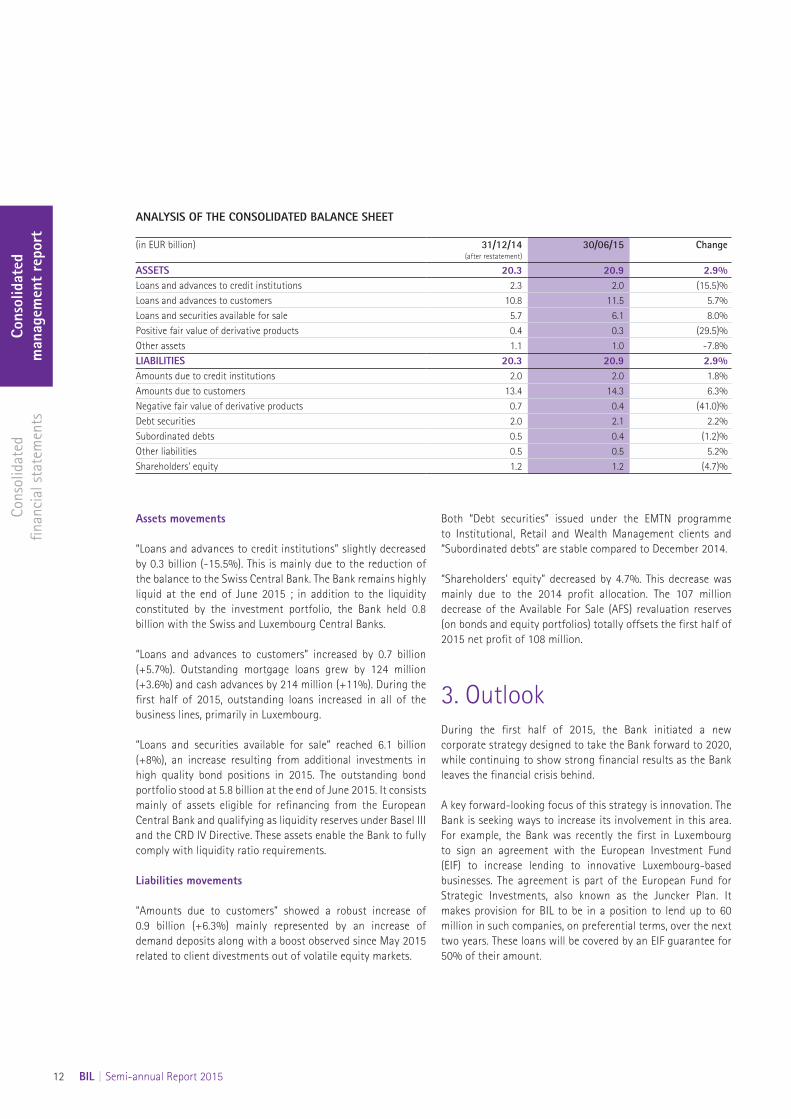
ANALYSIS OF THE CONSOLIDATED BALANCE SHEET
(in EUR billion) 31/12/14(after restatement)
30/06/15 Change
ASSETS 20.3 20.9 2.9%Loans and advances to credit institutions 2.3 2.0 (15.5)%Loans and advances to customers 10.8 11.5 5.7%Loans and securities available for sale 5.7 6.1 8.0%Positive fair value of derivative products 0.4 0.3 (29.5)%Other assets 1.1 1.0 -7.8%LIABILITIES 20.3 20.9 2.9%Amounts due to credit institutions 2.0 2.0 1.8%Amounts due to customers 13.4 14.3 6.3%Negative fair value of derivative products 0.7 0.4 (41.0)%Debt securities 2.0 2.1 2.2%Subordinated debts 0.5 0.4 (1.2)%Other liabilities 0.5 0.5 5.2%Shareholders' equity 1.2 1.2 (4.7)%
Assets movements
“Loans and advances to credit institutions” slightly decreased by 0.3 billion (-15.5%). This is mainly due to the reduction of the balance to the Swiss Central Bank. The Bank remains highly liquid at the end of June 2015 ; in addition to the liquidity constituted by the investment portfolio, the Bank held 0.8 billion with the Swiss and Luxembourg Central Banks.
“Loans and advances to customers” increased by 0.7 billion (+5.7%). Outstanding mortgage loans grew by 124 million (+3.6%) and cash advances by 214 million (+11%). During the first half of 2015, outstanding loans increased in all of the business lines, primarily in Luxembourg.
“Loans and securities available for sale” reached 6.1 billion (+8%), an increase resulting from additional investments in high quality bond positions in 2015. The outstanding bond portfolio stood at 5.8 billion at the end of June 2015. It consists mainly of assets eligible for refinancing from the European Central Bank and qualifying as liquidity reserves under Basel III and the CRD IV Directive. These assets enable the Bank to fully comply with liquidity ratio requirements.
Liabilities movements
“Amounts due to customers” showed a robust increase of 0.9 billion (+6.3%) mainly represented by an increase of demand deposits along with a boost observed since May 2015 related to client divestments out of volatile equity markets.
Both “Debt securities” issued under the EMTN programme to Institutional, Retail and Wealth Management clients and “Subordinated debts” are stable compared to December 2014.
“Shareholders’ equity” decreased by 4.7%. This decrease was mainly due to the 2014 profit allocation. The 107 million decrease of the Available For Sale (AFS) revaluation reserves (on bonds and equity portfolios) totally offsets the first half of 2015 net profit of 108 million.
3. OutlookDuring the first half of 2015, the Bank initiated a new corporate strategy designed to take the Bank forward to 2020, while continuing to show strong financial results as the Bank leaves the financial crisis behind.
A key forward-looking focus of this strategy is innovation. The Bank is seeking ways to increase its involvement in this area. For example, the Bank was recently the first in Luxembourg to sign an agreement with the European Investment Fund (EIF) to increase lending to innovative Luxembourg-based businesses. The agreement is part of the European Fund for Strategic Investments, also known as the Juncker Plan. It makes provision for BIL to be in a position to lend up to 60 million in such companies, on preferential terms, over the next two years. These loans will be covered by an EIF guarantee for 50% of their amount.
Cons
olid
ated
m
anag
emen
t re
port
Cons
olid
ated
fin
anci
al s
tate
men
ts
BIL | Semi-annual Report 2015 13
1. Key events of 2015Corporate structure and risk profile
Since end of 2014, important strategic initiatives have been undertaken at a group-wide level, thus naturally impacting BIL group’s corporate structure and risk profile. All those initiatives have been carefully followed by the Bank’s Risk Management department whose main objective is to guide their implementation by ensuring, on an on-going basis, that the related risks are under control and compatible with the institution’s risk appetite.
Main events having impacted the Bank’s risk profile evolution during the first half of 2015 are described in the management report in section “Business Review and Results”.
Regulatory environment
The Risk Management department continues to implement the Basel III requirements, as transposed within the EU legislation through the CRD IV/CRR package as well as the Bank Recovery and Resolution Directive (BRRD). Those requirements have significant repercussions on the Bank’s strategy and overall risk profile perception; their implementation thus needs to be carefully monitored internally.
The publication by the European Banking Authority (EBA), in June 2015, of Implementing Technical Standards (ITS) related to the supervisory reporting of the liquidity coverage ratio (LCR) as well as disclosure and supervisory reporting of the leverage ratio, submitted to the European Commission for approval, are part of the topics still to be achieved internally in the context of the CRR/CRD IV implementation.
Moreover, the BRRD is being further complemented by technical rules developed by the EBA on a number of subjects including, among other things, concrete information requirements for recovery and resolution plans and securing accurate valuations of assets and losses at the point of resolution. BIL will consequently amend its recovery plan in order to enhance its overall efficiency under adverse circumstances.
2. Credit risk Credit risk exposure is measured using the internal Maximum Credit Risk Exposure (MCRE) metric, which comprises: • The net carrying value of balance sheet assets other than
derivative products (i.e. the carrying value after deduction of specific provisions);
• The mark-to-market valuation of derivative products; • Total off-balance sheet commitments. The total commitment
corresponds to unused lines of liquidity and to the maximum amount that BIL is committed to as a result of guarantees issued to third parties.
The substitution principle applies where the credit risk exposure is guaranteed by a third party whose risk weighting is lower. Therefore, counterparties presented hereafter are final counterparties, i.e. after taking into account the eligible guarantees.
As at the end of June 2015, the Bank’s total credit risk exposure amounted to 21.7 billion, compared to 20.2 billion at the end of 2014. This increase is explained by a larger exposure to financial institutions and by the positive evolution of recurring activities, especially in Luxembourg.
The tables below illustrate such evolution, broken down according to both geographic and counterparty type axes.
Risk Management
Cons
olid
ated
m
anag
emen
t re
port
Cons
olid
ated
fin
anci
al s
tate
men
ts
14 BIL | Semi-annual Report 2015
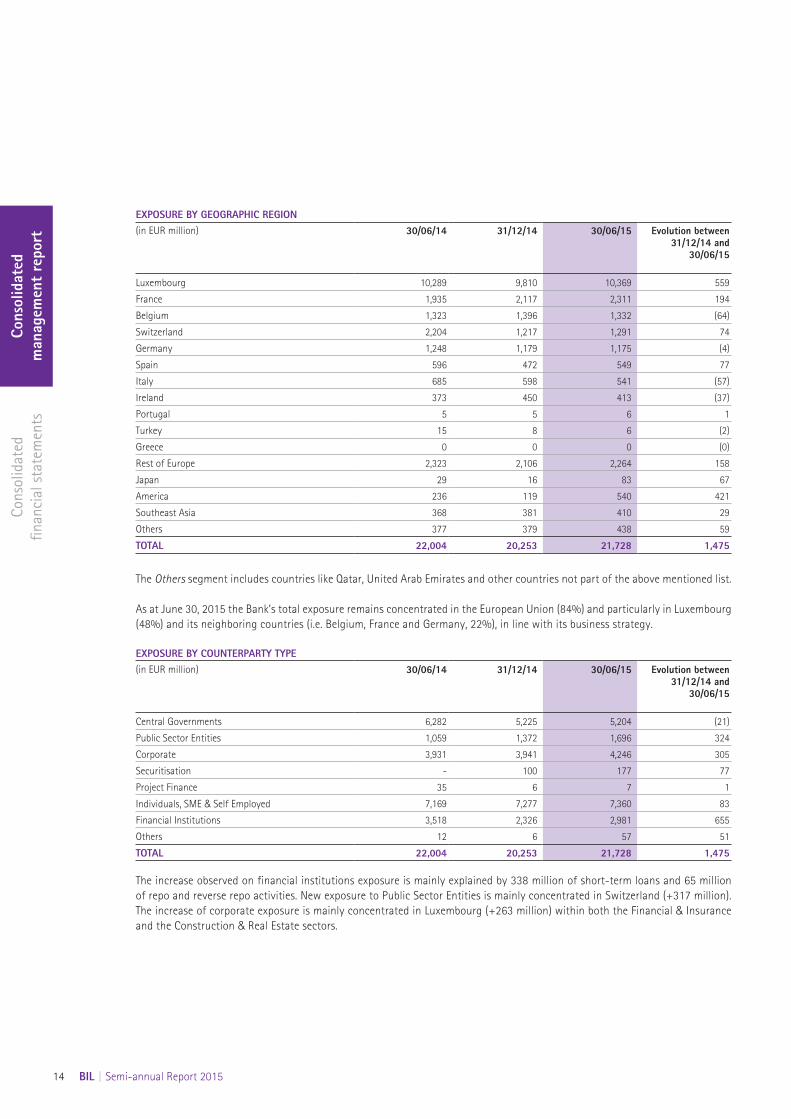
EXPOSURE BY GEOGRAPHIC REGION(in EUR million) 30/06/14 31/12/14 30/06/15 Evolution between
31/12/14 and 30/06/15
Luxembourg 10,289 9,810 10,369 559
France 1,935 2,117 2,311 194
Belgium 1,323 1,396 1,332 (64)
Switzerland 2,204 1,217 1,291 74
Germany 1,248 1,179 1,175 (4)
Spain 596 472 549 77
Italy 685 598 541 (57)
Ireland 373 450 413 (37)
Portugal 5 5 6 1
Turkey 15 8 6 (2)
Greece 0 0 0 (0)
Rest of Europe 2,323 2,106 2,264 158
Japan 29 16 83 67
America 236 119 540 421
Southeast Asia 368 381 410 29
Others 377 379 438 59
TOTAL 22,004 20,253 21,728 1,475
The Others segment includes countries like Qatar, United Arab Emirates and other countries not part of the above mentioned list.
As at June 30, 2015 the Bank’s total exposure remains concentrated in the European Union (84%) and particularly in Luxembourg (48%) and its neighboring countries (i.e. Belgium, France and Germany, 22%), in line with its business strategy.
EXPOSURE BY COUNTERPARTY TYPE(in EUR million) 30/06/14 31/12/14 30/06/15 Evolution between
31/12/14 and 30/06/15
Central Governments 6,282 5,225 5,204 (21)
Public Sector Entities 1,059 1,372 1,696 324
Corporate 3,931 3,941 4,246 305
Securitisation - 100 177 77
Project Finance 35 6 7 1
Individuals, SME & Self Employed 7,169 7,277 7,360 83
Financial Institutions 3,518 2,326 2,981 655
Others 12 6 57 51
TOTAL 22,004 20,253 21,728 1,475
The increase observed on financial institutions exposure is mainly explained by 338 million of short-term loans and 65 million of repo and reverse repo activities. New exposure to Public Sector Entities is mainly concentrated in Switzerland (+317 million). The increase of corporate exposure is mainly concentrated in Luxembourg (+263 million) within both the Financial & Insurance and the Construction & Real Estate sectors.
Cons
olid
ated
m
anag
emen
t re
port
Cons
olid
ated
fin
anci
al s
tate
men
ts
BIL | Semi-annual Report 2015 15
1 Economies of Portugal, Italy, Ireland, Greece and Spain.
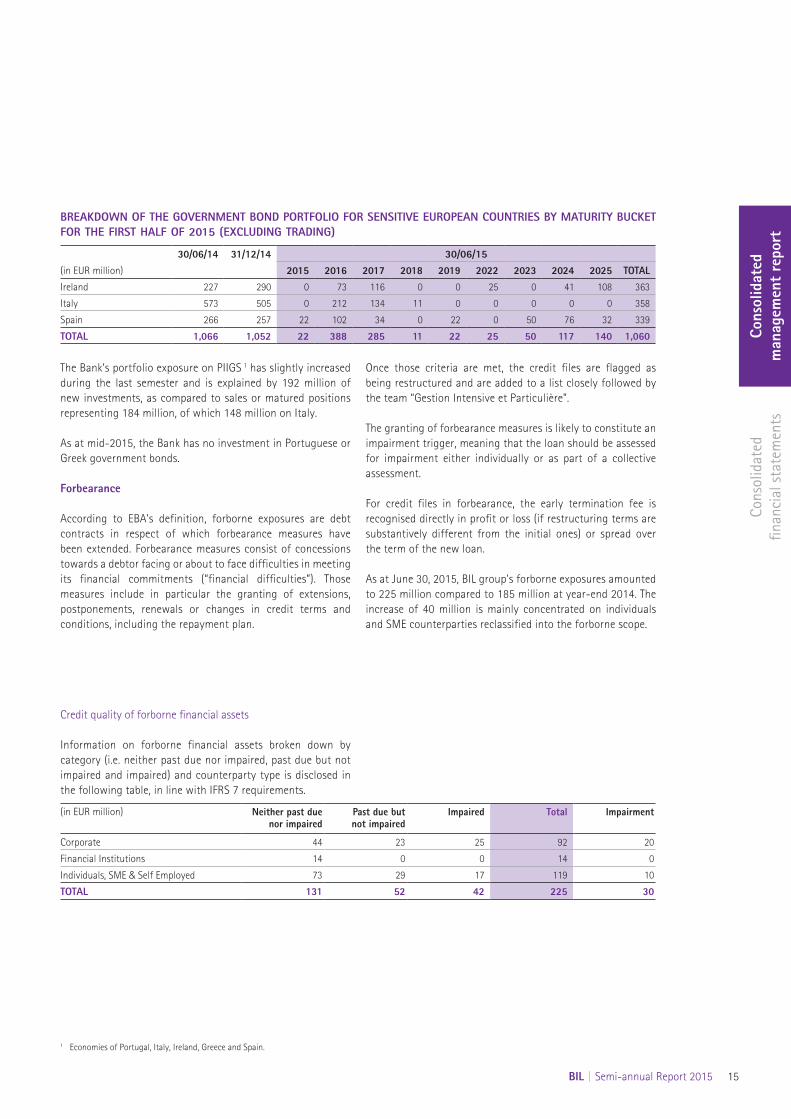
BREAKDOWN OF THE GOVERNMENT BOND PORTFOLIO FOR SENSITIVE EUROPEAN COUNTRIES BY MATURITY BUCKET FOR THE FIRST HALF OF 2015 (EXCLUDING TRADING)
30/06/14 31/12/14 30/06/15(in EUR million) 2015 2016 2017 2018 2019 2022 2023 2024 2025 TOTALIreland 227 290 0 73 116 0 0 25 0 41 108 363
Italy 573 505 0 212 134 11 0 0 0 0 0 358
Spain 266 257 22 102 34 0 22 0 50 76 32 339
TOTAL 1,066 1,052 22 388 285 11 22 25 50 117 140 1,060
The Bank’s portfolio exposure on PIIGS 1 has slightly increased during the last semester and is explained by 192 million of new investments, as compared to sales or matured positions representing 184 million, of which 148 million on Italy.
As at mid-2015, the Bank has no investment in Portuguese or Greek government bonds.
Forbearance
According to EBA’s definition, forborne exposures are debt contracts in respect of which forbearance measures have been extended. Forbearance measures consist of concessions towards a debtor facing or about to face difficulties in meeting its financial commitments (“financial difficulties”). Those measures include in particular the granting of extensions, postponements, renewals or changes in credit terms and conditions, including the repayment plan.
Once those criteria are met, the credit files are flagged as being restructured and are added to a list closely followed by the team “Gestion Intensive et Particulière”.
The granting of forbearance measures is likely to constitute an impairment trigger, meaning that the loan should be assessed for impairment either individually or as part of a collective assessment.
For credit files in forbearance, the early termination fee is recognised directly in profit or loss (if restructuring terms are substantively different from the initial ones) or spread over the term of the new loan.
As at June 30, 2015, BIL group's forborne exposures amounted to 225 million compared to 185 million at year-end 2014. The increase of 40 million is mainly concentrated on individuals and SME counterparties reclassified into the forborne scope.
Credit quality of forborne financial assets
Information on forborne financial assets broken down by category (i.e. neither past due nor impaired, past due but not impaired and impaired) and counterparty type is disclosed in the following table, in line with IFRS 7 requirements.
(in EUR million) Neither past due nor impaired
Past due but not impaired
Impaired Total Impairment
Corporate 44 23 25 92 20
Financial Institutions 14 0 0 14 0
Individuals, SME & Self Employed 73 29 17 119 10
TOTAL 131 52 42 225 30
Cons
olid
ated
m
anag
emen
t re
port
Cons
olid
ated
fin
anci
al s
tate
men
ts
16 BIL | Semi-annual Report 2015
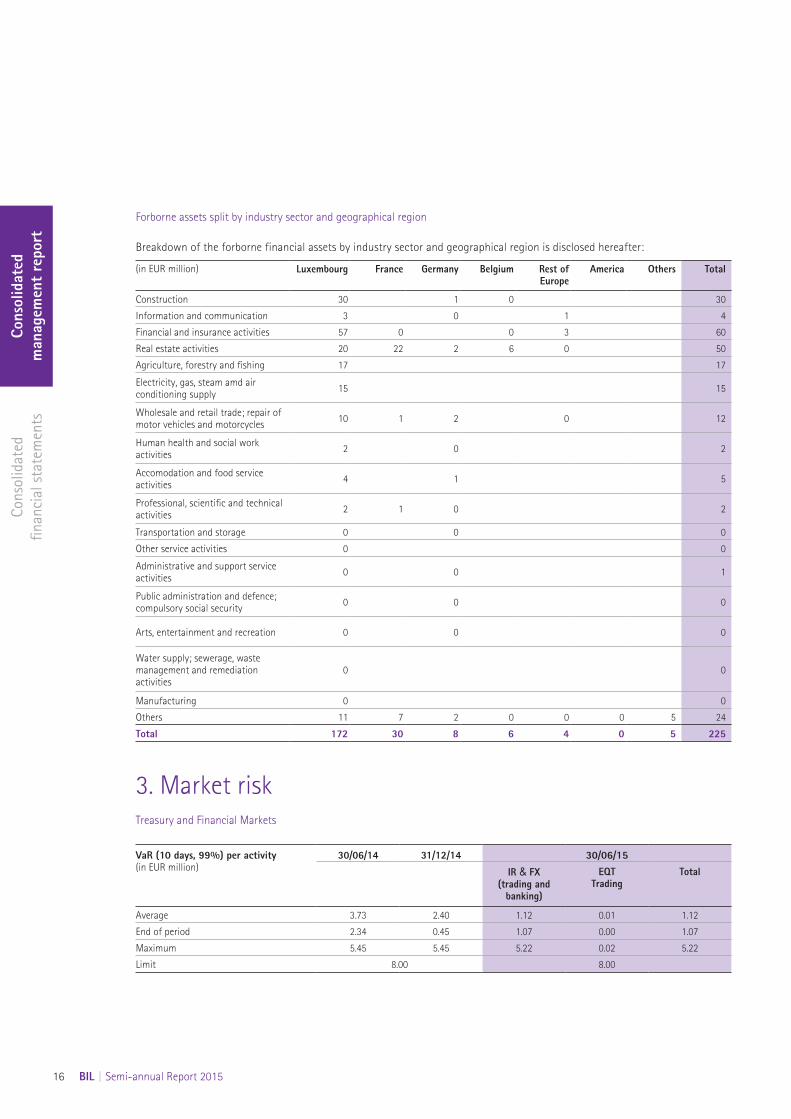
Forborne assets split by industry sector and geographical region
Breakdown of the forborne financial assets by industry sector and geographical region is disclosed hereafter:
(in EUR million) Luxembourg France Germany Belgium Rest of Europe
America Others Total
Construction 30 1 0 30
Information and communication 3 0 1 4
Financial and insurance activities 57 0 0 3 60
Real estate activities 20 22 2 6 0 50
Agriculture, forestry and fishing 17 17
Electricity, gas, steam amd air conditioning supply 15 15
Wholesale and retail trade; repair of motor vehicles and motorcycles 10 1 2 0 12
Human health and social work activities 2 0 2
Accomodation and food service activities 4 1 5
Professional, scientific and technical activities 2 1 0 2
Transportation and storage 0 0 0
Other service activities 0 0
Administrative and support service activities 0 0 1
Public administration and defence; compulsory social security 0 0 0
Arts, entertainment and recreation 0 0 0
Water supply; sewerage, waste management and remediation activities
0 0
Manufacturing 0 0
Others 11 7 2 0 0 0 5 24
Total 172 30 8 6 4 0 5 225
3. Market risk Treasury and Financial Markets
VaR (10 days, 99%) per activity(in EUR million)
30/06/14 31/12/14 30/06/15
IR & FX (trading and
banking)
EQT Trading
Total
Average 3.73 2.40 1.12 0.01 1.12
End of period 2.34 0.45 1.07 0.00 1.07
Maximum 5.45 5.45 5.22 0.02 5.22
Limit 8.00 8.00
Cons
olid
ated
m
anag
emen
t re
port
Cons
olid
ated
fin
anci
al s
tate
men
ts
BIL | Semi-annual Report 2015 17
Throughout last year, the average Value at Risk dropped continuously due to both a decrease of the interest rates levels and volatility, especially on the two and three years maturity buckets, and to a change in the Value at Risk calculation methodology. The modifications in the Value at Risk calculation methodology have been made for the treasury activity of BIL Luxembourg and BIL Switzerland. This decision was taken due to an increase in short term interest rate volatility for the Swiss currency following the action of the Swiss National Bank (SNB) to unpeg the CHF in January 2015. The corresponding methodological evolution concerns the use of an absolute return based model as compared to the previous relative return based model. The end of period Value at Risk of 2015 is on an upward trend due to an increase of EUR interest rates since the end of April 2015.
Investment Portfolio
BIL continued its investments in the portfolio during the first half of 2015.
The interest rate risk of the investment portfolio is transferred and managed by the Treasury department or by the ALM department, depending on various criteria (i.e. maturity, sector).
The investment bond portfolios have a total nominal exposure of 5.5 billion as at June 30, 2015 (against 4.9 billion as at December 31, 2014).
The majority of the bonds are classified in the AFS portfolio: 5.4 billion as at June 30, 2015 (against 4.8 billion as at December 31, 2014). The remaining part of 120 million (158 million as at December 31, 2014) is classified in the Held To Maturity (HTM) portfolio.
As far as the AFS bond portfolio is concerned, the sensitivity of the fair value (and the AFS reserve) to a one basis point widening of the spread was -2.8 million as at June 30, 2015 (compared with –2.7 million per basis point as at December 31, 2014).
The following table discloses the sensitivity of the investment portfolio including the AFS and HTM books.
Notional amount Rate bpv Spread bpv(in EUR million) 30/06/14 31/12/14 30/06/15 30/06/14 31/12/14 30/06/15 30/06/14 31/12/14 30/06/15Treasury 2,613 2,323 2,488 (0.19) (0.15) (0.14) (0.85) (0.81) (0.83 )
ALM 2,167 2,588 3,007 (0.57) (0.23) (1.01) (1.59) (1.98) (2.10 )
4. Asset qualityBoth the Bank’s loan portfolio size (including impaired and non-impaired loans to customers) and the level of specific provisions have increased during the first half of 2015.
(in EUR million) 30/06/14 31/12/14 30/06/15Gross amount of non-impaired loans to customers 10,054 10,807 11,415
Gross amount of impaired loans to customers 301 314 345
Specific provisions 235 256 276
Asset quality ratio 2.91% 2.83% 2.94%
Coverage ratio 77.93% 81.46% 79.97%
As at end of June 2015, the impaired loans and advances to customers amounted to 345 million, corresponding to a relative increase of 9.8% as compared with the previous period. Specific provisions increased only by 7.81%, which explains the slight decrease of the BIL’s coverage ratio to a still sound level of 79.97%.
The asset quality ratio as at June 30, 2015 slightly increased compared to end of 2014.
5. Solvency monitoring See Note 8 of the consolidated financial statements.

Consolidated financial statements(unaudited)
Consolidated balance sheet 20
Consolidated statement of income 21
Consolidated statement of comprehensive income 22
Consolidated statement of changes in equity 23
Consolidated cash flow statement 25
Notes to the consolidated financial statements 26
Cons
olid
ated
m
anag
emen
t re
port
Cons
olid
ated
fin
anci
al s
tate
men
ts
20 BIL | Semi-annual Report 2015
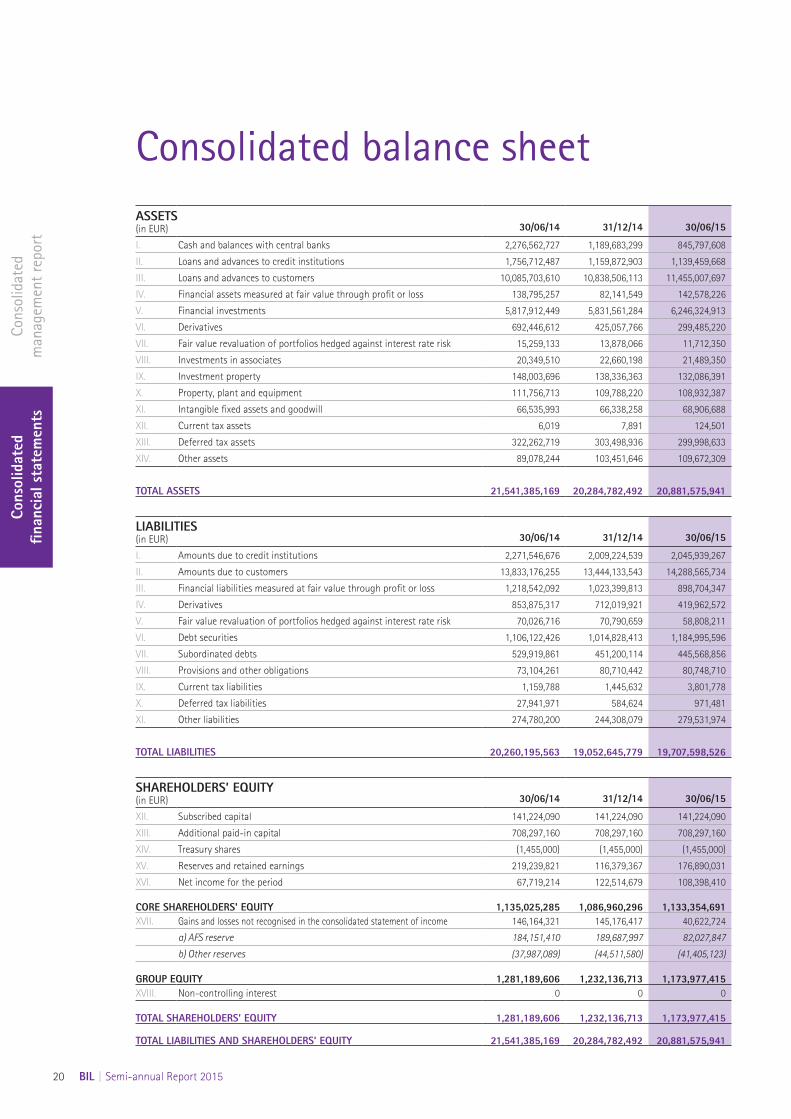
Consolidated balance sheetASSETS (in EUR) 30/06/14 31/12/14 30/06/15
I. Cash and balances with central banks 2,276,562,727 1,189,683,299 845,797,608
II. Loans and advances to credit institutions 1,756,712,487 1,159,872,903 1,139,459,668
III. Loans and advances to customers 10,085,703,610 10,838,506,113 11,455,007,697
IV. Financial assets measured at fair value through profit or loss 138,795,257 82,141,549 142,578,226
V. Financial investments 5,817,912,449 5,831,561,284 6,246,324,913
VI. Derivatives 692,446,612 425,057,766 299,485,220
VII. Fair value revaluation of portfolios hedged against interest rate risk 15,259,133 13,878,066 11,712,350
VIII. Investments in associates 20,349,510 22,660,198 21,489,350
IX. Investment property 148,003,696 138,336,363 132,086,391
X. Property, plant and equipment 111,756,713 109,788,220 108,932,387
XI. Intangible fixed assets and goodwill 66,535,993 66,338,258 68,906,688
XII. Current tax assets 6,019 7,891 124,501
XIII. Deferred tax assets 322,262,719 303,498,936 299,998,633
XIV. Other assets 89,078,244 103,451,646 109,672,309
TOTAL ASSETS 21,541,385,169 20,284,782,492 20,881,575,941
LIABILITIES (in EUR) 30/06/14 31/12/14 30/06/15
I. Amounts due to credit institutions 2,271,546,676 2,009,224,539 2,045,939,267
II. Amounts due to customers 13,833,176,255 13,444,133,543 14,288,565,734
III. Financial liabilities measured at fair value through profit or loss 1,218,542,092 1,023,399,813 898,704,347
IV. Derivatives 853,875,317 712,019,921 419,962,572
V. Fair value revaluation of portfolios hedged against interest rate risk 70,026,716 70,790,659 58,808,211
VI. Debt securities 1,106,122,426 1,014,828,413 1,184,995,596
VII. Subordinated debts 529,919,861 451,200,114 445,568,856
VIII. Provisions and other obligations 73,104,261 80,710,442 80,748,710
IX. Current tax liabilities 1,159,788 1,445,632 3,801,778
X. Deferred tax liabilities 27,941,971 584,624 971,481
XI. Other liabilities 274,780,200 244,308,079 279,531,974
TOTAL LIABILITIES 20,260,195,563 19,052,645,779 19,707,598,526
SHAREHOLDERS’ EQUITY (in EUR) 30/06/14 31/12/14 30/06/15
XII. Subscribed capital 141,224,090 141,224,090 141,224,090
XIII. Additional paid-in capital 708,297,160 708,297,160 708,297,160
XIV. Treasury shares (1,455,000) (1,455,000) (1,455,000)
XV. Reserves and retained earnings 219,239,821 116,379,367 176,890,031
XVI. Net income for the period 67,719,214 122,514,679 108,398,410
CORE SHAREHOLDERS' EQUITY 1,135,025,285 1,086,960,296 1,133,354,691XVII. Gains and losses not recognised in the consolidated statement of income 146,164,321 145,176,417 40,622,724
a) AFS reserve 184,151,410 189,687,997 82,027,847
b) Other reserves (37,987,089) (44,511,580) (41,405,123)
GROUP EQUITY 1,281,189,606 1,232,136,713 1,173,977,415XVIII. Non-controlling interest 0 0 0
TOTAL SHAREHOLDERS’ EQUITY 1,281,189,606 1,232,136,713 1,173,977,415
TOTAL LIABILITIES AND SHAREHOLDERS’ EQUITY 21,541,385,169 20,284,782,492 20,881,575,941
Cons
olid
ated
m
anag
emen
t re
port
Cons
olid
ated
fin
anci
al s
tate
men
ts
BIL | Semi-annual Report 2015 21
The notes are an integral part of these consolidated financial statements.
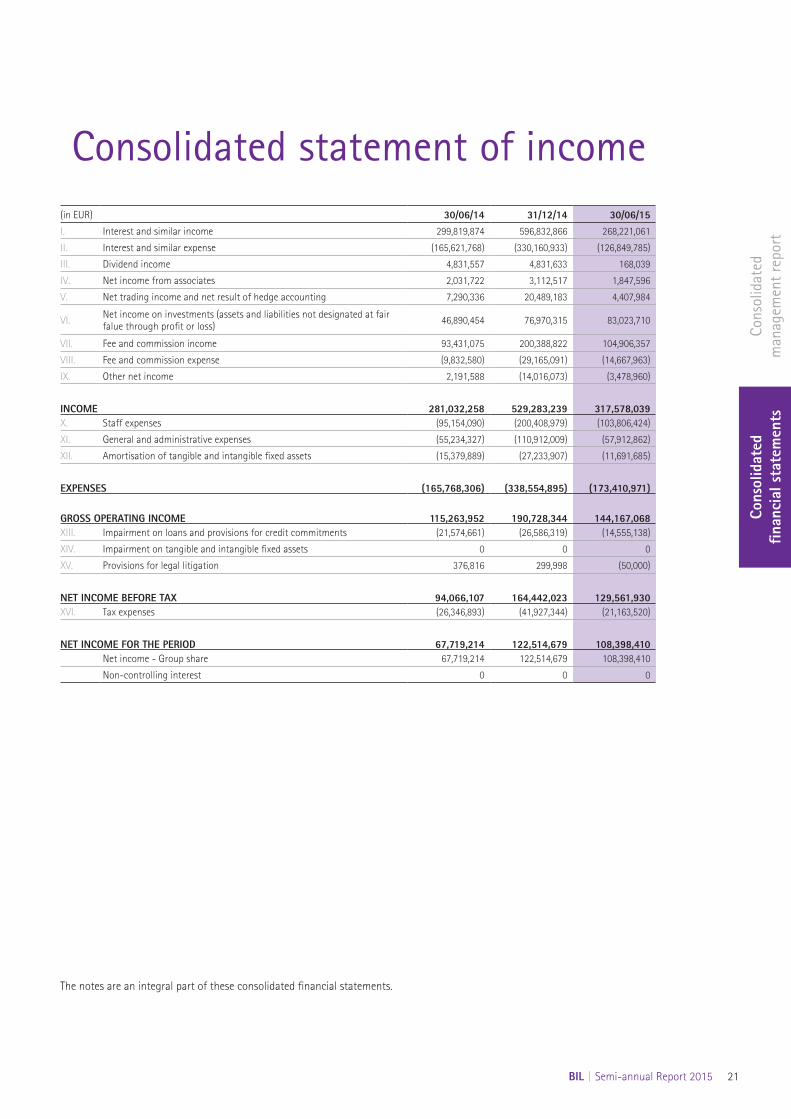
(in EUR) 30/06/14 31/12/14 30/06/15I. Interest and similar income 299,819,874 596,832,866 268,221,061
II. Interest and similar expense (165,621,768) (330,160,933) (126,849,785)
III. Dividend income 4,831,557 4,831,633 168,039
IV. Net income from associates 2,031,722 3,112,517 1,847,596
V. Net trading income and net result of hedge accounting 7,290,336 20,489,183 4,407,984
VI. Net income on investments (assets and liabilities not designated at fair falue through profit or loss) 46,890,454 76,970,315 83,023,710
VII. Fee and commission income 93,431,075 200,388,822 104,906,357
VIII. Fee and commission expense (9,832,580) (29,165,091) (14,667,963)
IX. Other net income 2,191,588 (14,016,073) (3,478,960)
INCOME 281,032,258 529,283,239 317,578,039X. Staff expenses (95,154,090) (200,408,979) (103,806,424)
XI. General and administrative expenses (55,234,327) (110,912,009) (57,912,862)
XII. Amortisation of tangible and intangible fixed assets (15,379,889) (27,233,907) (11,691,685)
EXPENSES (165,768,306) (338,554,895) (173,410,971)
GROSS OPERATING INCOME 115,263,952 190,728,344 144,167,068XIII. Impairment on loans and provisions for credit commitments (21,574,661) (26,586,319) (14,555,138)
XIV. Impairment on tangible and intangible fixed assets 0 0 0
XV. Provisions for legal litigation 376,816 299,998 (50,000)
NET INCOME BEFORE TAX 94,066,107 164,442,023 129,561,930XVI. Tax expenses (26,346,893) (41,927,344) (21,163,520)
NET INCOME FOR THE PERIOD 67,719,214 122,514,679 108,398,410Net income - Group share 67,719,214 122,514,679 108,398,410
Non-controlling interest 0 0 0
Consolidated statement of income
Cons
olid
ated
m
anag
emen
t re
port
Cons
olid
ated
fin
anci
al s
tate
men
ts
22 BIL | Semi-annual Report 2015
The notes are an integral part of these consolidated financial statements.
(in EUR) 30/06/14 31/12/14 30/06/15
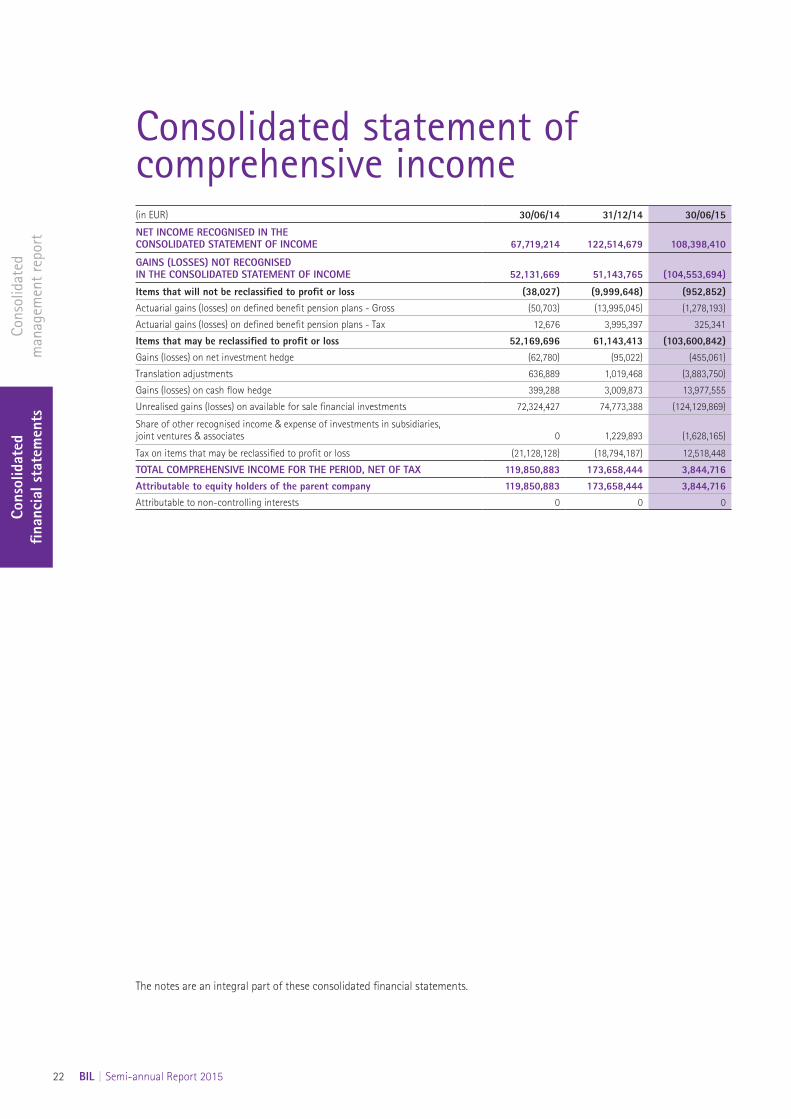
NET INCOME RECOGNISED IN THE CONSOLIDATED STATEMENT OF INCOME 67,719,214 122,514,679 108,398,410
GAINS (LOSSES) NOT RECOGNISED IN THE CONSOLIDATED STATEMENT OF INCOME 52,131,669 51,143,765 (104,553,694)
Items that will not be reclassified to profit or loss (38,027) (9,999,648) (952,852)Actuarial gains (losses) on defined benefit pension plans - Gross (50,703) (13,995,045) (1,278,193)
Actuarial gains (losses) on defined benefit pension plans - Tax 12,676 3,995,397 325,341
Items that may be reclassified to profit or loss 52,169,696 61,143,413 (103,600,842)Gains (losses) on net investment hedge (62,780) (95,022) (455,061)
Translation adjustments 636,889 1,019,468 (3,883,750)
Gains (losses) on cash flow hedge 399,288 3,009,873 13,977,555
Unrealised gains (losses) on available for sale financial investments 72,324,427 74,773,388 (124,129,869)
Share of other recognised income & expense of investments in subsidiaries, joint ventures & associates 0 1,229,893 (1,628,165)
Tax on items that may be reclassified to profit or loss (21,128,128) (18,794,187) 12,518,448
TOTAL COMPREHENSIVE INCOME FOR THE PERIOD, NET OF TAX 119,850,883 173,658,444 3,844,716Attributable to equity holders of the parent company 119,850,883 173,658,444 3,844,716Attributable to non-controlling interests 0 0 0
Consolidated statement of comprehensive income
Cons
olid
ated
m
anag
emen
t re
port
Cons
olid
ated
fin
anci
al s
tate
men
ts
BIL | Semi-annual Report 2015 23
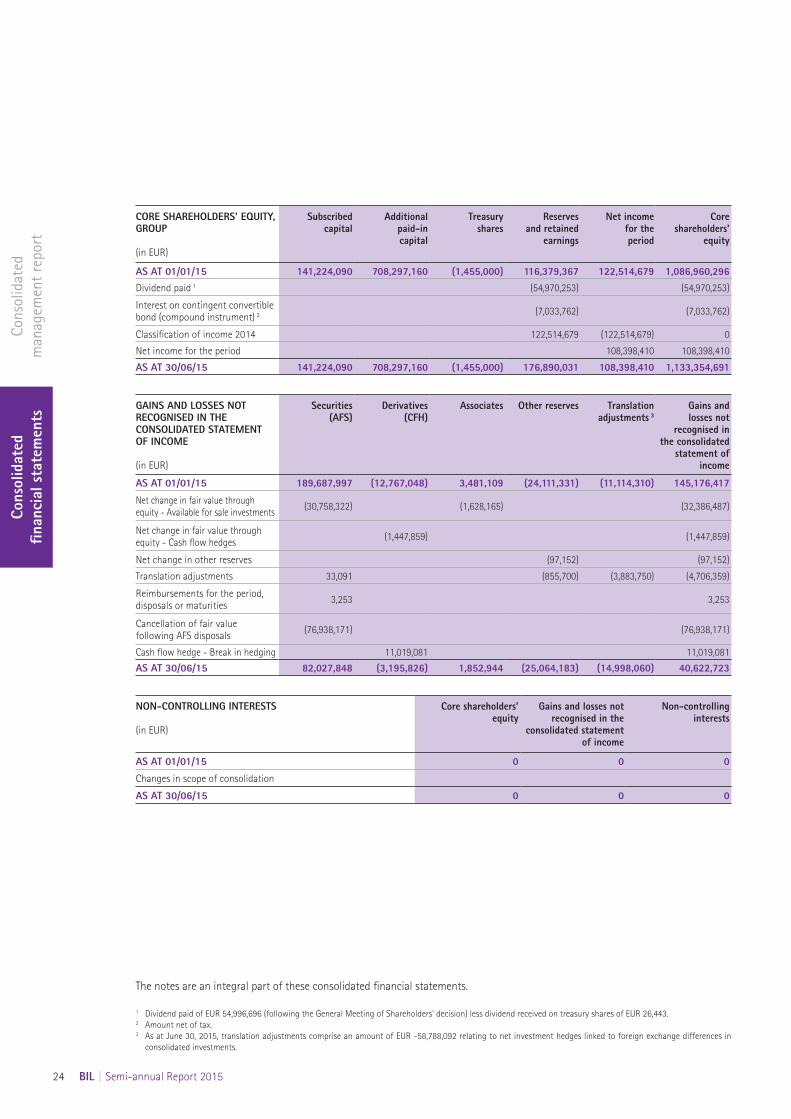
The notes are an integral part of these consolidated financial statements.
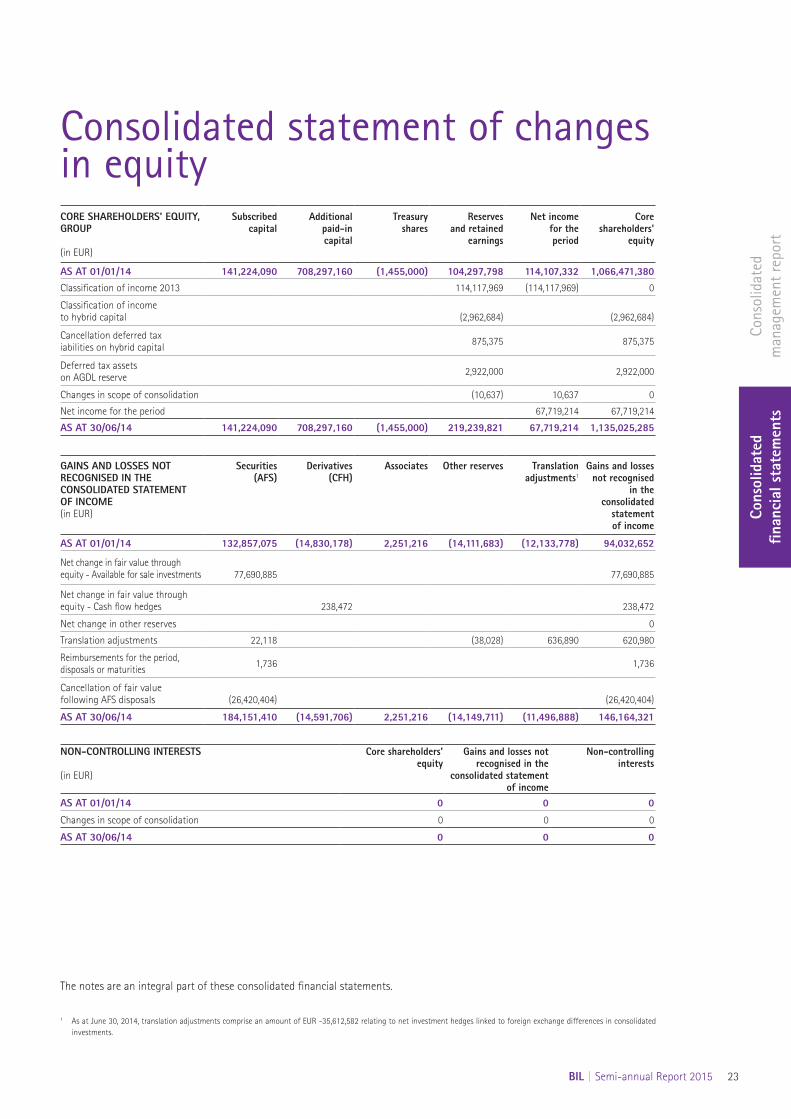
CORE SHAREHOLDERS' EQUITY, GROUP (in EUR)
Subscribed capital
Additional paid-in capital
Treasury shares
Reserves and retained
earnings
Net income for the period
Core shareholders'
equity
AS AT 01/01/14 141,224,090 708,297,160 (1,455,000) 104,297,798 114,107,332 1,066,471,380Classification of income 2013 114,117,969 (114,117,969) 0
Classification of income to hybrid capital (2,962,684) (2,962,684)
Cancellation deferred tax iabilities on hybrid capital 875,375 875,375
Deferred tax assets on AGDL reserve 2,922,000 2,922,000
Changes in scope of consolidation (10,637) 10,637 0
Net income for the period 67,719,214 67,719,214
AS AT 30/06/14 141,224,090 708,297,160 (1,455,000) 219,239,821 67,719,214 1,135,025,285
GAINS AND LOSSES NOT RECOGNISED IN THE CONSOLIDATED STATEMENT OF INCOME (in EUR)
Securities(AFS)
Derivatives(CFH)
Associates Other reserves Translation adjustments1
Gains and losses not recognised
in the consolidated
statement of income
AS AT 01/01/14 132,857,075 (14,830,178) 2,251,216 (14,111,683) (12,133,778) 94,032,652
Net change in fair value through equity - Available for sale investments 77,690,885 77,690,885
Net change in fair value through equity - Cash flow hedges 238,472 238,472
Net change in other reserves 0
Translation adjustments 22,118 (38,028) 636,890 620,980
Reimbursements for the period, disposals or maturities 1,736 1,736
Cancellation of fair value following AFS disposals (26,420,404) (26,420,404)
AS AT 30/06/14 184,151,410 (14,591,706) 2,251,216 (14,149,711) (11,496,888) 146,164,321
NON-CONTROLLING INTERESTS (in EUR)
Core shareholders’ equity
Gains and losses not recognised in the
consolidated statement of income
Non-controlling interests
AS AT 01/01/14 0 0 0
Changes in scope of consolidation 0 0 0
AS AT 30/06/14 0 0 0
Consolidated statement of changes in equity
1 As at June 30, 2014, translation adjustments comprise an amount of EUR -35,612,582 relating to net investment hedges linked to foreign exchange differences in consolidated investments.
Cons
olid
ated
m
anag
emen
t re
port
Cons
olid
ated
fin
anci
al s
tate
men
ts
24 BIL | Semi-annual Report 2015
The notes are an integral part of these consolidated financial statements.
1 Dividend paid of EUR 54,996,696 (following the General Meeting of Shareholders' decision) less dividend received on treasury shares of EUR 26,443.2 Amount net of tax.3 As at June 30, 2015, translation adjustments comprise an amount of EUR -58,788,092 relating to net investment hedges linked to foreign exchange differences in
consolidated investments.
CORE SHAREHOLDERS’ EQUITY, GROUP (in EUR)
Subscribed capital
Additional paid-in capital
Treasury shares
Reserves and retained
earnings
Net income for the period
Core shareholders'
equity
AS AT 01/01/15 141,224,090 708,297,160 (1,455,000) 116,379,367 122,514,679 1,086,960,296Dividend paid 1 (54,970,253) (54,970,253)
Interest on contingent convertible bond (compound instrument) 2 (7,033,762) (7,033,762)
Classification of income 2014 122,514,679 (122,514,679) 0
Net income for the period 108,398,410 108,398,410
AS AT 30/06/15 141,224,090 708,297,160 (1,455,000) 176,890,031 108,398,410 1,133,354,691
GAINS AND LOSSES NOT RECOGNISED IN THE CONSOLIDATED STATEMENTOF INCOME (in EUR)
Securities(AFS)
Derivatives(CFH)
Associates Other reserves Translation adjustments 3
Gains and losses not
recognised in the consolidated
statement of income
AS AT 01/01/15 189,687,997 (12,767,048) 3,481,109 (24,111,331) (11,114,310) 145,176,417
Net change in fair value through equity - Available for sale investments (30,758,322) (1,628,165) (32,386,487)
Net change in fair value through equity - Cash flow hedges (1,447,859) (1,447,859)
Net change in other reserves (97,152) (97,152)
Translation adjustments 33,091 (855,700) (3,883,750) (4,706,359)
Reimbursements for the period, disposals or maturities 3,253 3,253
Cancellation of fair value following AFS disposals (76,938,171) (76,938,171)
Cash flow hedge - Break in hedging 11,019,081 11,019,081
AS AT 30/06/15 82,027,848 (3,195,826) 1,852,944 (25,064,183) (14,998,060) 40,622,723
NON-CONTROLLING INTERESTS (in EUR)
Core shareholders’ equity
Gains and losses not recognised in the
consolidated statement of income
Non-controlling interests
AS AT 01/01/15 0 0 0
Changes in scope of consolidation
AS AT 30/06/15 0 0 0
Cons
olid
ated
m
anag
emen
t re
port
Cons
olid
ated
fin
anci
al s
tate
men
ts
BIL | Semi-annual Report 2015 25
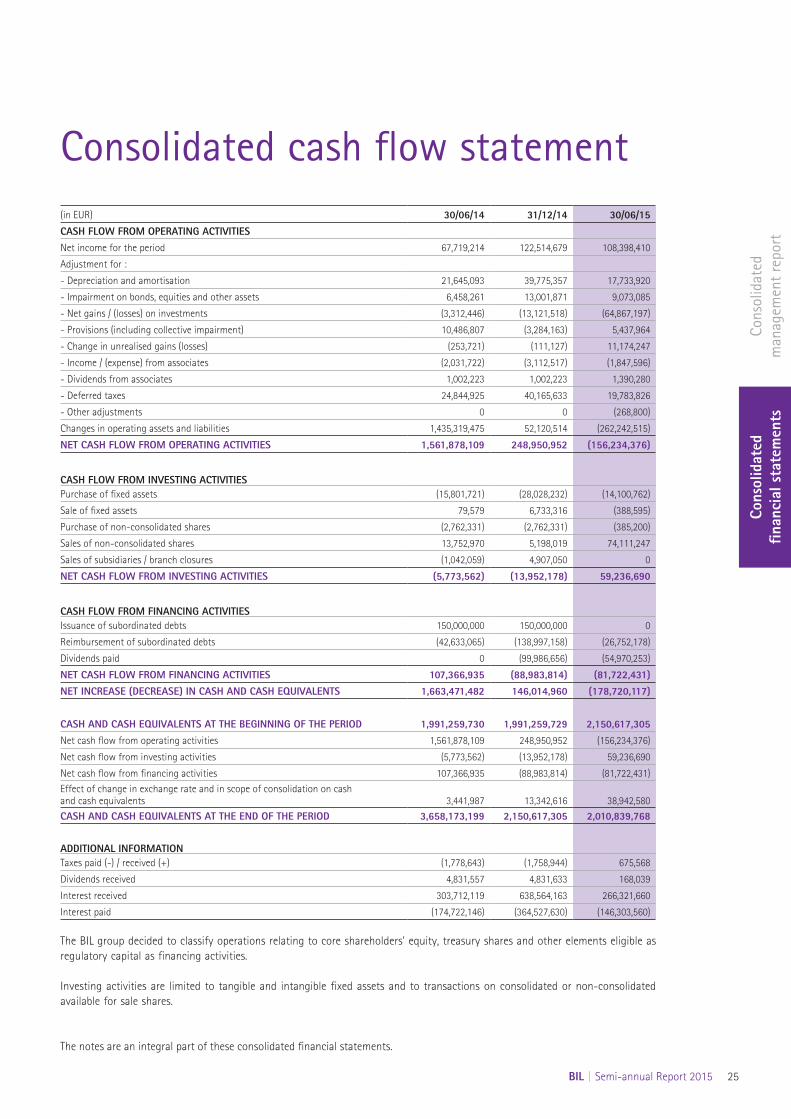
The notes are an integral part of these consolidated financial statements.
(in EUR) 30/06/14 31/12/14 30/06/15CASH FLOW FROM OPERATING ACTIVITIESNet income for the period 67,719,214 122,514,679 108,398,410
Adjustment for :
- Depreciation and amortisation 21,645,093 39,775,357 17,733,920
- Impairment on bonds, equities and other assets 6,458,261 13,001,871 9,073,085
- Net gains / (losses) on investments (3,312,446) (13,121,518) (64,867,197)
- Provisions (including collective impairment) 10,486,807 (3,284,163) 5,437,964
- Change in unrealised gains (losses) (253,721) (111,127) 11,174,247
- Income / (expense) from associates (2,031,722) (3,112,517) (1,847,596)
- Dividends from associates 1,002,223 1,002,223 1,390,280
- Deferred taxes 24,844,925 40,165,633 19,783,826
- Other adjustments 0 0 (268,800)
Changes in operating assets and liabilities 1,435,319,475 52,120,514 (262,242,515)
NET CASH FLOW FROM OPERATING ACTIVITIES 1,561,878,109 248,950,952 (156,234,376)
CASH FLOW FROM INVESTING ACTIVITIESPurchase of fixed assets (15,801,721) (28,028,232) (14,100,762)
Sale of fixed assets 79,579 6,733,316 (388,595)
Purchase of non-consolidated shares (2,762,331) (2,762,331) (385,200)
Sales of non-consolidated shares 13,752,970 5,198,019 74,111,247
Sales of subsidiaries / branch closures (1,042,059) 4,907,050 0
NET CASH FLOW FROM INVESTING ACTIVITIES (5,773,562) (13,952,178) 59,236,690
CASH FLOW FROM FINANCING ACTIVITIESIssuance of subordinated debts 150,000,000 150,000,000 0
Reimbursement of subordinated debts (42,633,065) (138,997,158) (26,752,178)
Dividends paid 0 (99,986,656) (54,970,253)
NET CASH FLOW FROM FINANCING ACTIVITIES 107,366,935 (88,983,814) (81,722,431)NET INCREASE (DECREASE) IN CASH AND CASH EQUIVALENTS 1,663,471,482 146,014,960 (178,720,117)
CASH AND CASH EQUIVALENTS AT THE BEGINNING OF THE PERIOD 1,991,259,730 1,991,259,729 2,150,617,305Net cash flow from operating activities 1,561,878,109 248,950,952 (156,234,376)
Net cash flow from investing activities (5,773,562) (13,952,178) 59,236,690
Net cash flow from financing activities 107,366,935 (88,983,814) (81,722,431)
Effect of change in exchange rate and in scope of consolidation on cash and cash equivalents 3,441,987 13,342,616 38,942,580
CASH AND CASH EQUIVALENTS AT THE END OF THE PERIOD 3,658,173,199 2,150,617,305 2,010,839,768
ADDITIONAL INFORMATIONTaxes paid (-) / received (+) (1,778,643) (1,758,944) 675,568
Dividends received 4,831,557 4,831,633 168,039
Interest received 303,712,119 638,564,163 266,321,660
Interest paid (174,722,146) (364,527,630) (146,303,560)
The BIL group decided to classify operations relating to core shareholders' equity, treasury shares and other elements eligible as regulatory capital as financing activities.
Investing activities are limited to tangible and intangible fixed assets and to transactions on consolidated or non-consolidated available for sale shares.
Consolidated cash flow statement

Cons
olid
ated
m
anag
emen
t re
port
Cons
olid
ated
fin
anci
al s
tate
men
ts
26 BIL | Semi-annual Report 2015
Notes to the consolidated financial statementsPreliminary note:Presentation of the consolidated financial statements
If the balance of an item is nil for the period under review as well as for the comparative period, this item is not included in the consolidated financial statements. This rule applies to the presentation of the consolidated balance sheet, the consolidated statement of income, the consolidated statement of comprehensive income, the consolidated statement of changes in equity, the consolidated cash flow statement as well as to the notes to the consolidated financial statements.
Note 1Accounting principles and rules of the consolidated financial statements
Note 2Material changes in scope of consolidation from July 1, 2014 to June 30, 2015
Note 3Business reporting
Note 4Subordinated debts and debt securities
Note 5Exchange rates
Note 6Material items in the statement of income
Note 7Post-balance sheet events
Note 8Solvency ratios
Note 9Litigation
Note 10Fair value
Cons
olid
ated
m
anag
emen
t re
port
Cons
olid
ated
fin
anci
al s
tate
men
ts
BIL | Semi-annual Report 2015 27
Note 1: Accounting principles and rules of the consolidated financial statementsGENERAL INFORMATION
The parent company of BIL group is Banque Internationale à Luxembourg, a Luxembourg public limited company (hereafter "BIL" or "the Bank"). Its registered office is situated at 69, route d’Esch, L-2953 Luxembourg. The BIL group is integrated in the consolidated financial statements of Pioneer Holding SA, comprising the largest body of undertakings of which BIL forms part as a subsidiary.
The registered office of Pioneer Holding SA is located in Luxembourg at 15, Boulevard Franklin Roosevelt, L-2450 Luxembourg. BIL group is integrated in the consolidated financial statements of Precision Capital SA, comprising the smallest body of undertakings of which BIL forms part as a subsidiary. The registered office of Precision Capital SA is located in Luxembourg at 15, Boulevard Franklin Roosevelt, L-2450 Luxembourg and its consolidated accounts are available at the same address.
The object of BIL is to undertake all banking and financial operations, for its own account or for the account of third parties, in Luxembourg or abroad – including the establishment of subsidiaries, branches and representative offices – and to carry out all financial, industrial and commercial operations, as well as to take deposits of funds and to hold items of value on deposit. These financial statements were approved for publication by the Board of Directors on July 29, 2015, and signed by Hugues Delcourt, Chairman of the Management Board and Chief Executive Officer of the group.
These consolidated statements cover the period beginning July 1, 2014 and ending June 30, 2015.
NOTES TO THE CONSOLIDATED FINANCIAL STATEMENTS
The principal accounting policies adopted in the preparation of these consolidated financial statements are set out below.The common used abbreviations below are:• IASB: International Accounting Standards Board• IFRIC: International Financial Reporting Interpretations Committee• IFRS: International Financial Reporting Standards
1. ACCOUNTING RULES AND METHODS
1.1 Basis accounting
1.1.1 Statement of complianceBIL’s consolidated financial statements are prepared in accordance with the IFRS, as adopted by the European Union (EU).
BIL’s consolidated financial statements have therefore been prepared in accordance with all IFRS as adopted by the EU and endorsed by the European Commission (EC) up to June 30, 2015.
The consolidated financial statements are prepared on a “going-concern basis” and are given in euro (EUR) unless otherwise stated.
A summary of the main accounting policies is provided in the annual report as at December 31, 2014.
Since then, no changes in content were made in those accounting policies that had a material impact on the results.
1.1.2 Accounting estimates and judgements
In preparing the consolidated financial statements, management is required to make estimates and assumptions that affect the amounts reported. To make these assumptions and estimates, management uses information available at the date of preparation of the consolidated financial statements and exercises its judgement. While management believes that it has considered all available information in developing these estimates, actual results may differ from the estimates and the differences could be material to the consolidated financial statements.
Judgements are made principally in the following areas:• Classification of financial instruments into the appropriate
category ("loans and receivables", "held to maturity", "available for sale", "held for trading" and "fair value option") for measurement purposes based on the instrument’s characteristics and BIL’s intention;
• Financial instruments for which no quoted market prices on active markets are available are valued by means of valuation techniques. The determination as to whether or not there is an active market is based on criteria such as number of contributors, bid offer spread and issue size;
• Determination of fair value for financial instruments measured at fair value by means of valuation techniques;
• Determination on whether BIL controls the investee, including special purpose entities;
• The appropriateness of designating derivatives as hedging instruments;
Cons
olid
ated
m
anag
emen
t re
port
Cons
olid
ated
fin
anci
al s
tate
men
ts
28 BIL | Semi-annual Report 2015
• Existence of a present obligation with probable outflows in the context of litigation; and
• Identification of impairment triggers.
These judgements are entered into the corresponding sections of the accounting policies.
Estimates are principally made in the following areas:• The measurement of hedge effectiveness in hedging relations;• Determination of the market value correction to adjust for
market value and model uncertainty;• Determination of the useful life and the residual value of
property, plant and equipment, investment property and intangible assets;
• Actuarial assumptions related to the measurement of employee benefits obligations and plan assets;
• Estimation of future taxable profit for the recognition and measurement of deferred tax assets; and
• Estimation of the recoverable amount of cash-generating units for goodwill impairment.
The Bank’s management has made an assessment of its ability to continue as a going concern and is satisfied that it has the resources to continue in business for the foreseeable future. Furthermore, management is not aware of any material uncertainties that may cast significant doubt upon the Bank’s ability to continue as a going concern. Therefore, the financial statements continue to be prepared on the going concern basis.
1.2 Changes in accounting policies since the previous annual publication that may impact BIL group
The overview of the texts below is made up to the reporting date of June 30, 2015.
1.2.1 IASB and IFRIC texts endorsed by the European Commission and applied as from January 1, 2015
There were no standard, interpretation or amendment endorsed by the European Commission and applicable from January 1, 2015.
1.2.2 IASB and IFRIC texts endorsed by the European Commission during the current period but not yet applicable as from January 1, 2015
There were no standard, interpretation or amendment endorsed by the European Commission and not yet applicable as from January 1, 2015.
1.2.3. New IFRS standards, IFRIC interpretations and amend-ments issued during the current period but not yet endorsed by the European Commission
There were no standard, interpretation or amendment issued and not yet endorsed by the European Commission as from January 1, 2015.
Cons
olid
ated
m
anag
emen
t re
port
Cons
olid
ated
fin
anci
al s
tate
men
ts
BIL | Semi-annual Report 2015 29
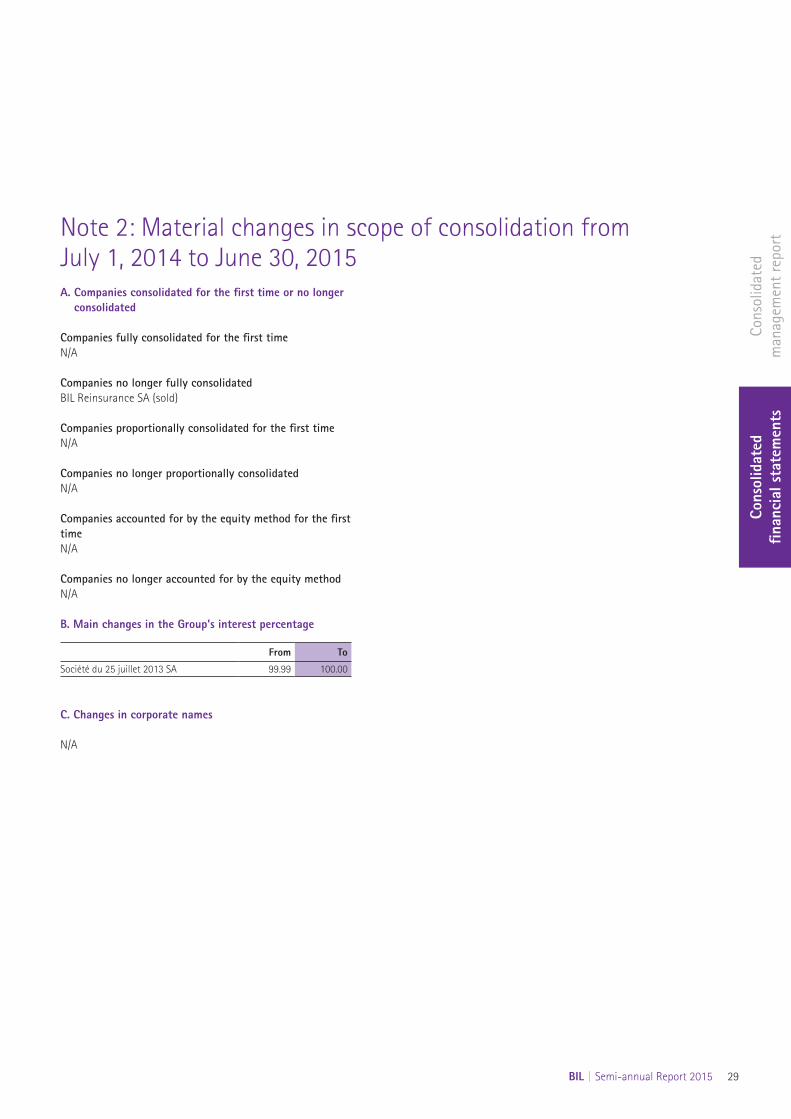
Note 2: Material changes in scope of consolidation from July 1, 2014 to June 30, 2015A. Companies consolidated for the first time or no longer
consolidated
Companies fully consolidated for the first timeN/A
Companies no longer fully consolidatedBIL Reinsurance SA (sold)
Companies proportionally consolidated for the first timeN/A
Companies no longer proportionally consolidatedN/A
Companies accounted for by the equity method for the first timeN/A
Companies no longer accounted for by the equity methodN/A
B. Main changes in the Group's interest percentage
From To
Société du 25 juillet 2013 SA 99.99 100.00
C. Changes in corporate names
N/A
Cons
olid
ated
m
anag
emen
t re
port
Cons
olid
ated
fin
anci
al s
tate
men
ts
30 BIL | Semi-annual Report 2015
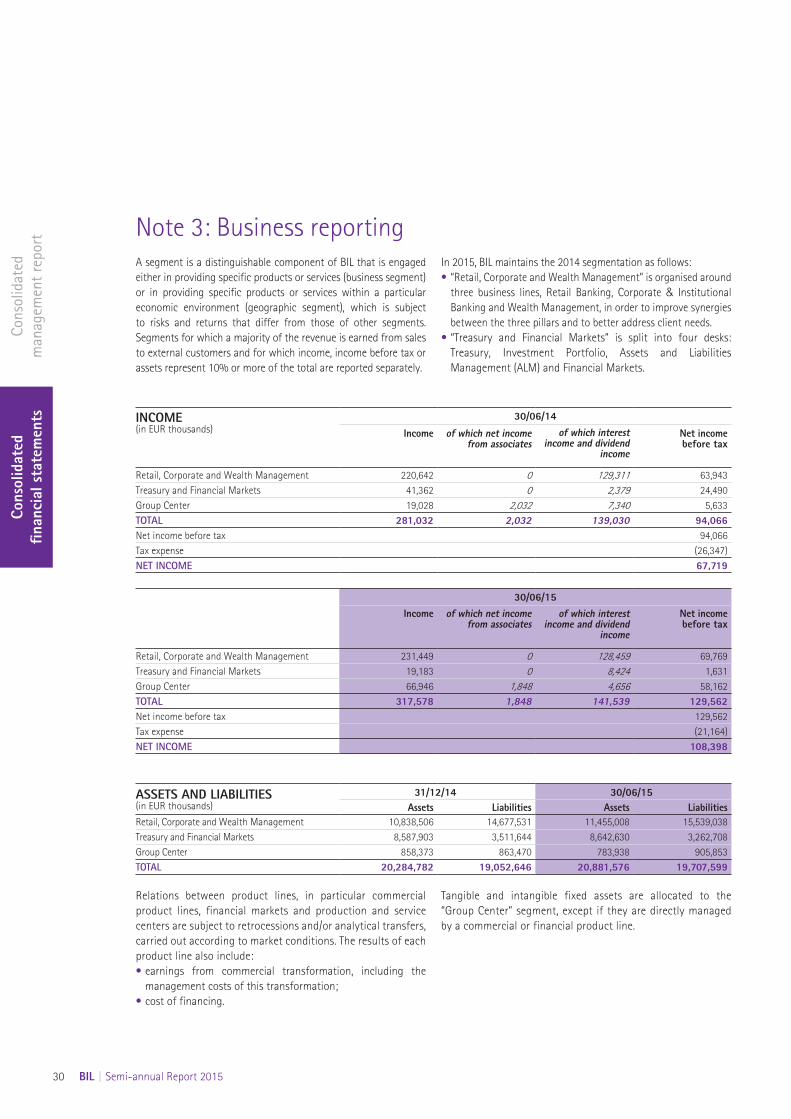
A segment is a distinguishable component of BIL that is engaged either in providing specific products or services (business segment) or in providing specific products or services within a particular economic environment (geographic segment), which is subject to risks and returns that differ from those of other segments. Segments for which a majority of the revenue is earned from sales to external customers and for which income, income before tax or assets represent 10% or more of the total are reported separately.
In 2015, BIL maintains the 2014 segmentation as follows:• “Retail, Corporate and Wealth Management” is organised around
three business lines, Retail Banking, Corporate & Institutional Banking and Wealth Management, in order to improve synergies between the three pillars and to better address client needs.
• “Treasury and Financial Markets” is split into four desks: Treasury, Investment Portfolio, Assets and Liabilities Management (ALM) and Financial Markets.
Note 3: Business reporting
INCOME (in EUR thousands)
30/06/14
Income of which net income from associates
of which interest income and dividend
income
Net income before tax
Retail, Corporate and Wealth Management 220,642 0 129,311 63,943Treasury and Financial Markets 41,362 0 2,379 24,490Group Center 19,028 2,032 7,340 5,633TOTAL 281,032 2,032 139,030 94,066Net income before tax 94,066Tax expense (26,347)NET INCOME 67,719
ASSETS AND LIABILITIES (in EUR thousands)
31/12/14 30/06/15Assets Liabilities Assets Liabilities
Retail, Corporate and Wealth Management 10,838,506 14,677,531 11,455,008 15,539,038Treasury and Financial Markets 8,587,903 3,511,644 8,642,630 3,262,708Group Center 858,373 863,470 783,938 905,853TOTAL 20,284,782 19,052,646 20,881,576 19,707,599
30/06/15Income of which net income
from associatesof which interest
income and dividend income
Net income before tax
Retail, Corporate and Wealth Management 231,449 0 128,459 69,769Treasury and Financial Markets 19,183 0 8,424 1,631Group Center 66,946 1,848 4,656 58,162TOTAL 317,578 1,848 141,539 129,562Net income before tax 129,562Tax expense (21,164)NET INCOME 108,398
Relations between product lines, in particular commercial product lines, financial markets and production and service centers are subject to retrocessions and/or analytical transfers, carried out according to market conditions. The results of each product line also include:• earnings from commercial transformation, including the
management costs of this transformation;• cost of financing.
Tangible and intangible fixed assets are allocated to the “Group Center” segment, except if they are directly managed by a commercial or financial product line.
Cons
olid
ated
m
anag
emen
t re
port
Cons
olid
ated
fin
anci
al s
tate
men
ts
BIL | Semi-annual Report 2015 31
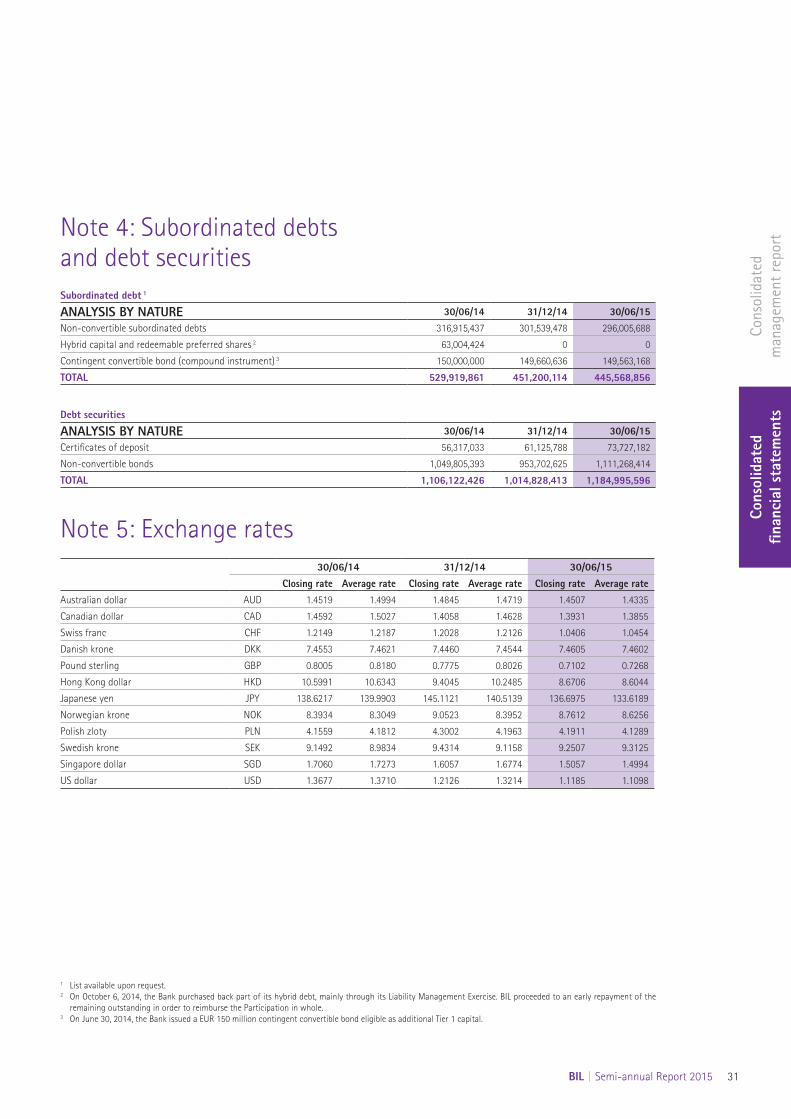
Note 4: Subordinated debts and debt securitiesSubordinated debt 1
ANALYSIS BY NATURE 30/06/14 31/12/14 30/06/15Non-convertible subordinated debts 316,915,437 301,539,478 296,005,688
Hybrid capital and redeemable preferred shares 2 63,004,424 0 0
Contingent convertible bond (compound instrument) 3 150,000,000 149,660,636 149,563,168
TOTAL 529,919,861 451,200,114 445,568,856
Debt securities
ANALYSIS BY NATURE 30/06/14 31/12/14 30/06/15Certificates of deposit 56,317,033 61,125,788 73,727,182
Non-convertible bonds 1,049,805,393 953,702,625 1,111,268,414
TOTAL 1,106,122,426 1,014,828,413 1,184,995,596
Note 5: Exchange rates30/06/14 31/12/14 30/06/15
Closing rate Average rate Closing rate Average rate Closing rate Average rateAustralian dollar AUD 1.4519 1.4994 1.4845 1.4719 1.4507 1.4335
Canadian dollar CAD 1.4592 1.5027 1.4058 1.4628 1.3931 1.3855
Swiss franc CHF 1.2149 1.2187 1.2028 1.2126 1.0406 1.0454
Danish krone DKK 7.4553 7.4621 7.4460 7.4544 7.4605 7.4602
Pound sterling GBP 0.8005 0.8180 0.7775 0.8026 0.7102 0.7268
Hong Kong dollar HKD 10.5991 10.6343 9.4045 10.2485 8.6706 8.6044
Japanese yen JPY 138.6217 139.9903 145.1121 140.5139 136.6975 133.6189
Norwegian krone NOK 8.3934 8.3049 9.0523 8.3952 8.7612 8.6256
Polish zloty PLN 4.1559 4.1812 4.3002 4.1963 4.1911 4.1289
Swedish krone SEK 9.1492 8.9834 9.4314 9.1158 9.2507 9.3125
Singapore dollar SGD 1.7060 1.7273 1.6057 1.6774 1.5057 1.4994
US dollar USD 1.3677 1.3710 1.2126 1.3214 1.1185 1.1098
1 List available upon request.2 On October 6, 2014, the Bank purchased back part of its hybrid debt, mainly through its Liability Management Exercise. BIL proceeded to an early repayment of the
remaining outstanding in order to reimburse the Participation in whole.3 On June 30, 2014, the Bank issued a EUR 150 million contingent convertible bond eligible as additional Tier 1 capital.
Cons
olid
ated
m
anag
emen
t re
port
Cons
olid
ated
fin
anci
al s
tate
men
ts
32 BIL | Semi-annual Report 2015
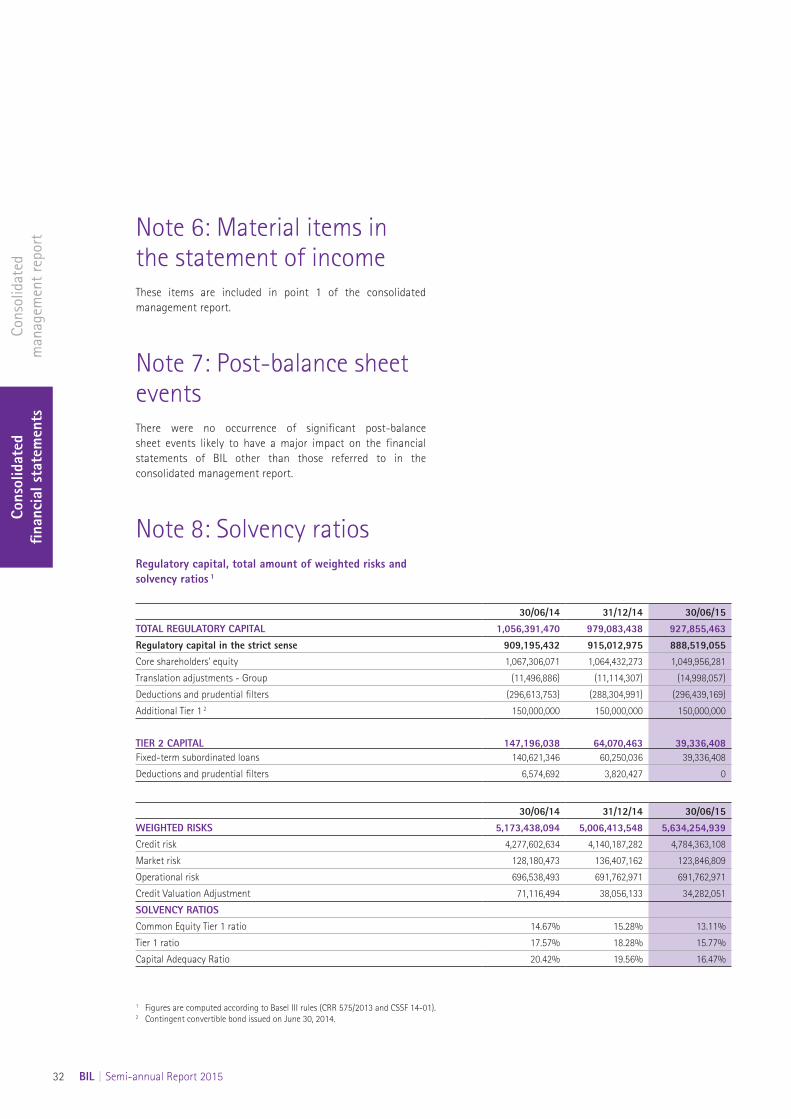
Note 6: Material items in the statement of incomeThese items are included in point 1 of the consolidated management report.
Note 7: Post-balance sheet eventsThere were no occurrence of significant post-balance sheet events likely to have a major impact on the financial statements of BIL other than those referred to in the consolidated management report.
Note 8: Solvency ratiosRegulatory capital, total amount of weighted risks and solvency ratios 1
30/06/14 31/12/14 30/06/15TOTAL REGULATORY CAPITAL 1,056,391,470 979,083,438 927,855,463Regulatory capital in the strict sense 909,195,432 915,012,975 888,519,055Core shareholders' equity 1,067,306,071 1,064,432,273 1,049,956,281
Translation adjustments - Group (11,496,886) (11,114,307) (14,998,057)
Deductions and prudential filters (296,613,753) (288,304,991) (296,439,169)
Additional Tier 1 2 150,000,000 150,000,000 150,000,000
TIER 2 CAPITAL 147,196,038 64,070,463 39,336,408Fixed-term subordinated loans 140,621,346 60,250,036 39,336,408
Deductions and prudential filters 6,574,692 3,820,427 0
30/06/14 31/12/14 30/06/15WEIGHTED RISKS 5,173,438,094 5,006,413,548 5,634,254,939Credit risk 4,277,602,634 4,140,187,282 4,784,363,108
Market risk 128,180,473 136,407,162 123,846,809
Operational risk 696,538,493 691,762,971 691,762,971
Credit Valuation Adjustment 71,116,494 38,056,133 34,282,051
SOLVENCY RATIOSCommon Equity Tier 1 ratio 14.67% 15.28% 13.11%
Tier 1 ratio 17.57% 18.28% 15.77%
Capital Adequacy Ratio 20.42% 19.56% 16.47%
1 Figures are computed according to Basel III rules (CRR 575/2013 and CSSF 14-01).2 Contingent convertible bond issued on June 30, 2014.

Cons
olid
ated
m
anag
emen
t re
port
Cons
olid
ated
fin
anci
al s
tate
men
ts
BIL | Semi-annual Report 2015 33
Note 9: Litigation
9.1 Banque Internationale à Luxembourg SA and Banque Internationale à Luxembourg (Suisse) SA
Following the bankruptcy of Bernard L. Madoff Investment Securities ("BLMIS"), the official receivers of BLMIS and certain investment funds linked to B. Madoff instituted legal proceedings against numerous financial institutions and institutional investors that had purchased Madoff securities and investment products linked to B. Madoff.
In accordance with the "clawback principle", they are claiming the return of profits and redemptions obtained on these investments over a period of several years until the discovery of the fraudulent set-up put in place by BLMIS that culminated in its collapse. Some of these clawback actions were brought against Banque Internationale à Luxembourg SA and its subsidiary Banque Internationale à Luxembourg (Suisse) SA, the plaintiffs claiming the reimbursement of an amount in principal estimated at approximately USD 68 million, most of which corresponds to investments made by Banque Internationale à Luxembourg SA on behalf of third parties.
At this time, Banque Internationale à Luxembourg SA is not able to express a reasonable opinion on the duration or outcome of actions sub judice or on any potential financial impact.
As at June 30, 2015, no provision for clawback actions had been made. Some clients who invested in products linked to Mr Madoff have also brought legal proceedings against Banque Internationale à Luxembourg SA.
9.2 Banque Internationale à Luxembourg Bank Danmark A/S
A Danish bank, EBH BANK, went bankrupt in the turbulent conditions of the 2008 crisis, and people connected with this bank were charged with fraud and market manipulation as part of transactions involving EBH BANK shares and those of other listed companies.
As part of this case, complaints were lodged with the police by the Danish regulator against Banque Internationale à Luxembourg Bank Danmark A/S ("BIL DK") and one of its traders for aiding EBH BANK in allegedly manipulating the market. This trader and, subsequently, BIL DK, were investigated for this alleged aid. The police investigation is still in progress and is likely to result in BIL DK and its former trader being charged. BIL DK denies any involvement or responsibility in connection with the actions targeted by the investigation.
Effective on December 18, 2013, BIL DK transferred its assets and obligations to a newly created branch of BIL in Denmark. BIL DK will however continue to exist until the foregoing investigation is closed or otherwise terminated; BIL DK has been renamed Selskabet af 18 December 2013 A/S.
The Bank is not involved in any other material litigation, where adequate provisions have not been funded, that readers may need to consider in evaluating the risks related to possible credit risks or current or potential litigation.
Cons
olid
ated
m
anag
emen
t re
port
Cons
olid
ated
fin
anci
al s
tate
men
ts
34 BIL | Semi-annual Report 2015
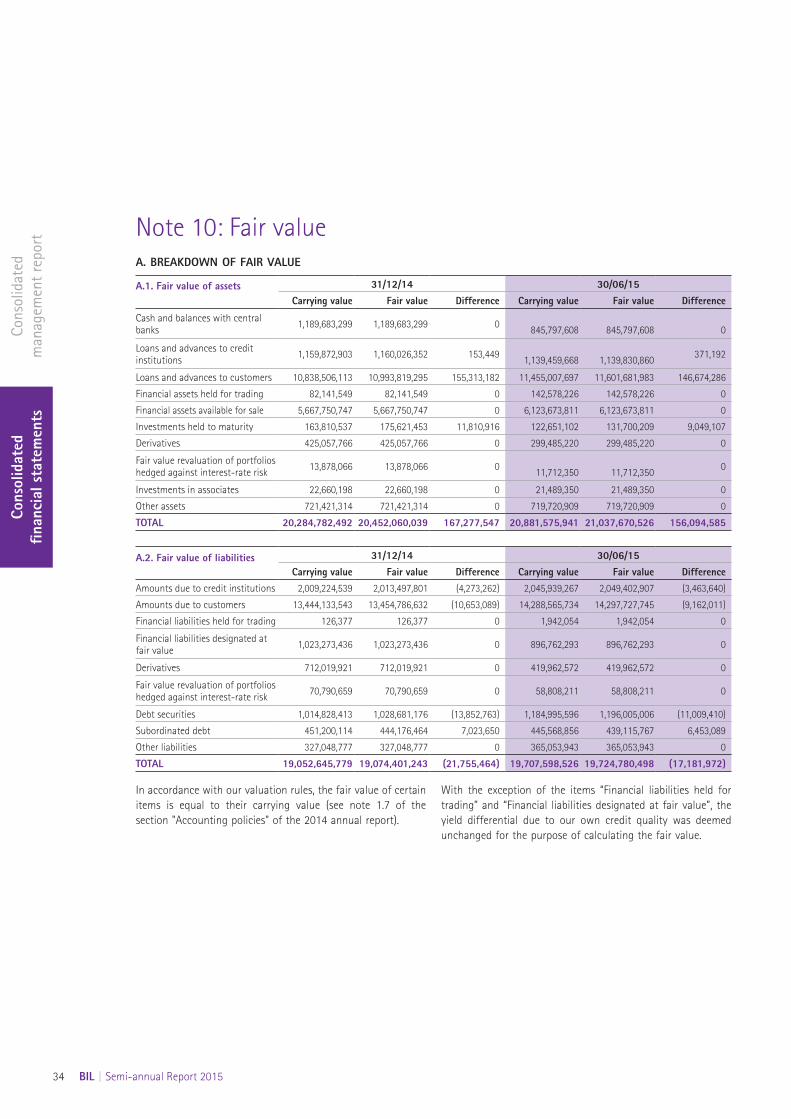
Note 10: Fair valueA. BREAKDOWN OF FAIR VALUE
A.1. Fair value of assets 31/12/14 30/06/15Carrying value Fair value Difference Carrying value Fair value Difference
Cash and balances with central banks 1,189,683,299 1,189,683,299 0 845,797,608 845,797,608 0
Loans and advances to credit institutions 1,159,872,903 1,160,026,352 153,449 1,139,459,668 1,139,830,860 371,192
Loans and advances to customers 10,838,506,113 10,993,819,295 155,313,182 11,455,007,697 11,601,681,983 146,674,286
Financial assets held for trading 82,141,549 82,141,549 0 142,578,226 142,578,226 0
Financial assets available for sale 5,667,750,747 5,667,750,747 0 6,123,673,811 6,123,673,811 0
Investments held to maturity 163,810,537 175,621,453 11,810,916 122,651,102 131,700,209 9,049,107
Derivatives 425,057,766 425,057,766 0 299,485,220 299,485,220 0
Fair value revaluation of portfolios hedged against interest-rate risk 13,878,066 13,878,066 0 11,712,350 11,712,350 0
Investments in associates 22,660,198 22,660,198 0 21,489,350 21,489,350 0
Other assets 721,421,314 721,421,314 0 719,720,909 719,720,909 0
TOTAL 20,284,782,492 20,452,060,039 167,277,547 20,881,575,941 21,037,670,526 156,094,585
A.2. Fair value of liabilities 31/12/14 30/06/15Carrying value Fair value Difference Carrying value Fair value Difference
Amounts due to credit institutions 2,009,224,539 2,013,497,801 (4,273,262) 2,045,939,267 2,049,402,907 (3,463,640)
Amounts due to customers 13,444,133,543 13,454,786,632 (10,653,089) 14,288,565,734 14,297,727,745 (9,162,011)
Financial liabilities held for trading 126,377 126,377 0 1,942,054 1,942,054 0
Financial liabilities designated at fair value 1,023,273,436 1,023,273,436 0 896,762,293 896,762,293 0
Derivatives 712,019,921 712,019,921 0 419,962,572 419,962,572 0
Fair value revaluation of portfolios hedged against interest-rate risk 70,790,659 70,790,659 0 58,808,211 58,808,211 0
Debt securities 1,014,828,413 1,028,681,176 (13,852,763) 1,184,995,596 1,196,005,006 (11,009,410)
Subordinated debt 451,200,114 444,176,464 7,023,650 445,568,856 439,115,767 6,453,089
Other liabilities 327,048,777 327,048,777 0 365,053,943 365,053,943 0
TOTAL 19,052,645,779 19,074,401,243 (21,755,464) 19,707,598,526 19,724,780,498 (17,181,972)
In accordance with our valuation rules, the fair value of certain items is equal to their carrying value (see note 1.7 of the section "Accounting policies" of the 2014 annual report).
With the exception of the items “Financial liabilities held for trading” and “Financial liabilities designated at fair value”, the yield differential due to our own credit quality was deemed unchanged for the purpose of calculating the fair value.
Cons
olid
ated
m
anag
emen
t re
port
Cons
olid
ated
fin
anci
al s
tate
men
ts
BIL | Semi-annual Report 2015 35
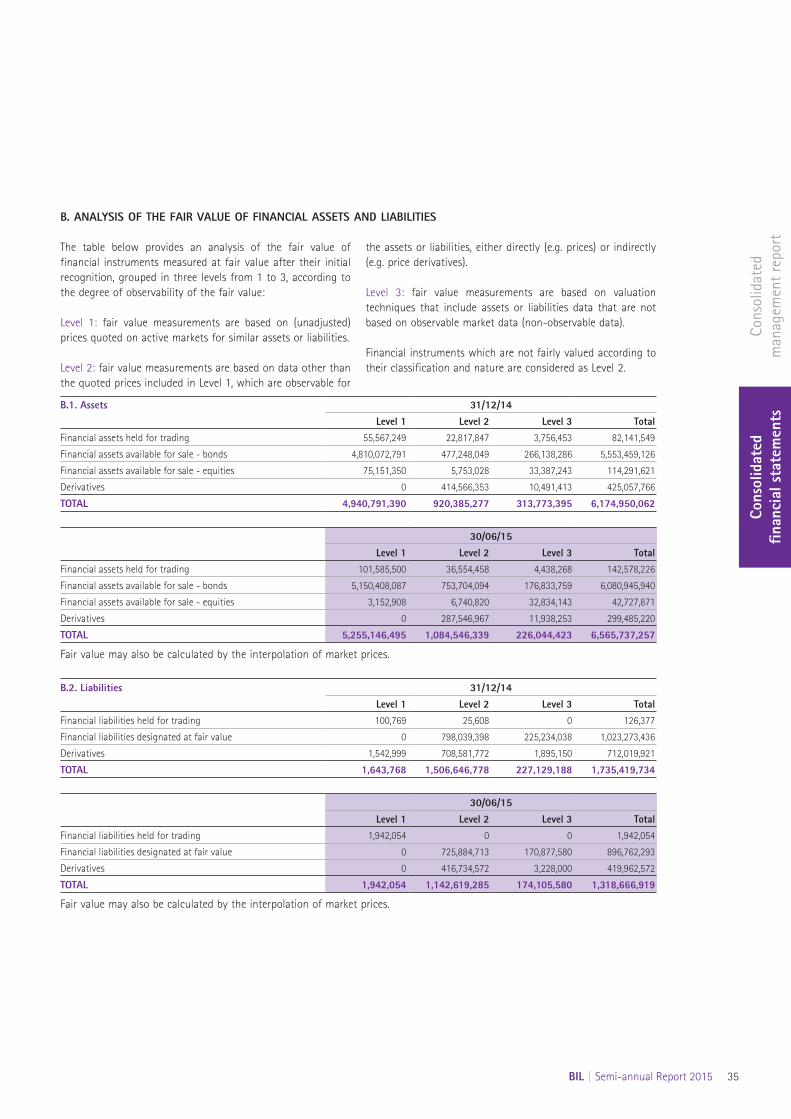
B. ANALYSIS OF THE FAIR VALUE OF FINANCIAL ASSETS AND LIABILITIES
The table below provides an analysis of the fair value of financial instruments measured at fair value after their initial recognition, grouped in three levels from 1 to 3, according to the degree of observability of the fair value:
Level 1: fair value measurements are based on (unadjusted) prices quoted on active markets for similar assets or liabilities.
Level 2: fair value measurements are based on data other than the quoted prices included in Level 1, which are observable for
the assets or liabilities, either directly (e.g. prices) or indirectly (e.g. price derivatives).
Level 3: fair value measurements are based on valuation techniques that include assets or liabilities data that are not based on observable market data (non-observable data).
Financial instruments which are not fairly valued according to their classification and nature are considered as Level 2.
B.1. Assets 31/12/14Level 1 Level 2 Level 3 Total
Financial assets held for trading 55,567,249 22,817,847 3,756,453 82,141,549
Financial assets available for sale - bonds 4,810,072,791 477,248,049 266,138,286 5,553,459,126
Financial assets available for sale - equities 75,151,350 5,753,028 33,387,243 114,291,621
Derivatives 0 414,566,353 10,491,413 425,057,766
TOTAL 4,940,791,390 920,385,277 313,773,395 6,174,950,062
30/06/15Level 1 Level 2 Level 3 Total
Financial assets held for trading 101,585,500 36,554,458 4,438,268 142,578,226
Financial assets available for sale - bonds 5,150,408,087 753,704,094 176,833,759 6,080,945,940
Financial assets available for sale - equities 3,152,908 6,740,820 32,834,143 42,727,871
Derivatives 0 287,546,967 11,938,253 299,485,220
TOTAL 5,255,146,495 1,084,546,339 226,044,423 6,565,737,257
Fair value may also be calculated by the interpolation of market prices.
B.2. Liabilities 31/12/14Level 1 Level 2 Level 3 Total
Financial liabilities held for trading 100,769 25,608 0 126,377
Financial liabilities designated at fair value 0 798,039,398 225,234,038 1,023,273,436
Derivatives 1,542,999 708,581,772 1,895,150 712,019,921
TOTAL 1,643,768 1,506,646,778 227,129,188 1,735,419,734
30/06/15Level 1 Level 2 Level 3 Total
Financial liabilities held for trading 1,942,054 0 0 1,942,054
Financial liabilities designated at fair value 0 725,884,713 170,877,580 896,762,293
Derivatives 0 416,734,572 3,228,000 419,962,572
TOTAL 1,942,054 1,142,619,285 174,105,580 1,318,666,919
Fair value may also be calculated by the interpolation of market prices.
Cons
olid
ated
m
anag
emen
t re
port
Cons
olid
ated
fin
anci
al s
tate
men
ts
36 BIL | Semi-annual Report 2015
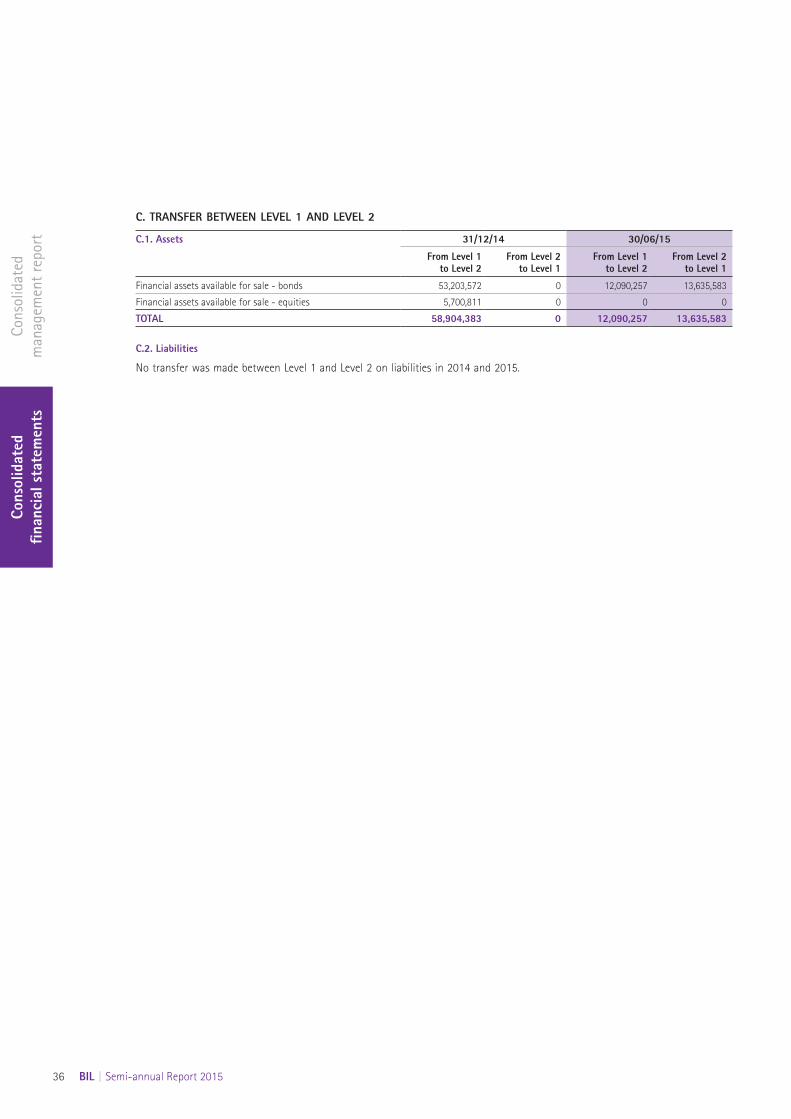
C. TRANSFER BETWEEN LEVEL 1 AND LEVEL 2
C.1. Assets 31/12/14 30/06/15
From Level 1 to Level 2
From Level 2 to Level 1
From Level 1 to Level 2
From Level 2 to Level 1
Financial assets available for sale - bonds 53,203,572 0 12,090,257 13,635,583
Financial assets available for sale - equities 5,700,811 0 0 0
TOTAL 58,904,383 0 12,090,257 13,635,583
C.2. Liabilities
No transfer was made between Level 1 and Level 2 on liabilities in 2014 and 2015.
Cons
olid
ated
m
anag
emen
t re
port
Cons
olid
ated
fin
anci
al s
tate
men
ts
BIL | Semi-annual Report 2015 37
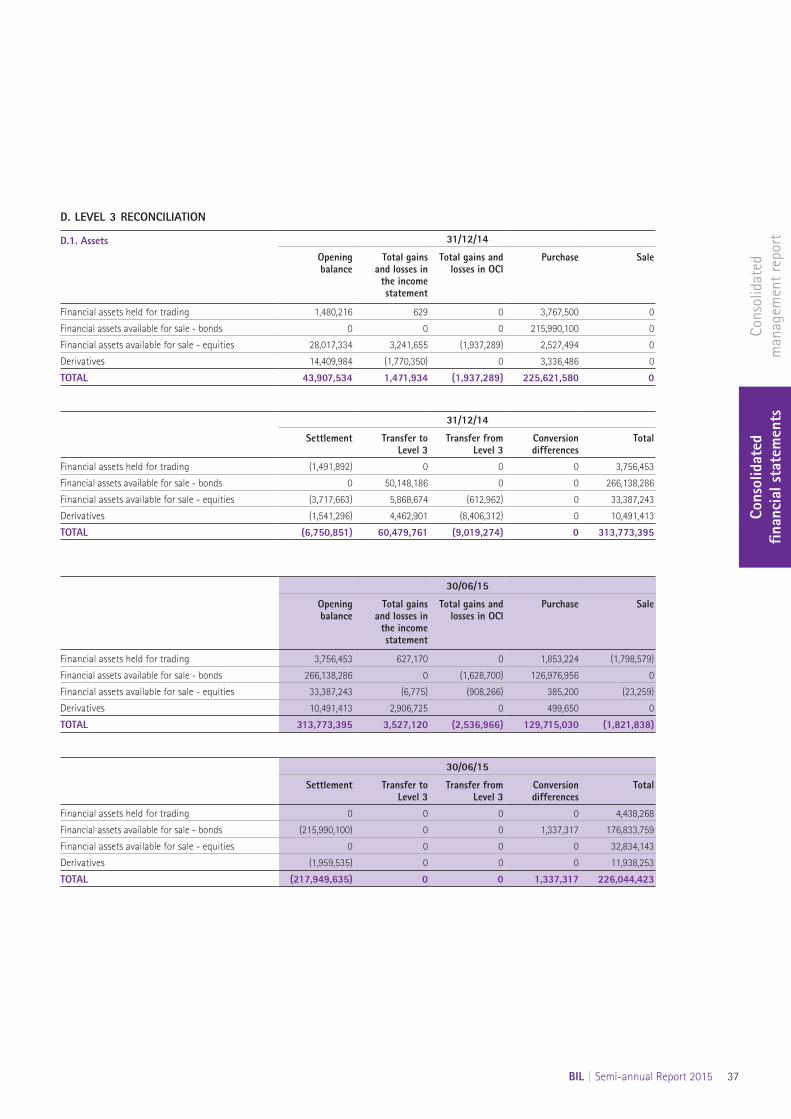
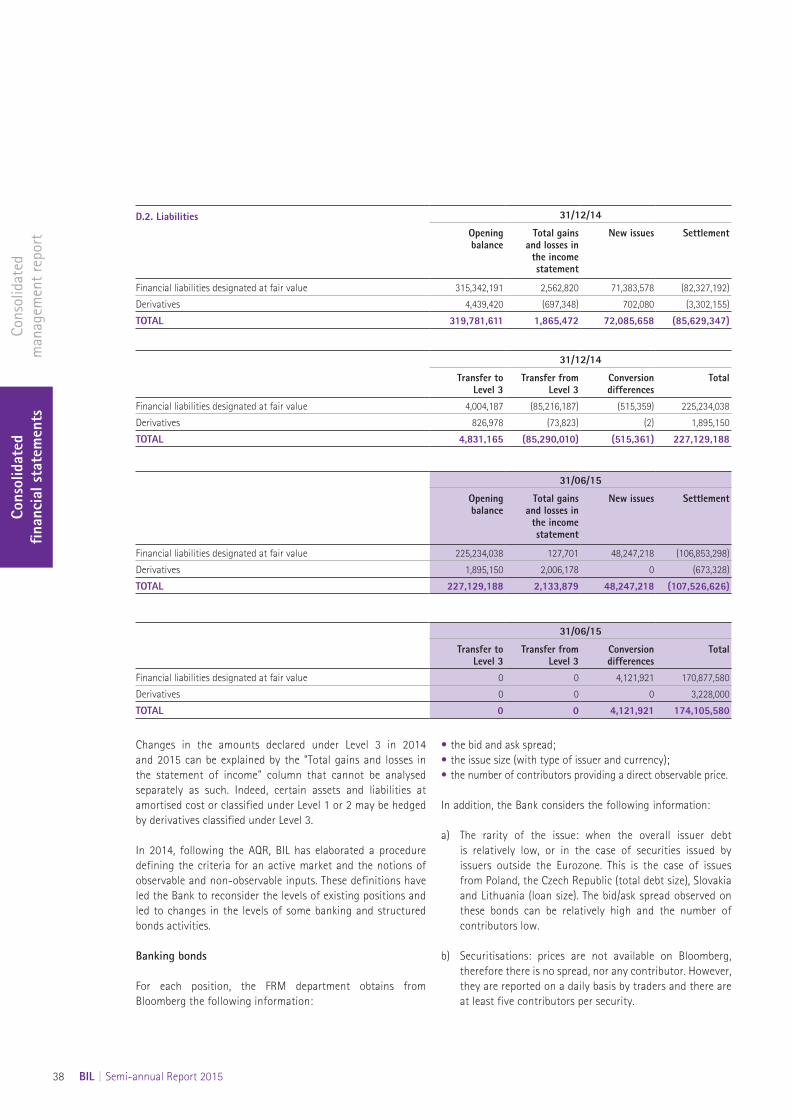
D. LEVEL 3 RECONCILIATION
D.1. Assets 31/12/14
Opening balance
Total gains and losses in
the income statement
Total gains and losses in OCI
Purchase Sale
Financial assets held for trading 1,480,216 629 0 3,767,500 0
Financial assets available for sale - bonds 0 0 0 215,990,100 0
Financial assets available for sale - equities 28,017,334 3,241,655 (1,937,289) 2,527,494 0
Derivatives 14,409,984 (1,770,350) 0 3,336,486 0
TOTAL 43,907,534 1,471,934 (1,937,289) 225,621,580 0
31/12/14
Settlement Transfer to Level 3
Transfer from Level 3
Conversion differences
Total
Financial assets held for trading (1,491,892) 0 0 0 3,756,453
Financial assets available for sale - bonds 0 50,148,186 0 0 266,138,286
Financial assets available for sale - equities (3,717,663) 5,868,674 (612,962) 0 33,387,243
Derivatives (1,541,296) 4,462,901 (8,406,312) 0 10,491,413
TOTAL (6,750,851) 60,479,761 (9,019,274) 0 313,773,395
30/06/15
Opening balance
Total gains and losses in
the income statement
Total gains and losses in OCI
Purchase Sale
Financial assets held for trading 3,756,453 627,170 0 1,853,224 (1,798,579)
Financial assets available for sale - bonds 266,138,286 0 (1,628,700) 126,976,956 0
Financial assets available for sale - equities 33,387,243 (6,775) (908,266) 385,200 (23,259)
Derivatives 10,491,413 2,906,725 0 499,650 0
TOTAL 313,773,395 3,527,120 (2,536,966) 129,715,030 (1,821,838)
30/06/15
Settlement Transfer to Level 3
Transfer from Level 3
Conversion differences
Total
Financial assets held for trading 0 0 0 0 4,438,268
Financial assets available for sale - bonds (215,990,100) 0 0 1,337,317 176,833,759
Financial assets available for sale - equities 0 0 0 0 32,834,143
Derivatives (1,959,535) 0 0 0 11,938,253
TOTAL (217,949,635) 0 0 1,337,317 226,044,423
Cons
olid
ated
m
anag
emen
t re
port
Cons
olid
ated
fin
anci
al s
tate
men
ts
38 BIL | Semi-annual Report 2015
D.2. Liabilities 31/12/14
Opening balance
Total gains and losses in
the income statement
New issues Settlement
Financial liabilities designated at fair value 315,342,191 2,562,820 71,383,578 (82,327,192)
Derivatives 4,439,420 (697,348) 702,080 (3,302,155)
TOTAL 319,781,611 1,865,472 72,085,658 (85,629,347)
31/12/14
Transfer to Level 3
Transfer from Level 3
Conversion differences
Total
Financial liabilities designated at fair value 4,004,187 (85,216,187) (515,359) 225,234,038
Derivatives 826,978 (73,823) (2) 1,895,150
TOTAL 4,831,165 (85,290,010) (515,361) 227,129,188
31/06/15
Opening balance
Total gains and losses in
the income statement
New issues Settlement
Financial liabilities designated at fair value 225,234,038 127,701 48,247,218 (106,853,298)
Derivatives 1,895,150 2,006,178 0 (673,328)
TOTAL 227,129,188 2,133,879 48,247,218 (107,526,626)
31/06/15
Transfer to Level 3
Transfer from Level 3
Conversion differences
Total
Financial liabilities designated at fair value 0 0 4,121,921 170,877,580
Derivatives 0 0 0 3,228,000
TOTAL 0 0 4,121,921 174,105,580
Changes in the amounts declared under Level 3 in 2014 and 2015 can be explained by the "Total gains and losses in the statement of income" column that cannot be analysed separately as such. Indeed, certain assets and liabilities at amortised cost or classified under Level 1 or 2 may be hedged by derivatives classified under Level 3.
In 2014, following the AQR, BIL has elaborated a procedure defining the criteria for an active market and the notions of observable and non-observable inputs. These definitions have led the Bank to reconsider the levels of existing positions and led to changes in the levels of some banking and structured bonds activities.
Banking bonds
For each position, the FRM department obtains from Bloomberg the following information:
• the bid and ask spread;• the issue size (with type of issuer and currency);• the number of contributors providing a direct observable price.
In addition, the Bank considers the following information:
a) The rarity of the issue: when the overall issuer debt is relatively low, or in the case of securities issued by issuers outside the Eurozone. This is the case of issues from Poland, the Czech Republic (total debt size), Slovakia and Lithuania (loan size). The bid/ask spread observed on these bonds can be relatively high and the number of contributors low.
b) Securitisations: prices are not available on Bloomberg, therefore there is no spread, nor any contributor. However, they are reported on a daily basis by traders and there are at least five contributors per security.
Cons
olid
ated
m
anag
emen
t re
port
Cons
olid
ated
fin
anci
al s
tate
men
ts
BIL | Semi-annual Report 2015 39
c) The investors’ “buy and hold” behavior: certain issues are sought by investors but retained in their portfolio, therefore there are less sellers than buyers and as a result the bid/ask spread is slightly high and there are sometime limited contributors. This is particularly the case for emissions from Qatar, Abu Dhabi and Luxembourg.
Structured bonds
Since December 2014, Finalyse communicates for each product the type of data required for the valorisation as well as whether these data are observable or not. Moreover, the market expert is requested to evaluate the impact of the non observability of the forward data.
It should be noted that Level 3 financial instruments held for trading are the result of buy-backs of BIL issues.
E. SENSITIVITY OF LEVEL 3 VALUATION TO ALTERNATIVE SCENARIOS
BIL uses a discounted cash flow model to determine the mark-to-model price. Sensitivity is a measurement of the fair value impact of alternative scenarios relating to the model's unobservable parameters at the closing date.
With regard to the spread valuation, in cases where BIL uses its own models, alternative scenarios relating to unobservable parameters were taken into consideration, in particular for:• credit spreads: by considering credit spreads available on a single
counterpart or, failing that, on similar counterparts or counterparts belonging to similar sectors, or by using credit spreads indexed to liquid CDS indices
• liquidity premiums: by considering the different levels of premiums primarily used in determining the fair value of bonds, and which depend in particular on the eligibility of the security for refinancing with the central banks
• the illiquidity of the financial instrument: by considering a change in the estimated liquidity of the market for a single instrument or similar products, and/or by incorporating an analysis of the bid-ask spread for real transactions.
Tests were carried out on all financial instruments classified under Level 3.
The effects of sensitivity are mainly felt at the level of structured issues recognised at fair value through profit or loss. These effects are, however, offset by the related hedging derivatives with an opposite sensitivity.
The most significant stand-alone Level 3 instrument is BIL's participation in Luxair SA. The sensitivity test leads to a minor impact in the OCI reserve. Nevertheless, such a sensitivity analysis is not relevant as many factors (such as fuel market volatility and global economic context) may impact Luxair's valuation.