
1130-1215 Robinet North American Light Vehicle … – 25 Growth Volume, CAGR% IHS Automotive |...
34
Michael Robinet Managing Director IHS Automotive
Transcript of 1130-1215 Robinet North American Light Vehicle … – 25 Growth Volume, CAGR% IHS Automotive |...

Michael RobinetManaging Director
IHS Automotive

© 2015 IHS
Presentation
ihs.com
IHS AUTOMOTIVE
Global Light Vehicle Forecast:Readying For The Next StageOctober 15, 2015
Michael Robinet, Managing Director, IHS Automotive Advisory

Contents
© 2015 IHS 3
• Economic Update
• Structural Factors Drive a Next Stage
• Industry Implications
IHS Automotive | October 2015

The “Great Divergence” Emerges
• Over the past four years global growth has been remarkably stable –between 2.5% and 3.0% …
• … Despite “rolling routs” in financial and commodity markets.
• However, the composition of growth has changed fundamentally – with a gradual growth acceleration among the advance economies and a sharp deceleration in the emerging world.
• Four trends have driven this divergence:
• Debt and deleveraging.
• The plunge in the price of oil and other commodities.
• Central banks moving on different paths.
• The rise of the dollar and the fall in other currencies.
4
IHS Automotive | October 2015

© 2015 IHS
-1
0
1
2
3
4
5
6
7
NAFTA OtherAmericas
WesternEurope
EmergingEurope
Mideast-N.Africa
Sub-Saharan
Africa
Japan Other Asia-Pacific
Ann
ual p
erce
nt c
hang
e
2013 2014 2015 2016 2017-21
5
Asia-Pacific (excluding Japan) and Sub-Saharan Africa will achieve the fastest growth in real GDP
IHS Automotive / October 2015
Real GDP
Source: IHS © 2015 IHS

© 2015 IHS 6
US crude oil prices: A big drop – but for how long?IHS Automotive / October 2015
Crude oil and natural gas prices
0
2
4
6
8
10
12
14
0
20
40
60
80
100
120
140
2000 2002 2004 2006 2008 2010 2012 2014 2016 2018 2020
Dol
lars
/mill
ion
Btu
Dol
lars
/bar
rel
Crude oil, WTI (Left scale) Natural gas, Henry Hub (Right scale)
Source: IHS Energy © 2015 IHS

© 2015 IHS 7
IHS Automotive / October 2015
Exchange rates per US dollar
Quarterly averages
Canadian dollar
Japanese yen
Euro
Chinese renminbi
0.6
0.8
1.0
1.2
1.4
1.6
1998 2001 2004 2007 2010 2013 20160.2
0.4
0.6
0.8
1.0
1.2
1998 2001 2004 2007 2010 2013 2016
4
5
6
7
8
9
1998 2001 2004 2007 2010 2013 201640
60
80
100
120
140
1998 2001 2004 2007 2010 2013 2016
Source: IHS © 2015 IHS Source: IHS © 2015 IHS
Source: IHS © 2015 IHS Source: IHS © 2015 IHS

© 2015 IHS
0
5
10
15
20
1980 1985 1990 1995 2000 2005 2010 2015 2020 2025
Perc
ent c
hang
e
Real GDP Real domestic demand
8
China’s economic growth will downshift in the long runIHS Automotive / October 2015
Real GDP
Source: IHS © 2015 IHS

Contents
© 2015 IHS 9
• Economic Update
• Structural Factors Drive a Next Stage
• Industry Implications
IHS Automotive | October 2015

© 2015 IHS 10
Global Light Vehicle Sales ForecastMarket now flat in 2015, but weakness in emerging markets only temporary
IHS Automotive | October 2015
0
5
10
15
20
25
30
35
40
45
50
2005
2006
2007
2008
2009
2010
2011
2012
2013
2014
2015
2016
2017
2018
2019
2020
2021
2022
Mill
ions
Mature Markets China Emerging Markets
Market Growth2009-'12 2012-'15 2015-'22
Mature 10% 12% 1%China 43% 26% 34%
Emerging 39% -12% 48%
Global sales remain at 86 million in 2015, but economic improvement will lift market 2% next year;
long-term prospects unchanged – 100m in 2020.
Source: IHS Automotive

© 2015 IHS 11
Mature Markets LV Sales ForecastReplacement demand is key driver – loyalty critical to OEMs
IHS Automotive | October 2015
6.7
20.3
1.3
14.5
0
2
4
6
8
10
12
14
16
18
20
22
Japan/ Korea North America Oceania West Europe
LV Sales Forecast (millions, 2005 – 2022)
Source: IHS Automotive

© 2015 IHS 12
Emerging Markets LV Sales ForecastRecent declines only temporary – fundamentals remain positive
IHS Automotive | October 2015
2.9
1.1
2.8
3.4
5.2
4.3
0
1
2
3
4
5
6
7
ASEAN Central Europe East Europe IndianSubcontinent
MiddleEast/Africa
South America
LV Sales Forecast (millions, 2005 – 2022)
Source: IHS Automotive

71
60
87
103
113
50
60
70
80
90
100
110
120
2007 2009 2011 2013 2015 2017 2019 2021 2023 2025
Mill
ions
Global Light Vehicle ProductionGlobal Growth Takes a Turn
13
27million
16million
11.3, 3.8%
7.1, 6.1%
3.9, 1.6%
1.7, 0.8%
1.1, 4.1%
1.1, 2.3%
-1.2, -0.8%
-2 0 2 4 6 8 10 12
China
S Asia
EU
NA
MEA
S Amer
Jap/Kor
Millions
2014 – 25 GrowthVolume, CAGR%
IHS Automotive | October 2015
10million

Bodytypes and Segments Shifting Legislation, Global Platforms and Consumer Desires
14
2000
2020
13%
27%
22%
7%
11%
9%
11%25%
28%18%
7%
8%
6%
8% SUV27%
Sedan27%
Hatchback19%
Van7%
MPV7%
Pickup6%
Other7%
6%
18%
26%17%
10%
23%
6%
21%
32%
17%
7%
17%
A6%
B25%
C31%
D16%
E6%
Full-Frame16%
20052015
2025
Global BodyType Share Global Production Segment Share
SUV has doubled since 2005 to be the predominant bodytype – global platforms
• Full-Frame share declines to to NA• B, C & D account for ~72% by 2025
IHS Presentation | October 2015
2005 2015 2025

0
10
20
30
40
50
60
70
80
2005 2010 2015 2020 2025
Global Engine Production by Cylinder Count
0 1-3 4 5-6 8+
4 Cyl.
1-3 Cyl.
8+ Cyl.0 Cyl.
5-6 Cyl.
Global Engine OutputSub 2.0L totals to 66% of the Market
0
20
40
60
80
100
120
2005 2010 2015 2020 2025
Engi
ne P
rodu
ctio
nM
illio
ns
Global Engine Production by Displacement
0L 0.1-0.9L 1-1.9L 2-2.9L 3-3.9L 4-4.9L 5L+
15
2025
52%
66%62%
<2.0L
IHS Presentation | October 2015
By 2025, 71% of powertrains will have some level of electrification

51%44%
.
…
44%
35%
12%
6%
42%
27%
13%
12%
3%
Global Transmission Type by Share
Manual Auto CVT DCTEVT Reduction AMT IVT
TransmissionVolume Stable, Greater Speeds
0
5
10
15
20
25
30
35
40
45
50
2005 2010 2015 2020 2025
Aut
o, D
CT
& A
MT
Tran
smis
sion
sM
illio
ns
Auto, DCT & AMT Trans by Speed
3 4 5 6 7 8 9 10 11
16
20252025
2015
2005
84% 93%
IHS Presentation | October 2015

Global Program Launches by RegionIncreased Launch Activity Raises Risk
© 2015 IHS
17 1825
16
3427
35 40 45 47
26
24 2023
26
3027
2529
28 29
27
2014
2116
14
1621
2019 15
17
21
16
33
31
32
26
32 19
44
28
358
5
817
523
2123
33
36
13
0
20
40
60
80
100
120
140
160
180
2010 2011 2012 2013 2014 2015 2016 2017 2018 2019 2020
# of
Lau
nche
s
North America Europe Japan/Korea China Other
17
73
115
169
Increased industry pace places pressure on talent, resources and infrastructure.
IHS Automotive | October 2015

77%17%
3%3% Det 346%
Asian 438%
Germ 311%
Other5%
NAFTA Production Share
NAFTA ProductionCustomer Mix is Changing….
0
2
4
6
8
10
12
14
16
18
20
2000 2003 2006 2009 2012 2015 2018 2021 2024
NA
LV P
rodu
ctio
nM
illio
ns
Detroit 3 Asian 4 German 3 Other
18
2000 2025
• German OEMs growing faster than Asian 4 and ‘Other’ OEMs.
• Detroit 3 may actually decline due to lack of capacity and competitors shifting of imported offerings to NA output.
IHS Automotive | October 2015
-53%
51%
69%
33%
-60%
-40%
-20%
0%
20%
40%
60%
80%
100%
120%
140%
160%
2015-25 CTG

US LV SalesPent-Up Demand Declines and Affordability Impacts Towards 2020
19
17.016.616.2
13.210.4
11.612.8
14.515.6
16.517.117.3
17.717.517.317.117.1
0
4
8
12
16
20
2005 2010 2015 2020
Mill
ions
IHS Presentation | October 2015
• Affordability crests with wealth effect• Credit availability at a peak• Legislation drives increased cost into the fleet• Employment growth and vehicle age supports

NA Light Vehicle Production
20
15.815.315.1 12.6
8.611.9
13.115.4
16.217.0
17.517.9
18.318.518.818.918.9
0%
20%
40%
60%
80%
100%
0
4
8
12
16
20
2005 2010 2015 2020
Mill
ions
NA Production Underutilized Capacity % Utilization
IHS Presentation | October 2015
• Production Co-Location• Exports• Global Production Flexibility

Bodytypes and Segments Shifting to Legislation and Consumers
21
2000
2020
17%
36%22%
2%
10%
7%6% 31%
35%
18%
1%
6%
4%5%
SUV36%
Sedan34%
Pickup15%
Hatchback6%
MPV3%
Coupe2%
Other4%
2%18%
22%
17%
41%
2%
24%
32%
16%
26%
B-Segment7%
C-Segment27%
D-Segment34%
E-Segment12%
Full Frame20%
2000 2010 2020
20002010
2020
NA BodyType Share NA Production Segment Share
SUV has doubled since 2000 to be the predominant bodytype – global platforms
• Full-Frame share is cut in half• B, C & D account for ~70% by 2020
IHS Presentation | October 2015

Three Distinct NA Production Clusters Coexist
0
1
2
3
4
5
6
7
8
9
10
2000
2001
2002
2003
2004
2005
2006
2007
2008
2009
2010
2011
2012
2013
2014
2015
2016
2017
2018
2019
2020
2021
2022
Mill
ions
Great Lakes
Mid-Mexico
Southeast
22
• Great Lakes driven by installed capacity shifting to 3 crew/3 shift structures to reach +7 million units
• Southeast reaching a formidable level of +5 million units by 2017 with virtually every NA OEM resident
• Mid-Mexico rises to ~4 million units by 2022 as new capacity, diversified demand and supplier investment act as enablers
© 2015 IHS
IHS Presentation | October 2015

NAFTA Program Launches by Country
© 2015 IHS
25 3 2 1
4 2 15 3 2
3
67
6 9 3 814
11 138
17
13
25
15
27
1917
2526
37
12
14%
26%
35%36%
0%
5%
10%
15%
20%
25%
30%
35%
40%
45%
50%
0
10
20
30
40
50
60
2010 2011 2012 2013 2014 2015 2016 2017 2018 2019 2020
Laun
ch S
hare
in M
exic
o (L
ine)
# of
Lau
nche
s by
Cou
ntry
(Bar
)
Canada Mexico United States Share in Mexico
23
IHS Presentation | October 2015
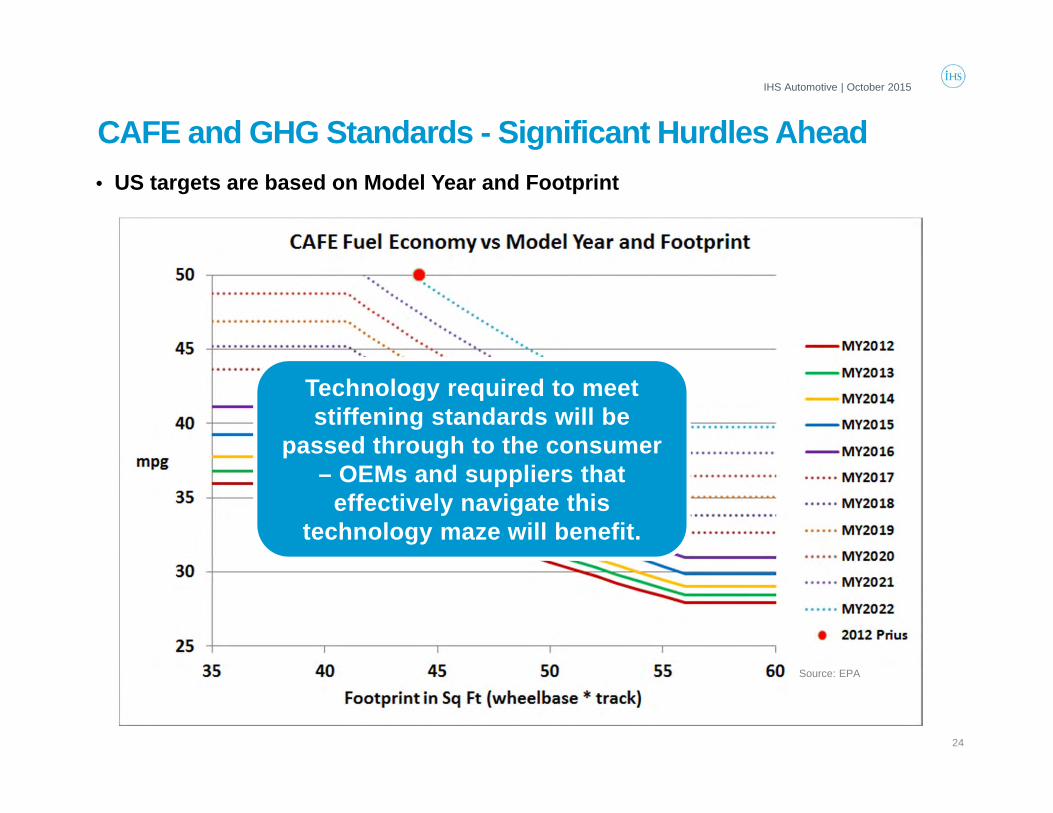
CAFE and GHG Standards - Significant Hurdles Ahead• US targets are based on Model Year and Footprint
24
Source: EPA
Technology required to meet stiffening standards will be
passed through to the consumer – OEMs and suppliers that
effectively navigate this technology maze will benefit.
IHS Automotive | October 2015

25
10987654321
Build Process Change /All-New Architecture
Integrate new build processes due to platform consolidation, increased flexibility and need to integrate new materials.
All-New/ Major Platform, Powertrain Packaging
All-new dimensions, locations points, powertrain packaging/fitments & suspension/ chassis structures.
Moderate Revision/Mid-cycle Enhancement
New interior/exterior styling, add bodystyles, significant trim levels and new/major powerteams changes.
Exterior Modifications & Electronic Changes
Exterior lighting, front/rear fascia trim, interior electronic content, software revisions, incremental electronic content.
The New Cadence 10 – 5 – 2.5 – 1 Increased Speed & Intensity Impacts Launch Requirements
10
5
2.5
1
IHS Automotive | October 2015

Material Forecast AnalysisTotal NA LV Industry By Pounds
• Growing total volume in NA 17.0 Mil to 19.0 Mil +12%• Aluminum with a scrap allowance rises to ~1.6 Bil lbs• Steel declines in larger segments – shift to Al
Pounds
IHS Automotive | October 2015

27
Material Forecast AnalysisFull-Size Full Frame Industry By Pounds
Pounds
IHS Automotive | October 2015

Launch Performance in the Spotlight
• Cadence is over 25% faster and competition more intense
• Highest content and most profitable versions are earliest in the cycle
• Integration of new materials/systems into the build process
• Launches curves need to improve:
• 7-year cycle – loss of ~2.0% of total cycle volume
• 5-year cycle – same launch curve – loss of ~3.5% of volume
• Quantifiable capacity & tier 2 & 3 readiness is critical
28
0.0
0.5
1.0
1.5
2.0
2.5
3.0
3.5
4.0
4.5
Volume Gross Profit
Bill
ions
Major Program Launch Loss
No Launch LossIdeal Launch LossActual Launch Loss
OEM should have lost
~several mil during the launch, it
instead lost ~ 2X the
expected
Inst
ead
of lo
sing
1.9
% o
f tot
al
cycl
e vo
lum
e, O
EM lo
st 3
.9%
IHS Automotive | October 2015

© 2015 IHS 29
Worldwide V2X market forecast – Expected Scenario
Worldwide V2X Regional Share Forecast – Expected Scenario
© 2015 IHSSource: IHS
0
20
40
60
80
100
120
140
2014 2015 2016 2017 2018 2019 2020 2021 2022 2023 2024 2025 2026 2027
#M
USA Western Europe Japan South Korea Rest of World
IHS Automotive | October 2015
Level 0-5 Driving automation expands with technology, legislation and
consumers demands. V2V & V2I rise exponentially after 2020.

Contents
© 2015 IHS 30
• Economic Update
• Structural Factors Drive a Next Stage
• Industry Implications
IHS Automotive | October 2015

© 2015 IHS
• OEM Consolidation Drivers• Scale economies
• Legislative compliance
• Tariff and non-tariff protections eliminated
• Lack of demand diversification, capital, supplier alliances and technical capability
• Capital (ROE) and production utilization is below average
• Candidates: • Most Chinese OEMs with SOE ownership
• Regional’ OEMs without appreciable volume in major segments or under intense
competitive pressures from larger players
• Regional OEMs serving divergent markets – lacking the ability to consolidate platforms,
build processes
• OEMs with ownership lacking a viable long-term vision
OEM & Supplier ConsolidationThe Post-2009 Free Ride is Over – The Next Stage Has Arrived
31
IHS Automotive | October 2015

© 2015 IHS
• Supplier Consolidation Drivers• Lack of global production or R/D scale to match platform footprints
• Lagging technology amidst a faster cadence
• Lack of a liable supply base
• Risk aversion – HR, capital & technology (I/P)
• Inability to achieve adequate ROE levels, ownership motivations
• Sector Candidates: • Regional tier 1 and tier 2 players focused on global platforms
• Those without appropriate global capabilities and relationships
• Areas under intense competition with high process turnover and shorter lifecycles
• Those focused on few customers with high demand variability
• Suppliers with ownership structures with shorter horizons/goals (PE/Family)
OEM & Supplier ConsolidationThe Post-2009 Free Ride is Over – The Next Stage Has Arrived
32
IHS Automotive | October 2015

© 2015 IHS
• Volumes flattening in several markets• Japan/Korea, North America and Europe grow below global trend
• Cadence is faster – challenging for Tier 2 & 3 regional suppliers• Increased complexity coupled with shorter cycles
• Launch readiness is critical• OEMs focus on optimization of early cycle volume
• Increased NA non-D3 capacity – new suppliers emerge• Global platforms, architectures increasing
• Ability to design and manufacture in key markets differentiates
• OEMs increasing pressure on suppliers for cost control• ‘One Cost’ models, APRs and enhanced oversight of purchased materials
• Exposure to China, South America and Russia raises pressure on other markets
An Inflection PointThe New Mantra ‘Launches, Logistics & Capacity’
33
IHS Automotive | October 2015

IHSTM AUTOMOTIVE
COPYRIGHT NOTICE AND DISCLAIMER © 2015 IHS. For internal use of IHS clients only.No portion of this report may be reproduced, reused, or otherwise distributed in any form without prior written consent, with the exception of any internal client distribution as may be permitted in the license agreement between client and IHS. Contentreproduced or redistributed with IHS permission must display IHS legal notices and attributions of authorship. The information contained herein is from sources considered reliable, but its accuracy and completeness are not warranted, nor are theopinions and analyses that are based upon it, and to the extent permitted by law, IHS shall not be liable for any errors or omissions or any loss, damage, or expense incurred by reliance on information or any statement contained herein. In particular,please note that no representation or warranty is given as to the achievement or reasonableness of, and no reliance should be placed on, any projections, forecasts, estimates, or assumptions, and, due to various risks and uncertainties, actual eventsand results may differ materially from forecasts and statements of belief noted herein. This report is not to be construed as legal or financial advice, and use of or reliance on any information in this publication is entirely at client’s own risk. IHS and theIHS logo are trademarks of IHS.
IHS Customer Care:Americas: +1 800 IHS CARE (+1 800 447 2273); [email protected] Europe, Middle East, and Africa: +44 (0) 1344 328 300; [email protected] Asia and the Pacific Rim: +604 291 3600; [email protected]
Thank You
Michael RobinetManaging Director, IHS Automotive Advisory [email protected]