1.12.2.G1 © Family Economics & Financial Education – Revised November 2004 – Investing Unit –...
44
© Family Economics & Financial Education – Revised November 2004 – Investing Unit – Language of the Stock Market Funded by a grant from Take Charge America, Inc. to the Department of Health and Human Development at Montana State University – Bozeman 1.12.2.G 1 The Language of the Stock Market Family Economics & Financial Education
-
date post
20-Dec-2015 -
Category
Documents
-
view
214 -
download
1
Transcript of 1.12.2.G1 © Family Economics & Financial Education – Revised November 2004 – Investing Unit –...

© Family Economics & Financial Education – Revised November 2004 – Investing Unit – Language of the Stock MarketFunded by a grant from Take Charge America, Inc. to the Department of Health and Human Development at Montana State
University – Bozeman
1.12.2.G1
The Language of the
Stock MarketFamily Economics & Financial Education

© Family Economics & Financial Education – Revised November 2004 – Investing Unit – Language of the Stock MarketFunded by a grant from Take Charge America, Inc. to the Department of Health and Human Development at Montana State
University – Bozeman
1.12.2.G1
Why Learn About Stocks
• The stock market is the core of America’s economic system– Stock is a share of ownership in the
assets and earnings of a company– Bond is a type of debt that a company
issues to investors for a specified amount of time.
– Stock market is a general term used to describe all transactions involving the buying and selling of stocks and bonds issued by a company

© Family Economics & Financial Education – Revised November 2004 – Investing Unit – Language of the Stock MarketFunded by a grant from Take Charge America, Inc. to the Department of Health and Human Development at Montana State
University – Bozeman
1.12.2.G1
Why Companies Issue Stock
When a company would like to grow, it issues stocks to raise funds and pay for ongoing business activities
• It is popular because:– The company does not have to repay
the money– Paying dividends is optional
•Dividends are distributions of earnings paid to stockholders

© Family Economics & Financial Education – Revised November 2004 – Investing Unit – Language of the Stock MarketFunded by a grant from Take Charge America, Inc. to the Department of Health and Human Development at Montana State
University – Bozeman
1.12.2.G1
Risk vs. Return
• On average, stocks have a high rate of return– The increase or decrease in the original
purchase price of an investment
• Higher rate of return = greater risk– Uncertainty about the outcome of an
investment
• Stocks provide portfolio diversification– Money invested in a variety of investment
tools

© Family Economics & Financial Education – Revised November 2004 – Investing Unit – Language of the Stock MarketFunded by a grant from Take Charge America, Inc. to the Department of Health and Human Development at Montana State
University – Bozeman
1.12.2.G1
2 Basic Types of Stock
Common StockVs.
Preferred Stock

© Family Economics & Financial Education – Revised November 2004 – Investing Unit – Language of the Stock MarketFunded by a grant from Take Charge America, Inc. to the Department of Health and Human Development at Montana State
University – Bozeman
1.12.2.G1
Common Stock
• Common stock – shares or units of ownership in a public corporation– Most basic form of ownership– One vote per share owned to determine
company’s board of directors• Ways the stock value can change
– The dollar value increases or decreases– Stock split occurs – shares owned by
existing stockholders are divided into a larger number of shares
– A merger of two companies– Dividends are paid

© Family Economics & Financial Education – Revised November 2004 – Investing Unit – Language of the Stock MarketFunded by a grant from Take Charge America, Inc. to the Department of Health and Human Development at Montana State
University – Bozeman
1.12.2.G1
Preferred Stock
• Preferred stock – shares which pay fixed dividends and have priority over common stock– Less risk than common stock– No voting rights– Dividends are stated as a
percentage known as the par value•Fixed value stated on the stock
certificate

© Family Economics & Financial Education – Revised November 2004 – Investing Unit – Language of the Stock MarketFunded by a grant from Take Charge America, Inc. to the Department of Health and Human Development at Montana State
University – Bozeman
1.12.2.G1
Stock Classifications

© Family Economics & Financial Education – Revised November 2004 – Investing Unit – Language of the Stock MarketFunded by a grant from Take Charge America, Inc. to the Department of Health and Human Development at Montana State
University – Bozeman
1.12.2.G1
Stock Classifications
• A variety of type of stocks are necessary for a diversified portfolio
• Seven basic classifications– Growth, Income, Value, Cyclical,
Countercyclical, Speculative, Blue Chip
• Some stocks can be classified into more than one category

© Family Economics & Financial Education – Revised November 2004 – Investing Unit – Language of the Stock MarketFunded by a grant from Take Charge America, Inc. to the Department of Health and Human Development at Montana State
University – Bozeman
1.12.2.G1
Growth Stock
• Growth stocks are from companies who have a consistent record of relatively rapid growth and earnings in all economic conditions– New companies expending product lines– Usually does not pay dividends– Beta is 1.5 or higher– Examples include Coca-Cola and Wal-
Mart

© Family Economics & Financial Education – Revised November 2004 – Investing Unit – Language of the Stock MarketFunded by a grant from Take Charge America, Inc. to the Department of Health and Human Development at Montana State
University – Bozeman
1.12.2.G1
Income Stock
• Income stocks pay higher than average dividends– Company only retains small portion
of profits– Companies with a steady stream of
income such as utility companies– Beta is less than 1.0
© Family Economics & Financial Education – Revised November 2004 – Investing Unit – Language of the Stock MarketFunded by a grant from Take Charge America, Inc. to the Department of Health and Human Development at Montana State
University – Bozeman
1.12.2.G1
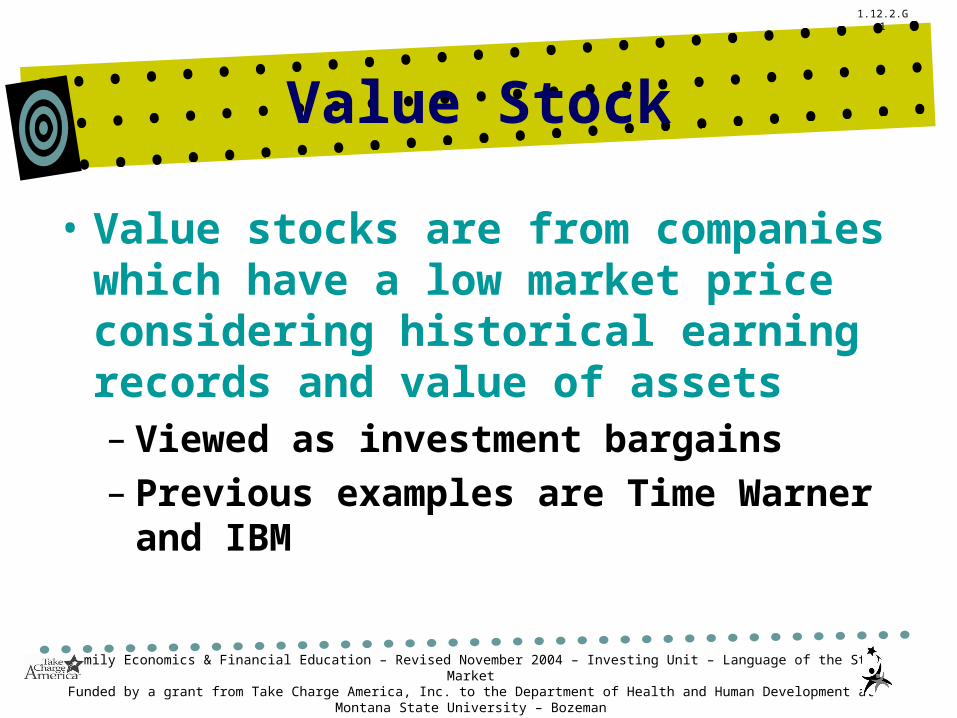
Value Stock
• Value stocks are from companies which have a low market price considering historical earning records and value of assets– Viewed as investment bargains– Previous examples are Time Warner
and IBM

© Family Economics & Financial Education – Revised November 2004 – Investing Unit – Language of the Stock MarketFunded by a grant from Take Charge America, Inc. to the Department of Health and Human Development at Montana State
University – Bozeman
1.12.2.G1
Cyclical Stock
• Cyclical stocks are influenced by changes in the economic business cycle– Companies which operate in major
consumer dependent industries •Automobiles, housing, airlines
– Beta is generally 1.0

© Family Economics & Financial Education – Revised November 2004 – Investing Unit – Language of the Stock MarketFunded by a grant from Take Charge America, Inc. to the Department of Health and Human Development at Montana State
University – Bozeman
1.12.2.G1
Countercyclical Stock
• Countercyclical stocks are companies which give consistent returns even when the economy is suffering– Products are always in demand– Good for investors who want dividends– Examples are utility companies and
grocery stores– Beta is 1.0 or below, even negative
© Family Economics & Financial Education – Revised November 2004 – Investing Unit – Language of the Stock MarketFunded by a grant from Take Charge America, Inc. to the Department of Health and Human Development at Montana State
University – Bozeman
1.12.2.G1
Speculative Stock
• Speculative stocks are companies with potential for substantial earnings– Very high risk stocks– Examples include internet and
video game companies– Beta is 2.0

© Family Economics & Financial Education – Revised November 2004 – Investing Unit – Language of the Stock MarketFunded by a grant from Take Charge America, Inc. to the Department of Health and Human Development at Montana State
University – Bozeman
1.12.2.G1
Blue-chip Stock
• Blue-chip stocks are from nationally recognized companies with long records of profit, dividend payments, and a good reputation for management– Less risky– Grow at a consistent rate– Examples are McDonalds, Wal-Mart
and General Electric

© Family Economics & Financial Education – Revised November 2004 – Investing Unit – Language of the Stock MarketFunded by a grant from Take Charge America, Inc. to the Department of Health and Human Development at Montana State
University – Bozeman
1.12.2.G1
Researching A Stock

© Family Economics & Financial Education – Revised November 2004 – Investing Unit – Language of the Stock MarketFunded by a grant from Take Charge America, Inc. to the Department of Health and Human Development at Montana State
University – Bozeman
1.12.2.G1
Book Value
• Book value is the net worth of a company
Assets-Liabilities = Book value
– Information can be found in the company’s annual report
– Indicates what would happen if a company’s assets were sold, debts paid, and proceeds distributed to stockholders

© Family Economics & Financial Education – Revised November 2004 – Investing Unit – Language of the Stock MarketFunded by a grant from Take Charge America, Inc. to the Department of Health and Human Development at Montana State
University – Bozeman
1.12.2.G1
Earnings per Share
• How much income a company has available to pay in dividends and reinvest as retained earnings on a per share basis After tax annual earnings
= Earnings per shareTotal number of shares of common stock
– Information can be found in the business section of many newspapers
– Indicates how well a company is doing (the quality of products, customer service, and operations management)
© Family Economics & Financial Education – Revised November 2004 – Investing Unit – Language of the Stock MarketFunded by a grant from Take Charge America, Inc. to the Department of Health and Human Development at Montana State
University – Bozeman
1.12.2.G1
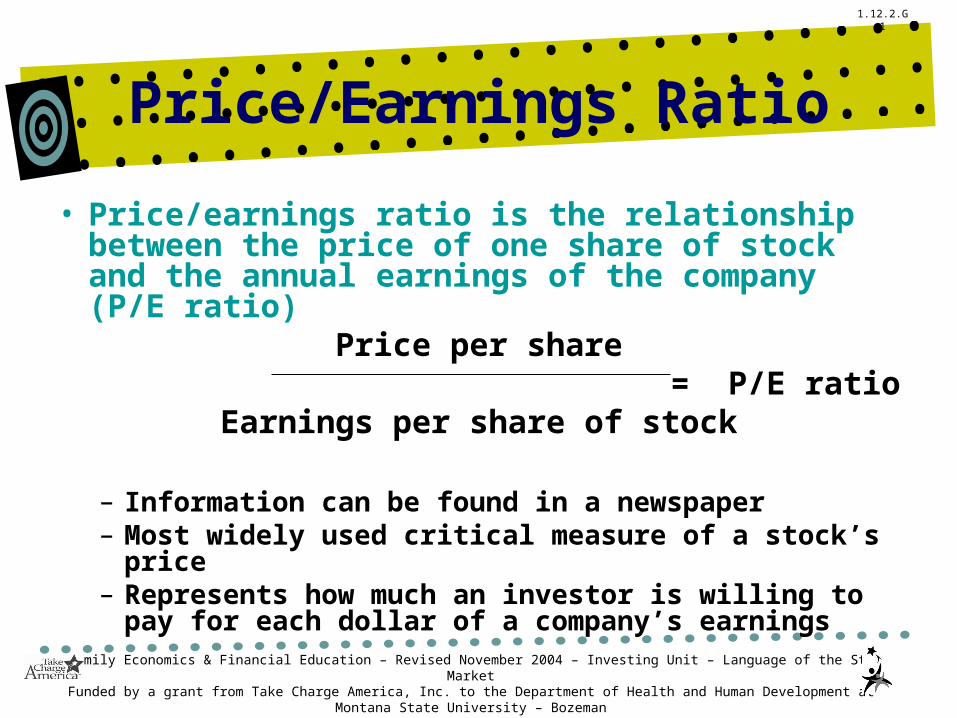
Price/Earnings Ratio
• Price/earnings ratio is the relationship between the price of one share of stock and the annual earnings of the company (P/E ratio)
Price per share = P/E ratio
Earnings per share of stock
– Information can be found in a newspaper– Most widely used critical measure of a stock’s
price– Represents how much an investor is willing to
pay for each dollar of a company’s earnings

© Family Economics & Financial Education – Revised November 2004 – Investing Unit – Language of the Stock MarketFunded by a grant from Take Charge America, Inc. to the Department of Health and Human Development at Montana State
University – Bozeman
1.12.2.G1
P/E Ratio Continued
– Most companies have between a 5-25 P/E ratio•7-10 P/E ratios are financially successful
companies•15-25 P/E ratios are rapidly growing companies•40-50 P/E ratios are speculative companies
– Lower P/E stocks pay higher dividends and have less risk, lower prices, and slow growth
– High P/E ratios indicate the firm is expected to have a lot of growth in the future
© Family Economics & Financial Education – Revised November 2004 – Investing Unit – Language of the Stock MarketFunded by a grant from Take Charge America, Inc. to the Department of Health and Human Development at Montana State
University – Bozeman
1.12.2.G1
Beta
• Beta measures a stocks volatility compared to overall changes in the stock market– If a stock has a beta of +1.5 and the market
went up 10%, the value of the stock is expected to rise 15%
– Average beta is between +0.5 - +2.0– Information can be found by doing an internet
search for “Stock ticker symbol + beta”– A higher beta indicates more risk because the
stock price change will be more drastic

© Family Economics & Financial Education – Revised November 2004 – Investing Unit – Language of the Stock MarketFunded by a grant from Take Charge America, Inc. to the Department of Health and Human Development at Montana State
University – Bozeman
1.12.2.G1
Reading Stock Quotes

© Family Economics & Financial Education – Revised November 2004 – Investing Unit – Language of the Stock MarketFunded by a grant from Take Charge America, Inc. to the Department of Health and Human Development at Montana State
University – Bozeman
1.12.2.G1
Year to Date Percent Change
YTD%
52-WeekHigh
Low
Stock
Div YLD%
P/E Vol100s
High
Low
Close
NetChg
-16.3 43 36 AAR .33 2.5 22 1479 40 37 42 .027• Year to date percent change is the
stock price percent change from January 1st of the current year– If a stock was $43.00 on January 1st
and $36.00 on July 30th,, the percentage change would be -16.3%

© Family Economics & Financial Education – Revised November 2004 – Investing Unit – Language of the Stock MarketFunded by a grant from Take Charge America, Inc. to the Department of Health and Human Development at Montana State
University – Bozeman
1.12.2.G1
52-Week High Low
YTD%
52-WeekHigh Low
Stock
Div YLD%
P/E Vol100s
High
Low Close
NetChg
-16.3 43 36 AAR .33 2.5 22 1479 40 37 42 .027
52-Week High & Low shows the highest and lowest prices the stock was sold per share during the last
52 weeks
© Family Economics & Financial Education – Revised November 2004 – Investing Unit – Language of the Stock MarketFunded by a grant from Take Charge America, Inc. to the Department of Health and Human Development at Montana State
University – Bozeman
1.12.2.G1
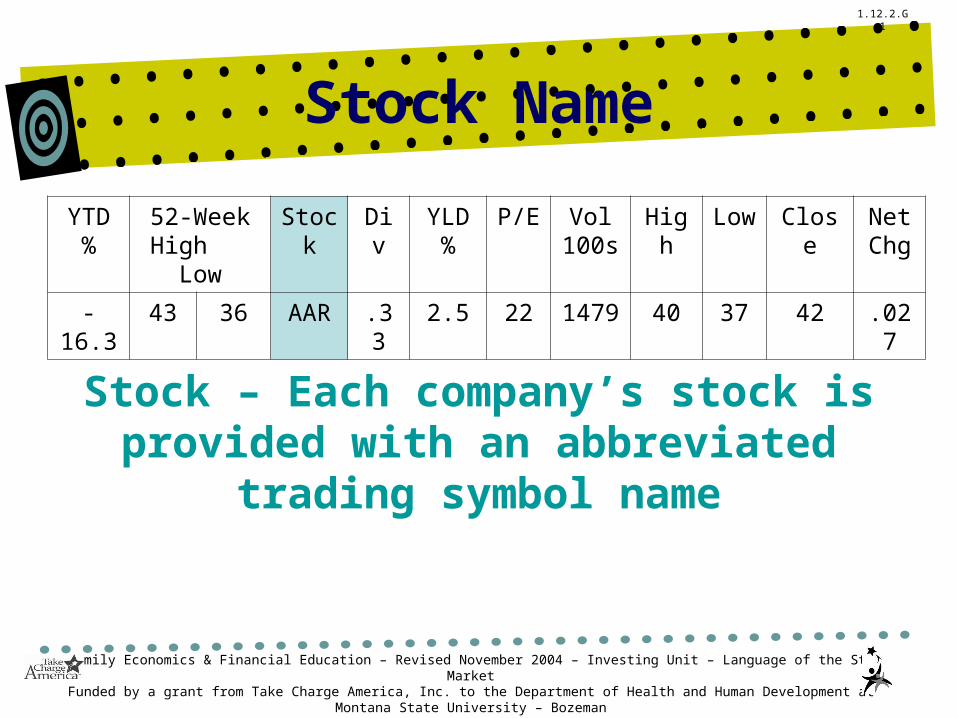
Stock Name
YTD%
52-WeekHigh Low
Stock
Div YLD%
P/E Vol100s
High
Low
Close NetChg
-16.3 43 36 AAR .33 2.5 22 1479 40 37 42 .027
Stock – Each company’s stock is provided with an abbreviated
trading symbol name

© Family Economics & Financial Education – Revised November 2004 – Investing Unit – Language of the Stock MarketFunded by a grant from Take Charge America, Inc. to the Department of Health and Human Development at Montana State
University – Bozeman
1.12.2.G1
Dividends per share
YTD%
52-WeekHigh Low
Stock
Div YLD%
P/E Vol100s
High Low
Close
NetChg
-16.3 43 36 AAR .33 2.5 22 1479 40 37 42 .027
• Dividends per share is the total cash paid to common stockholders per share annually– Helpful when determining the type of stock– If a company paid $10,000 in dividends for
30,000 shares, the dividends per share would be $0.33

© Family Economics & Financial Education – Revised November 2004 – Investing Unit – Language of the Stock MarketFunded by a grant from Take Charge America, Inc. to the Department of Health and Human Development at Montana State
University – Bozeman
1.12.2.G1
Dividend Yield Percentage
YTD%
52-WeekHigh Low
Stock Div YLD%
P/E Vol100s
High Low
Close
NetChg
-16.3
43 36 AAR .33 2.5 22 1479 40 37 42 .027
• Dividend yield percentage is the dividend expressed as a percentage of the price of the share– If a company paid $1.25 in dividends for a stock with
a market price of $50.00, the dividend yield percentage would be 2.5% (1.25/50)
– Helpful to know how much income to expect. A company paying high dividends is not reinvesting money to grow.

© Family Economics & Financial Education – Revised November 2004 – Investing Unit – Language of the Stock MarketFunded by a grant from Take Charge America, Inc. to the Department of Health and Human Development at Montana State
University – Bozeman
1.12.2.G1
Price/Earnings Ratio
YTD%
52-WeekHigh Low
Stock
Div YLD%
P/E Vol100s
High
Low Close
NetChg
-16.3
43 36 AAR .33 2.5 22 1479 40 37 42 .027
• Price/earnings ratio is the closing price of the share compared to the annual earnings per share– If the stock’s market price is $50.00 and the
earnings per share is $2.25, the P/E ratio is 22.2• For every dollar the company earns, the stock’s
market price is worth $22.00– A high number indicates people are optimistic about
the company and health of the market.
© Family Economics & Financial Education – Revised November 2004 – Investing Unit – Language of the Stock MarketFunded by a grant from Take Charge America, Inc. to the Department of Health and Human Development at Montana State
University – Bozeman
1.12.2.G1
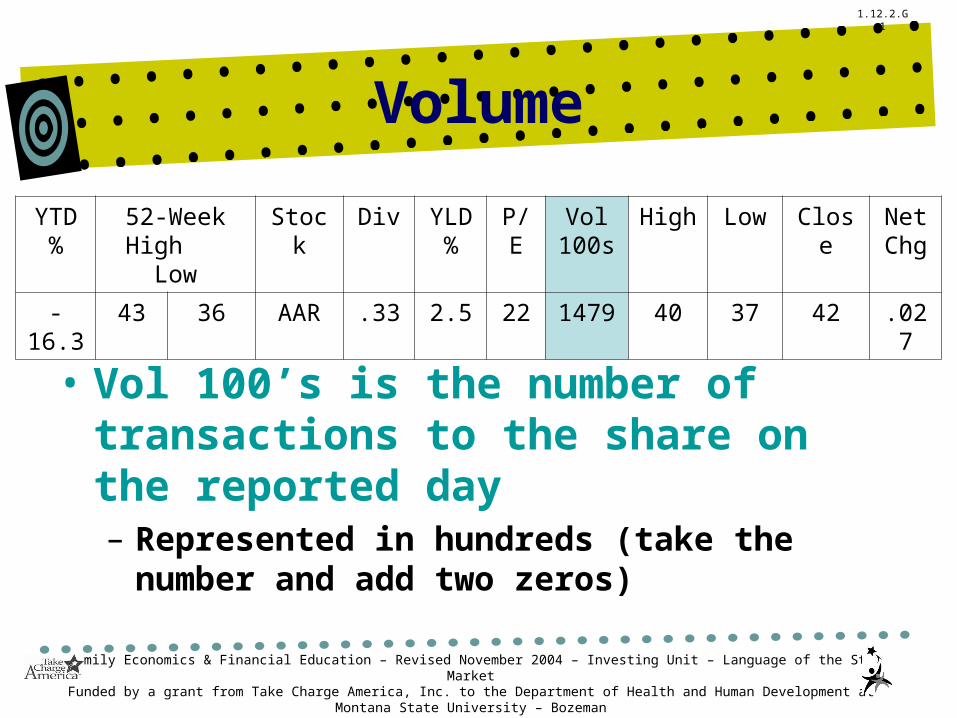
Volume
YTD%
52-WeekHigh Low
Stock Div YLD%
P/E Vol100s
High Low Close NetChg
-16.3
43 36 AAR .33 2.5 22 1479 40 37 42 .027
• Vol 100’s is the number of transactions to the share on the reported day– Represented in hundreds (take the
number and add two zeros)

© Family Economics & Financial Education – Revised November 2004 – Investing Unit – Language of the Stock MarketFunded by a grant from Take Charge America, Inc. to the Department of Health and Human Development at Montana State
University – Bozeman
1.12.2.G1
High and Low
YTD%
52-WeekHigh Low
Stock
Div YLD%
P/E Vol100s
High Low
Close
NetChg
-16.3 43 36 AAR .33 2.5 22 1479 40 37 42 .027
• High and low entries represent the high and low selling price of one share for the previous day

© Family Economics & Financial Education – Revised November 2004 – Investing Unit – Language of the Stock MarketFunded by a grant from Take Charge America, Inc. to the Department of Health and Human Development at Montana State
University – Bozeman
1.12.2.G1
Close
YTD%
52-WeekHigh Low
Stock
Div YLD%
P/E Vol100s
High
Low Close
NetChg
-16.3 43 36 AAR .33 2.5 22 1479 40 37 42 .027
• Close is the price of the last share sold for the day

© Family Economics & Financial Education – Revised November 2004 – Investing Unit – Language of the Stock MarketFunded by a grant from Take Charge America, Inc. to the Department of Health and Human Development at Montana State
University – Bozeman
1.12.2.G1
Net Change
YTD%
52-WeekHigh Low
Stock
Div YLD%
P/E Vol100s
High
Low
Close
NetChg
-16.3 43 36 AAR .33 2.5 22 1479 40 37 42 .027
• Net change is the difference between the closing price of the share from the prior day and the current day
© Family Economics & Financial Education – Revised November 2004 – Investing Unit – Language of the Stock MarketFunded by a grant from Take Charge America, Inc. to the Department of Health and Human Development at Montana State
University – Bozeman
1.12.2.G1
How Well the Stock Market is Doing
Overall

© Family Economics & Financial Education – Revised November 2004 – Investing Unit – Language of the Stock MarketFunded by a grant from Take Charge America, Inc. to the Department of Health and Human Development at Montana State
University – Bozeman
1.12.2.G1
3 Basic Indicators
• Dow Jones Industrial Average (“DOW”)– Lists the 30 leading industrial blue chip stocks
• Standard and Poor’s 500 Composite Index– Covers market activity for 500 stocks– More accurate than DOW because it evaluates
a greater variety of stock
• National Association of Security Dealers Automated Quotations (“NASDAQ”)– Monitors fast moving technology companies– Speculative stocks, show dramatic ups and
downs

© Family Economics & Financial Education – Revised November 2004 – Investing Unit – Language of the Stock MarketFunded by a grant from Take Charge America, Inc. to the Department of Health and Human Development at Montana State
University – Bozeman
1.12.2.G1
Ups and Downs
• The term bull market means the market is doing well because investors are optimistic about the economy and are purchasing stocks
• The term bear market means the market is doing poorly and investors are not purchasing stocks or selling stocks already owned

© Family Economics & Financial Education – Revised November 2004 – Investing Unit – Language of the Stock MarketFunded by a grant from Take Charge America, Inc. to the Department of Health and Human Development at Montana State
University – Bozeman
1.12.2.G1
Purchasing Stock

© Family Economics & Financial Education – Revised November 2004 – Investing Unit – Language of the Stock MarketFunded by a grant from Take Charge America, Inc. to the Department of Health and Human Development at Montana State
University – Bozeman
1.12.2.G1
Brokers
• A Broker is a person who is licensed to buy and sell stocks, provide investment advice, and collect a commission on each purchase or sale– Purchases stocks on an organized
exchange (stock market)– Over ¾ of all stocks are bought and
sold on an organized exchange

© Family Economics & Financial Education – Revised November 2004 – Investing Unit – Language of the Stock MarketFunded by a grant from Take Charge America, Inc. to the Department of Health and Human Development at Montana State
University – Bozeman
1.12.2.G1
Organized Exchanges
• Minimum requirements for a stock to ensure only reputable companies are used
• Each exchange has a limited number of seats available which brokerage firms purchase to give them the legal right to buy and sell stocks on the exchange

© Family Economics & Financial Education – Revised November 2004 – Investing Unit – Language of the Stock MarketFunded by a grant from Take Charge America, Inc. to the Department of Health and Human Development at Montana State
University – Bozeman
1.12.2.G1
New York Stock Exchange
• New York Stock Exchange (NYSE)– Oldest and largest, began in 1792– 1,366 seats available– 2,800 companies– Average stock price is $33.00– Strict requirements
© Family Economics & Financial Education – Revised November 2004 – Investing Unit – Language of the Stock MarketFunded by a grant from Take Charge America, Inc. to the Department of Health and Human Development at Montana State
University – Bozeman
1.12.2.G1
American Stock Exchange
• American Stock Exchange– Began in 1849– 2nd largest exchange– It’s requirements are not as strict
as NYSE allowing younger, smaller companies to list
– Average stock price is $24.00
© Family Economics & Financial Education – Revised November 2004 – Investing Unit – Language of the Stock MarketFunded by a grant from Take Charge America, Inc. to the Department of Health and Human Development at Montana State
University – Bozeman
1.12.2.G1
Regional Stock Exchanges
• Regional Stock Exchanges– Stocks are traded to investors
living in a specific geographical area• Including Boston, Cincinnati,
Philadelphia, Spokane

© Family Economics & Financial Education – Revised November 2004 – Investing Unit – Language of the Stock MarketFunded by a grant from Take Charge America, Inc. to the Department of Health and Human Development at Montana State
University – Bozeman
1.12.2.G1
NASDAQ
• National Association of Securities Dealers Automated Quotations– Stocks are traded in an over the
counter electronic market– 4,000 small companies
•Company requirements are not as strict
– More volatile because companies are young and new
– Average stock price is $11.00

© Family Economics & Financial Education – Revised November 2004 – Investing Unit – Language of the Stock MarketFunded by a grant from Take Charge America, Inc. to the Department of Health and Human Development at Montana State
University – Bozeman
1.12.2.G1
Supply vs. Demand
• The stock exchange is organized based upon the laws of supply and demand– Supply is the relationship of prices to the
quantities of a good or service sellers are willing to offer for sale at any given point in time
– Demand is the relationship of prices to the quantities and the corresponding quantities of a good or service buyers are willing to purchase at any given point in time.