
11/1/2011
32
11/1/2011 • Summary statement on runoff generation – You summarized the classic “named” mechanisms – My view – 2 requisite conditions •1 •2 • Key task: incorporate process knowledge into predictive models • Next Project
-
Upload
gwendolyn-winters -
Category
Documents
-
view
17 -
download
0
description
11/1/2011. Summary statement on runoff generation You summarized the classic “named” mechanisms My view – 2 requisite conditions 1 2 Key task: incorporate process knowledge into predictive models Next Project. How to Apply Process Information to Improve Prediction. flow. Precipitation. - PowerPoint PPT Presentation
Transcript of 11/1/2011

11/1/2011
• Summary statement on runoff generation– You summarized the classic “named”
mechanisms– My view – 2 requisite conditions
• 1• 2
• Key task: incorporate process knowledge into predictive models
• Next Project

How to Apply Process Information to Improve Prediction
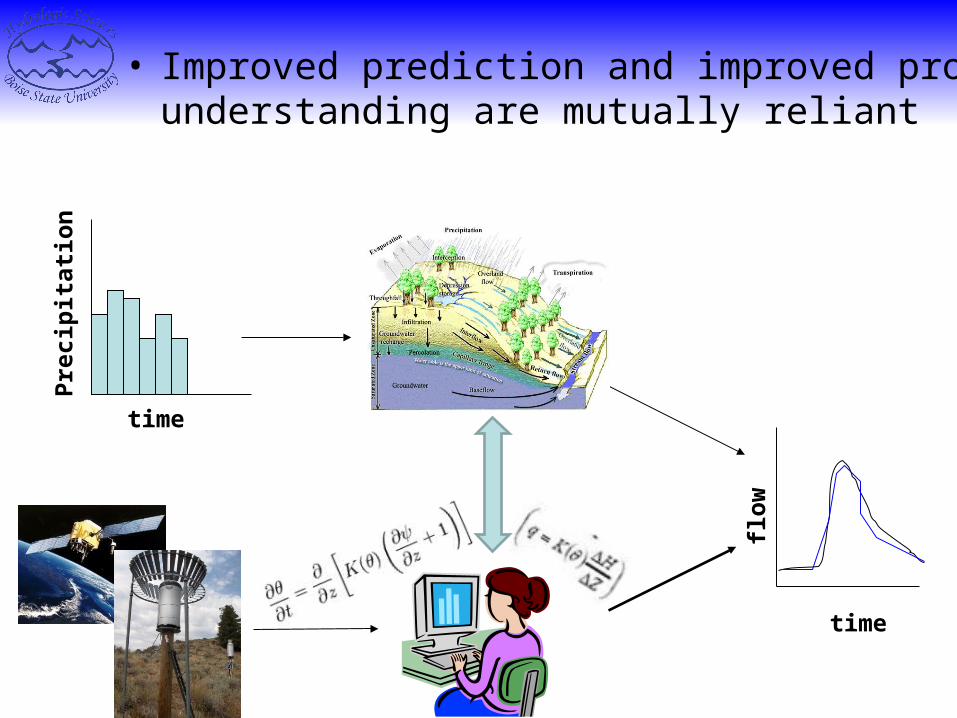
• Improved prediction and improved process understanding are mutually reliant
time
Pre
cip
itat
ion
time
flo
w

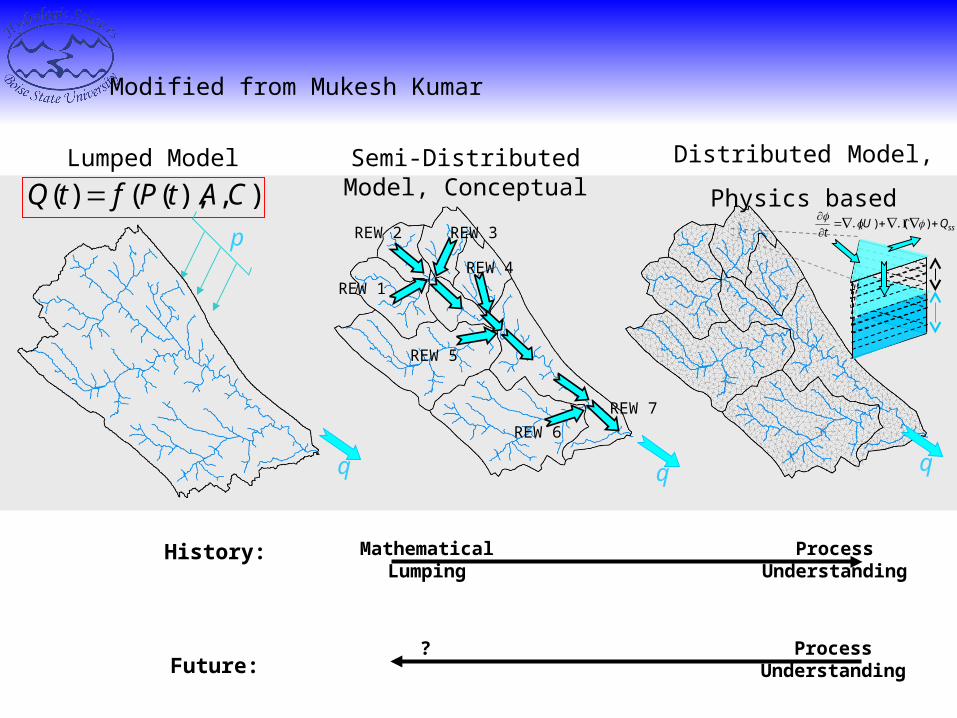
Lumped Model Distributed Model,
Physics based
Semi-Distributed Model, Conceptual),),(()( CAtPftQ
p
q
REW 1
REW 2 REW 3
REW 4
REW 5
REW 6
REW 7
Data Requirement:
Computational Requirement:
Small Large
Process Representation:Parametric Physics-Based
Predicted States Resolution:Coarser Fine
ssQUt
).().(
Perceived Intellectual Value:Small Large
q q
Modified from Mukesh Kumar

Lumped Model Distributed Model,
Physics based
Semi-Distributed Model, Conceptual),),(()( CAtPftQ
p
q
REW 1
REW 2 REW 3
REW 4
REW 5
REW 6
REW 7
Outcome:Right for Wrong
Reasons
Wrong for Right Reasons
ssQUt
).().(
q q
History:Mathematical
LumpingProcess
Understanding
Future:? Process
Understanding
Modified from Mukesh Kumar
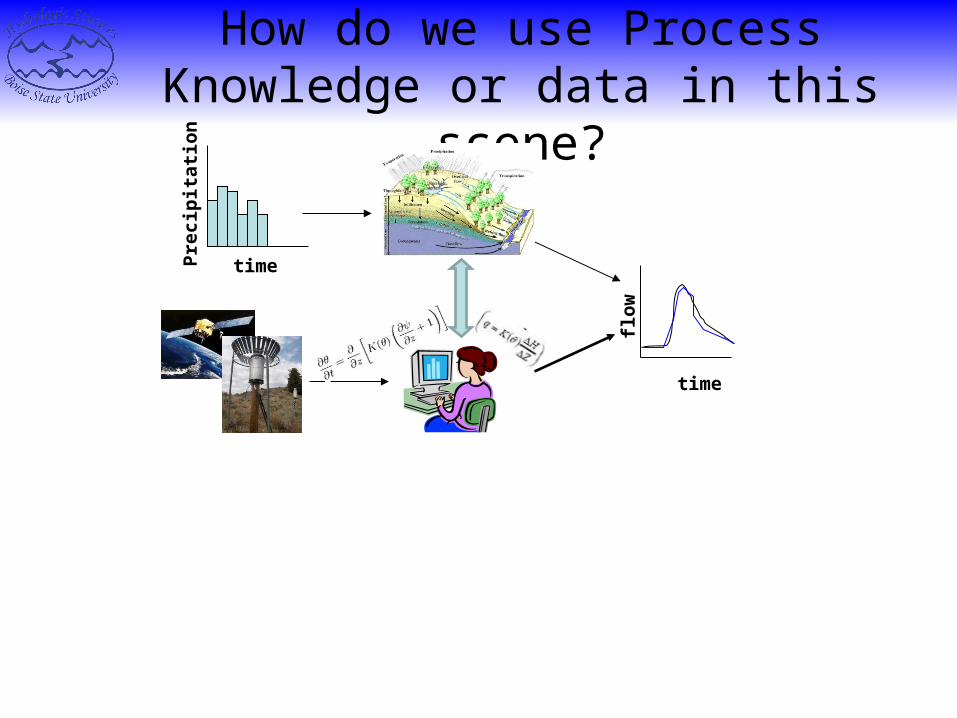
How do we use Process Knowledge or data in this scene?
time
Pre
cip
itat
ion
time
flo
w
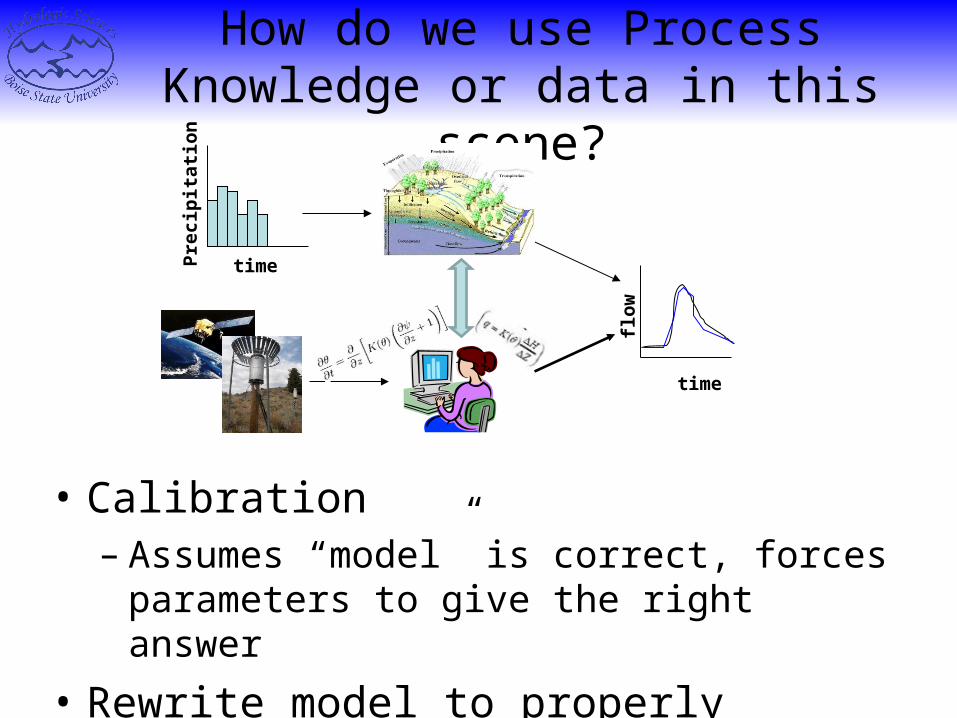
How do we use Process Knowledge or data in this scene?
• Calibration– Assumes “model” is correct, forces
parameters to give the right answer
• Rewrite model to properly represent processes
time
Pre
cip
itat
ion
time
flo
w
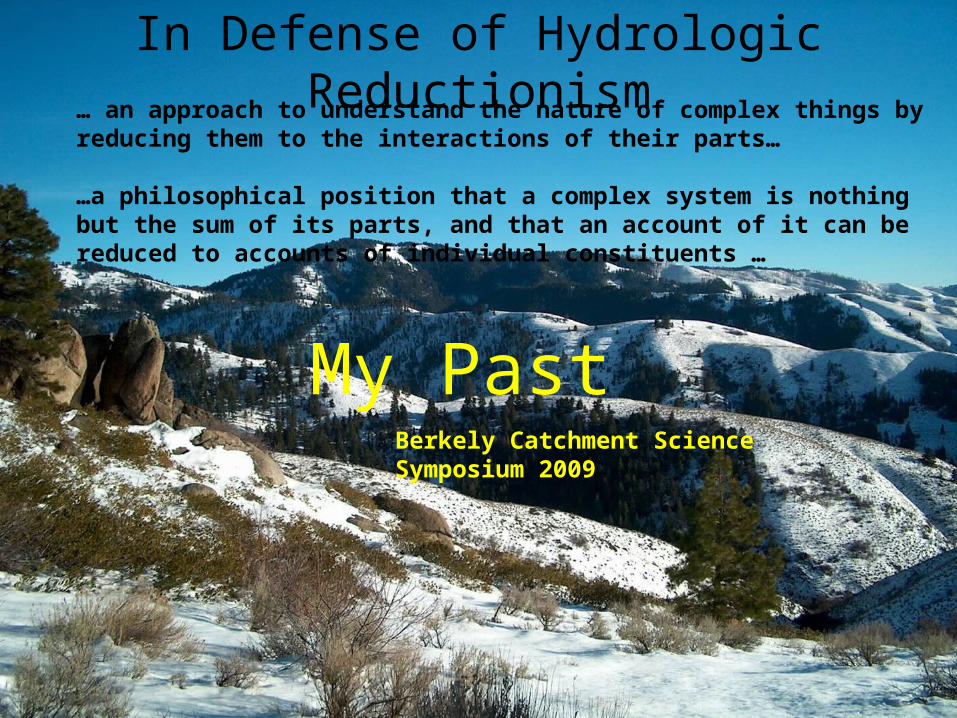
In Defense of Hydrologic Reductionism… an approach to understand the nature of complex things by reducing them to the interactions of their parts…
…a philosophical position that a complex system is nothing but the sum of its parts, and that an account of it can be reduced to accounts of individual constituents …
My PastBerkely Catchment Science Symposium 2009

My Past:In Defense of Reductionism
• Newton was right
• Model failures result from poor characterization of heterogeneous landscapes leads to– No emergent properties
• Our community struggles to identify grand, overarching questions because…there are no grand unknowns
• Hydrology is a local science

The Response Ciaran Harman, Catchment Science Symposium, EGU 2011
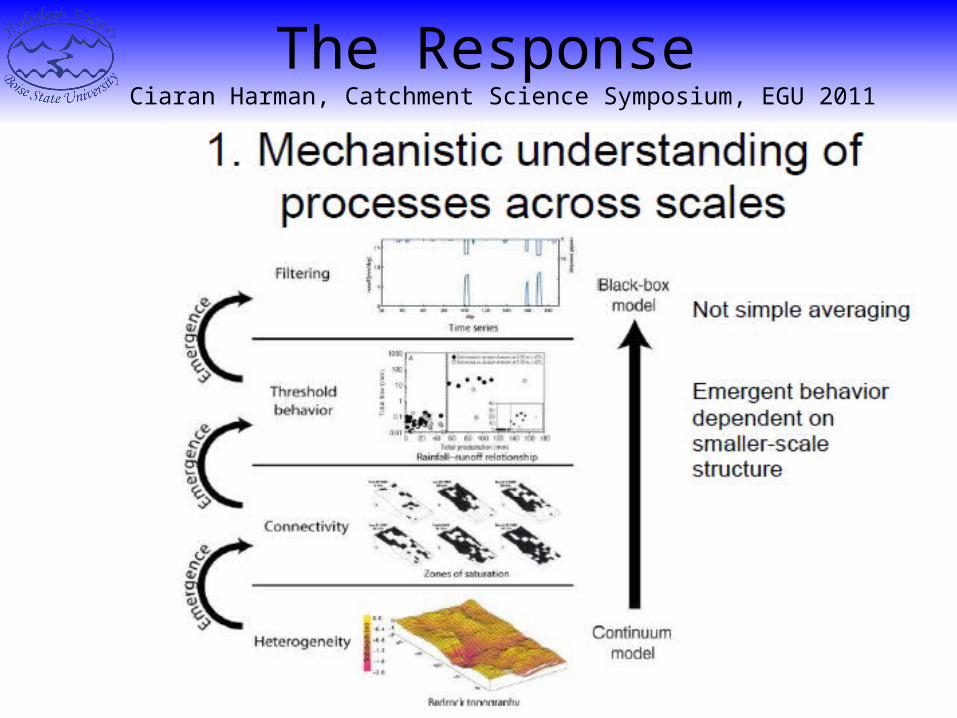
The Response Ciaran Harman, Catchment Science Symposium, EGU 2011

Catchments Lump Processes
Emergent Behavior
Decades of case studies have documented the many ways that water moves downhill
Recent work has identified many Physically Lumped Properties that are manifestations of the system of states and fluxes
-A physical basis for lumped parameter modeling

Physically Lumped Properties(emergent behavior)
• Connectivity
• Thresholds
• Residence Time

Physically Lumped Properties
• Connectivity
• Thresholds
• Residence Time
0
200
400
600
7/2 8/31 10/30 12/29 2/27 4/28 6/27
Dep
th (
mm
)
Total Precipitation
Water Input
Evapotranspiration
0
0.1
0.2
7/2 8/31 10/30 12/29 2/27 4/28 6/27
So
il M
ois
ture
0
10
20
30
Bed
rock F
low
(m
m)
15 cm30 cm65 cmBedrock Flow
0
20
40
60
7/2 8/31 10/30 12/29 2/27 4/28 6/27
Str
eam
flo
w
(lit
ers/
min
)
5
8
(m
g/L
)
Streamflow
dissolved solids

Threshold responses
0
1
0 10 20 30 40 50Moisture content (%)
Ru
no
ff r
atio
Satellite
Tarrawarra
Courtesy of Roger GraysonRoger Grayson, pers. Com.
Physically Lumped Properties
• Connectivity
• Thresholds
• Residence Time
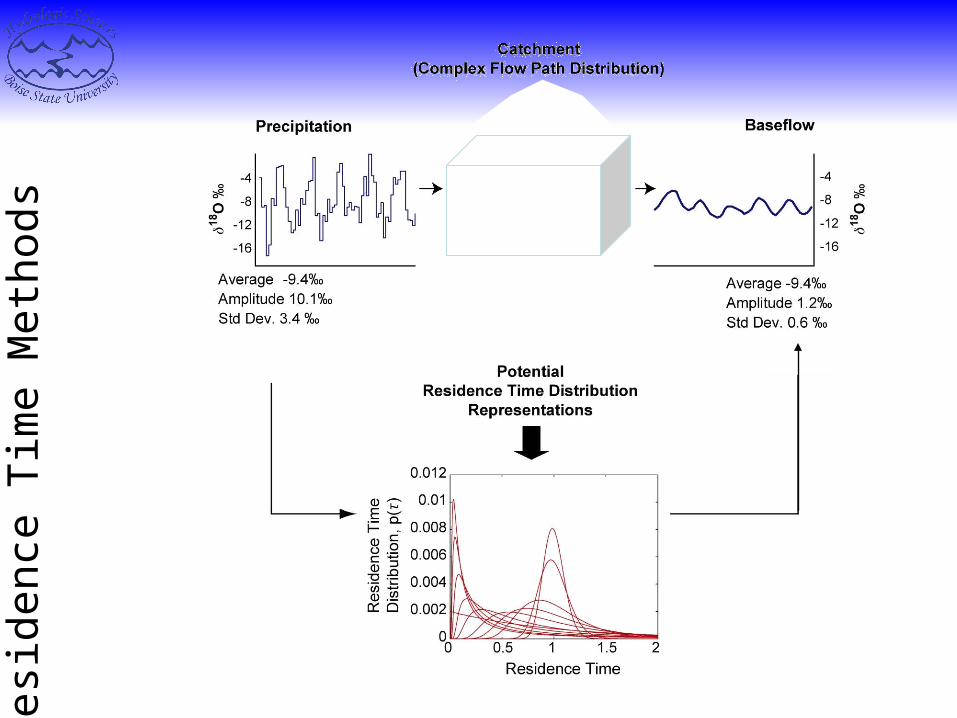
Res
iden
ce T
ime
Met
hods

Figure from Jim Kirchner
)(tCin
)(tCout
This approachThis approachsimplifiedsimplified
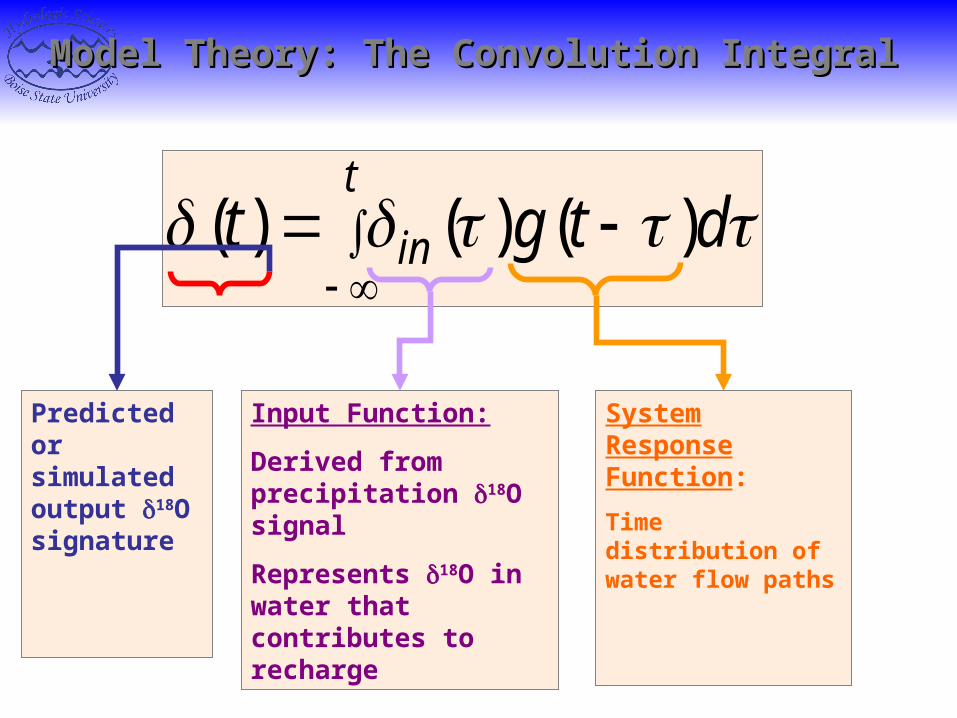
Model Theory: The Convolution IntegralModel Theory: The Convolution Integral
Input Function:
Derived from precipitation 18O signal
Represents 18O in water that contributes to recharge
System Response Function:
Time distribution of water flow paths
Predicted or simulated output 18O signature
t
in dtgt )()()(

Soil water residence time
2 4 1 0 5 5 0 2 4 1 0 6 0 0 2 4 1 0 6 5 0 2 4 1 0 7 0 0 2 4 1 0 7 5 0 2 4 1 0 8 0 0
5 9 0 1 8 5 0
5 9 0 1 9 0 0
5 9 0 1 9 5 0
5 9 0 2 0 0 0
5 9 0 2 0 5 0
5 9 0 2 1 0 0
2 .0
4 .0
6 .0
8 .0
1 0 .0
1 2 .0
1 4 .0
1 6 .0
N ear S trea m
P it 5
P it A
T en s io m e te r N e tw o rk
ln (a /tan)
R a in g au g e
Annual Data
P 2250 mm
Q 1350 mm
E 850 mm
Average Data
Slope 34o
Relief 100-150m
Ksat 5 m/hr
Soils DataDepth 1 m
Strong catenary
sequence
Soil water Residence
Time
-4
-8
-12
-16
18O
‰
-4
-8
-12
-16
18O
‰
Soil WaterPrecipitation
Average -9.4‰Amplitude 0.1‰Std Dev. 3.4 ‰
Average -9.4‰Amplitude 1.2‰Std Dev. 0.6 ‰
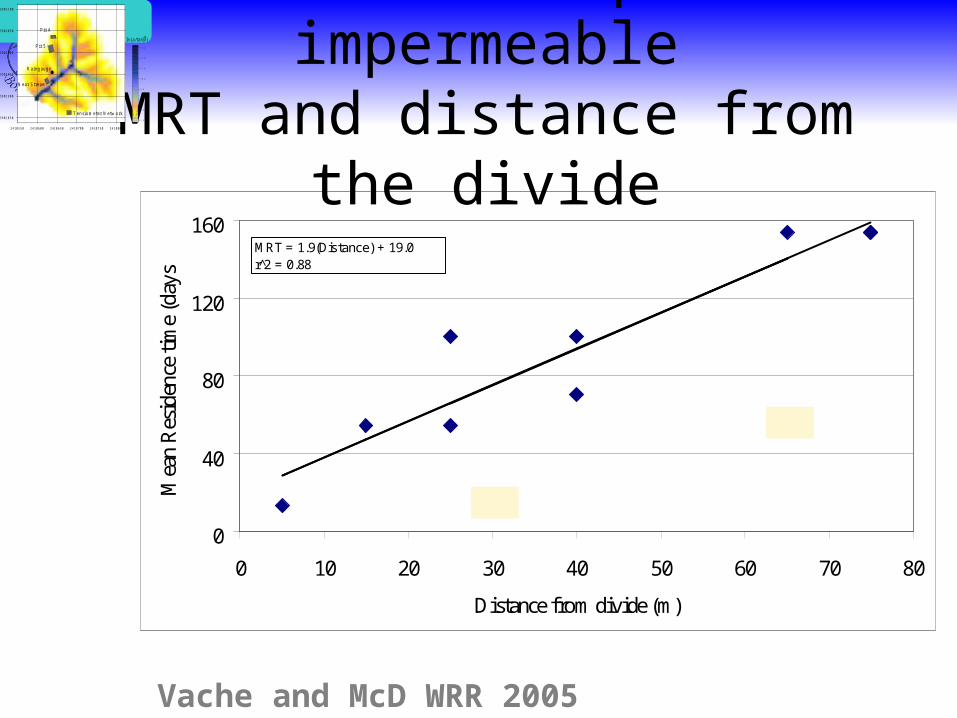
If bedrock quite impermeableMRT and distance from the
divide2 4 1 0 5 5 0 2 4 1 0 6 0 0 2 4 1 0 6 5 0 2 4 1 0 7 0 0 2 4 1 0 7 5 0 2 4 1 0 8 0 0
5 9 0 1 8 5 0
5 9 0 1 9 0 0
5 9 0 1 9 5 0
5 9 0 2 0 0 0
5 9 0 2 0 5 0
5 9 0 2 1 0 0
2 .0
4 .0
6 .0
8 .0
1 0 .0
1 2 .0
1 4 .0
1 6 .0
N ear S trea m
P it 5
P it A
T en s io m e te r N e tw o rk
ln (a /tan)
R a in g au g e
0
40
80
120
160
0 10 20 30 40 50 60 70 80
Distance from divide (m)
Mea
n R
esid
ence
tim
e (d
ays)
MRT = 1.9(Distance) + 19.0r 2̂ = 0.88
Vache and McD WRR 2005
Lumped Model Distributed Model,
Physics based
Semi-Distributed Model, Conceptual),),(()( CAtPftQ
p
q
REW 1
REW 2 REW 3
REW 4
REW 5
REW 6
REW 7
ssQUt
).().(
q q
History: Mathematical Lumping
Process Understanding
Future:? Process
Understanding
Modified from Mukesh Kumar

Physically Lumped ModelDistributed Model,
Physics based),),(()( CAtPftQ
q
ssQUt
).().(
History: Mathematical Lumping
Process Understanding
Future:Process
Understanding
Physically lumped properties
Physically lumped properties
Modified from Mukesh Kumar
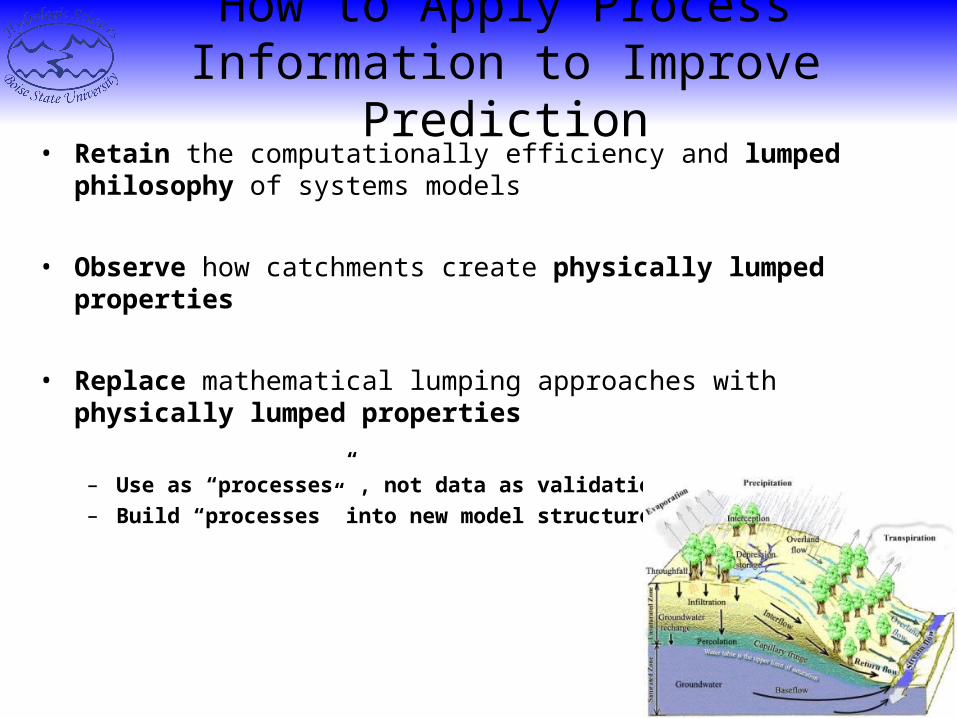
How to Apply Process Information to Improve Prediction
• Retain the computationally efficiency and lumped philosophy of systems models
• Observe how catchments create physically lumped properties
• Replace mathematical lumping approaches with physically lumped properties
– Use as “processes” , not data as validation targets– Build “processes” into new model structures
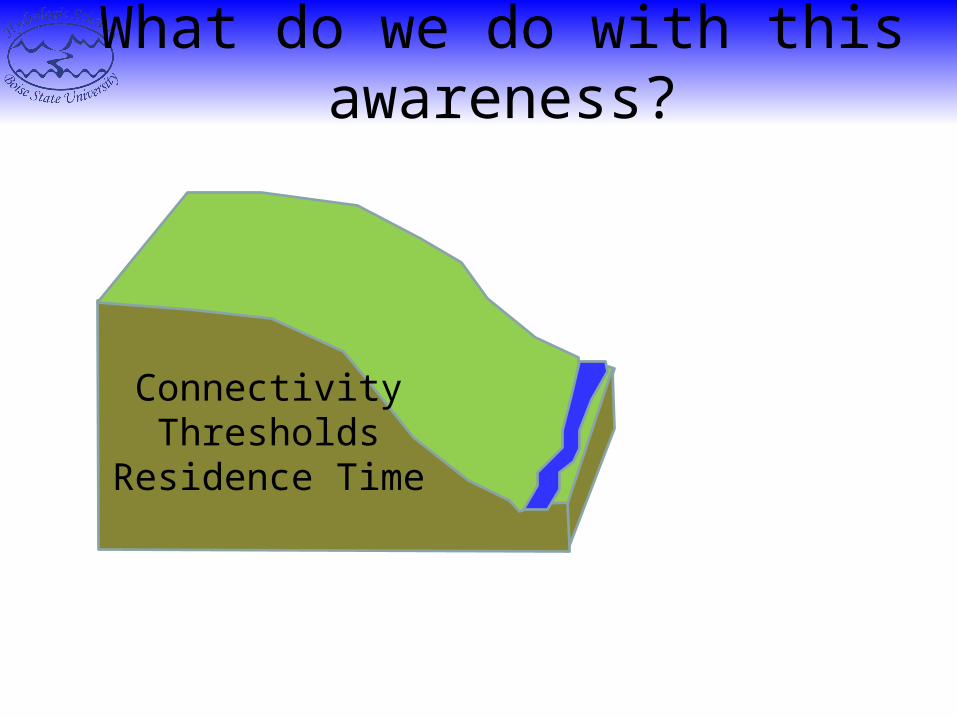
What do we do with this awareness?
ConnectivityThresholds
Residence Time

Lump the lumpsIt’s about Storage
P-ET-Q =dS/dt
ConnectivityThresholds
Residence Time
Storage

A Tale of Two Catchments
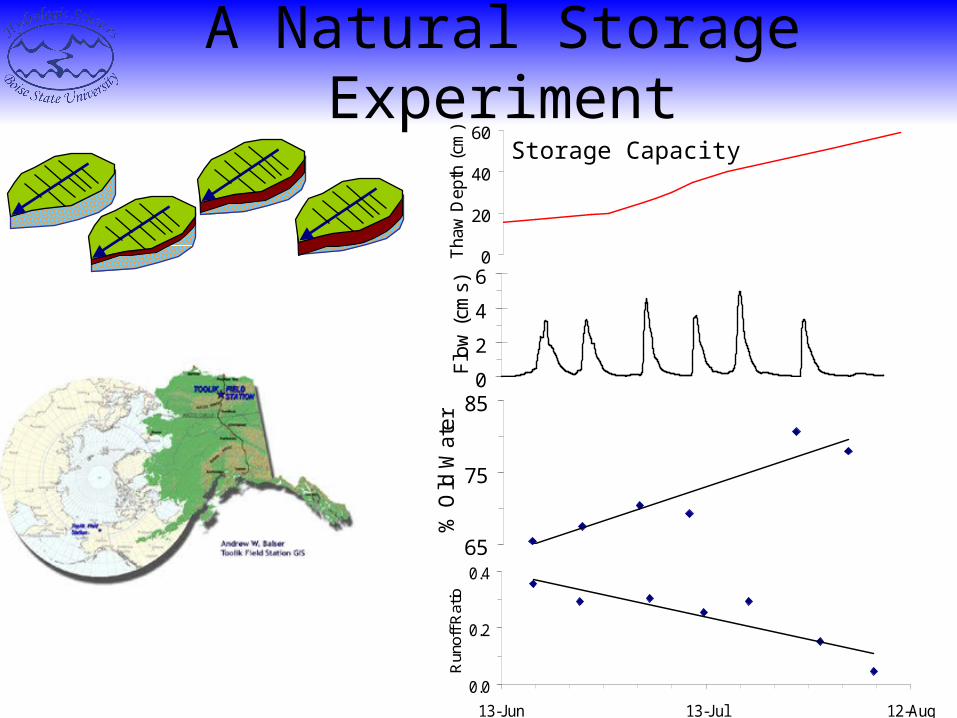
A Natural Storage Experiment
0
20
40
60
Tha
w D
epth
(cm
)
0
2
4
6
13-Jun 3-Jul 23-Jul 12-Aug
Flo
w (
cms)
65
75
85
13-Jun 13-Jul 12-Aug
% O
ld W
ater
0.0
0.2
0.4
13-Jun 13-Jul 12-Aug
Run
off R
atio
Storage Capacity

A Natural Storage Experiment
0
20
40
60
Tha
w D
epth
(cm
)
0
2
4
6
13-Jun 3-Jul 23-Jul 12-Aug
Flo
w (
cms)
65
75
85
13-Jun 13-Jul 12-Aug
% O
ld W
ater
0.0
0.2
0.4
13-Jun 13-Jul 12-Aug
Run
off R
atio
• We should focus on Runoff Prevention mechanisms in addition to runoff generation mechanisms
• We should concern ourselves with how catchments Retain Water in addition to how they release water
Storage CapacityP-ET-Q =dS/dt
The Storage Problem
• Storage is not commonly measured
• Storage is often estimated as the residual of a water balance
• Storage is treated as a secondary model calibration target

Improved storage characterization will lead to improved prediction
Reynolds Creek Dry Creek

Distributed Soil Moisture Measurements - Aspect


![[XLS] · Web view2011 1/3/2011 1/3/2011 1/5/2011 1/7/2011 1/7/2011 1/7/2011 1/7/2011 1/7/2011 1/7/2011 1/7/2011 1/7/2011 1/7/2011 1/11/2011 1/11/2011 1/11/2011 1/11/2011 1/11/2011](https://static.fdocuments.us/doc/165x107/5b3f90027f8b9aff118c4b4e/xls-web-view2011-132011-132011-152011-172011-172011-172011-172011.jpg)


