
11111723 11111858 11113013
34
1 CAPSTONE PROJECT (PART – II) MGT 739 REPORT (Project Term January-April 2013) THE EFFECT OF INTEREST RATE ON HOUSEHOLD CONSUMPTION Submitted by (Nikhil Aggarwal ) Registration Number: 11111723 (Hiralal Kumar) Registrati on Number: 11111858 (Supriya Kumari Bajpayee) Registration Number: 11113013 Project Group Number: F13 Under the Guidance of (Mrs. Neha Tikoo) Lovely faculty of Business and Applied Arts Lovely Professional University, Phagwara January to April, 2013 CERTIFICATION/ THESIS APPROVAL BY FACULTY ADVISOR TO WHOMSOEVER IT MAY CONCERN
-
Upload
nikhil-aggarwal -
Category
Documents
-
view
9 -
download
0
description
investor behaviour in investing equity
Transcript of 11111723 11111858 11113013

7/16/2019 11111723 11111858 11113013
http://slidepdf.com/reader/full/11111723-11111858-11113013 1/34
1
CAPSTONE PROJECT (PART – II) MGT 739 REPORT
(Project Term January-April 2013)
THE EFFECT OF INTEREST RATE ON HOUSEHOLD
CONSUMPTION
Submitted by
(Nikhil Aggarwal ) Registration Number: 11111723
(Hiralal Kumar) Registration Number: 11111858
(Supriya Kumari Bajpayee) Registration Number: 11113013
Project Group Number: F13
Under the Guidance of
(Mrs. Neha Tikoo)
Lovely faculty of Business and Applied Arts
Lovely Professional University, Phagwara
January to April, 2013
CERTIFICATION/ THESIS APPROVAL BY FACULTY ADVISOR
TO WHOMSOEVER IT MAY CONCERN

7/16/2019 11111723 11111858 11113013
http://slidepdf.com/reader/full/11111723-11111858-11113013 2/34
2
Acknowledgements
Many a time we have heard that learning comes from practice. From moving out of classroom
education to the real world during Capstone Project We got an opportunity to experience what
we had heard. We would like to express our gratitude to Mrs. Neha Tikoo for his valuable
guideline, support and encouragement in completing the synopsis.
We are very much thankful to our A.O. and the entire staff of the LFBA for
providing me such a friendly and co-operative environment.
HIRALAL KUMAR (11111858)
NIKHIL AGRAWAL (11111723)
SUPRIYA KUMARI BAJPAYEE (11113013)

7/16/2019 11111723 11111858 11113013
http://slidepdf.com/reader/full/11111723-11111858-11113013 3/34
3
Table of contents:
Chapter 1 Introduction 7-11
Chapter 2 Literature review 12-17
Chapter 3 Research methodology 18-19
Chapter 4 Analysis 20-25
Chapter 5 Findings 26-28
References 29-31
Annexure 32-34

7/16/2019 11111723 11111858 11113013
http://slidepdf.com/reader/full/11111723-11111858-11113013 4/34
4
CERTIFICATE
This is to certify that HIRALAL KUMAR (11111858), NIKHIL AGRAWAL
(11111723) and SUPRIYA KUMARI BAJPAYEE (11113013) has completed objective
formulation of Capstone project titled, “THE EFFECT OF INTEREST RATE ON
HOUSEHOLD CONSUMPTION” under my guidance and supervision. To the best of my
knowledge, the present work is the result of their original investigation and study. No part of
the capstone has ever been submitted for any other degree at any University.
The capstone project is fit for submission and the partial fulfilment of the conditions
for the award of .........................
Signature and Name of the Research Supervisor:
Designation
School
Lovely Professional University
Phagwara, Punjab.
Date :

7/16/2019 11111723 11111858 11113013
http://slidepdf.com/reader/full/11111723-11111858-11113013 5/34
5
DECLARATION
I, HIRALAL KUMAR, NIKHIL AGGARWAL and SUPRIYA KUMARI
BAJPAYEE students of MBA-3501 under Department of LFBAA of Lovely Professional
University, Punjab, hereby declare that all the information furnished in this capstone project
report is based on our own intensive research and is genuine.
This capstone does not, to the best of my knowledge, contain part of my work which
has been submitted for the award of our degree either of this university or any other university
without proper citation.
Date : Signature and Name of the student
Registration No.
11111858
11111723
11113013

7/16/2019 11111723 11111858 11113013
http://slidepdf.com/reader/full/11111723-11111858-11113013 6/34
6
Abstract
In this paper, an attempt has been made to analyse the the effect of real interest rate on
household consumption for which we have taken the data of real interest rate, household
consumption and growth of bank deposits of scheduled commercial bank in India. For
analysis we have used simple regression to know how real interest rate affects household
consumption expenditure. The findings of the study showed that the average real interest rate
was 6.162% and there is long run relationship between real interest rate and household
consumption in India. The estimated coefficients of correlation further indicate that the real
interest rate have a weak correlation with household consumption expenditure. Like wisely
the real interest rate affects the growth of bank deposits positively but negligibly.

7/16/2019 11111723 11111858 11113013
http://slidepdf.com/reader/full/11111723-11111858-11113013 7/34
7
Chapter1
Introduction

7/16/2019 11111723 11111858 11113013
http://slidepdf.com/reader/full/11111723-11111858-11113013 8/34
8
Interest rates are the most closely watched element in the financial market. It drives the
decision, whether to lend or borrow, save or invest or choose the available alternative
investment opportunities. Interest rates are the primary tool to consider while making
investments. “Interest rates are the most pervasive elements in the financial world. They affect
every nook and cranny of financial markets” (Ritter, Silber et al. 1991).
The effect of fluctuation in interest rate in the saving or consumption can be
represented by a variable. This variable can be either in the form of saving or in the form of
consumption. The variable in the form of saving is called interest elasticity of saving. This
represents the change in saving by one percent change in interest. The variable in the form of
consumption is called interest elasticity of consumption. This interest elasticity of
consumption is reciprocal of interest elasticity of saving. There have been a large number in
of empirical studies in this topic. However, most of the results do not coincide at a single
point. Moreover, in developing countries the result is more contradictory.
It is an undeniable truth that the development of an individual economy passes
through different economic phases. Sometimes it is booming and sometimes it suffers from
recession. In the theories, it may be possible to have only the booming economy but the truth
is truth. Theories are based on the assumptions but the practical life has to move with time, in
complex environment, and the time is never static. The effect of interest rate on
consumption is a central concern in macroeconomics. Among many issues that are
related to inter-temporal substitution, one of the most relevant from today's perspective
is whether consumers can be induced to increase consumption by a reduction in interest
rate paid on deposits. In this paper we measure the causal effect of interest rate on
consumption. This has crucial implications for understanding the timing and effectiveness of
the interest rate as a policy instrument that affects consumption, savings and ultimately the
growth rate of an economy. Our paper estimates the causal effect of a higher interest
rate on household consumption expenditure by exploiting a unique Indian banking
legislation and using detailed household consumption expenditure data from the RBI.
As of April 2001, the Reserve Bank of India permitted and actively encouraged banks to
offer higher interest rates on deposits of senior citizens, We use the regression discontinuity
approach to estimate the precise causal effect that the interest rate has on consumption
of households.
To achieve a higher economic growth there has to be an increased investment
both from the public and the private sector. Increased investment both from the public and private sector can take place only when savings are mobilized sufficiently. Savings can be

7/16/2019 11111723 11111858 11113013
http://slidepdf.com/reader/full/11111723-11111858-11113013 9/34
9
increased if real interest rates are positive. In this respect, RBI has adopted interest rate policy
for the (i) Mobilization of higher level of savings in the form of bank deposits (ii)Prevention
of capital flight to foreign countries (iii) Allocation of resources to productive sectors of the
economy, and (iv) Promotion of economic activities particularly industry and trade. For those
purpose, interest rates were regulated.
In the past when interest rates were controlled, RBI attempted to keep real
interest rates positive by making frequent revisions in nominal rates whenever inflation rates
were changing. But RBI was unable to appropriately monitor the movements and the real
interest rate was moving up and down over time. With this background, the objective of this
research is to find out the real interest rate and analyze its movements, find possible factors
for these movements, and find the correlation between real interest rates and other important
variables.
Terminology:
Interest rate is the rate at which interest is paid by a borrower for the use of money that they
borrow from a lender. Interest rates are fundamental to a capitalist society. Interest rates are
normally expressed as a percentage rate over the period of one year.
Real Interest rate is approximately the nominal interest rate minus the inflation rate
(Fisher,1911). It is the rate of interest an investor expect to receive after subtracting inflation.
Income is the consumption and savings opportunity gained by an entity within a specified
time frame, which is generally expressed in monetary terms. For firms, income generally
refers to net-profit: what remains of revenue after expenses have been subtracted. In the field
of public economics, it may refer to the accumulation of both monetary and non-monetary
consumption ability, the former being used as a proxy for total income.
Household final consumption expenditure (HFCE) is a transaction of the national account's
use of income account representing consumer spending. It consists of
the expenditure incurred by resident households on individual consumption goods and
services, including those sold at prices that are not economically significant. It also includes
various kinds of imputed expenditure of which the imputed rent for services of owner-
occupied housing (imputed rents) is generally the most important one. The household sector

7/16/2019 11111723 11111858 11113013
http://slidepdf.com/reader/full/11111723-11111858-11113013 10/34
10
covers not only those living in traditional households, but also those people living in
communal establishments, such as retirement homes, boarding houses and prisons.
The above given definition of HFCE includes expenditure by resident households on the
domestic territory and expenditure by resident households abroad (outbound tourists), butexcludes any non-resident households' expenditure on the domestic territory (inbound
tourists). From this national definition of consumption expenditure may be distinguished the
household final consumption expenditure according to the domestic concept which includes
household expenditure made on the domestic territory by residents and inbound tourists, but
excludes residents' expenditure made abroad.
Household consumer expenditure: The expenditure incurred by a household on domestic
consumption during the reference period is the household's consumer expenditure.
Expenditure incurred towards productive enterprises of households is excluded from
household consumer expenditure. Also excluded are expenditure on purchase and
construction of residential land and building, interest payments, insurance premium
payments, payments of fines and penalties, and expenditure on gambling including lottery
tickets. Money given as remittance, charity, gift, etc. is not consumer expenditure. However,
self-consumed produce of own farm or other household enterprise is valued and included in
household consumer expenditure. So are goods and services received as payment in kind or
free from employer, such as accommodation and medical care, and travelling allowance
excluding allowance for business trips.
Household size: The size of a household is the total number of persons in the household.
Purpose of study
There are hardly any economic papers which do not talk about the interest rates. Perhaps,
interest rates are the most closely watched element in the financial market. “Interest rates are
the most pervasive elements in the financial world. They affect every nook and cranny of
financial markets.” (Ritter, Silber et al. 1991). From this citation we can say that how

7/16/2019 11111723 11111858 11113013
http://slidepdf.com/reader/full/11111723-11111858-11113013 11/34
11
important is interest rate in an economy and how it impact on Household consumption when
it changes.
Objective1. To know the effect of change of interest rate on household consumption.
2. To know how consumption and savings are related to interest rate.
Limitations
1. Data taken is for scheduled commercial banks non schedule data is not properly available.
2. Data is taken for 1990 -2010 only recent data of 2011 and 2012 is not available on RBI site.
3. There is lack of time, classes, busy schedule and less members in our group.
4. We depend on the data given by RBI or NSSO and world bank.
5. Exact deposits of all accounts and transactions are not given anywhere.

7/16/2019 11111723 11111858 11113013
http://slidepdf.com/reader/full/11111723-11111858-11113013 12/34
12
Chapter 2
Literature Review
7/16/2019 11111723 11111858 11113013
http://slidepdf.com/reader/full/11111723-11111858-11113013 13/34
13
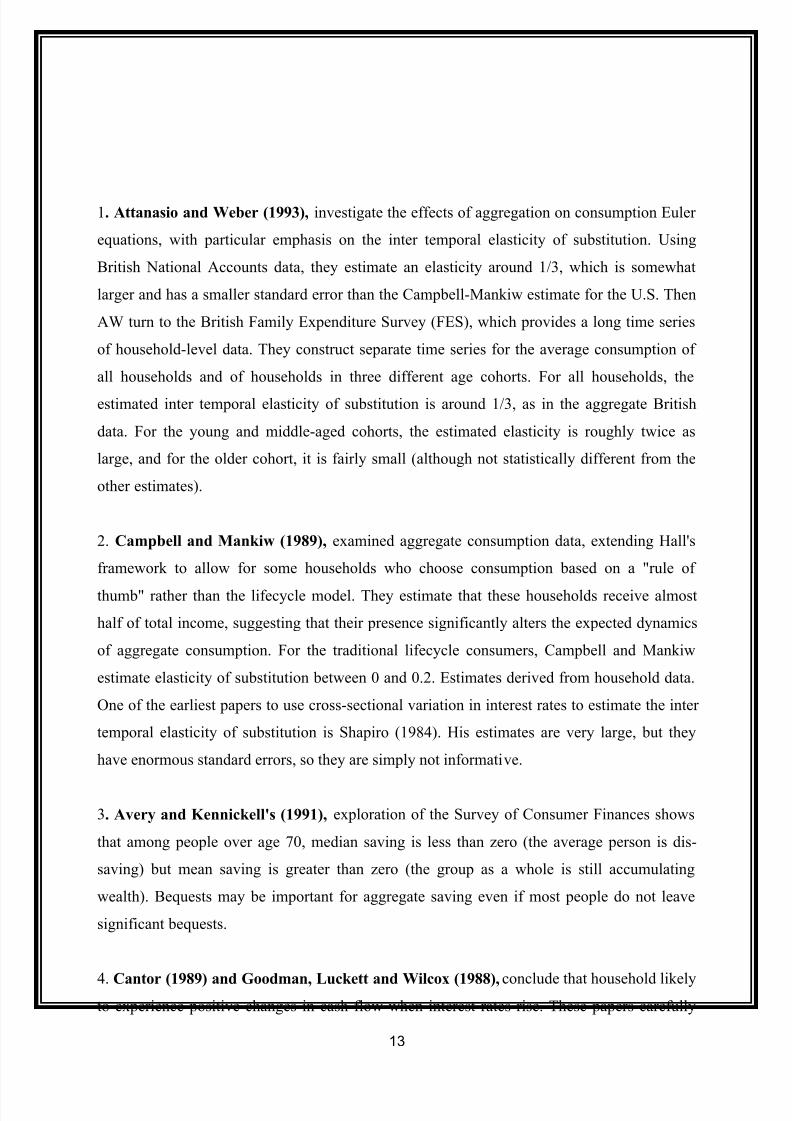
1. Attanasio and Weber (1993), investigate the effects of aggregation on consumption Euler
equations, with particular emphasis on the inter temporal elasticity of substitution. Using
British National Accounts data, they estimate an elasticity around 1/3, which is somewhat
larger and has a smaller standard error than the Campbell-Mankiw estimate for the U.S. Then
AW turn to the British Family Expenditure Survey (FES), which provides a long time series
of household-level data. They construct separate time series for the average consumption of
all households and of households in three different age cohorts. For all households, the
estimated inter temporal elasticity of substitution is around 1/3, as in the aggregate British
data. For the young and middle-aged cohorts, the estimated elasticity is roughly twice as
large, and for the older cohort, it is fairly small (although not statistically different from the
other estimates).
2. Campbell and Mankiw (1989), examined aggregate consumption data, extending Hall's
framework to allow for some households who choose consumption based on a "rule of
thumb" rather than the lifecycle model. They estimate that these households receive almost
half of total income, suggesting that their presence significantly alters the expected dynamics
of aggregate consumption. For the traditional lifecycle consumers, Campbell and Mankiw
estimate elasticity of substitution between 0 and 0.2. Estimates derived from household data.
One of the earliest papers to use cross-sectional variation in interest rates to estimate the inter
temporal elasticity of substitution is Shapiro (1984). His estimates are very large, but they
have enormous standard errors, so they are simply not informative.
3. Avery and Kennickell's (1991), exploration of the Survey of Consumer Finances shows
that among people over age 70, median saving is less than zero (the average person is dis-
saving) but mean saving is greater than zero (the group as a whole is still accumulating
wealth). Bequests may be important for aggregate saving even if most people do not leave
significant bequests.
4. Cantor (1989) and Goodman, Luckett and Wilcox (1988),conclude that household likelyto experience positive changes in cash flow when interest rates rise. These papers carefully

7/16/2019 11111723 11111858 11113013
http://slidepdf.com/reader/full/11111723-11111858-11113013 14/34
14
examine the responsiveness of different categories of interest payments and receipts to
changes in market interest rates.
5. Deaton (1992), argues that if consumption is always close to income for many people,
then"the prima facie supposition must be that interest rates are not very important" in
determining consumption and saving. But consumption is not that close to income for people
who are doing the saving in the economy, so there is no reason to presume that the savers'
decisions are unaffected by interest rates or other factors.
6. Hall (1988), examines the behaviour of aggregate consumer spending, using different time
periods and different measures of the expected rate of return. He finds no evidence of a
significant positive elasticity of substitution. Hall notes that his results are not surprising
given that the U.S. has experienced large changes in the interest rate over time but only small
changes in the growth rate of aggregate consumption. Together, these facts suggest that
consumption is not very responsive to changes in the interest rate and thus that
the inter temporal elasticity of substitution is small.
7. Feldstein (1994), argues that Income may also be correlated with pre-tax rates of
return,high-income households may earn a higher pre-tax return on their investments than
other households, and thus may have a higher after-tax return despite their higher tax rates.
8. Bernheim and Scholz (1993), suggest an alternative utility function for which the interest
elasticity of saving is positively correlated with income. They show that if utility is a function
of actual consumption less some subsistence level of consumption, the "effective" interest
elasticity of saving increases with consumption.
9. Fry (1995) The Economic literature on savings provides a long list of factors affecting the
saving rates. Study have found ambiguous effect of increase in real interest rate on savings
because of a positive substitution effect towards future consumption and a negative income
effect due to increased real returns on saved wealth. has found small but positive interest rate
elasticity of savings to be insignificantly related to real interest rates.

7/16/2019 11111723 11111858 11113013
http://slidepdf.com/reader/full/11111723-11111858-11113013 15/34
15
10. Bhattarai and kafle,(2011).The influence of real interest rate on savings depends on the
relative strength of the offsetting substitution and income effect A rise in the interest rate of
return may increase savings by making future consumption cheaper relative to current
consumption (substitution effect).At the same time higher real interest rate may reduce the
savings necessary to purchase a given amount of future consumption (income effect). Given
the theoretical ambiguities, whether or not saving behaviour is interest elastic is a matter of
country specific empirical analysis
11. Shrestha,(2010).there are number of studies which suggested for significantly positive to
significantly negative coefficients of real interest rate. It is also important to note that the real
interest rate have a positive influence on the private savings and can be taken as an important
policy variable in Nepal.
12. Arrieta,(1988) identified activities variable such as the real interest rates and some
measures of capital inflows ( or foreign savings) as the important variables determining
domestic savings in developing countries. though, some of the studies also included
demographic variables, government savings and labour market constraints in to the model to
investigate their influence on private savings, the interest rate are sensitivity of savings has
been the subject of literature relating to LDCs. Many economist remain doubtful that interest
rates whether real or nominal, have any significant impact on private sector saving behaviour
in developed or developing countries, since saving is defined as not consuming, economist
who do not believe on the role of interest rates conclude that the interest rates have little
impact on private savings decision to allocate income between consumption and savings: the
interest rate of elasticity is held to be zero or insignificantly small.

7/16/2019 11111723 11111858 11113013
http://slidepdf.com/reader/full/11111723-11111858-11113013 16/34
16
13. Agrawal, P., P. Sahoo, and R.K.Das.,(2007). The Real interest rate affects the savings
rate positively in Bangladesh and Nepal but negatively in India, Pakistan and Sri Lanka Their
analysis suggests that trying to influence the savings rate by manipulating interest rate is not
likely to be practical policy option in these countries as interest rate changes have only a
minor impact on savings rate.
14. Arron and Meulbauer (1999) present the determinants of private savings in south
Africa, Separately examining personal and corporate sector saving behaviour over nearly
three decades, from the late 1960s to 1997. This paper confirms that the main factors behind
personal saving in South Africa include direct negative effects of wealth and financial
liberalization and the direct positive effects of real interest rates and uncertainty. Moreover,
corporations save more when dividend tax rates rise, while in the absence of the capital gains
tax, higher inflation encourages corporate saving.
15. Mudit Kapoor and Shamika Ravi (2009), A recent study that is close to this research is
the empirical test of the effect of interest rate on household consumption under taken by
Mudit Kapoor and Shamika Ravi in 2009.This research was carried out after the change in
Indian banking legislation that offered higher interest rate on the deposits of senior citizens
(above sixty years). The banking legislation was established in the year 2001. This change in
banking legislation in Indian provided an opportunity to find the relationship between interest
rate and consumption more accurately. The author used the household consumption
expenditure data from the National Sample Survey (NSS). The estimation of effect of change
in interest rate on consumption was done through comparing the expenditures of households
that are not eligible for the higher interest earnings on their deposits to households that are
eligible. The eligibility criteria were based upon the age of the household members. When

7/16/2019 11111723 11111858 11113013
http://slidepdf.com/reader/full/11111723-11111858-11113013 17/34
17
there is at least one member who is sixty years or above was eligible for the higher interest
rate. The study has found a strong and significant short run impact on saving and consumption
of households. But it failed to explain the long term effect due to the lack of sufficient data to
explain the long term effect of interest rate. They found an immediate 12 percent decline in
household consumption when the interest rates on deposits were increased by 50 basis points.
The effect was primarily in non-food, non-essential items which were declined by 17 percent.
The analysis was performed with the 2005-06 data. And to compare the results with prior to
banking legislation, 2000-01 data was used.
The reviews of all these literatures have given a platform to do this dissertation. The reviews
have given an experience of dependency of different variables in different situation and time
frame. The review of the literatures has shown that the parameter of consideration and
assumptions in the research significantly influences the conclusion.

7/16/2019 11111723 11111858 11113013
http://slidepdf.com/reader/full/11111723-11111858-11113013 18/34
18
Chapter 3
Research
methodology

7/16/2019 11111723 11111858 11113013
http://slidepdf.com/reader/full/11111723-11111858-11113013 19/34
19
Research methodology means the method of preparing project. In other words project
methodology is the way of preparing the project, and presenting the project report, the work is
systematic and done in proper order as good work gives good results. Further the data
collected to prepare the project must be relevant.
Data collection will be done from following sources:-
1. Secondary Data
Secondary data will be collected through:-
1. RBI
2. World Bank
The data of 1990-2010 of household consumption expenditure, real interest rates and growth
of bank deposits in India has been taken.
Research Design:
Descriptive Research Design has been used in the research work.
Tools and Techniques:
Regression Analysis is used to determine the impacts of determinants on interest rate with
respect to household consumption rate in India
To make use of these variables, we sort them by year wise data of household
consumption and interest rates, then calculated the mean, maximum, minimum, and standard
deviation for each variable. We create a correlation matrix between all the variables and then
run regressions to determine which variables are significant, at what level, and what optimal
rates we might find.

7/16/2019 11111723 11111858 11113013
http://slidepdf.com/reader/full/11111723-11111858-11113013 20/34
20
Chapter4
Analysis
7/16/2019 11111723 11111858 11113013
http://slidepdf.com/reader/full/11111723-11111858-11113013 21/34
21
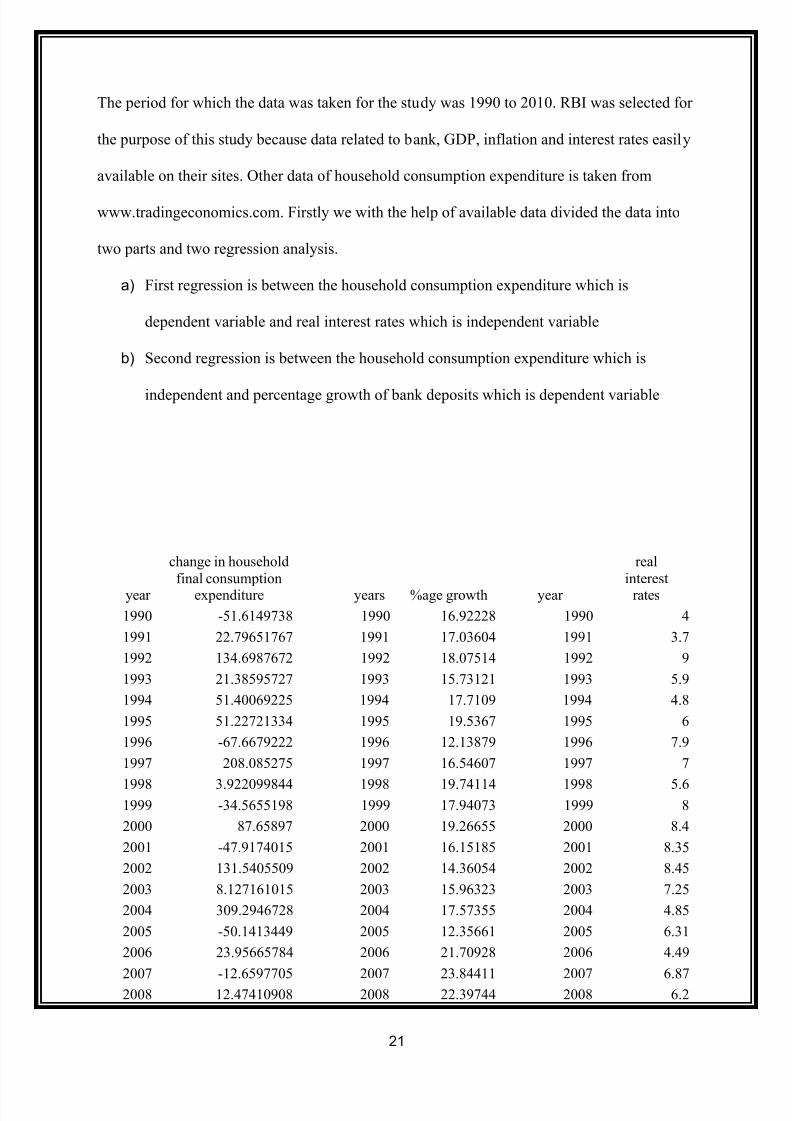
The period for which the data was taken for the study was 1990 to 2010. RBI was selected for
the purpose of this study because data related to bank, GDP, inflation and interest rates easily
available on their sites. Other data of household consumption expenditure is taken from
www.tradingeconomics.com. Firstly we with the help of available data divided the data into
two parts and two regression analysis.
a) First regression is between the household consumption expenditure which is
dependent variable and real interest rates which is independent variable
b) Second regression is between the household consumption expenditure which is
independent and percentage growth of bank deposits which is dependent variable
year
change in household
final consumptionexpenditure years %age growth year
real
interestrates
1990 -51.6149738 1990 16.92228 1990 4
1991 22.79651767 1991 17.03604 1991 3.7
1992 134.6987672 1992 18.07514 1992 9
1993 21.38595727 1993 15.73121 1993 5.9
1994 51.40069225 1994 17.7109 1994 4.8
1995 51.22721334 1995 19.5367 1995 6
1996 -67.6679222 1996 12.13879 1996 7.9
1997 208.085275 1997 16.54607 1997 7
1998 3.922099844 1998 19.74114 1998 5.61999 -34.5655198 1999 17.94073 1999 8
2000 87.65897 2000 19.26655 2000 8.4
2001 -47.9174015 2001 16.15185 2001 8.35
2002 131.5405509 2002 14.36054 2002 8.45
2003 8.127161015 2003 15.96323 2003 7.25
2004 309.2946728 2004 17.57355 2004 4.85
2005 -50.1413449 2005 12.35661 2005 6.31
2006 23.95665784 2006 21.70928 2006 4.49
2007 -12.6597705 2007 23.84411 2007 6.87
2008 12.47410908 2008 22.39744 2008 6.2

7/16/2019 11111723 11111858 11113013
http://slidepdf.com/reader/full/11111723-11111858-11113013 22/34
22
2009 39.36931973 2009 19.93066 2009 4.32
2010 -100 2010 17.18041 2010 2.01
Data interpretation
The period for which the data was taken for the study was 1990 to 2010. RBI was selected for
the purpose of this study because data related to bank, GDP inflation and interest rates are
easily available on their sites. Other data of household consumption expenditure is taken from
www.tradingeconomics.com. Firstly we with the help of available data divided the data into
two parts and applied regression analysis.
a) First regression is between the household consumption expenditure which is
dependent variable and real interest rates which is independent variable
b) Second regression is between the household consumption expenditure which is
independent and percentage growth of bank deposits which is dependent variable

7/16/2019 11111723 11111858 11113013
http://slidepdf.com/reader/full/11111723-11111858-11113013 23/34
23
Regression model 1
Degree of percentage change in household consumption = ß0 + ß1 (Real interest rate) + ε
Where ε is the error term with the distribution N (0,1)
Correlations
change_in_household
__final_consumption_
expenditure real_interest_rates
Pearson Correlation change_in_household__final_consum
ption_expenditure1.000 .173
real_interest_rates .173 1.000
Above table shows the correlation between the change household final consumption
expenditure and the change in the real interest. It clearly depicts that correlation between the
two variables in very less, i.e. 0.173 and the level of significance is weak, i.e. 0.227. This
shows that there is least relation between the two variables.
Regression model analysis
Degree of percentage change in household consumption
= -19.854 +8.951 (real interest rate)
(75.223) (11.704)
[-.264] [.764]
(.795*) (.454*)
{0.173}
F = 0.585R2 = 0.030
R = 00.173

7/16/2019 11111723 11111858 11113013
http://slidepdf.com/reader/full/11111723-11111858-11113013 24/34
24
Figures in round brackets shows Standard Errors
Figures in square brackets shows t-values
(*) Two tailed 0.05 level of significance
Figures in curly brackets shows beta values
It shows that the high R value (0.173), indicates a very weak relationship b/w the independent
variables (real interest rates) and its square (0.030) and the dependent variable percentage
change in growth of bank deposits). The R-square for said variables is coming 0.030. It means
that there is no significant relationship between the independent predictors & dependent
variable. The value of beta for demand is the highest (0.173), this shows that it has a
positively influence on the % change in real interest rates.
Regression model 2
Degree of percentage growth of bank deposits= ß0 + ß1 (percentage change in final
consumption expenditure) + ε
where ε is the error term with the distribution N (0,1)
Correlations
percentage_growth
change_in_househ
old__final_consu
mption_expenditur
e
Pearson Correlation percentage_growth 1.000 -.456
change_in_household__final_co
nsumption_expenditure
-.456 1.000

7/16/2019 11111723 11111858 11113013
http://slidepdf.com/reader/full/11111723-11111858-11113013 25/34
25
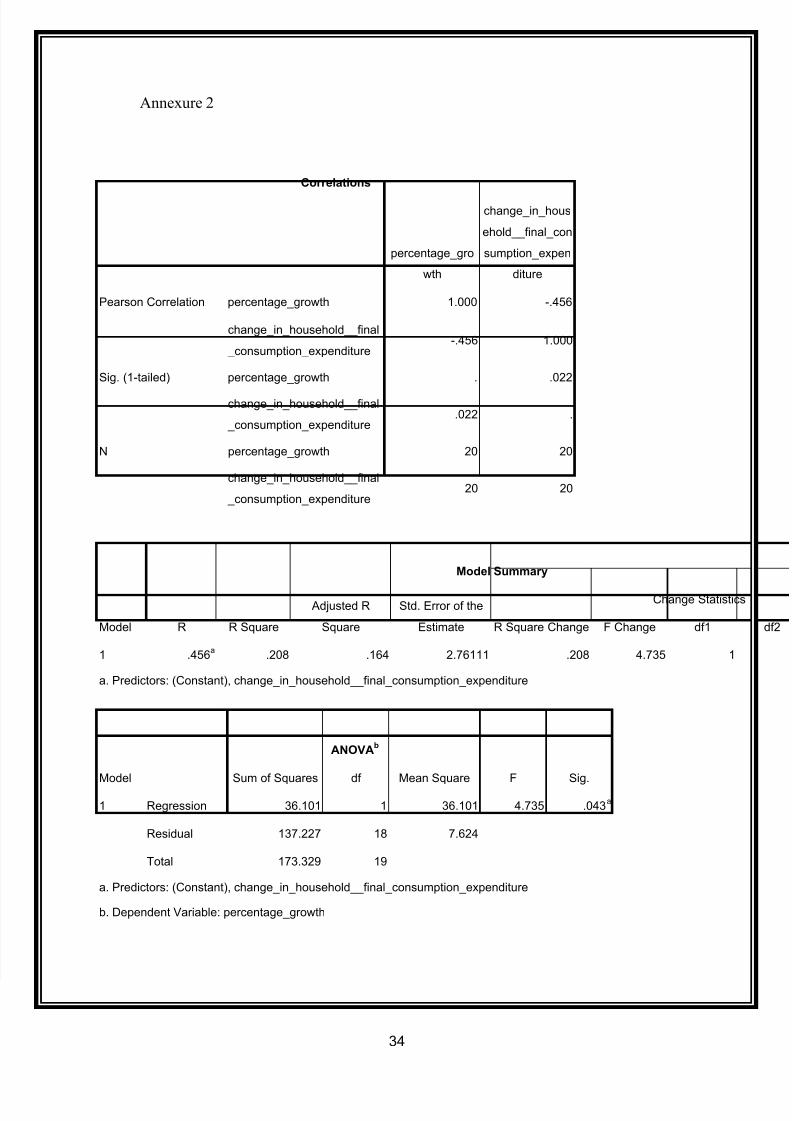
Above Table shows the correlation between the change in percentage growth of bank deposit
with the percentage change in household final consumption. It clearly depicts that correlation
between the two variables in very negatively correlated , i.e. -0.456. and the level of
significance is weak, i.e. 0.22. This shows that there is least relation between the two variable.
Regression model analysis
Degree of percentage growth of bank deposits
= 18.308 -0.014(change in final household consumption)
(.669) (0.007)
[27.360] [-.2.176]
(0.000*) (.043*)
{-.456}
F = 4.735
R2 = 0.208R = 0.456
Figures in round brackets shows Standard Errors
Figures in square brackets shows t-values
(*) Two tailed 0.05 level of significance
Figures in curly brackets shows beta values
It shows that the high multiple R value (.456), indicates a very strong relationship b/w the
independent variables (%change in final household consumption) and its square (.208) and
the dependent variable percentage growth of bank deposits). The R-square for said variables
is coming 0.208. It means that there is little significant relationship between the independent
predictors & dependent variable. The value of beta for demand is the highest (-.456), this
shows that it has a negatively influence on the % change in final household consumption.

7/16/2019 11111723 11111858 11113013
http://slidepdf.com/reader/full/11111723-11111858-11113013 26/34
26
Chapter 5
Findings and conclusion

7/16/2019 11111723 11111858 11113013
http://slidepdf.com/reader/full/11111723-11111858-11113013 27/34
27
Our result shows that:
1) a The correlation between the change household final consumption expenditure and the
change in the real interest. It clearly depicts that correlation between the two variables in very
less, i.e. 0.173 and the level of significance is weak, i.e. 0.227. This shows that there is least
relation between the two variables.
b) The high R value (0.173), indicates a very weak relationship b/w the independent variables
(real interest rates) and its square (0.030) and the dependent variable percentage change in
growth of bank deposits). The R-square for said variables is coming 0.030. It means that
there is no significant relationship between the independent predictors & dependent variable.
The value of beta for demand is the highest (0.173), this shows that it has a positively
influence on the percentage change in real interest rates.
2) a) The correlation between the changes in percentage growth of bank deposit with the
percentage change in household final consumption. It clearly depicts that correlation between
the two variables in very negatively correlated, i.e. -0.456. And the level of significance is
weak, i.e. 0.22. This shows that there is least relation between the two variables.
b) It shows that the high multiple R value (.456), indicates a very strong relationship b/w the
independent variables (%change in final household consumption) and its square (.208) and
the dependent variable percentage growth of bank deposits). The R-square for said variables
is coming 0.208. It means that there is little significant relationship between the independent
predictors & dependent variable. The value of beta for demand is the highest (-.456), this
shows that it has a negatively influence on the % change in final household consumption.

7/16/2019 11111723 11111858 11113013
http://slidepdf.com/reader/full/11111723-11111858-11113013 28/34
28
From the study we conclude that relationship between the household consumption, real
interest rate and bank deposits are interrelated in long run but real interest rates impact to
consumption is very less and consumption impact to saving or bank deposits is there.
Second we find that household final consumption expenditure is negatively correlated to
growth of bank deposits.

7/16/2019 11111723 11111858 11113013
http://slidepdf.com/reader/full/11111723-11111858-11113013 29/34
29
References

7/16/2019 11111723 11111858 11113013
http://slidepdf.com/reader/full/11111723-11111858-11113013 30/34
30
1. Arrieta,E.1988.Saving and growth: A Reinterpretation Carnegie-Rochester series on
public policy,Vol,40. pp.133-92.
2. Agrawal, P., P.Sahoo, and R.K.Das.,2007. Saving Behaviour in South Asia.University
of Delhi Enclave Working Paper series No. E/289/2008.
3. Aron ,Janine and J.Meullbauer.1999. Estimates of personal sector wealth for south
Africa. CSAE working paper series 1999-17.
4. Bhattarai,R and L. Kafle.2011 saving behaviour in developing country:an empirical
Analysis. Nepal Rastra Bank, Kathmandu, Nepal.
5. Deaton, Angus. 1992. Understanding Consumption . Oxford: Clarendon Press.
6. Douglas Bernheim.B and John Karl Scholz, "Private Saving and Public Policy," Tax
Policy andthe Economy, vol. 7 (Cambridge, Mass.: MIT Press, 1993).
7. Fry,S.1995. Saving Mobilization in Developing Countries: Bottleness and Reform
Proposal. Saving and Development, Vol. 14,Pp. 117-131.
8. Hall, Robert E. 1988. “Intertemporal Substitution in Consumption.” Journal of Political
Economy.
9. John Y. Campbell and N. Gregory Mankiw (1989), "Consumption, Income and Interest
Rates:Reinterpreting the Time Series Evidence," in Olivier Jean Blanchard and Stanley
Fischer,eds., NBER Macroeconomics Annual: (Cambridge, Mass.: MIT Press, 1989).
10. Martin Feldstein .1994, "Fiscal Policies, Capital Formation, and Capitalism," Working
Paper (National Bureau of Economic Research, Cambridge, Mass., October 1994).
11. Mudit Kapoor and Shamika Ravi. 1999, “The Effect of Interest Rate on Household
Consumption: Evidence from a Natural Experiment in India,” American EconomicAssociation.
7/16/2019 11111723 11111858 11113013
http://slidepdf.com/reader/full/11111723-11111858-11113013 31/34
31
12. Orazio P. Attanasio and Guglielmo Weber (July 1993), "Consumption Growth, the
Interest Rate, and Aggregation," Review of Economic Studies.
13. Robert B. Avery and Arthur B. Kennickell (December 1991), "Household Saving in the
U.S.," Review of Income and Wealth, vol. 37, no. 4
14. Richard Cantor.1989, "Interest Rates, Household Cash Flow, and Consumer
Expenditures," Quarterly Review, Federal Reserve Bank of New York, Summer.
15. Shrestha. R..P. 2010. Private Savings Behaviour in Nepal: Long-term Determinants
and short run Dynamics. Economic Review, occasional paper, Nepal Rastra Bank,
Kathmandu, Nepal.

7/16/2019 11111723 11111858 11113013
http://slidepdf.com/reader/full/11111723-11111858-11113013 32/34
32
Annexure

7/16/2019 11111723 11111858 11113013
http://slidepdf.com/reader/full/11111723-11111858-11113013 33/34
33
Annexure 1
Correlations
change_in_hous
ehold__final_con
sumption_expen
diture
real_interest_rat
es
Pearson Correlation change_in_household__final
_consumption_expenditure1.000 .173
real_interest_rates .173 1.000
Sig. (1-tailed) change_in_household__final
_consumption_expenditure. .227
real_interest_rates .227 .
N change_in_household__final
_consumption_expenditure21 21
real_interest_rates 21 21
Model Summary
Model R R Square
Adjusted R
Square
Std. Error of the
Estimate
Change Statistics
R Square Change F Change df1 df2
1 .173a
.030 -.021 97.95824 .030 .585 1
a. Predictors: (Constant), real_interest_rates
ANOVAb
Model Sum of Squares df Mean Square F Sig.
1 Regression 5612.542 1 5612.542 .585 .454a
Residual 182320.530 19 9595.817
Total 187933.071 20
a. Predictors: (Constant), real_interest_rates
b. Dependent Variable: change_in_household__final_consumption_expenditure
7/16/2019 11111723 11111858 11113013
http://slidepdf.com/reader/full/11111723-11111858-11113013 34/34
Annexure 2
Correlations
percentage_gro
wth
change_in_hous
ehold__final_con
sumption_expen
diture
Pearson Correlation percentage_growth 1.000 -.456
change_in_household__final
_consumption_expenditure-.456 1.000
Sig. (1-tailed) percentage_growth . .022
change_in_household__final
_consumption_expenditure.022 .
N percentage_growth 20 20
change_in_household__final
_consumption_expenditure20 20
Model Summary
Model R R Square
Adjusted R
Square
Std. Error of the
Estimate
Change Statistics
R Square Change F Change df1 df2
1 .456a
.208 .164 2.76111 .208 4.735 1
a. Predictors: (Constant), change_in_household__final_consumption_expenditure
ANOVAb
Model Sum of Squares df Mean Square F Sig.
1 Regression 36.101 1 36.101 4.735 .043a
Residual 137.227 18 7.624
Total 173.329 19
a. Predictors: (Constant), change_in_household__final_consumption_expenditure
b. Dependent Variable: percentage_growth


