110127 Floods
36
Presentation to the Portfolio Committee: Water & Environment Management of Floods / Disaster Presentation by Mr L Z Maswuma Director: Hydrological Services
-
Upload
varun-rohilla -
Category
Documents
-
view
225 -
download
0
Transcript of 110127 Floods

7/28/2019 110127 Floods
http://slidepdf.com/reader/full/110127-floods 1/36
Presentation to the Portfolio Committee:
Water & Environment
Management of Floods / Disaster
Presentation by
Mr L Z Maswuma
Director: Hydrological Services
7/28/2019 110127 Floods
http://slidepdf.com/reader/full/110127-floods 2/36
PART I
Update on recent floods in the Country
2
7/28/2019 110127 Floods
http://slidepdf.com/reader/full/110127-floods 3/36
OVERVIEW OF THE FLOOD MANAGEMENT IN
RSA (1)
• RSA is a semi-arid country and rainfall is spread
unevenly – floods & drought predominately.
• This presentation is limited to recent flood
situation in the country
• The Department’s Regional Offices assume
responsibility for the management of localised
floods
3

7/28/2019 110127 Floods
http://slidepdf.com/reader/full/110127-floods 4/36
OVERVIEW OF THE FLOOD MANAGEMENT IN
RSA (2).• National Office is responsible for flood
management of the Vaal and Orange RiverSystem covers Gauteng, FS, NW & NC.ThisSystem comprises 49% of the total area of RSA.
• The National office also monitors andcoordinate information on floods occurring onother river systems that impact toneighbouring countries – Moz & Namibia.
• These river systems include Inkomati, Limpopoand Olifants
4

7/28/2019 110127 Floods
http://slidepdf.com/reader/full/110127-floods 5/36
AREAS AFFECTED BY FLOODS (1)
KwaZulu Natal
5
Municipality &
Specific Area
Impact on water
supply
Proposed
Intervention &
estimate costs
uThukela District
Municipality
•Bergville
submerged the
water abstraction
pumping station
Tankering & an
est.cost R900 000
is required
7/28/2019 110127 Floods
http://slidepdf.com/reader/full/110127-floods 6/36
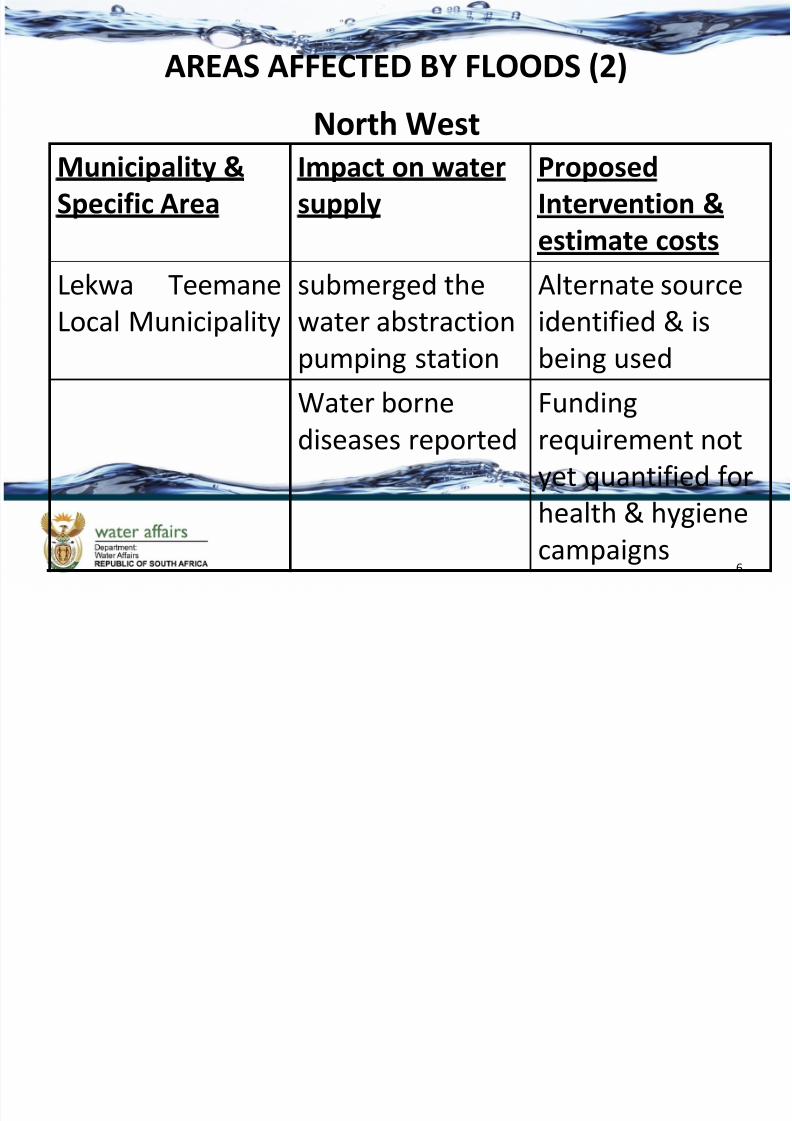
AREAS AFFECTED BY FLOODS (2)
North West
6
Municipality &
Specific Area
Impact on water
supply
Proposed
Intervention &
estimate costs
Lekwa TeemaneLocal Municipality
submerged thewater abstraction
pumping station
Alternate sourceidentified & is
being used
Water bornediseases reported Fundingrequirement not
yet quantified for
health & hygiene
campaigns
7/28/2019 110127 Floods
http://slidepdf.com/reader/full/110127-floods 7/36
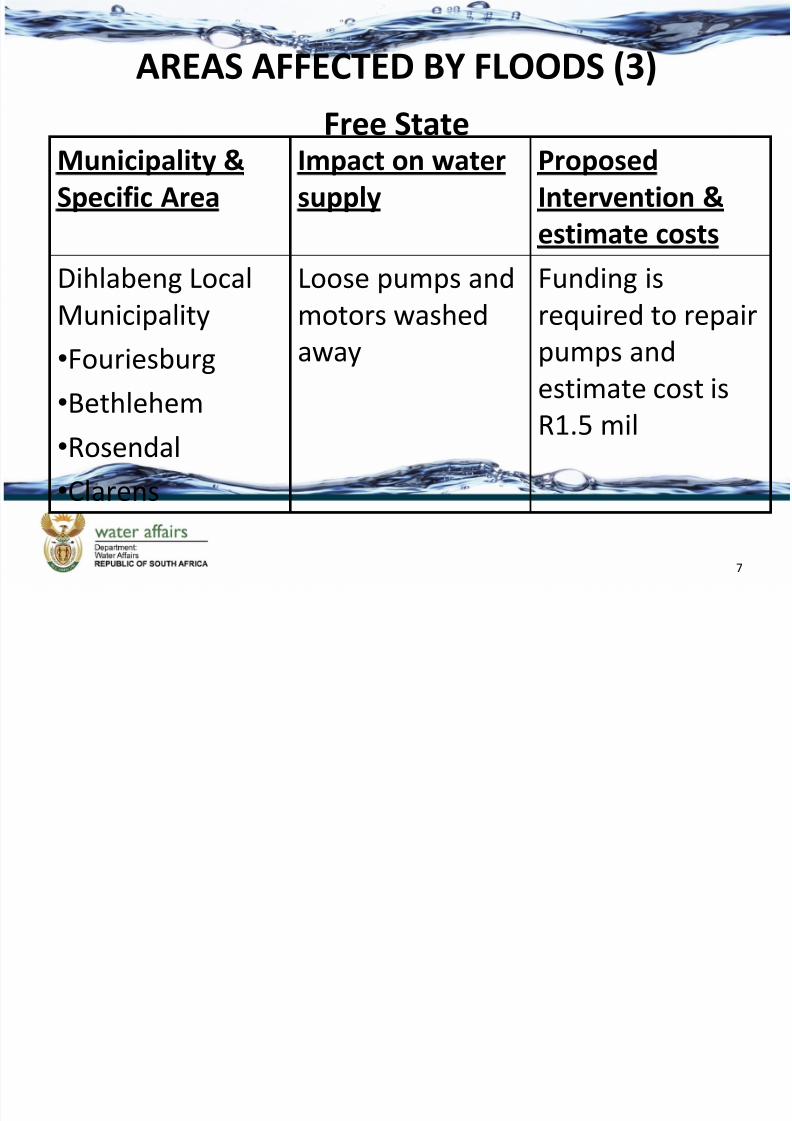
AREAS AFFECTED BY FLOODS (3)
Free State
7
Municipality &
Specific Area
Impact on water
supply
Proposed
Intervention &
estimate costs
Dihlabeng LocalMunicipality
•Fouriesburg
•Bethlehem
•Rosendal
•Clarens
Loose pumps andmotors washed
away
Funding isrequired to repair
pumps and
estimate cost is
R1.5 mil

7/28/2019 110127 Floods
http://slidepdf.com/reader/full/110127-floods 8/36
AREAS AFFECTED BY FLOODS (4)
Free State
8
Municipality &
Specific Area
Impact on water
supply
Proposed
Intervention &
estimate costs
Moqhaka LocalMunicipality
•Kroonstad
•Viljoenskroon
•Steynsrus
Raw water pumpstation flooded
and water
infrastruture
damaged
Not yetquantified,
funding is
required
7/28/2019 110127 Floods
http://slidepdf.com/reader/full/110127-floods 9/36
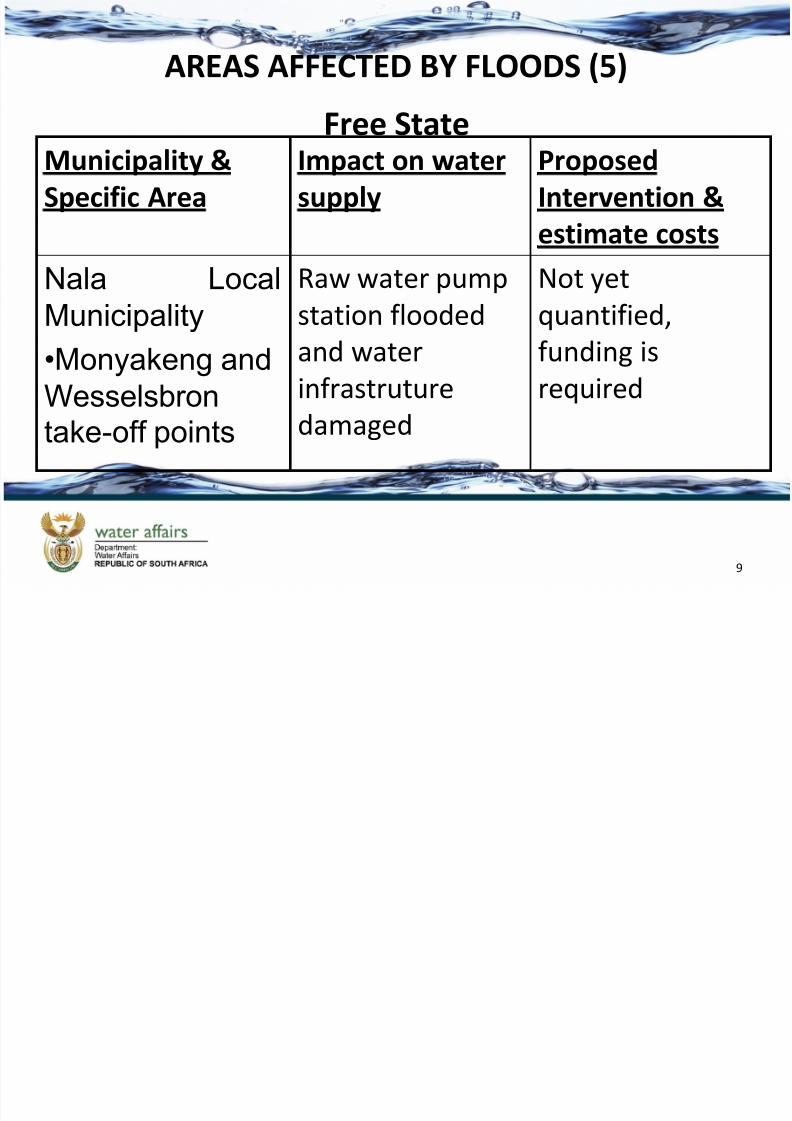
AREAS AFFECTED BY FLOODS (5)
Free State
9
Municipality &
Specific Area
Impact on water
supply
Proposed
Intervention &
estimate costs
Nala LocalMunicipality
•Monyakeng and
Wesselsbrontake-off points
Raw water pumpstation flooded
and water
infrastruture
damaged
Not yetquantified,
funding is
required
7/28/2019 110127 Floods
http://slidepdf.com/reader/full/110127-floods 10/36
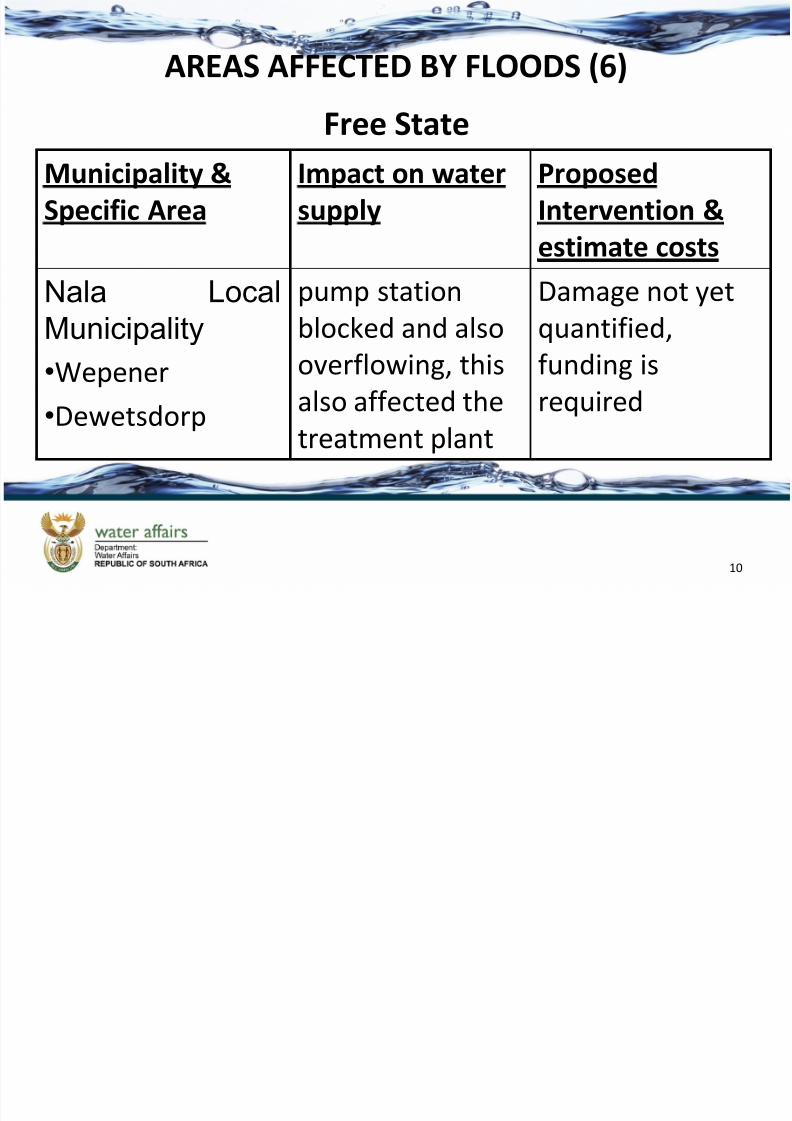
AREAS AFFECTED BY FLOODS (6)
Free State
10
Municipality &
Specific Area
Impact on water
supply
Proposed
Intervention &
estimate costs
Nala Local
Municipality
•Wepener
•Dewetsdorp
pump station
blocked and also
overflowing, this
also affected thetreatment plant
Damage not yet
quantified,
funding is
required
7/28/2019 110127 Floods
http://slidepdf.com/reader/full/110127-floods 11/36
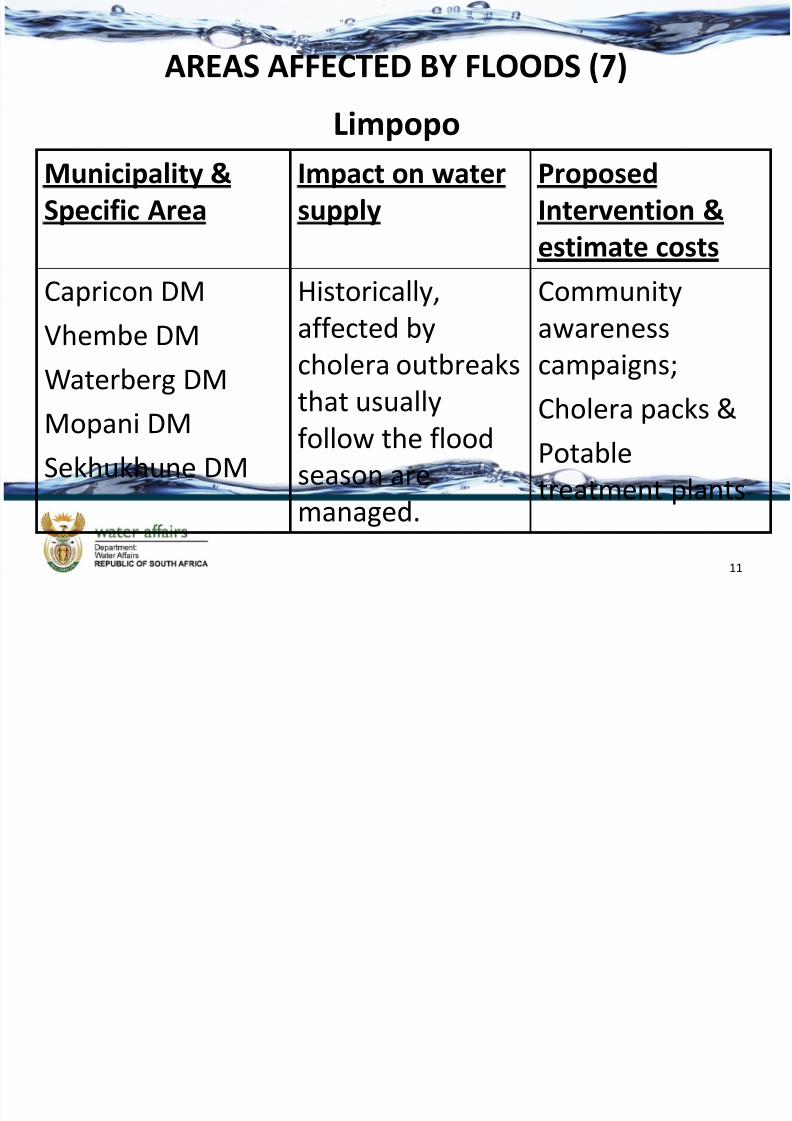
AREAS AFFECTED BY FLOODS (7)
Limpopo
11
Municipality &
Specific Area
Impact on water
supply
Proposed
Intervention &
estimate costs
Capricon DM
Vhembe DM
Waterberg DM
Mopani DM
Sekhukhune DM
Historically,
affected by
cholera outbreaks
that usuallyfollow the flood
season are
managed.
Community
awareness
campaigns;
Cholera packs &Potable
treatment plants

7/28/2019 110127 Floods
http://slidepdf.com/reader/full/110127-floods 12/36
AREAS AFFECTED BY FLOODS (7)
Mpumalanga & Northern Cape• Floods causes major damages
• Water levels are still very high in most cases
and assessment work on damages is ongoing
Important: Eastern Cape and Western Cape
Major concern is drought
12
7/28/2019 110127 Floods
http://slidepdf.com/reader/full/110127-floods 13/36
CURRENT SITUATION (1)
We do daily update on the situation at the four largedams in the Vaal Orange River system. Below is theupdate as at 26 January 2011 @ 14h00 and newreport has been issued this morning and will be
updated today at 14h00
Vaal Dam:
Vaal Dam capacity is currently at 100%
The current inflow is 1200 m3/s with an outflow of 680 m3/swith six (6 ) gates open
13

7/28/2019 110127 Floods
http://slidepdf.com/reader/full/110127-floods 14/36
CURRENT SITUATION (2)
Bloemhof Dam:
Bloemhof Dam capacity is currently at 92%
The current inflow is 1200 m3/s (to increase to 1800m3/s on 2011/01/29) and the outflow is 1300 m3/s
Gariep Dam:
Gariep Dam is currently at 115% (to increase to 123%on 2011/01/29).
The inflow is 4200 m3/s (to increase to 5000 m3/s on2011/01/27) and the outflow is 2100 m3/s (toincrease to 3200 m3/s on 2011/01/29).
14

7/28/2019 110127 Floods
http://slidepdf.com/reader/full/110127-floods 15/36
CURRENT SITUATION (3)
Vanderkloof Dam:
Vanderkloof Dam capacity is currently at 110% (toincrease to 116% on 2011/01/31)
The inflow is 2100 m3/s (to increase to 3200 m3/s on2011/01/30) and the outflow is 1700 m3/s (toincrease to 3000 m3/s on 2011/01/31).
15
7/28/2019 110127 Floods
http://slidepdf.com/reader/full/110127-floods 16/36
CURRENT SITUATION (4)
Lower Orange River
Predicted high flow at Upington of 4500 m3/s (stage7.3m (0.5m lower than the flood earlier this month))on 2011/02/03
A flow of 4500 m3/s is forecasted for the Lower OrangeRiver. The high discharge is mainly from the OrangeRiver.
16

7/28/2019 110127 Floods
http://slidepdf.com/reader/full/110127-floods 17/36
CURRENT SITUATION (5)
Limpopo, Olifants and Inkomati River Systems
Water levels are table and expected to rise as wetaherservices forecasted 60% chance rainfall – catchmentsare very wet and high flows are expected.
17

7/28/2019 110127 Floods
http://slidepdf.com/reader/full/110127-floods 18/36
CURRENT SITUATION (6)
uThugela, Umgeni, Hluhluwe river systems
Water levels are table and the uThugela river isexpected to rise as weather services forecasted morethan 30% chance of rainfall – catchments are very
wet and high floors are expected.
18

7/28/2019 110127 Floods
http://slidepdf.com/reader/full/110127-floods 19/36
CURRENT SITUATION (7)
uMsundusi and Fish river systems
Water levels are normal and may rise as more rains areexpected.
19

7/28/2019 110127 Floods
http://slidepdf.com/reader/full/110127-floods 20/36
CONCLUSIONS (1)
• Minister issued a press statement on how we areresponding on Disaster and has put aside R20million
for repairing of water resources infrastructure
• Assessment of damages is still continuing whilst river
levels are lowering
• Department is a member of the NATJOC and is
providing info on daily river flow levels and weekly
state of dams. The information is also accessible bypublic on internet
20

7/28/2019 110127 Floods
http://slidepdf.com/reader/full/110127-floods 21/36
CONCLUSIONS (2)
• Disaster management strategy which includemanagement of hydrological risks and extremes isbeing finalised and it is informed by National DisasterManagement Act -
• River levels in the Inkomati, Olifants, Thugela andLimpopo River systems are lowering
• Orange river levels are rising and it pose risks in thelower orange – Gariep and Vanderkloof dams have
no flood gates hence overflow can not be manuallycontrolled to keep more water in the dams
21
7/28/2019 110127 Floods
http://slidepdf.com/reader/full/110127-floods 22/36
CONCLUSIONS (3)
• More rainfall I still expected in most parts of the country towards March 2011
22

7/28/2019 110127 Floods
http://slidepdf.com/reader/full/110127-floods 23/36
PART 2
Flood management in the Vaal-River
System
23

7/28/2019 110127 Floods
http://slidepdf.com/reader/full/110127-floods 24/36
INTRODUCTION (1)
Management of extreme floods in the Vaal /Orange River system is an event drivenactivity done by the Department of Water Affairsin consultation with SAWS on daily weather Information and COGTA (NDMC).
The “Flood Room” in Pretoria serves as an
information centre to collect, process anddistribute rainfall, stage and flow data
Information is then sent through to NDMC – dailyand other institutions in the
24

7/28/2019 110127 Floods
http://slidepdf.com/reader/full/110127-floods 25/36
INTRODUCTION (2)
The main objectives of flood management is to:• protect the life of people and minimisation of
infrastructure damages
• Ensuring that the dams are 100% full at theend of the flood
25
7/28/2019 110127 Floods
http://slidepdf.com/reader/full/110127-floods 26/36
26
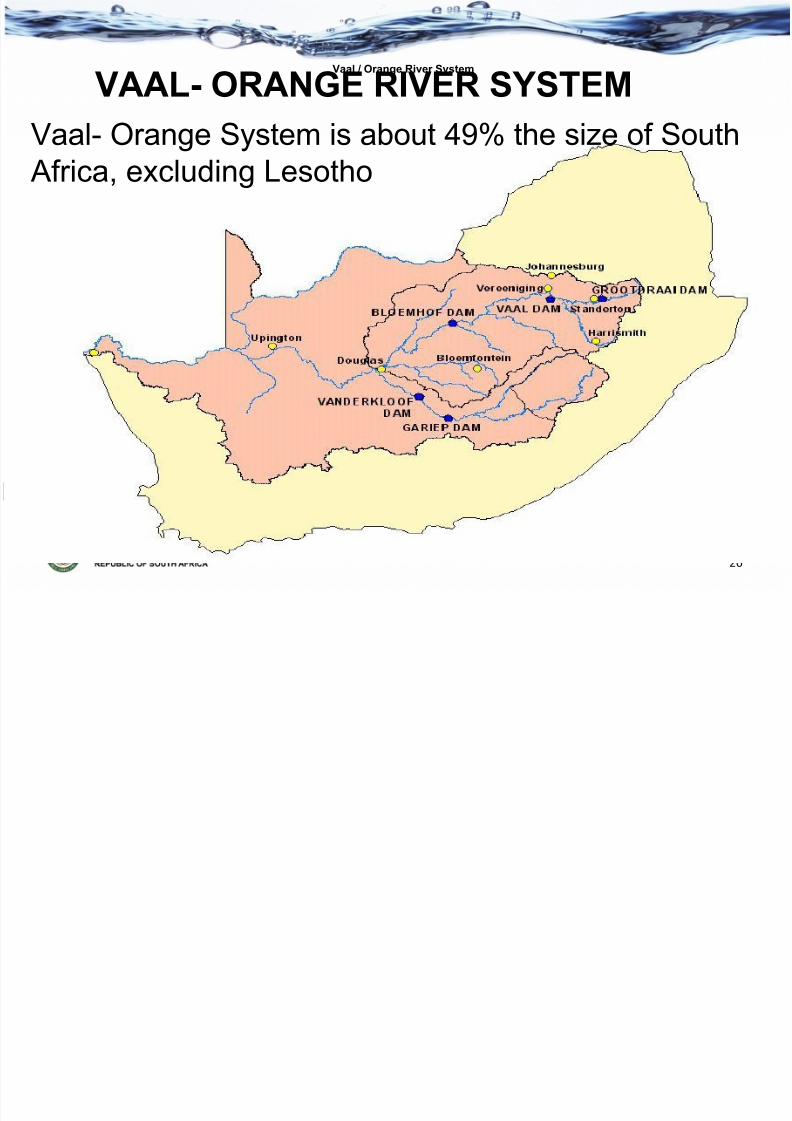
Vaal / Orange River System
Vaal- Orange System is about 49% the size of South Africa, excluding Lesotho
VAAL- ORANGE RIVER SYSTEM

7/28/2019 110127 Floods
http://slidepdf.com/reader/full/110127-floods 27/36
MONITORING STATION IN THE VAAL-ORANGE
RIVER SYSTEM
50 Gauging stations collecting near real time flow and / or rainfalldata - available on the Hydrology real time Web Site
27
7/28/2019 110127 Floods
http://slidepdf.com/reader/full/110127-floods 28/36
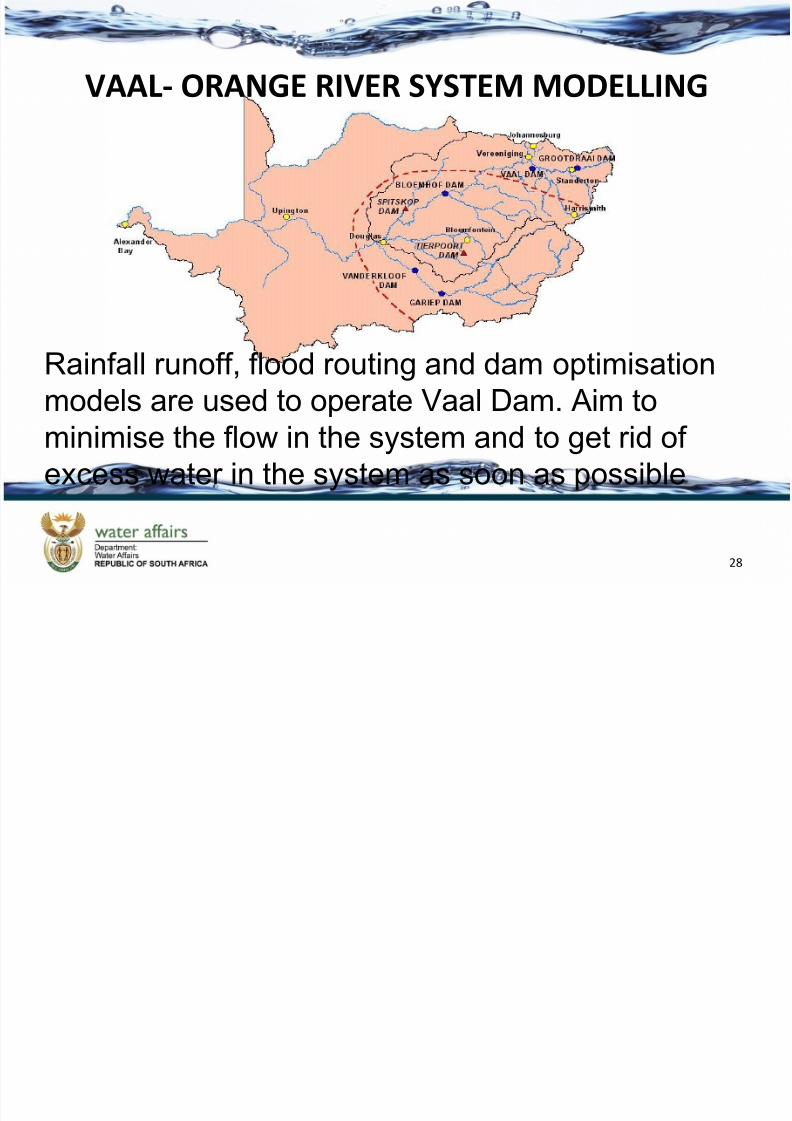
VAAL- ORANGE RIVER SYSTEM MODELLING
Rainfall runoff, flood routing and dam optimisation
models are used to operate Vaal Dam. Aim to
minimise the flow in the system and to get rid of
excess water in the system as soon as possible
28
7/28/2019 110127 Floods
http://slidepdf.com/reader/full/110127-floods 29/36
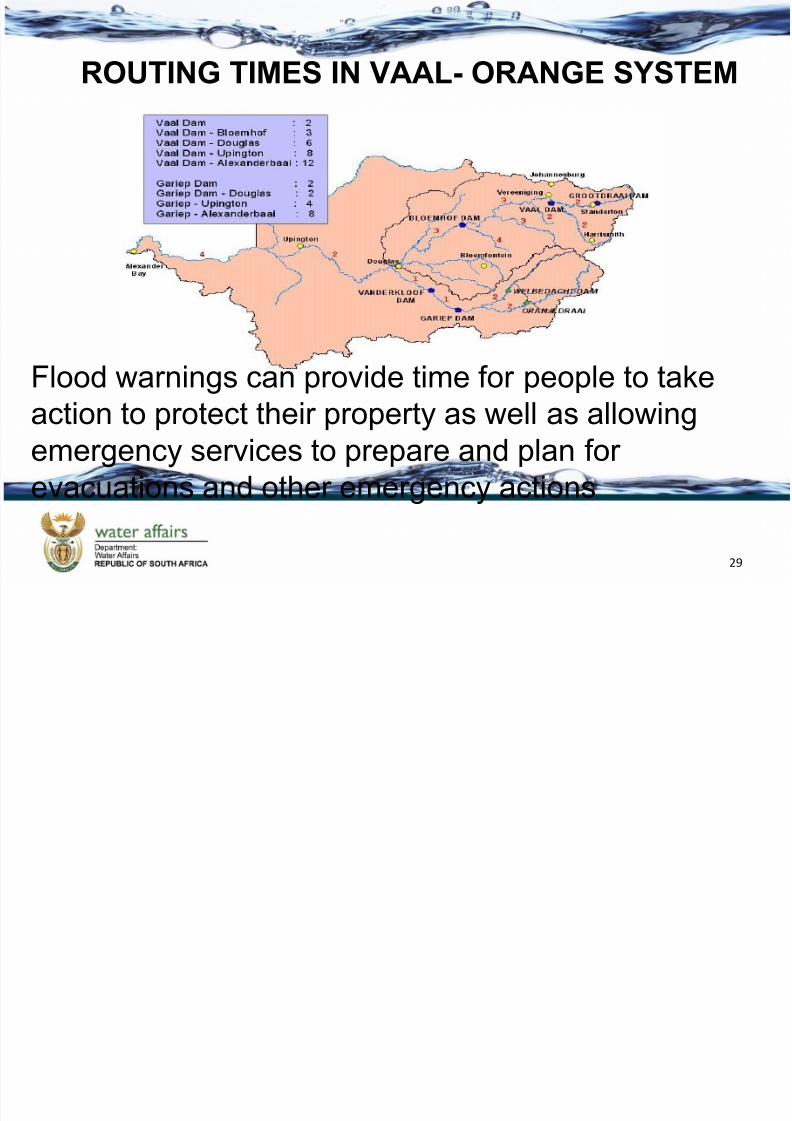
ROUTING TIMES IN VAAL- ORANGE SYSTEM
Flood warnings can provide time for people to take
action to protect their property as well as allowingemergency services to prepare and plan for
evacuations and other emergency actions
29

7/28/2019 110127 Floods
http://slidepdf.com/reader/full/110127-floods 30/36
MANAGEMENT OF INFLOW/OUTFLOWS (1)Vaal Dam
0
500
1000
1500
2000
2500
3000
1 2 / 1 7 / 2 0
1 0
1 2 / 1 9 / 2 0
1 0
1 2 / 2 1 / 2 0
1 0
1 2 / 2 3 / 2 0
1 0
1 2 / 2 5 / 2 0
1 0
1 2 / 2 7 / 2 0
1 0
1 2 / 2 9 / 2 0
1 0
1 2 / 3 1 / 2 0
1 0
1 / 2 / 2 0
1 1
1 / 4 / 2 0
1 1
1 / 6 / 2 0
1 1
1 / 8 / 2 0
1 1
1 / 1 0 / 2 0 1
1
1 / 1 2 / 2 0 1
1
1 / 1 4 / 2 0 1
1
1 / 1 6 / 2 0 1
1
1 / 1 8 / 2 0 1
1
1 / 2 0
/ 2 0 1
1
1 / 2 2
/ 2 0 1
1
1 / 2 4
/ 2 0 1
1
Date
D i s c h a r g e
85
90
95
100
105
110
115
C a p a c i t y (
% )
Vaal Dam Inflow Vaal Dam Outflow Vaal Dam (%)
30

7/28/2019 110127 Floods
http://slidepdf.com/reader/full/110127-floods 31/36
MANAGEMENT OF INFLOW/OUTFLOWS (2)
Bloemhof Dam
0
500
1000
1500
2000
2500
3000
3500
4000
1 2 / 1 7 / 2 0
1 0
1 2 / 1 9 / 2 0
1 0
1 2 / 2 1 / 2 0
1 0
1 2 / 2 3 / 2 0
1 0
1 2 / 2 5 / 2 0
1 0
1 2 / 2 7 / 2 0
1 0
1 2 / 2 9 / 2 0
1 0
1 2 / 3 1 / 2 0
1 0
1 / 2 / 2 0
1 1
1 / 4 / 2 0
1 1
1 / 6 / 2 0
1 1
1 / 8 / 2 0
1 1
1 / 1 0 / 2 0 1
1
1 / 1 2 / 2 0 1
1
1 / 1 4 / 2 0 1
1
1 / 1 6 / 2 0 1
1
1 / 1 8 / 2 0 1
1
1 / 2 0
/ 2 0 1
1
1 / 2 2
/ 2 0 1
1
1 / 2 4
/ 2 0 1
1
Date
D i s c h a r g e
85
87
89
91
93
95
97
99
101
103
105
C a p a c i t y ( % )
Bloehof Inflow Bloemhof Outflow Bloemhof (%)
31

7/28/2019 110127 Floods
http://slidepdf.com/reader/full/110127-floods 32/36
MANAGEMENT OF INFLOW/OUTFLOWS
Gariep Dam
0
500
1000
1500
2000
2500
3000
3500
4000
4500
1 2 / 1 7 / 2 0
1 0
1 2 / 1 9 / 2 0
1 0
1 2 / 2 1 / 2 0
1 0
1 2 / 2 3 / 2 0
1 0
1 2 / 2 5 / 2 0
1 0
1 2 / 2 7 / 2 0
1 0
1 2 / 2 9 / 2 0
1 0
1 2 / 3 1 / 2 0
1 0
1 / 2 / 2 0
1 1
1 / 4 / 2 0
1 1
1 / 6 / 2 0
1 1
1 / 8 / 2 0
1 1
1 / 1 0 / 2 0 1
1
1 / 1 2 / 2 0 1
1
1 / 1 4 / 2 0 1
1
1 / 1 6 / 2 0 1
1
1 / 1 8 / 2 0 1
1
1 / 2 0
/ 2 0 1
1
1 / 2 2
/ 2 0 1
1
1 / 2 4
/ 2 0 1
1
Date
D i s c h a r g e
85
90
95
100
105
110
115
120
125
C a p a c i t y ( % )
Gariep Inflow Gariep Outflow Gariep (%)
32

7/28/2019 110127 Floods
http://slidepdf.com/reader/full/110127-floods 33/36
MANAGEMENT OF INFLOW/OUTFLOWS (4)Vanderkloof Dam
0
500
1000
1500
2000
2500
3000
1 2 / 1 7 / 2 0
1 0
1 2 / 1 9 / 2 0
1 0
1 2 / 2 1 / 2 0
1 0
1 2 / 2 3 / 2 0
1 0
1 2 / 2 5 / 2 0
1 0
1 2 / 2 7 / 2 0
1 0
1 2 / 2 9 / 2 0
1 0
1 2 / 3 1 / 2 0
1 0
1 / 2 / 2 0
1 1
1 / 4 / 2 0
1 1
1 / 6 / 2 0
1 1
1 / 8 / 2 0
1 1
1 / 1 0
/ 2 0 1
1
1 / 1 2
/ 2 0 1
1
1 / 1 4
/ 2 0 1
1
1 / 1 6
/ 2 0 1
1
1 / 1 8
/ 2 0 1
1
1 / 2 0
/ 2 0 1
1
1 / 2 2
/ 2 0 1
1
1 / 2 4
/ 2 0 1
1
Date
D i s c h a r g e
85
90
95
100
105
110
115
C a p a c i t y ( %
)
vd Kloof Inflow vd Kloof Outflow vd Kloof (%)
33
7/28/2019 110127 Floods
http://slidepdf.com/reader/full/110127-floods 34/36
CONCLUSION (1)
In the recent floods almost double the volumeof Vaal Dam and four times the volume of
Bloemhof Dam flowed through the dams
Short, medium and long term weather
forecasts, satellite and radar images and 24
hour rainfall figures play a major role in
operating decisions during the flood
34

7/28/2019 110127 Floods
http://slidepdf.com/reader/full/110127-floods 35/36
CONCLUSION (2)
Apart from possible dam failure and loss of life,incorrect or poor dam operation could lead to
billions of Rands in flood damage. (Example:
the Zuikerbosch and Vereeniging pump
stations are insured for about R 2.4 billion andproperty along the river in Vereeniging for
about R 10.2 billion)
35
7/28/2019 110127 Floods
http://slidepdf.com/reader/full/110127-floods 36/36
THANK YOU
36