11 oncol pet
38
227 BACKGROUND For decades, positron emission tomography (PET) was used for many research applications. In recent years, changes in reimbursement and availability have led to the rapid expansion of PET for clinical patient care. The majority of these PET scans are performed to evaluate cancer using the glucose analog fluorine-18 fluorodeoxy- glucose (F-18 FDG). In most cases, cancer cells are more metabolically active and divide more rapidly than normal tissues. By using radiopharmaceuticals that target physio- logical parameters such as glucose metabolism, PET enables imaging and quantification of cellular function and tumor detection. This approach has several potential advantages over anatomical modalities such as computed tomography (CT). CT imaging relies on size and architectural changes to diagnose malignancy, which limits sensitivity and speci- ficity. For example, when lymph nodes are identified in patients with cancer, enlarged nodes are assumed to har- bor malignancy and normal-size nodes are characterized as benign. Therefore nodes seen on CT are often inac- curately characterized as benign because they are not pathologically enlarged. In addition, it is often difficult to determine whether a residual mass seen on CT after therapy contains tumor as a change in the size of a mass does not accurately predict tumor response to therapy. Evaluation after therapy may also be difficult because scarring from surgery and radiation can obscure malig- nant disease. PET, on the other hand, permits monitor- ing of activity levels on serial studies. Changes in metabolic activity better characterize a mass and better predict therapy outcome than anatomical measurements of size. However, PET is limited by a lack of anatomical detail. Normal uptake in structures such as bowel, muscles, and ureters can be mistaken for tumor. Therefore correlation with CT or magnetic resonance imaging (MRI) is critical for image interpretation. Although PET images can be fused to the CT when performed separately, most PET scans are currently acquired sequentially with the CT on a dedicated PET/CT scanner. This allows the most precise image fusion because differences in position are minimal. The combination of anatomical information with meta- bolic data is the most accurate method for evaluating malignancy. Although F-18 FDG is highly sensitive for many tumors, reimbursement policy development for PET in the United States has been complicated (Table 11-1). In response to government requirements for evidence development before authorizing PET reimbursement, medical imaging societies formed the National Oncologic PET Registry (NOPR), which allowed payments for PET scans for patients on Medicare participating in the project and gath- ered data on the clinical impact of PET. When looking at large numbers of patients with many different tumors, ini- tial results from the NOPR showed that PET changed patient management 36.5% of the time. The impact included avoiding biopsy, a major change in therapy, and a change in overall treatment goal. Based on the overall suc- cess of the NOPR trial, most solid tumors are eligible for at least one initial assessment and many others may qualify for subsequent evaluations. Radiopharmaceuticals Many commonly used positron-emitting radioisotopes are based on atoms found in organic substances: oxygen-15, nitrogen-13, carbon-11, and the hydroxyl analog, F-18 (Table 11-2). Short half-lives limit the clinical usefulness of many positron emitters, requiring a cyclotron to be in close proximity. However, F-18 has a 110-minute half-life and can be delivered from regional, commercial cyclotrons. The various positron emitters can be attached to biologi- cal carrier molecules. Carrier molecules such as nucleo- sides, amino acids, fatty acid components, and glucose analogs are chosen to form radiopharmaceuticals that tar- get components of cellular metabolism and division. Tar- gets include DNA synthesis, membrane synthesis, and glucose metabolism (Table 11-3). The chemistry of label- ing carrier molecules with positron emitters is usually much simpler than labeling with gamma emitters such as technetium-99m. Although F-18 sodium fluoride (F-18 NaF) was also approved by the U.S. Food and Drug Administration, F-18 FDG is the only PET radiopharma- ceutical in wide clinical use for oncological imaging. Fluorine-18 Fluorodeoxyglucose Cancer cells generally have a higher level of metabolic activity than normal tissues and use more glucose. In malignant cells, higher levels of glucose membrane trans- porters increase intracellular glucose uptake. Within the cancer cell, hexokinase (hexokinase II) activity levels are increased, and the phosphorylated glucose then moves through the glycolysis pathway. F-18 FDG is a glucose analog that is taken into the cell and phosphorylated by the same mechanism as glu- cose. Increased F-18 FDG activity is seen in tumors for several reasons. First of all, increased glucose transporter activity is present. In addition, glucose-6-phosphatase levels are low in cancer cells, and the phosphorylated CHAPTER 11 Oncology: Positron Emission Tomography
-
Upload
azmal-sarker -
Category
Health & Medicine
-
view
203 -
download
2
Transcript of 11 oncol pet

Chapter 11
Oncology: Positron Emission Tomography
BACKGROUND
For decades, positron emission tomography (PET) was used for many research applications. In recent years, changes in reimbursement and availability have led to the rapid expansion of PET for clinical patient care. The majority of these PET scans are performed to evaluate cancer using the glucose analog fluorine-18 fluorodeoxy-glucose (F-18 FDG). In most cases, cancer cells are more metabolically active and divide more rapidly than normal tissues. By using radiopharmaceuticals that target physio-logical parameters such as glucose metabolism, PET enables imaging and quantification of cellular function and tumor detection. This approach has several potential advantages over anatomical modalities such as computed tomography (CT).
CT imaging relies on size and architectural changes to diagnose malignancy, which limits sensitivity and speci-ficity. For example, when lymph nodes are identified in patients with cancer, enlarged nodes are assumed to har-bor malignancy and normal-size nodes are characterized as benign. Therefore nodes seen on CT are often inac-curately characterized as benign because they are not pathologically enlarged. In addition, it is often difficult to determine whether a residual mass seen on CT after therapy contains tumor as a change in the size of a mass does not accurately predict tumor response to therapy. Evaluation after therapy may also be difficult because scarring from surgery and radiation can obscure malig-nant disease. PET, on the other hand, permits monitor-ing of activity levels on serial studies. Changes in metabolic activity better characterize a mass and better predict therapy outcome than anatomical measurements of size.
However, PET is limited by a lack of anatomical detail. Normal uptake in structures such as bowel, muscles, and ureters can be mistaken for tumor. Therefore correlation with CT or magnetic resonance imaging (MRI) is critical for image interpretation. Although PET images can be fused to the CT when performed separately, most PET scans are currently acquired sequentially with the CT on a dedicated PET/CT scanner. This allows the most precise image fusion because differences in position are minimal. The combination of anatomical information with meta-bolic data is the most accurate method for evaluating malignancy.
Although F-18 FDG is highly sensitive for many tumors, reimbursement policy development for PET in the United States has been complicated (Table 11-1). In response to government requirements for evidence development before authorizing PET reimbursement, medical imaging
227
societies formed the National Oncologic PET Registry (NOPR), which allowed payments for PET scans for patients on Medicare participating in the project and gath-ered data on the clinical impact of PET. When looking at large numbers of patients with many different tumors, ini-tial results from the NOPR showed that PET changed patient management 36.5% of the time. The impact included avoiding biopsy, a major change in therapy, and a change in overall treatment goal. Based on the overall suc-cess of the NOPR trial, most solid tumors are eligible for at least one initial assessment and many others may qualify for subsequent evaluations.
Radiopharmaceuticals
Many commonly used positron-emitting radioisotopes are based on atoms found in organic substances: oxygen-15, nitrogen-13, carbon-11, and the hydroxyl analog, F-18 (Table 11-2). Short half-lives limit the clinical usefulness of many positron emitters, requiring a cyclotron to be in close proximity. However, F-18 has a 110-minute half-life and can be delivered from regional, commercial cyclotrons.
The various positron emitters can be attached to biologi-cal carrier molecules. Carrier molecules such as nucleo-sides, amino acids, fatty acid components, and glucose analogs are chosen to form radiopharmaceuticals that tar-get components of cellular metabolism and division. Tar-gets include DNA synthesis, membrane synthesis, and glucose metabolism (Table 11-3). The chemistry of label-ing carrier molecules with positron emitters is usually much simpler than labeling with gamma emitters such as technetium-99m. Although F-18 sodium fluoride (F-18 NaF) was also approved by the U.S. Food and Drug Administration, F-18 FDG is the only PET radiopharma-ceutical in wide clinical use for oncological imaging.
Fluorine-18 FluorodeoxyglucoseCancer cells generally have a higher level of metabolic activity than normal tissues and use more glucose. In malignant cells, higher levels of glucose membrane trans-porters increase intracellular glucose uptake. Within the cancer cell, hexokinase (hexokinase II) activity levels are increased, and the phosphorylated glucose then moves through the glycolysis pathway.
F-18 FDG is a glucose analog that is taken into the cell and phosphorylated by the same mechanism as glu-cose. Increased F-18 FDG activity is seen in tumors for several reasons. First of all, increased glucose transporter activity is present. In addition, glucose-6-phosphatase levels are low in cancer cells, and the phosphorylated

228 Nuclear Medicine: The Requisites
Table 11-1 History of Positron Emission Tomography Coverage by Centers for Medicare and Medicaid (CMS) in the United States
Date Clinical indication Coverage
March 1995 Myocardial perfusion Coronary artery disease (Rubidium-82)
January 1998 Solitary pulmonary nodule Characterization
Non–small cell lung cancer Initial staging
July 1999 Colorectal cancer and melanoma Suggested recurrence
Lymphoma Staging/restaging as alternative to gallium scan
July 2001 Non–small cell lung cancer, esophageal cancer, colorectal cancer, lymphoma, melanoma, and head and neck cancer (excluding CNS and thyroid)
Diagnosis, staging, restaging
July 2001 Refractory seizures Presurgical
July 2001 Myocardial viability Following inconclusive SPECT
October 2002 Myocardial viability Initial diagnosis
Breast cancer Staging, restaging, response to therapy
October 2003 Thyroid cancer Restaging (negative I-131 scan, rising thyroglobulin)
September 2004 Alzheimer disease and dementia In CMS approved clinical trial
September 2005 Brain, cervical, ovarian, pancreatic, small cell lung, testicular, and all other cancers and indications not previously specified
Coverage with evidence development (NOPR)
November 2009 Cancers of the following: Brain, breast, colorectal, esophageal, head and neck, lymphoma, melanoma, myeloma, non–small lung, ovary, and thyroid (follicular with negative I-131 and rising thyroglobulin)
Initial treatment strategy and subsequent treatment strategy
November 2009 Cancers of the following: Anus, bladder, bile duct, bone/cartilage, brain/CNS, cervix, connective/soft tissue, eye, gallbladder, genitalia (male/female), Kaposi’s sarcoma, kidney, liver, neuroendocrine tumor, pancreas, pleura, retroperitoneum and peritoneum, skin (non-melanoma), small cell lung, small intestine, stomach, testis, thymus, heart, unknown primary, ureter, uterus, adenexa; all other solid tumors
Initial treatment strategy covered and subsequent treatment strategy NOPR
Prostate Initial treatment strategy not covered; subsequent treatment strategy NOPR
Leukemia and all other cancers not listed NOPR
February 2010 Bone metastases F-18 sodium fluoride (NaF)
CEA, carcinogen embryonic antigen; CNS, central nervous system; NOPR, National Oncologic PET Registry; SPECT, single-photon emission tomography.
Table 11-2 Physical Characteristics of Positron-Emitting Isotopes Important in Oncology
Radioisotope Half-life (min) Decay mode (%) γ (keV) β+ E max (MeV) Range (mm)
O-15 2.07 β+ (99.9) EC (0.1) 511 1.72 8.0
N-13 9.96 β+ (100) 511 1.19 5-4
C-11 20.4 β+ (99.8) EC (0.2) 511 0.96 4.1
F-18 109.7 β+ (97) EC (3) 511 0.635 2.4
β+, Positron emission; EC, electron capture.
Table 11-3 Carrier Molecules for Positron Emission Tomography Imaging in Oncology
Agent Target Label
Deoxyglucose Glucose metabolism F-18
Thymidine DNA synthesis F-18, C-11
Acetate Lipid synthesis F-18, C-11
Choline Lipid synthesis, membrane synthesis C-11
Tyrosine Protein synthesis F-18, C-11
Methionine Protein synthesis C-11
FDG cannot diffuse out of the cell. Unlike glucose, F-18 FDG is not metabolized further and remains trapped (Fig. 11-1).
After intravenous injection, F-18 FDG rapidly distrib-utes throughout the body. Cellular uptake and phosphory-lation occur as background activity clears. The primary route of radiotracer excretion occurs by the kidneys, although F-18 FDG excretion also takes place through the bowel. Optimal imaging time is usually 40 to 60 min-utes, based on maximum uptake, background clearance, and physical half-life. Some studies have suggested addi-tional delayed images at 90 to 120 minutes may identify

additional tumors because they continue to accumulate F-18 FDG, while activity clears from tissues and benign processes.
Many factors affect F-18 FDG uptake, distribution, and clearance. Serum glucose actively competes with F-18 FDG uptake. Insulin occurring endogenously after eating or administration to diabetics will increase uptake to the liver and muscles, thereby decreasing uptake in tumors. Also, inflammation and infection may result in uptake that rivals or exceeds that of a malignancy.
Investigational Positron Emission Tomography Imaging AgentsF-18 FDG uptake in tumor is not specific for malignancy. Clinically, it is often critical to differentiate cancer from inflammation. Many radiotracers that are more specific for malignancy by imaging the increased cellular division seen with cancer are under investigation. Other agents are being examined that may be superior to F-18 FDG because of more specific tumor uptake or reduced back-ground activity. Additionally, PET radiopharmaceuticals are being developed that bind to receptors or reveal areas of tumor hypoxia. Some of these experimental agents are available for purchase through commercial radiopharmacies, and several more are expected to become available in the next few years. However, much work will be needed before these agents are approved or widely reimbursed for clinical use, as is discussed in Chapter 2.
In addition to these newer agents, F-18 NaF is gaining renewed interest (see Chapter 7). F-18 NaF was origi-nally used as a bone scan agent, but it fell out of favor with the introduction of Tc-99m methylene diphosphate (MDP). However, with the rapid spread of dedicated PET/CT cameras, F-18 NaF may be more sensitive than Tc-99m MDP or F-18 FDG in evaluation of several skel-etal tumors, including highly lytic tumors such as multi-ple myeloma. Work is being done to assess its actual utility.
Figure 11-1. Glucose and F-18 FDG intracellular kinetics. F-18 FDG uses the same uptake and phosphorylation pathways as glucose, although it cannot be metabolized through glycolysis. In cancer cells, greater accu-mulation is seen due to different levels of enzymatic activity. G-6-P, Glu-cose-6-phosphatase.
OncOlOgy: POsiTrOn emissiOn TOmOgraPhy 229
Fluorine-18 Fluorodeoxyglucose Positron Emission Tomography DosimetryRadiation dosimetry values for F-18 FDG are listed in Table 11-4. The whole-body effective dose from a stan-dard 400-MBq scan is 1.6 mSv (160 mrem). CT scans, used for anatomical localization, are generally performed using a low-dose technique. The effective radiation dose of a low-dose whole-body CT performed for PET/CT varies, but may be 2 mSv (200 mrem). This compares to typical diag-nostic or optimized chest CT, in which the effective dose frequently reaches 8 mSv because increased radiation used to visualize structures optimally.
Protocol
An example of a protocol for F-18 FDG PET in patients with cancer is included in Box 11-1. Patient preparation generally includes fasting overnight or for at least 4 to 6 hours before injection and avoiding carbohydrates in the meal before injection. Because glucose competes with F-18 FDG, protocols include measures to limit the impact of serum glucose of the scan. The glucose level of patients should be checked before injection. The upper-limit cut-off varies among institutions, but a value under 200 mg/dL is generally considered acceptable. Patients with diabetes must be carefully scheduled, usually early in the morning after fasting and before taking insulin. Short-acting insulin should not be given within 2 hours of radiotracer injection and long-acting insulin should be held overnight. Patients with non–insulin-dependent diabetes are treated in a simi-lar fashion. However, if the oral hypoglycemic medication metformin could be withheld for 2 days, this will decrease bowel background activity related to the drug.
Claustrophobic patients may require sedation, particu-larly when a PET/CT is performed, because the machine has a deep bore. Sedatives and beta-adrenergic blockers are sometimes used to decrease uptake in the supraclavic-ular fat (brown fat), although this is often with limited effectiveness. Patients should be kept warm, quiet, and relaxed for 30 to 60 minutes before injection and uptake phases to decrease muscle and brown-fat uptake. Patients should be instructed to avoid strenuous exercise for a cou-ple of days before the study.
The standard F-18 FDG dose is 10 to 15 mCi (370-555 MBq) intravenously. A weight-based approach has been instituted to decrease pediatric exposure using 0.14 to 0.20 mCi/kg (5.18-7.4 MBq/kg). An absorption and clearance period necessitates a delay of 40 to 60 minutes before scan-ning. Patients must void immediately before being placed on the scanner.
Patients are usually imaged in the supine position. Because attenuation correction with CT causes beam-hardening artifact when the arms are in the field of view, arm position always must be taken into consideration. Arms are placed above the head when the pathology is in the chest, abdomen, and pelvis. When the tumor is in the
Table 11-4 Fluorine-18 Fluorodeoxyglucose Dosimetry
Organ receive highest dose Exposure Effective dose
Bladder 0.17 mGy (0.63 rad) 0.027 mSv (0.10 rem)
230 Nuclear Medicine: The Requisites
head and neck, patients are imaged with arms at their sides. Scanning usually begins at the head but will begin at the thighs when tumor is in the pelvis, to minimize the impact of urine activity accumulating in the bladder.
The imaging is done in two stages. First, a transmission scan using an external positron or x-ray source (e.g., CT) is performed for attenuation correction. The positron emission scan is then acquired, which detects the photons from the F-18 FDG. As the administered dose is known and can be time-decay corrected, the number of photons striking the detector will reflect the metabolic activity of a lesion once a correction for differences in tissue attenuation is applied. Therefore attenuation correction allows the levels of activity in the patient to be accurately quantified. An attenuation cor-rection factor is calculated by comparing the counts striking the detector from the transmission scan through the patient to a blank scan where no patient is present: attenuation correc-tion factor = (counts blank scan)/(counts transmission scan).
External rods (germanium-68 or cesium-137) rotating around the patient have been used for this attenuation
Box 11-1. Protocol for Fluorine-18 Fluorodeoxyglucose Imaging in Oncology
PATIENT PREPARATIONAvoid strenuous exercise for several daysDiabetics well controlled, stop long-acting insulin 8
to 12 hours before scan, and no short-acting insulin within 2 hours of FDG injection
NPO except for water 4 to 6 hours or overnight, avoid carbohydrates
Check serum glucose (<200 mg/dL)Patient kept warm, quiet, and relaxedConsider sedation for claustrophobia, anxiety or tense
muscles, cancer in head and neck, prior brown fat uptake
RADIOPHARMACEUTICALChildren: 150 μCi/kg (5.3 MBq/kg)Adults: 10-15 mCi [0.14-0.21 mCi/kg (5.18-7.77 MBq/
kg)] intravenouslyWait 45 to 60 minutes, patient to avoid movement
and speechVoid
IMAGE ACQUISITION AND PROCESSINGField of ViewVaries by patient size (50 cm)
Transmission ScanDedicated PET Only ScannerExternal rod source 3 to 5 minutes per bed position
PET/CTLow-dose CT (70-80 mA, 140 kvP)
Emission Scan5 to 10 minutes per bed positionRepeat imaging each section or bed position until
area covered
ProcessingFiltered backprojection or iterative reconstruction
FDG, Fluorodeoxyglucose; NPO, nil per os.
correction transmission scan. The process requires 4 to 6 minutes per image level (or bed position), with a typical whole-body scan requiring 5 to 7 bed positions. A PET/CT scanner uses the CT transmission data for attenuation correction and for image fusion for anatomical localization. The CT takes only seconds to complete.
The emission scan data are then acquired from the F-18 FDG patient activity. Depending on patient size, camera technology, and radiopharmaceutical dose, the emission scan takes 5 to 10 minutes per bed position on traditional PET/CT scanners. A whole-body scan has traditionally been considered a scan from skull base to midthigh, requir-ing approximately 15 to 40 minutes, depending on the type of scanner. If the entire brain or the lower extremities are included, more bed positions are added. This acquisition can be done more quickly with new time-of-flight cameras.
Currently, most PET/CT scans are performed without intravenous contrast. Contrast administration requires addi-tional time, support personnel, equipment, and patient supervision. Also, CT contrast agents cause increased atten-uation on the transmission scan, which can lead to areas of artifactually increased activity on attenuation- corrected PET images when the contrast is dense or concentrated. However, use of intravenous contrast has been increasing because it helps identify normal structures and make patho-logical conditions more conspicuous. Water can be used to distend the stomach and proximal bowel. Otherwise, dilute oral contrast or water-equivalent negative oral contrast agents are acceptable. Performing the attenuation-correction CT scan after the arterial phase of the intravenous contrast bolus will reduce the artifact from intravenous contrast material. In practice, examining the non–attenuation contrast images should allow an experienced reader to avoid confusion caused by contrast artifact.
Data are displayed as a maximal intensity projection (MIP) rotating image or as transaxial, coronal, and sagittal slices. Both attenuation-corrected images and non– attenuation-correction images should be reviewed because artifacts and lesions may be more obvious on one or the other. PET/CT scanners will automatically provide images fused to the CT in each orthogonal plane. If the CT is done in a separate imaging session, postimage fusion software may require manual or may semiautomatic alignment. A current correlative CT is helpful for optimal interpretation.
IMAGE INTERPRETATION
Normal Distribution and Variants of F-18 Fluorodeoxyglucose
The normal distribution of F-18 FDG reflects glucose metabolism (Fig. 11-2). The brain is an obligate glucose user, so uptake is high. The kidneys, ureters, and bladder also show intense activity from urinary clearance of F-18 FDG. Moderate and sometimes heterogeneous activity is seen in the liver. Variable activity occurs in the heart, gastro-intestinal tract, salivary glands, and testes. The uterus may show endometrial uptake depending on the menstrual cycle stage. Low-level activity is normal in the bone marrow.
The urinary activity can lead to interpretation difficul-ties. Although the ureters usually appear as long tubular structures, they may be seen as very focal areas of activity

that may be confused with a pathological condition. CT correlation or PET/CT can help localize the activity to a visible ureter or show that no mass or lymph node is pres-ent. F-18 FDG in the bladder and kidneys can prevent visualization of tumors in those structures. The bladder may also limit evaluation of other tumors in the pelvis.
Figure 11-2. Normal distribution of F-18 FDG. Uptake is normally intense in the brain and urinary tract, moderately intense in the liver, and variable in muscles (especially of the oropharynx), heart, and bowel.
OncOlOgy: POsiTrOn emissiOn TOmOgraPhy 231
When imaging tumors located near the heart, minimizing cardiac activity is desirable. The myocardium uses glucose as an optional fuel. In a fasting state, fatty acid metabolism dominates over glucose use, leading to decreased FDG uptake. However, fasting yields inconsistent results. In fact, significant cardiac uptake is seen in up to 50% of fasting patients. Myocardial uptake is usually not seen in the right ventricle and may be heterogeneous in the left ventricle.
Normal excretion of F-18 FDG is highly variable through-out the gastrointestinal tract. Low-level activity can be seen focally or diffusely in the esophagus. In general, this normal uptake is less than that seen with esophagitis or cancer. Sig-nificant activity in the stomach sometimes limits the use of F-18 FDG PET in the evaluation of gastric adenocarcinoma and gastric lymphoma. Activity in both large and small bowel is especially problematic because it may obscure tumor in the bowel and mesentery (Fig. 11-3, A). Patients on the oral diabetic medication metformin frequently show intense activity in the small bowel. Focal accumulation of F-18 FDG may be caused by malignant and villous adeno-mas, but it is frequently an unexplained, transient finding.
Activity in the oropharyngeal cavity is highly variable. Low-level activity is normally seen in the salivary glands. Nonspecific diffuse uptake is occasionally seen in the parotid glands bilaterally in patients undergoing therapy. Marked uptake is often seen in oropharyngeal lymphoid tissue, including palatine and lingual tonsils (Fig. 11-3, B). Although uptake is most often symmetric, asymmetry can occur normally or as a result of therapy and inflammation. This may make it difficult to evaluate a tumor.
Benign Variants
Many processes alter F-18 FDG distribution (Box 11-2) and may affect the scheduling of a PET scan (Table 11-5).
A B
Figure 11-3. Normal variants. A, Normal intense uptake can be seen in small and large bowel. Bowel uptake is increased with metformin use. B, Axial PET and corresponding CT images show normal uptake in the oropharynx. Normal uptake is often symmetric and may be very intense when patients swallow excessively or talk. L, Lingual tonsils; M, mandible; Mx, maxilla; P, parotid gland; PT, palatine tonsils; S, submandibular gland.

232 Nuclear Medicine: The Requisites
Ivilatptoaspc(
Fataat
Figure 11-4. Muscle activity from increased insulin levels. Intense, dif-fuse uptake in the muscles caused by eating before radiotracer injection might obscure malignancy and require a repeat examination.
Ffvplefn
Table 11-5 Clinical Factors Altering Patient Scheduling
History Course of action
Prior surgery Delay scan 4-6 weeks
Chemotherapy Delay scan several weeks or schedule scan just before next cycle
Radiation therapy Delay scan at least 3 months
Colony-stimulating factor
Delay scan 1 week for short-acting agents or several weeks for long-acting
Serum glucose >200 Reschedule scan to control glucose
Insulin administration Wait at least 2 hours
Breastfeeding Discontinue feeding at least 6 hours
Box 11-2. Factors Affecting Fluorine-18 Fluorodeoxyglucose Uptake
INCREASED UPTAKEHigher tumor gradeLarge number of viable
cellsIncreased tumor blood
flowInflammationTumor hypoxiaRadiation (acute)Recent chemotherapyRecent surgery
DECREASED UPTAKEBenign lesion/scarNecrosisLow-cellularity or low-
grade tumor, mucinous tumors, bronchoalveolar carcinoma
HyperglycemiaHigh insulinChronic radiationPrior chemotherapyScarDecreased dose availabil-
ity: Infiltrated injection, muscle uptake
n addition, radiotracer distribution may be altered for arious reasons in clinical use. Activity is frequently seen n muscles that can sometimes pose interpretative prob-ems. The muscles of the oropharynx show variable ctivity, and patients should avoid speaking after injec-ion to decrease artifact. The skeletal muscles may show rominent uptake resulting from recent exertion and ension. Insulin administered to patients with diabetes r increased endogenous insulin occurring after eating lso may cause intense levels of muscle activity, neces-itating a repeat examination (Fig. 11-4). In vocal cord aralysis, unilateral uptake may occur in the normal vocal ord in a patient with contralateral vocal cord paralysis Fig. 11-5).
One interesting and common variant is supraclavicular -18 FDG accumulation in brown fat (Fig. 11-6). This ctivity was originally thought to occur in the muscles of he neck, but fused PET/CT images showed the uptake ctually localized to areas of fat on the CT scan. This vari-nt occurs more commonly in cold weather and in young, hin patients, relating to adrenergic stimulation of the
igure 11-5. Paralyzed vocal cord artifact on PET. Axial CT, PET, and used PET/CT images reveal unilateral uptake localizing to the right ocal cord. On physical examination, the left vocal cord was found to be aralyzed from left recurrent laryngeal nerve damage in this patient with ft lung cancer and prior radiation therapy. This uptake could be con-
used with a lymph node metastasis or a laryngeal head and neck carci-oma on PET if CT correlation is not used.

OncOlOgy: POsiTrOn emissiOn TOmOgraPhy 233
A
B C
Figure 11-6. Brown fat uptake versus adenopathy. A, Maximum intensity projection image demonstrates marked supraclavicular and costophrenic region activity and more mild activity in the suprarenal fat, as can be seen in severe cases of brown fat uptake. On axial images (B), activity clearly local-izes to fat, unlike in lymphoma (C), in which activity in the same region is within abnormal lymph nodes.

234 Nuclear Medicine: The Requisites
cells that may have originated as a primitive, nonshivering warming mechanism. Brown fat contains adrenergic receptors that contribute to uptake in anxious patients. Although the pattern is simple to recognize, it may decrease sensitivity for tumor detection in the region. Variable degrees of improvement have been obtained with sedation such as valium and with adrenergic block-ing agents in anxious patients or those with a previously abnormal scan. Warming patients for 30 to 60 minutes
before injection and keeping them warm is often effective in diminishing this uptake.
Focal F-18 FDG accumulation may localize to vessels, particularly in the aortic arch. This may be associated with calcifications from atherosclerotic disease. In general, this activity is nonspecific, although intense uptake could indi-cate arteritis.
A lack of significant thyroid activity is normal; however, the thyroid gland may show multiple uptake patterns (Fig. 11-7).
A
B
C
Figure 11-7. Patterns of thyroid uptake. Diffuse thyroid uptake suggests a benign process, as in a patient with Hashimoto thyroiditis (A) or multi-nodular goiter (B). However, focal uptake requires follow-up with ultrasound and probable biopsy because of a significant risk for a thyroid malignancy, as in the thyroid nodule in C. A benign adenoma in this patient could have a PET appearance similar to that of a malignant nodule.

Diffusely increased uptake may be seen in thyroiditis, goi-ter, and Graves disease. The significance of low-level dif-fuse activity in patients without identifiable thyroid disease is uncertain; it may be normal or the result of subclinical thyroiditis. Focal uptake can be seen in benign nodules. However, focal activity can be the result of malignancy in up to 50% of cases and evaluation is warranted.
Benign adenomas and tumors outside the thyroid gland may also accumulate F-18 FDG. This includes adenomas in the colon, the parotid gland, and benign ovarian tumors.
Effects of Inflammation and TherapyF-18 FDG uptake is not specific for tumor. Increased activity can be seen in inflammation and infection, with the cause attributed to glycolytic activity in leukocytes. Infections such as pneumonia will have intense radio-tracer accumulation. Inflammatory uptake in a lymph node or mass cannot be differentiated from malignancy. Such uptake may be problematic in sarcoidosis and granu-lomatous disease in the chest (e.g., histoplasmosis and tuberculosis). Other inflammatory processes in the lungs,
OncOlOgy: POsiTrOn emissiOn TOmOgraPhy 235
such as occupational lung diseases and active interstitial fibrosis and pneumonitis, may also cause markedly abnor-mal uptake (Fig. 11-8).
Increased activity around a joint in the soft tissues or joint capsule may be confused with a metastatic lesion. This pattern is most common in the hip and shoulder. Fused PET/CT images can help localize the uptake. Activity involving the joint surface or both sides of the joint may be present with degenerative disease. Acute and healing fractures normally accumulate F-18 FDG (Fig. 11-9). Correlation with the CT can usually help differenti-ate this from a metastatic lesion, because the fracture will be seen radiographically.
Therapy often causes an inflammatory response with resulting increased activity (Figs. 11-10 and 11-11). No definitive rules indicate how long to wait after therapy to perform a PET scan. At times, repeat or even serial imag-ing may be needed to confirm that increased activity is iat-rogenic. Radiation therapy causes intense F-18 FDG uptake acutely. Because this uptake may vary as the inflammatory response evolves, delaying the PET scan for
A B
Figure 11-8. Inflammation on F-18 FDG PET. A, Marked changes from occupational lung disease on CT (top) show significant radiotracer uptake (bottom). B, A different patient with bulky adenopathy from sarcoid (top) has high levels of uptake (bottom), similar to lymphoma.
A B
Figure 11-9. F-18 FDG uptake in fracture. A, CT shows a left rib fracture (arrow) after biopsy of lung cancer. B, PET shows uptake in the fracture and the left suprahilar mass, which is not well seen on the single noncontrast CT slice.

236 Nuclear Medicine: The Requisites
A B
Figure 11-11. Positive PET scan caused by pleurodesis. Maximum intensity projection (A) images and PET/CT images (B) show thickened left pleura on the CT (top) and intense FDG uptake on attenuation corrected images (bottom left). This uptake may be difficult to differentiate from tumor and can persist indefinitely. Note the typical differences on the non–attenuation-corrected image (bottom right) where the lungs appear “hotter,” as does the skin.
Figure 11-10. FDG posttherapy uptake. CT and PET images show radiation changes in the posterior medial left lung 3 months after external beam radiation therapy. The uptake may decrease slightly on follow-up scans, but marked uptake typically persists in the lungs.
2 to 3 months is recommended. However, radiation effects may persist indefinitely in the lungs. Chemotherapy may cause a lesion to show a transient apparent worsening. A delay in scanning of at least 2 weeks is recommended, but in some cases several weeks or until just before beginning the next chemotherapy cycle is optimal. However, increas-ing data indicate that imaging early after therapy can bet-ter predict therapeutic response in some tumors, such as lymphoma. The postoperative inflammatory response in the wound healing process results in F-18 FDG uptake that is usually mild to moderate (Fig. 11-12), and a delay of at least 2 to 4 weeks to minimize the effects of inflamma-tion on uptake is recommended.
Bone marrow evaluation may be limited by the effects of therapy. When marrow-stimulating drugs (filgrastim [Neupo-gen] or epoetin alfa [Procrit]) are used in patients with anemia or undergoing chemotherapy, a diffuse increase in radiotracer
uptake may result. Usually this pattern is easily differentiated from that of metastatic disease (Fig. 11-13). However, increased marrow background can mask actual lesions from tumor involvement. If possible, scans should be delayed until the effects of marrow-stimulating therapy has resolved. In short-acting agents, this typically takes 5 to 7 days but it is prolonged with newer, long-acting drugs.
Low-level activity with a characteristic shield shape in the anterior mediastinum may be seen in the thymus in young patients (Fig. 11-14). In cases in which activity appears after therapy, careful correlation with the CT can help determine whether normal-appearing thymic tissue is present in the anterior mediastinum. Increased uptake after therapy is known as thymic rebound and can be seen as an increase in size on CT as well. It may be difficult to dif-ferentiate from tumor involvement even on follow-up examinations.

A B
Figure 11-13. Patterns of bone marrow FDG uptake. A, Diffuse uptake in the marrow is frequently seen in patients with cancer after colony-stimulating factor therapy. B, Osseous metastases usually present with heterogeneous focal lesions.
B
A
Figure 11-12. Postoperative change. A, Two months after laparotomy, the CT shows secondary changes in the midline anterior abdominal wall and stranding of the left lower quadrant peritoneal fat. The corresponding PET image has mild anterior soft tissue uptake and nor-mal uptake in bowel and marrow. B, More intense uptake can be seen in the sagittal image done 6 days after surgery.

238 Nuclear Medicine: The Requisites
A B
Figure 11-14. Benign FDG uptake in the thymus. Area of uptake above the heart (arrow) in the typical configuration of the thymus (A) corresponds to a normal thymus (B) on CT. After chemotherapy, this uptake may be even more intense, the so-called thymic rebound.
A
B
Figure 11-15. Metal artifact. Axial (A) and coronal (B) CT and PET images show beam hardening artifact on the CT (left) from bilateral hip prosthe-ses. The attenuation corrected PET images (middle) show artifactually increased uptake along the lateral margins of the prostheses, which is significantly decreased on non–attenuation-corrected images (right).
ArtifactsWhen metal or dense-iodinated contrast is present, the attenuation-correction images may mistakenly show increased radiotracer activity around the area (Fig. 11-15). Examining the non–attenuation-corrected images, which
will show no increased activity, can lead to the correct interpretation. Correlation with a current CT will help identify sources of such artifact.
Areas of intense F-18 FDG activity, such as in the bladder and infiltration at the injection site, can cause a

OncOlOgy: POsiTrOn emissiOn TOmOgraPhy 239
B
C
AA
Figure 11-16. Respiratory motion artifact. Coronal (A) and axial (B) CT scans in lung windows and corresponding PET scans show intense FDG activity in liver metastases and the right lung base. However, no lung mass is seen on CT. C, Two axial enhanced CT images show liver metastases. Differences in respiration have caused misregistration and a posterior liver lesion projects over the lung on PET.
reconstruction artifact manifested by a band of artifactu-ally decreased activity across the patient. This was more common with older systems that relied on filtered back-projection and is less of a problem with iterative recon-struction. The non–attenuation-corrected images show less effect.
Hybrid PET/CT systems can generate certain artifacts. A common artifact is caused by misregistration of PET and CT caused by respiration. A CT acquired with breath holding
will greatly alter the position of organs compared with the PET scan, which must be done in quiet respiration. If the CT is done in quiet respiration, structures more closely match the PET images, but motion and low lung volumes may obscure lesions. Respiratory motion artifact also can cause abnormal uptake from a lesion to appear in an incorrect location on the CT, particularly for pathology near the dia-phragm. This most frequent involves a liver lesion projecting over the lung or rib on the CT (Fig. 11-16). If the patient is

240 Nuclear Medicine: The Requisites
large or imaged with arms at the sides, truncation artifact may lead to thin linear bands of activity running the length of the patient on the MIP image. CT beam-hardening artifact is a common problem that affects the quality of CT and fused PET/CT images (Fig. 11-17). This can be minimized by moving the arms out of the field of view. Another common, subtle artifact is a thin horizontal band or seam perpendicular to the patient’s axis from motion at adjoining bed positions.
Patterns of Malignancy
Aggressive tumors usually have greater uptake because of higher levels of metabolic activity. This pattern must be differentiated from the intense activity often seen in
A B
Figure 11-17. Effects of arm position and beam hardening on CT images. Soft tissue window CT image with the patient’s arms up (A) compared with arms down (B) demonstrates the effect of beam harden-ing with artifact throughout the abdomen on B.
infection or after radiation therapy. Low-level activity may be seen in low-grade tumors and tumors with a lower rela-tive numbers of cells such as bronchoalveolar carcinoma and mucinous adenocarcinoma. Malignant pleural effu-sions most often have low-level F-18 FDG activity, and some are even negative, which may be due to the disper-sion of tumor cells in the fluid so uptake is not detected.
Areas of tumor necrosis will have diminished F-18 FDG accumulation. This is often seen as absent activity cen-trally in very large masses. By determining areas of necro-sis and intense activity, PET scans can help direct biopsy for more sensitive accurate sampling. It may not be possi-ble to differentiate a cavitary infectious process from a necrotic tumor on PET, because both will have a cold cen-ter and a peripheral rim of increased activity (Fig. 11-18).
Levels of background activity play a role in the detec-tion of malignant lesions. For example, the high back-ground activity of the brain limits sensitivity for metastatic disease, with perhaps only a third of lesions being visual-ized. Also, if background uptake is heterogeneous, as may happen in the liver, it can make lesion detection more dif-ficult. It is helpful to describe or grade the severity of abnormal activity in terms of lesion-to-background differ-ential. For example, lymph node activity in the hila and mediastinum are compared to the background mediastinal activity. The uptake can be graded as mild, moderate, or severe, depending on the level above normal adjacent tissue.
Lesion activity can be quantified with a lesion-to- background ratio, lesion-to-liver ratio, or standard uptake value (SUV). Quantification can help confirm the visual impression and help follow abnormalities.
Quantitation with the Standard Uptake Value
The SUV is a measure of the relative uptake in a region of interest. This calculation depends on a precise knowledge of the injected dose quantity and time. Therefore the dose calibrator quality control must be maintained and dose infiltration must be avoided during injection. Software will automatically time-decay the amount of dose given minus the postinjection residual in the syringe.
SUV =Tissue activity (millicurie/milliliter)
Injected dose (millicurie)/weight (grams)
Figure 11-18. Central tumor necrosis on PET. A left upper lung carcinoma seen as a solid mass on CT actually contains significant central necrosis that is revealed as absent uptake on PET. Visualization of regional differences in tumor metabolic activity with PET can help direct a biopsy.

F-18 FDG distribution is very low in fat, which leads to higher values in tumor and normal tissues in heavier patients than in thin patients. Correction applied for body mass or body surface area can eliminate this problem (SUVlean or SUVbsa).
In general, an SUV greater than 2.5 is considered suspi-cious for malignancy. Most tumors have an even higher SUV. However, considerable overlap occurs with inflam-matory processes. Numerous factors affect SUV levels (Table 11-6). For example, when comparing serial exami-nations, image acquisition at different times after injection may alter SUV values. Thus, to minimize variability in SUV, imaging should be done after the same time delay in patients undergoing serial examinations. Generally, this delay is 50 to 65 minutes after injection for patients with cancer. Some studies have shown improved detection of malignancy by dual-point acquisition with further delayed imaging at 90 to 120 minutes after injection. Lesion size is also an important consideration. Volume averaging can arti-factually lower SUV values because regions of interest may include pixels from normal surrounding tissue in small tumors or from motion. In the past, SUVs were measured with a two-dimensional area, but software on current work-stations allows assessment of three-dimensional regions, which is often superior. However, the region of interest must be selected with care to include only structures of interest.
Activity in a lesion often is reported in terms of the SUVmax, or the value of the most intense pixel in the region of interest. This allows exclusion of low counts from areas of necrosis or adjacent normal structures. An SUVmean is an average of all counts in the region of interest, which may be more representative because a spurious single hot area will not cause incorrect data to be recorded. Many experts advocate using an SUVpeak, which is calculated as an aver-age of the counts from a circular volume (often 1 cm) sur-rounding the hottest pixel. The SUVpeak may more accurately represent maximal tumor metabolism with a higher degree of statistical significance than the SUVmax.
When evaluating a response to therapy on serial scans or when comparing data from multiple sites participating in a trial, SUV accuracy is critical. All parameters that could alter the SUV must be controlled. However, variability still occurs and most consider that the SUV must change at least 20% to be significant. Reports describe greater diffi-culties when considering a multicenter trial. Because of difficulties maintaining protocol compliance and other
Table 11-6 Factors Affecting Standard Uptake Value Levels
Factor Change in SUV
↑ Serum glucose ↓
↑ Body mass ↑
↓ Dose delivery: Extravasated dose ↓
↑ Uptake period ↑
↓ Region-of-interest size ↑
↓ Pixel size ↑
SUV, Standard uptake value.
OncOlOgy: POsiTrOn emissiOn TOmOgraPhy 241
issues, a 34% change was required before it could be con-sidered significant.
CLINICAL USES OF POSITRON EMISSION TOMOGRAPHY IN ONCOLOGY
The use of PET scanning in primary tumors of the brain is discussed in Chapter 15. Evaluation of lung cancer in soli-tary pulmonary nodules was the first clinical indication for F-18 FDG PET scanning in the United States approved by the Centers for Medicare and Medicaid (CMS). Since that time, the number of approved applications for PET has increased. Although the list continually changes, indi-cations for F-18 FDG PET approved by the CMS are listed in Table 11-1. Private insurers may cover other indi-cations. Box 11-3 lists tumors that show a low degree of F-18 FDG uptake, causing a lower sensitivity.
Lymphoma
Malignant lymphoma is classified as either Hodgkin dis-ease (15%) or the more common non-Hodgkin lym-phoma (85%). For Hodgkin disease, 10-year survival rates are 80% to 85% for the early stages and approxi-mately 40% for very advanced (stage IV) disease. Sur-vival rates are much lower for non-Hodgkin lymphoma, with a 60% 5-year survival for the potentially curable tumors, which are the high-grade, more aggressive forms of the disease.
Hodgkin disease tends to spread in an orderly fashion in contiguous lymph node chains. Staging of Hodgkin dis-ease is important in treatment planning and assessing prognosis, but surgical staging has largely been replaced by imaging (Box 11-4). Prognosis is good for stage I and stage II disease, which can be treated with local radiation ther-apy. More advanced disease requires the addition of chemotherapy.
Non-Hodgkin lymphoma is often widespread at the time of diagnosis and is more frequently fatal. Prognosis is closely related to histopathological classification and tumor grade. High-grade and intermediate-grade tumors are treated with chemotherapy and radiation therapy with the goal of a cure. Patients with low-grade tumors typically
Box 11-3. Tumors with Frequently Lower Fluorine-18 Fluorodeoxyglucose Uptake
Prostate cancerRenal cell carcinomaBronchoalveolar cell lung cancerMucinous adenocarcinomasCarcinoidLow-grade sarcomasLow-grade lymphoma
Mucosa-associated lymphoma (MALT)Small cell lymphocytic non-Hodgkin lymphoma
Differentiated thyroid cancer (iodine-avid)Hepatocellular carcinomaMetastasis to brain
242 Nuclear Medicine: The Requisites
have an indolent course initially. Although therapy mayprolong survival, low-grade tumors relapse and eventuallytransform to aggressive and fatal tumors.
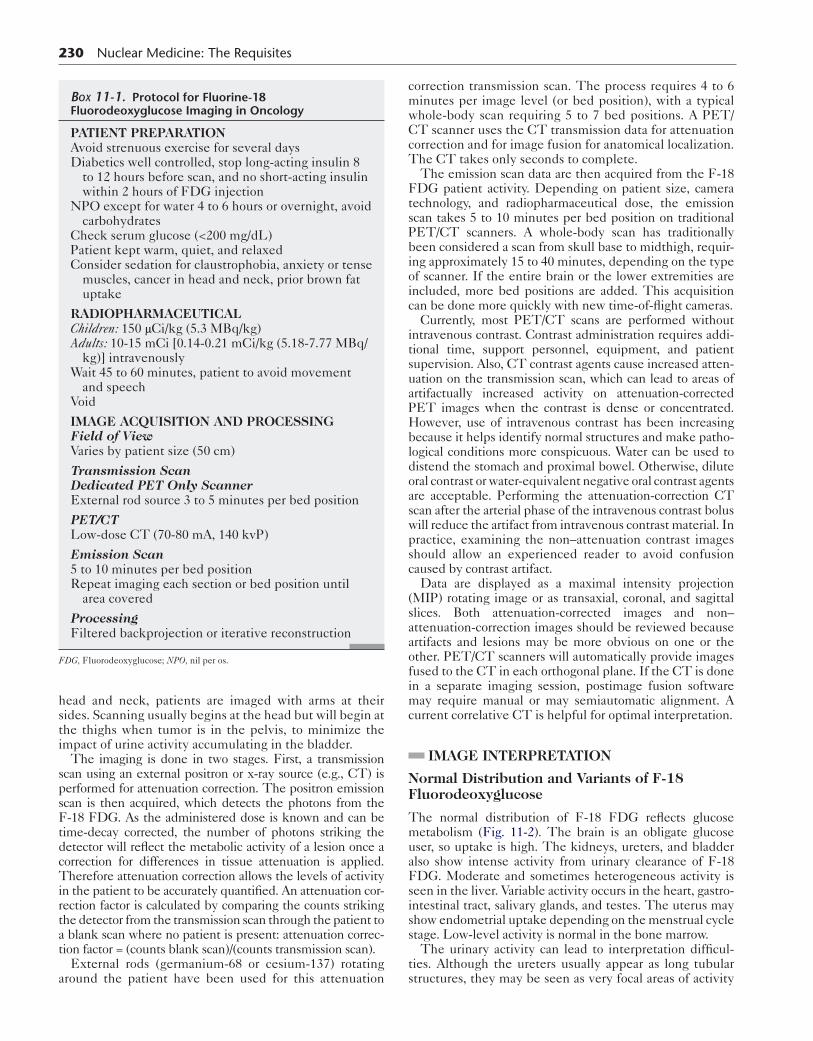
ImagingDevelopments in imaging and therapy have led to signifi-cant improvements in the treatment of lymphoma. Gal-lium-67 was once widely used in the evaluation oflymphoma but was essentially replaced by CT in the 1990sand cannot compete with F-18 FDG PET/CT (Fig. 11-19).Although CT is often still a critical component of diagnosisand staging, F-18 FDG PET/CT alone is increasinglyused to monitor lymphoma.
DetectionF-18 FDG PET is highly sensitive in the detection ofHodgkin disease and high-grade non-Hodgkin lymphomaand usually shows high levels of uptake. Some low-gradefollicular non-Hodgkin lymphoma cases are also accuratelyevaluated. Other low-grade non-Hodgkin lymphomatumors such as small cell lymphocytic lymphoma andmucosa-associated lymphoma tissue (MALT) have muchless uptake and are not visualized reliably with F-18 FDGPET. Diagnosis of lymphoma generally relies on histo-pathological characterization of tissue samples, and PEThas not played a significant role in lymphoma diagnosis.PET might be useful in directing biopsy to the most acces-sible site.
Staging, Monitoring Therapy, and RestagingPET consistently has been found superior to CT in assess-ment of lymphoma. The accuracy of PET is 96% comparedto 56% with CT, with a sensitivity greater than 91%, or 10%more sensitive than CT. The disease stage may be alteredbased on PET in 10% to 40% of cases. F-18 FDG PET ismore accurate in assessing extranodal disease, includingsoft tissue lesions, bone marrow, and spleen (Fig. 11-20).Focal lesions are generally caused by tumor, whereas dif-fuse uptake may be the result of therapy. Although bonemarrow biopsy is the gold standard, it can miss disease. Acombination of PET and biopsy may provide the mostaccurate evaluation of marrow.
FDG PET can accurately evaluate the effectiveness oftherapy. Decreased uptake is seen in patients responding totherapy (Fig. 11-21). This can be evaluated after as little asone cycle of chemotherapy or less. Responders identified
Box 11-4. Ann Arbor Classification of Lymphoma
I Single lymph node or lymphoid structureIE I+: Growth into adjacent tissue or
extralymphatic involvement (not liver)II Involving ≥2 regions on the same side of
the diaphragmIIE II+: Extralymphatic involvementIII Disease on both sides of the diaphragm
(IIIS: Splenic involvement)IIIE III+: Involvement extranodal tissue
localizedIV Nonlocalized or disseminated disease
by PET have longer disease-free remission periods or are cured, whereas nonresponders and patients with residual disease relapse or progress. Clinicians may want to alter therapy early on based on a lack of response seen on F-18 FDG PET.
PET can assess for tumor viability in a residual mass found on CT after therapy. PET is much more specific than CT (86% vs. 31%) in these cases (Fig. 11-22). PET is often used in the restaging of disease as information com-plements that were gained by CT scanning.
Multiple Myeloma
Several diseases are included in the spectrum of plasma cell neoplasms, ranging from benign to highly aggressive tumors. These diseases originate from a single B cell and secrete monoclonal proteins. Multiple myeloma accounts for 24,000 deaths per year worldwide, with an incidence of 4 per 100,000. It may be detected during routine blood testing or may present with a variety of musculoskeletal, hematological, immunological, or neurological complaints. Patient workup consists of evaluation of immunoglobulin levels, 24-hour urine protein evaluation, serum and urine electrophoresis, whole-body skeletal survey, and bone marrow aspiration. Radiographic findings may begin with osteoporosis, but eventually numerous lytic lesions are seen. Bone scans are relatively insensitive.
Limited data suggest that F-18 FDG PET/CT may add information to that seen on MRI, CT, or radiographs. It detects bone involvement in 25% of newly diagnosed patients with negative skeletal surveys and extramedullary involvement in up to 25%. PET/CT scans are often nega-tive in patients in remission or in patients with monoclonal gammopathy not related to malignant myeloma. PET/CT is also superior to skeletal surveys in the detection of active disseminated bone disease.
B
Gallium-67F-18 FDG PET
A
Figure 11-19. Improved sensitivity of FDG PET over Ga-67. PET shows a large right neck mass and involvement in the left neck, spleen, and abdo-men from lymphoma (A) whereas a 10-mCi Ga-67 scan at 96 hours has inferior image quality and fails to detect lesion outside of the right neck (B).

A B
Figure 11-20. Restaging lymphoma. A, The initial PET image in a patient with non- Hodgkin lymphoma shows extensive abdominal ade-nopathy and involvement of the spleen, chest, and supraclavicular nodes. B, After two cycles of chemotherapy, much of the adenopathy has resolved in the abdomen, but worsening disease is seen in spleen, bone marrow, and mediastinum, requiring a change in therapy protocol.
OncOlOgy: POsiTrOn emissiOn TOmOgraPhy 243
Melanoma
The incidence of malignant melanoma is increasing dra-matically. Survival depends on the stage at the time of diag-nosis. The thickness of the primary lesion is the most important prognostic factor, and this is graded according to the Breslow classification. Prognosis is extremely poor, with nodal or distant metastases. Even after potentially curative surgery is performed, patients frequently present with met-astatic disease because of early hematogenous spread. Some patients would benefit from further surgery or directed therapy if their disease were accurately restaged. Diagnosis of these metastases is difficult by conventional modalities alone, such as CT. Metastatic disease may occur in unusual locations, such as other cutaneous and subcuta-neous sites, spleen, distant nodes, liver, and gallbladder. Metastases are frequently found in high-risk patients (i.e., >4-mm Breslow depth) on PET, sometimes widespread or distant from the primary tumor location (Fig. 11-23). Thus many sites perform head-to-toe imaging on patients with melanoma. Lesions that are not detected are likely micro-scopic. Although PET is generally more sensitive than con-ventional imaging methods, CT is more sensitive than PET in detecting small parenchymal lung lesions and MRI best identifies brain metastases. The sensitivity of PET is reported to be greater than 90%, with a specificity of 87%. PET alters therapy in approximately 25% of patients and is useful in staging disease in patients at high risk for metasta-ses or who relapse.
A
B
Figure 11-21. Monitoring therapy of lymphoma. A, PET/CT images show intense uptake in a gastric lymphoma and an adjacent lymph node. Gastric involvement may not be detected, but, when present, PET may be useful for follow-up. B, After one cycle of chemotherapy, no tumor could be identi-fied. This suggests a better prognosis than for a late responder or nonresponder.

244 Nuclear Medicine: The Requisites
PET does not replace sentinel lymph node scintigra-phy in intermediate-risk (>1.4-mm Breslow depth) or high-risk patients diagnosed with melanoma. Lympho-scintigraphy involves Tc-99m sulfur colloid injection around the primary lesion to identify the first draining
FsN
Fnidm
sentinel lymph node. Evaluating the resected sentinel lymph node with histochemical staining is the most sensi-tive method to determine patients at risk for metastatic disease. This allows detection of microscopic disease not detected with PET.
A
B
igure 11-22. Evaluation of a residual mass. A, During chemotherapy for lymphoma, a large partially enhancing anterior mediastinal mass on CT howed persistently abnormal FDG accumulation in one region of the mass. B, When the follow-up CT showed residual mass, a repeat PET was done. o FDG uptake was seen consistent with fibrosis and scar.
A B
igure 11-23. FDG PET in melanoma. A, Diffuse tumor involvement including uptake near the primary tumor in the left thigh, multiple lymph odes, organs, and soft tissue metastases from melanoma. This result led to changing planned radiation therapy to systemic chemotherapy. PET can also entify subtle disease not found on CT. B, Regional metastases are seen in numerous right cervical lymph nodes in a patient with a recently resected elanoma of the right ear.

Head and Neck Carcinoma
The prognosis of head and neck cancer depends on the dis-ease stage. As distant metastases at initial diagnosis occur only 5% of the time, assessing local cervical lymph node status is most critical in determining whether a patient is a candidate for surgical resection. At diagnosis, roughly 40% of patients have localized disease and 60% have advanced cases (Figs. 11-24 and 11-25). F-18 FDG PET has been
OncOlOgy: POsiTrOn emissiOn TOmOgraPhy 245
found useful in staging, monitoring therapy response, and detecting recurrence of head and neck cancers (Table 11-7). PET reportedly changes patient management in 20% to 30% of patients with head and neck cancer.
Although FDG PET is sensitive, it plays a limited role in the diagnosis of head and neck cancer. Conventional modalities adequately visualize most tumors and are gen-erally better able to assess tumor size. However, head and neck cancer often presents with palpable adenopathy.
Figure 11-24. Recurrent squamous cell carcinoma of the head and neck. Coronal and sagittal PET images dem-onstrate tumor activity in enlarged pal-pable left cervical lymph nodes and in the primary tumor posteriorly along the oropharynx extending up to the skull base.
Figure 11-25. Head and neck carcinoma staging. PET images reveal several abnormal lymph nodes in the right cervical and supraclavicular region and an unexpected mediastinal metastasis to a normal-size lower paratracheal node (arrows).

246 Nuclear Medicine: The Requisites
These lymph node metastases may be much larger than the primary tumor in head and neck cancer. In 5% to 10% of cases, the primary cannot be identified by endos-copy, CT, or MRI, which means that a patient might have to undergo large-field radiation therapy. Although small primary tumors may not be detected, PET can identify the unknown primary tumor in 20% to 50% of patients.
In staging of head and neck cancer, F-18 FDG PET/CT appears superior to CT and MRI. When lymph nodes are normal in size, this is particularly helpful. For restag-ing, PET consistently has been found superior to conven-tional imaging modalities. When the anatomy is distorted from surgery and radiation, restaging and detection of recurrent tumor by PET is better than by CT. The reported sensitivity of F-18 FDG for recurrence ranges from 79% to 96%, with a negative predictive value greater than 90%. CT, on the other hand, has a sensitivity of 54% to 61%.
PET/CT is particularly useful in evaluating the postop-erative neck (Fig. 11-26). With a loss of symmetry, evalua-tion for recurrence is difficult; fusion images allow better identification of increased uptake in normal structures, such as discriminating muscles, from sites of tumor
Table 11-7 Fluorine-18 Fluorodeoxyglucose Imaging in Head and Neck Carcinoma
Indication Utility of FDG PET
Surveillance Very useful
Restaging recurrence Very useful, especially postoperative neck, but limited by radiation change
Response to therapy May be useful
Diagnosis in unknown primary Useful; positive only 20%-50%
Staging
Clinical N1-N3 neck Useful, detect distant metastasis
Clinical N0 neck Low yield
FDG, Fluorodeoxyglucose; PET, positron emission tomography.
recurrence or metastases. Recent studies suggest that additional imaging after a further delay of an hour or so may increase specificity. Use of F-18 FDG PET for moni-toring therapy provides superior results over CT or MRI, but can be complicated by normal tissue response to ther-apy. The ability of PET to predict survival is promising, but additional work is needed.
Consistent terms must be used to describe the location of head and neck cancer. Different methods of describing the location of cervical lymph nodes have been used over the years. Currently, an imaging-based method of lymph node classification proposed by Som and colleagues opti-mizes recent updates by the American Joint Committee on Cancer (Table 11-8; Figs. 11-27 and 11-28).
Thyroid Carcinoma
Thyroid cancer must be considered separately from other cancers occurring in the head and neck. In most cases, thy-roid cancer derives from the follicular cells of the gland, giv-ing rise to papillary, follicular, or mixed cellularity variants. These differentiated tumors accumulate iodine-131 (I-131) and are best evaluated and treated with radioactive iodine. The sensitivity of F-18 FDG in these patients is low.
The clinical utility of F-18 FDG PET scanning is lim-ited to thyroid malignancies that do not accumulate I-131—that is, poorly differentiated, aggressive tumors. This may occur in metastatic and recurrent tumors that transform from a previously well-differentiated, iodine-avid tumor. In cases in which the I-131 scan is negative but serum thyroglobulin levels remain elevated, the sensitiv-ity of PET is greater than 90%. PET may help direct surgi-cal resection or external beam radiation therapy. Unlike I-131 scanning, patients do not need to undergo thyroid hormone replacement therapy withdrawal or stimulation with recombinant thyroid-stimulating hormone. PET also may be of some benefit in the more aggressive Hürthle cell variant of follicular carcinoma and in some anaplastic tumors.
F-18 FDG PET scanning may be useful in medullary thyroid carcinoma. This tumor arises from the parafollicu-lar cells of the thyroid and does not accumulate I-131. The
Figure 11-26. Recurrent or residual head and neck cancer is often difficult to diagnose by CT or MRI because of loss of symmetry and distorted anatomy from surgery and radiation. PET/CT makes detection easier as in the right-sided lymph node in this patient with prior radical neck dissection.

OncOlOgy: POsiTrOn emissiOn TOmOgraPhy 247
Table 11-8 Comparison of Nodal Classification Systems for Head and Neck Cancer
Rouviere system AJCC system Imaging-based system
Submental I IA: Medial to medial edge anterior belly digastrics
Below mylohyoid muscle, above hyoid bone
Submandibular I IB: Lateral to IA and anterior to back of submandibular gland
Internal jugular II: Skull base to hyoid, anterior to back edge sternocleidomastoid
II: Skull base to bottom of hyoid, anterior to back edge sternocleidomastoid
IIA: Anterior, lateral, or inseparable from internal jugular vein
IIB: Posterior to internal jugular vein with fat plane between
Retropharyngeal III: Hyoid to cricothyroid membrane, anterior to back edge sternocleidomastoid
III: Bottom of hyoid to bottom of cricoid arch, anterior to back edge sternocleidomastoid
Lateral to carotid, level VI nodes medial to carotids
Midjugular IV: Cricothyroid membrane to clavicle, anterior to back edge of sternocleidomastoid
IV: Bottom of cricoid arch to top of manubrium, anterior to back edge sternocleidomastoid
Lateral to carotids, level VI nodes medial to carotids
Spinal accessory V: Posterior to sternocleidomastoid, anterior to trapezius, above clavicle
V: Posterior to sternocleidomastoid, anterior to trapezius, above clavicle
VA: Skull base to bottom of cricoid arch
VB: Bottom cricoid arch to level clavicle
Anterior compartment
VI: Below hyoid, above suprasternal notch, between carotid sheaths
VI: Below bottom of hyoid, above top of manubrium, medial to carotid arteries
Visceral nodes
Upper mediastinal VII: Below suprasternal notch VII: Below top manubrium and above innominate
Overlaps highest mediastinal nodes of chest classification between carotids
Supraclavicular Clavicles in field of view, above and medial to ribs
All systems use facial, parotid, retropharyngeal, and occipital groups.AJCC, American Joint Committee on Cancer.
A B
C D
Figure 11-27. Transaxial diagram of cervical lymph node stations at (A) the level of the floor of the mouth and submandibular gland (S), (B) the hyoid bone (H), (C) the thyroid cartilage and cricoid cartilage, and (D) just above the clavicles (C) with a portion of the thyroid gland (Th) in view. Note the appearance of the sternocleidomastoid muscle (SC), which is a key landmark. A, arteries; Ant, anterior.

248 Nuclear Medicine: The Requisites
sensitivity of PET has been reported to be 78%, with a specificity of 79%.
F-18 FDG may accumulate with equal intensity in benign adenomas, thyroiditis, and malignant lesions. Although an incidentally detected F-18 FDG–avid nodule should be pursued to exclude malignancy, PET has no role in the diagnosis of thyroid cancer.
Lung Carcinoma
Lung carcinoma is the most common malignancy and has the highest cancer-related death rate. The histologi-cal classification of lung cancer is outlined in Box 11-5. Non–small cell lung carcinoma (NSCLC) accounts for roughly 80% of cases and small cell lung carcinoma (SCLC) accounts for the remaining 20%. Approximately 75% of SCLC cases are initially diagnosed with dissemi-nated disease. Therefore surgery is rarely indicated and chemotherapy and radiation therapy are used. NSCLC, on the other hand, is often resectable. Early diagnosis and proper staging are critical to therapeutic planning in NSCLC.
Presenting clinical and radiographic findings are vari-able in lung cancer. Patients may be asymptomatic or experience hemoptysis, cough, weight loss, and symp-toms of metastatic disease. Radiographic findings are also nonspecific. A mass with an irregular, spiculated border is malignant in up to 85% of cases, but lesions with smooth margins may be cancerous over a third of the time.
Submandibular gland
Digastric m.
Hyoid
Sternocleidomastoid m.
Figure 11-28. Cervical lymph node levels according to the imaging-based classification system described in Table 11-8. m, Muscle.
Workup for patients with these abnormal radiographs might include sputum cytology, bronchoscopy, transtho-racic needle biopsy, and mediastinoscopy. Each of these procedures has limitations. For example, although bron-choscopy has a sensitivity of 85% for central tumors, it is much lower for small and peripheral lesions. The false negative rate for transthoracic needle biopsy is approxi-mately 25%. Transthoracic needle biopsy also carries a 10% to 25% risk for pneumothorax requiring a chest tube. Patients may require thoracotomy and surgical biopsy for definitive diagnosis.
Diagnosis of Solitary Pulmonary NoduleA pulmonary nodule is defined as a well-circumscribed lesion measuring less than 4 cm. With the increased use of CT, the incidental detection of these nodules has risen tre-mendously; about half will prove to be malignant. The presence of central calcifications in some nodules indicates they are benign granulomas. However, most pulmonary nodules are indeterminate based on radiographic appear-ance. The conventional workup of an indeterminate nod-ule is biopsy or serial radiographic follow-up for 2 years. If the size of a nodule is stable over a 2-year period, the nod-ule is presumed benign. Suspicious-appearing nodules and those that seem to increase in size are sent for biopsy. This method results in biopsy of many benign lesions and delayed diagnosis of some malignant cases. F-18 FDG PET has proved to be an accurate method to differentiate benign from malignant nodules and decrease biopsy of benign lesions (Fig. 11-29, A).
Malignant nodules generally have increased F-18 FDG uptake with an SUV greater than 2.5, although in most
Box 11-5. World Health Organization Histological Classification of Lung Carcinoma
SMALL CELLPure small cell (oat cell)Mixed (small cell and large cell)Combined (small cell and squamous cell or
adenocarcinoma)
NON–SMALL CELLLarge CellUndifferentiated large cellGiant cellClear cell
Squamous Cell CarcinomaEpidermoidSpindle cell
AdenocarcinomaAcinarPapillaryBronchoalveolarSolid carcinoma with mucus production
Adenosquamous CarcinomaBronchial gland carcinomaAdenoid cystic carcinomaMucoepidermoid tumor
Carcinoid

OncOlOgy: POsiTrOn emissiOn TOmOgraPhy 249
AA
BB
Figure 11-29. Characterization of solitary pulmonary nodules. A, A left lung nodule on CT had no FDG uptake on PET, consistent with a benign process. This lesion remained stable on CT follow-up, confirming this impression. B, A small, well-circumscribed right lower-lobe nodule with increased FDG accumulation on PET was later found to be an adenocarcinoma.
Figure 11-30. Detection of distant disease with PET. A right-lung mass showed markedly increased FDG uptake consistent with tumor. Contralateral hilar lymph nodes were also abnormal, which meant this patient was not a candidate for surgical resection.
cancers the SUV is considerably higher (Fig. 11-29, B). The sensitivity of PET alone is reported to be 95% to 96% and the specificity 77% to 81%. PET/CT compares favorably with multidetector CT (MDCT) when categorizing a nod-ule as benign or malignant with a 96% versus 81% sensitiv-ity and a comparable specificity (88% PET/CT vs. 93% CT). PET has a high negative predictive value in evaluat-ing a solitary pulmonary node (SPN), reported to be greater than 97%. This high value means that biopsy usually can be avoided when the PET scan is normal. The incidence of malignancy in patients with a negative PET scan depends on the prevalence of disease; it may be as low as 1% for patients at low risk for cancer, but can be 10% in high-risk cases. Because a chance remains that malignancy is pres-ent, these patients are often followed with CT.
F-18 FDG PET scans can change the surgical approach for nodules demonstrating increased uptake. This includes
identification of mediastinal lymph nodes with abnormal uptake and distant metastases (Figs. 11-30 and 11-31). In these patients, plans for thoracotomy and surgical biopsy may be changed to mediastinoscopy.
However, F-18 FDG PET has some limitations. False negative results can be seen in lesions smaller than 1 cm. The resolution of PET is on the order of 7 to 8 mm, and volume averaging of small tumors with surrounding normal tissue may result in low or normal-appearing uptake. Motion occurring with tachypnea or in the more mobile lung bases may accentuate volume averaging. New respira-tory gating techniques may improve the accuracy of SUV measurements in lung nodules. False negative PET results can occur in certain tumors. In the lungs, the most common of these are bronchoalveolar cell carcinoma and carcinoid.
The positive predictive value of PET is not as high as the negative predictive value, and a positive result cannot be

250 Nuclear Medicine: The Requisites
assumed to represent malignancy. An inflammatory process such as granuloma commonly causes false positive findings. In some areas of the country where granulomatous disease is highly prevalent, this is a very significant problem.
A malignant solitary nodule is most commonly caused by primary bronchogenic carcinoma, although a single metastatic lesion is also a possibility. In some cases, a patient with known cancer develops new lung nodules. Even if the nodules are large enough to be characterized by PET, negative F-18 FDG uptake alone cannot rule out
metastases and follow-up is needed. Close examination of the PET scan and correlative CT are essential to detect any unexpected primary tumor outside of the lungs.
Staging Non–Small Cell Lung CancerStaging of NSCLC is critical in assessing prognoses and deciding the appropriate course of therapy. Lung cancer staging is based on the tumor-node-metastasis (TNM) classification (Box 11-6 and Table 11-9). Generally, in patients with stage I or II disease the tumors are
A
B C
Figure 11-31. PET improves lung cancer staging. A, The right upper lobe bilobed pulmonary nodule appears malignant on PET. B, Small lymph nodes (arrow) on CT would not be read as positive based on size criteria alone. C, However, PET revealed these small lower paratracheal lymph nodes to be abnormal. Biopsy confirmed malignancy in both regions.
Box 11-6. Tumor-Node-Metastasis Staging of Lung Carcinoma*
Data from Edge S, et al, eds. AJCC Cancer Staging Manual. 7th ed. New York: Springer; 2010.
PRIMARY TUMOR (T)Tx: Malignant cells; primary not seenT0: No evidence of primary tumorT1: ≤3 cm; surrounded lung or visceral pleura; not in
mainstem bronchusT1a: ≤2 cmT1b: >2 cm but ≤3 cm
T2: >3 cm but <7 cmT2a: >3 cm but ≤5 cmT2b: >5 cm but ≤7 cmOther descriptors: Involves mainstem bronchus >2
cm from carina, invades visceral pleuraAssociated atelectasis or obstructive pneumonia
extends to hilar region but does not involve whole lung
T3: >7 cmor <7 cm but with additional nodule same lobe or tumor invading chest wall, pericardium, mediastinal pleura, diaphragm<2 cm from carinaAtelectasis entire lung
T4: Tumor any size with a nodule in a different ipsilat-eral lobe or invading mediastinum, heart, trachea, major vessels, esophagus
REGIONAL LYMPH NODES (N)N0: No involvementN1: Nodes within lung, ipsilateral bronchopulmonary
or hilarN2: Ipsilateral mediastinal, prevascular, retrotracheal,
paratracheal and/or subcarinalN3: Contralateral mediastinal, contralateral hilar,
contralateral scalene, supraclavicular
METASTASIS (M)M0: No distant metastasisM1: Distant metastasis
M1a: Nodule contralateral lung, pleural nodules, malignant effusion
M1b: Distant metastasis such as brain or bone

considered resectable, although a subset of patients with stage III disease might benefit from surgery. Only approxi-mately 25% of patients have stage I or II disease at the time of diagnosis. Improved methods of staging are needed because up to 50% of patients with NSCLC who undergo surgery expected to be curative will suffer a recurrence.
CT and F-18 FDG PET often have complementary roles in the staging, restaging, and surveillance of NSCLC. CT better assesses tumor size, invasion of the pleura and medi-astinum, and distance of the tumor from the carina. Also, abnormalities such as atelectasis and aspiration pneumonia can cause abnormal F-18 FDG uptake that may be con-fused with that of the primary tumor are often clear on CT.
However, radiographic staging has limitations. For exam-ple, CT examination of the lymph nodes depends on size criteria to determine if tumor involvement is present. Any lymph node larger than 1 cm is considered abnormal and sus-picious for tumor involvement. Patients with normal-size lymph nodes are frequently understaged by CT. PET often detect abnormal uptake from tumor in normal-size lymph nodes. The sensitivity of PET for tumor involvement in any one lymph node is 75%, but it averages 91% for overall medi-astinal involvement. This compares well to reported sensi-tivities of CT at 63% to 76%. PET/CT can help direct biopsy away from locations typically sampled to focus on areas with the highest likelihood of yielding disease.
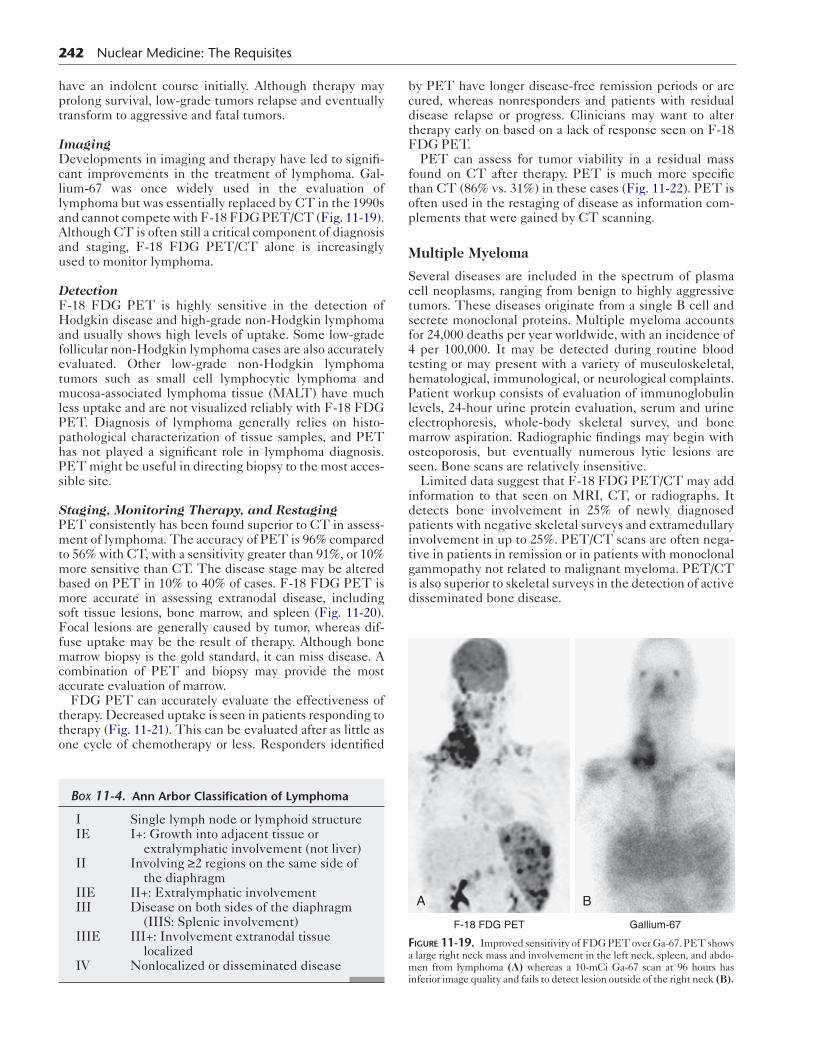
The results of PET can help direct the method of biopsy and aid in surgical planning. Patients with no mediastinal involvement or distant metastases can go to thoracotomy for curative resection at the time of biopsy. Whereas N1 disease may be curable, resection in N2 disease results in cure much less frequently. In some cases, biopsy access can be achieved through endobronchial ultrasound to differentiate N1 from N2 disease. Although more invasive, medianstinoscopy is still considered the gold standard and may be needed to fur-ther evaluate the mediastinum when PET is positive. It is important to describe lymph node involvement in uniform terms. The commonly used classification system is outlined in Table 11-10 and Figures 11-32 and 11-33.
Biopsy is required when PET is positive, because speci-ficity is lowered by uptake in inflammatory processes. How-ever, it should be noted that both CT and PET can have false positive results for the lymph nodes. Inflammatory con-ditions can cause enlarged lymph nodes on CT, with false positive interpretations occurring in up to 40% of patients.
Table 11-9 Staging of Lung Carcinoma Based on Tumor-Node-Metastasis Classification Scheme
Stage TNM
Ia Tl N0 M0
Ib T2 N0 M0
IIa Tla N1 M0, T1bN0M0, T2aN1M0
IIb T2bN0-1 M0
IIIa T3 N1 M0, T1-3 N2 M0, T4N0-1M0
IIIb T1-4 N3 M0, T4 N2 M0
IV Any T, any N, M1a or M1b
Based on the American Joint Committee on Cancer staging system, 1997.TNM, Tumor-node-metastasis.
OncOlOgy: POsiTrOn emissiOn TOmOgraPhy 251
Inflammatory processes and the effects of therapy also cause increased uptake of radiotracer. However, lymph nodes may remain enlarged after disease has resolved and PET has nor-malized. After therapy, PET provides information on response that CT often cannot. Patients who respond to therapy will show PET changes more quickly than on CT.
FDG PET is superior to conventional imaging modali-ties for the detection of distant metastases (Fig. 11-34). A whole-body PET scan may detect distant lesions not seen on a chest and abdomen CT examination. Unexpected metastases outside of the thorax have been reported in 6% to 20% of cases in the literature. This includes retroperito-neal and pelvic lymph nodes, soft tissue lesions, and small adrenal metastases. Assessment of the adrenal glands is important, because they are a frequent site of lung cancer metastasis. CT reveals adrenal lesions in approximately 20% of cases, but the majority are later proved to be benign adenomas. PET can help differentiate benign and malig-nant adrenal gland lesions with a high degree of accuracy based on the level of uptake. Bone involvement is detected
Table 11-10 Classification of Lymph Node Stations in the Chest
Station Designation
SUPERIOR MEDIASTINAL NODES
1 Highest mediastinal Above top of left brachiocephalic vein crossing trachea
2 Upper paratracheal Below station 1 to top of aortic arch
3 Prevascular Anterior to great vessels, cranial to superior aortic arch
Retrotracheal Behind trachea, thoracic inlet to bottom of azygous vein
4 Lower paratracheal Below top of aortic arch to superior right upper lobe bronchus
Azygous arch divides superior from inferior
AORTIC NODES
5 Subaortic or AP window Medial to first branch pulmonary artery, lateral ligamentum arteriosum
6 Paraaortic Anterior and lateral to aortic arch
INFERIOR MEDIASTINAL NODES
7 Subcarinal Below carina, adjacent to lower paraesophageal nodes
8 Paraesophageal Lateral to esophagus or anterior if below subcarinal nodes
9 Pulmonary ligament In pulmonary ligament posteriorly
N1 NODES: DISTAL TO MEDIASTINAL PLEURAL REFLECTION
10 Hilar Along mainstem bronchus/bronchus intermedius
11* Interlobar Between lobar bronchi and adjacent to lobar bronchi
12* Lobar Adjacent proximal lobar bronchi
13* Segmental Adjacent to lobar bronchi distally
14* Subsegmental Adjacent subsegmental bronchi
*IntrapulmonaryAP, Aortopulmonary
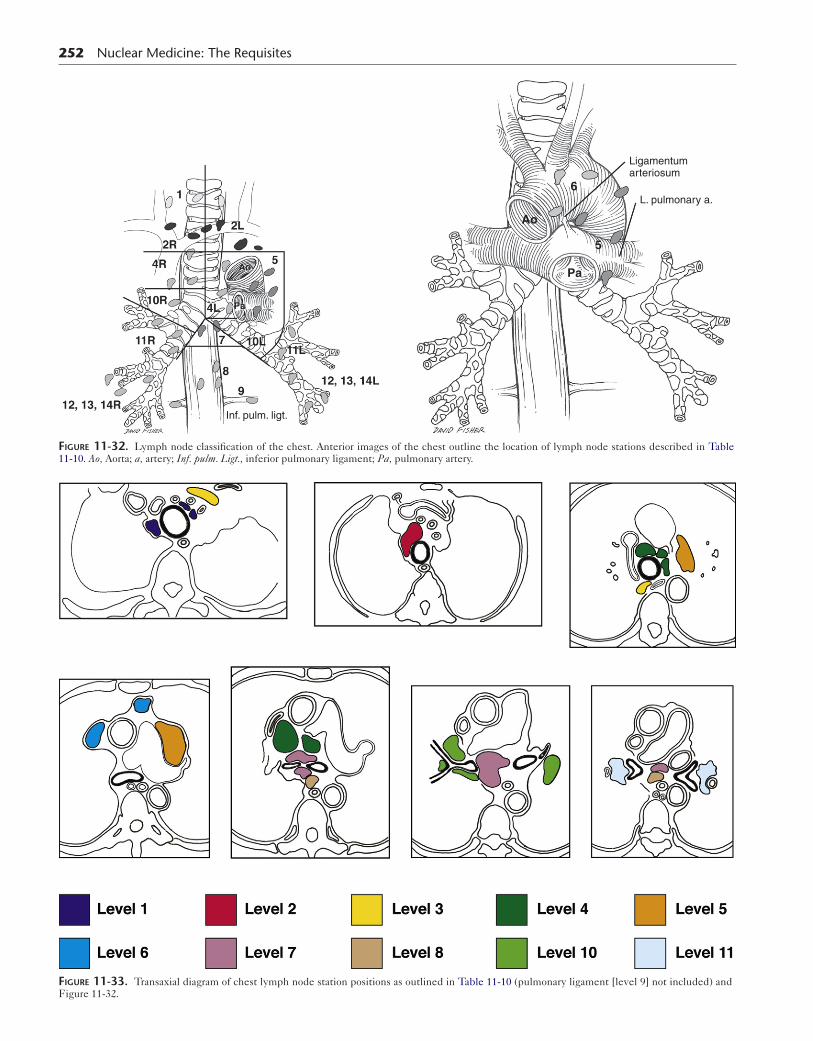
252 Nuclear Medicine: The Requisites
Inf. pulm. ligt.
Ligamentumarteriosum
L. pulmonary a.6
Ao
5
Pa
Figure 11-32. Lymph node classification of the chest. Anterior images of the chest outline the location of lymph node stations described in Table 11-10. Ao, Aorta; a, artery; Inf. pulm. Ligt., inferior pulmonary ligament; Pa, pulmonary artery.
Figure 11-33. Transaxial diagram of chest lymph node station positions as outlined in Table 11-10 (pulmonary ligament [level 9] not included) and Figure 11-32.

OncOlOgy: POsiTrOn emissiOn TOmOgraPhy 253
AA
C
DD
B2B2
B1
Figure 11-34. FDG PET/CT can be used to detect subtle and unexpected lesions such as these in a patient with recurrent lung cancer. A, Small right anterior pleural implant (note low-level activity in malignant right effusion). B1, Peripancreatic metastasis. B2 Left adrenal gland (unremarkable on CT), C, Normal-size pelvic node lateral to the ureter and (D) left thigh. Soft tissue metastases are often overlooked on contrast-enhanced CT. Note: Some images shown are from the enhanced CT performed 2 weeks earlier.
with a somewhat higher sensitivity than the bone scan and a considerably higher specificity. Overall, F-18 FDG PET has a significant effect on staging and management. Unsus-pected metastases are detected 10% to 14% of the time. A significant change in management has been reported in 19% to 50% of cases based on PET findings, including a decrease in futile thoracotomies.
Restaging Non–Small Cell Lung Cancer and Assessing Response to TherapyWhen surgery and therapy distort anatomy, PET can detect residual and recurrent tumor not found on CT. Caution
must be used because increased F-18 FDG accumulation may occur after therapy, most significantly after radiation. Immediately after radiation, patchy areas of uptake can be seen corresponding to ground-glass appearing infiltrates. With time, these coalesce and contract with a final appear-ance on CT of a sharply marginated infiltrate containing air-bronchograms. The PET findings also change over time, but intense activity often does not resolve. It is gen-erally advised to delay F-18 FDG PET until at least 3 months after therapy, although imaging can be done sooner if needed. The background uptake from radiation decreases sensitivity for residual and recurrent tumors and can persist

254 Nuclear Medicine: The Requisites
A
B
Figure 11-35. PET/CT images before (A) and during (B) chemoradiation therapy for a non–small cell lung cancer with mediastinal involvement (not shown) reveal the value of PET for monitoring therapy, with some residual active disease seen on PET even though a residual mass was not well seen on CT.
long term. Even given these limitations, PET can provide valuable information by identifying residual disease or relapse. For example, distant recurrence after complete resection of tumor occurs more than 20% of the time. PET restaging frequently leads to changes in management.
Data on the use of PET to measure a response to treat-ment are more limited. Although a decrease in the size of a mass on CT has been used to assess response, this does not always provide the best indicator of the efficacy of therapy (Fig. 11-35). A partial response to therapy has been defined as a decrease in F-18 FDG uptake of at least 20% to 40%. Data suggest a decrease in F-18 FDG activity may provide a better measure of response and normalization of uptake may be associated with a favorable prognosis. Nonre-sponders can rapidly be shifted to an alternative therapy.
Small Cell Lung CarcinomaSCLC staging usually involves categorizing the disease as limited or extensive. If disease is confined to one hemitho-rax, it can be treated more successfully by adding radiation to the chemotherapy. Small cell lung carcinoma shows intense F-18 FDG accumulation. In general, data on the use of F-18 FDG PET in SCLC are more limited than for NSCLC. PET may help detect additional metastasis and lead to upstaging of disease in some patients originally thought to be surgical candidates with localized disease.
Breast Carcinoma
The general types of breast cancer are listed in Box 11-7. Breast cancer is classified as being a noninvasive or invasive tumor of ductal or lobular type. Of invasive carcinomas, duc-tal carcinoma accounts for 80%, lobular 10%, and medullary 5%. Noninvasive carcinoma, or carcinoma in situ, may be detected by mammography when microcalcifications are
present (i.e., ductal carcinoma in situ [DCIS]), but may be difficult to detect when it presents as architectural distortion found in lobular carcinoma in situ (LCIS). Prognosis is related to many staging factors, as well as the genomic break-down of the tumor (Table 11-11). Hormone receptor
Box 11-7. Types of Breast Cancer
Ductal carcinoma in situInfiltrating ductal carcinomaMedullary carcinomaInfiltrating lobular carcinomaTubular carcinomaMucinous carcinomaInflammatory breast cancerPaget disease of the nipple
Table 11-11 Molecular Subtypes of Breast Cancer
Luminal A ER+ and/or PR+, HER2−
Most commonLess aggressive, good prognosisHormone responsive
Luminal B ER+ and/or PR+, HER2+
More frequent ER+/PR− than luminal AWorse prognosis than luminal A
HER2+ (ER−)
Highly aggressive, less commonOften <40 years oldAfrican American possible risk factorHER2 improves outcome
Basal-like Triple negative,cytokeratin 5/6+ and/or
EGFR+
AggressiveOften <40 years old, African American
EGFR, Epidermal growth factor receptor; ER, estrogen receptor; HER2, human epidermal growth factor receptor 2; PR, progesterone receptor; triple negative, ER−, PR−, HER2−.

expression, such as estrogen receptor, and overexpression of tumor markers has been found highly predictive of outcome. Understanding these factors also helps guide therapy.
DiagnosisMammography is a sensitive screening tool for detecting breast carcinoma (81%-90%). However, the specificity of mammography is low and biopsy performed after an abnor-mal mammogram results in a histopathological diagnosis of malignancy only 10% to 50% of the time. MRI continues to be investigated because of its high sensitivity (up to 90%-95%) for the detection of breast cancer, although its specificity is low. MRI is recommended for patients with dense breasts, in which the diagnostic ability of mammog-raphy is limited. It also can better visualize multifocal dis-ease, recurrence, and disease in patients with implants. Ultrasound has added considerably to the evaluation of the breast in cases of palpable masses and discrete masses found on the mammogram. F-18 FDG PET imaging has proved useful in breast carcinoma staging and restaging.
Primary Breast CancerThe ability of F-18 FDG PET to detect primary breast can-cer is related to tumor size. One metaanalysis of the litera-ture suggests the sensitivity of PET is 88% and the specificity 79% for detecting primary tumors. Reported sen-sitivity of PET is 92% for tumors measuring 2 to 5 cm but is only 68% for tumors smaller than 2 cm. The false negative rate of F-18 FDG PET is not sufficient for a screening test. The histological type of the tumor also affects the sensitiv-ity of F-18 FDG PET, with detection of lobular carcinoma and ductal carcinoma in situ being much more limited than in invasive ductal carcinoma. For example, in lobular can-cers a sensitivity of approximately 40% has been reported.
Dedicated PET breast imaging systems are being devel-oped, which may significantly improve detection rates compared to whole-body scanners. Positron emission mammog raphy (PEM) performed with these dedicated PET breast cameras has reported resolution of 1 to 2 mm. The higher sensitivity over whole-body scanners aids in fol-lowing patients during therapy. Promising reports suggest these devices can accurately identify multifocal disease or provide more specificity than breast MRI. However, commer-cial scanners do not have CT for attenuation correction, so quantitation is done with ratios of activity compared to normal background rather than SUV. In addition, the scans are not clinically approved for reimbursement in tumor diagnosis.
Lymph Node EvaluationLymph node involvement has important prognostic and therapeutic implications in breast carcinoma. Axillary lymph node dissection fully evaluates the draining lymph nodes. However, this is a highly invasive procedure with serious side effects (e.g., lymphedema). In patients with nonpalpable lymph nodes, sentinel lymph node localiza-tion with Tc-99m sulfur colloid, with or without blue dye, is still the best method to select which lymph nodes to selectively biopsy. A negative PET scan does not exclude the need for further workup.
F-18 FDG PET imaging is able to visualize lymph node metastases by detecting changes in metabolism, often before any anatomical change occurs on CT. Not all lymph
OncOlOgy: POsiTrOn emissiOn TOmOgraPhy 255
nodes will be visualized, because microscopic metastases will not be seen, and the resolution of PET prevents evalu-ating the number of nodes involved. If scans are interpreted in a highly sensitive mode, specificity is lowered because inflammatory conditions frequently affect the axillary lymph nodes and cause increased FDG accumulation.
Clinical Use of Fluorine-18 Fluorodeoxyglucose Positron Emission TomographyBecause of the limitations of F-18 FDG PET, it is not gener-ally recommended in the initial diagnosis or screening of most patients. However, it was proved useful for staging in patients with advanced disease, monitoring response to therapy, restaging, and detecting recurrent disease. Although PET cannot detect every metastatic deposit, it frequently adds sig-nificant information to that obtained with conventional imag-ing such as CT, MRI, and bone scan. One study reported that PET added information in 29% of cases (Fig. 11-36).
A
B
MIP
Figure 11-36. Breast cancer staging. A, F-18 FDG PET often identi-fies malignant adenopathy in advanced and recurrent breast cancer. In this case, the large right breast tumor shows markedly increased uptake, as does an axillary lymph node. B, This postpartum patient presented with lymphoma in the left cervical region. Intense breast uptake was seen resulting from hormonal stimulation rather than tumor.
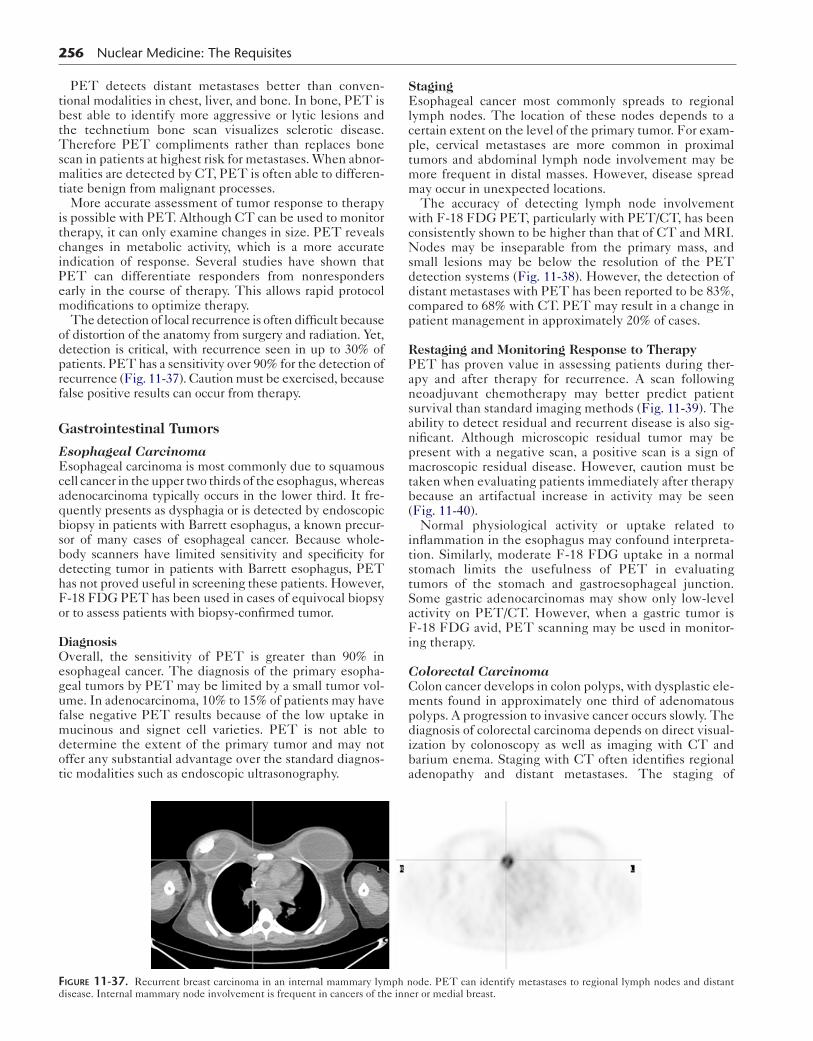
256 Nuclear Medicine: The Requisites
PET detects distant metastases better than conven-tional modalities in chest, liver, and bone. In bone, PET is best able to identify more aggressive or lytic lesions and the technetium bone scan visualizes sclerotic disease. Therefore PET compliments rather than replaces bone scan in patients at highest risk for metastases. When abnor-malities are detected by CT, PET is often able to differen-tiate benign from malignant processes.
More accurate assessment of tumor response to therapy is possible with PET. Although CT can be used to monitor therapy, it can only examine changes in size. PET reveals changes in metabolic activity, which is a more accurate indication of response. Several studies have shown that PET can differentiate responders from nonresponders early in the course of therapy. This allows rapid protocol modifications to optimize therapy.
The detection of local recurrence is often difficult because of distortion of the anatomy from surgery and radiation. Yet, detection is critical, with recurrence seen in up to 30% of patients. PET has a sensitivity over 90% for the detection of recurrence (Fig. 11-37). Caution must be exercised, because false positive results can occur from therapy.
Gastrointestinal Tumors
Esophageal CarcinomaEsophageal carcinoma is most commonly due to squamous cell cancer in the upper two thirds of the esophagus, whereas adenocarcinoma typically occurs in the lower third. It fre-quently presents as dysphagia or is detected by endoscopic biopsy in patients with Barrett esophagus, a known precur-sor of many cases of esophageal cancer. Because whole-body scanners have limited sensitivity and specificity for detecting tumor in patients with Barrett esophagus, PET has not proved useful in screening these patients. However, F-18 FDG PET has been used in cases of equivocal biopsy or to assess patients with biopsy-confirmed tumor.
DiagnosisOverall, the sensitivity of PET is greater than 90% in esophageal cancer. The diagnosis of the primary esopha-geal tumors by PET may be limited by a small tumor vol-ume. In adenocarcinoma, 10% to 15% of patients may have false negative PET results because of the low uptake in mucinous and signet cell varieties. PET is not able to determine the extent of the primary tumor and may not offer any substantial advantage over the standard diagnos-tic modalities such as endoscopic ultrasonography.
StagingEsophageal cancer most commonly spreads to regional lymph nodes. The location of these nodes depends to a certain extent on the level of the primary tumor. For exam-ple, cervical metastases are more common in proximal tumors and abdominal lymph node involvement may be more frequent in distal masses. However, disease spread may occur in unexpected locations.
The accuracy of detecting lymph node involvement with F-18 FDG PET, particularly with PET/CT, has been consistently shown to be higher than that of CT and MRI. Nodes may be inseparable from the primary mass, and small lesions may be below the resolution of the PET detection systems (Fig. 11-38). However, the detection of distant metastases with PET has been reported to be 83%, compared to 68% with CT. PET may result in a change in patient management in approximately 20% of cases.
Restaging and Monitoring Response to TherapyPET has proven value in assessing patients during ther-apy and after therapy for recurrence. A scan following neoadjuvant chemotherapy may better predict patient survival than standard imaging methods (Fig. 11-39). The ability to detect residual and recurrent disease is also sig-nificant. Although microscopic residual tumor may be present with a negative scan, a positive scan is a sign of macroscopic residual disease. However, caution must be taken when evaluating patients immediately after therapy because an artifactual increase in activity may be seen (Fig. 11-40).
Normal physiological activity or uptake related to inflammation in the esophagus may confound interpreta-tion. Similarly, moderate F-18 FDG uptake in a normal stomach limits the usefulness of PET in evaluating tumors of the stomach and gastroesophageal junction. Some gastric adenocarcinomas may show only low-level activity on PET/CT. However, when a gastric tumor is F-18 FDG avid, PET scanning may be used in monitor-ing therapy.
Colorectal CarcinomaColon cancer develops in colon polyps, with dysplastic ele-ments found in approximately one third of adenomatous polyps. A progression to invasive cancer occurs slowly. The diagnosis of colorectal carcinoma depends on direct visual-ization by colonoscopy as well as imaging with CT and barium enema. Staging with CT often identifies regional adenopathy and distant metastases. The staging of
Figure 11-37. Recurrent breast carcinoma in an internal mammary lymph node. PET can identify metastases to regional lymph nodes and distant disease. Internal mammary node involvement is frequent in cancers of the inner or medial breast.
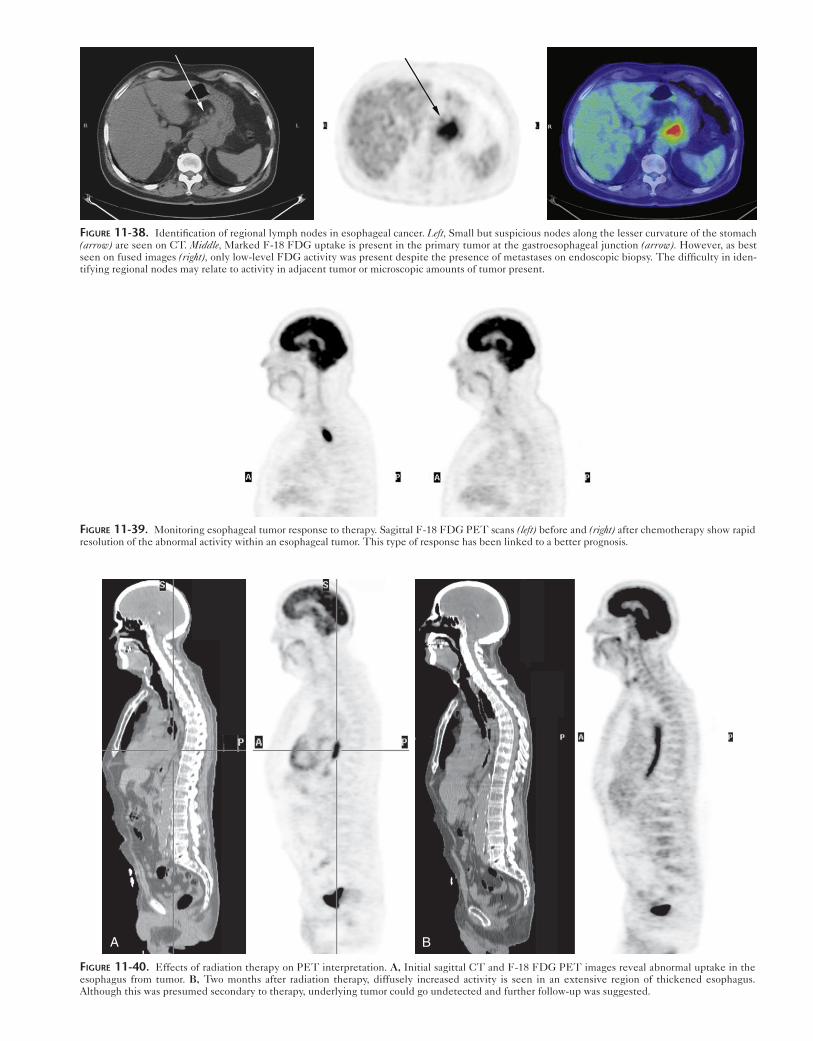
Figure 11-38. Identification of regional lymph nodes in esophageal cancer. Left, Small but suspicious nodes along the lesser curvature of the stomach (arrow) are seen on CT. Middle, Marked F-18 FDG uptake is present in the primary tumor at the gastroesophageal junction (arrow). However, as best seen on fused images (right), only low-level FDG activity was present despite the presence of metastases on endoscopic biopsy. The difficulty in iden-tifying regional nodes may relate to activity in adjacent tumor or microscopic amounts of tumor present.
Figure 11-39. Monitoring esophageal tumor response to therapy. Sagittal F-18 FDG PET scans (left) before and (right) after chemotherapy show rapid resolution of the abnormal activity within an esophageal tumor. This type of response has been linked to a better prognosis.
A B
Figure 11-40. Effects of radiation therapy on PET interpretation. A, Initial sagittal CT and F-18 FDG PET images reveal abnormal uptake in the esophagus from tumor. B, Two months after radiation therapy, diffusely increased activity is seen in an extensive region of thickened esophagus. Although this was presumed secondary to therapy, underlying tumor could go undetected and further follow-up was suggested.

258 Nuclear Medicine: The Requisites
colorectal carcinoma is important in determining therapy and prognosis (Table 11-12 and Box 11-8).
The ability of PET to diagnose primary colorectal tumors may be limited because small tumors (especially <1 cm) and cancerous polyps are frequently not detected as high levels of normally occuring F-18 FDG activity in the bowel results in decreased sensitivity. Although not recommended for colorectal carcinoma diagnosis or screen-ing, PET-CT is more accurate than CT. Incidentally detected areas of focal uptake in the colon often require follow-up to exclude the presence of cancer. False positive uptake can be seen in areas of inflammation, such as diver-ticulosis, and in benign polyps.
Although contrast-enhanced CT is the primary modality for the staging of colorectal carcinoma, it often fails to identify nodal disease. F-18 FDG PET is superior to CT for initial staging and the detection of recurrent colon can-cer. Local recurrence can be difficult to detect on CT because of scarring after therapy, but may be easily visible on PET images. The obturator and iliac nodal regions of the pelvis are often particularly difficult to evaluate on CT, whereas PET is very helpful in evaluating these regions. F-18 FDG PET is also superior to CT in the retroperito-neal nodes. The detection of hepatic metastases is excel-lent with CT, but PET often complements this information or detects new lesions (Fig. 11-41). Sensitivity of PET has been reported at 85% to 99%, with specificity of 71% to 87%. PET may directly alter patient management in 29% to 36% of staging and restaging cases. Caution must be taken because recurrent tumor can occur at the anastomo-sis, where it can be mistaken for bowel. In some cases, residual tumor could be mistaken for infection or post-treatment inflammation. Data are limited concerning the use of PET in monitoring therapy effects.
Box 11-8. Dukes’ Staging of Colorectal Carcinoma
A T1, T2; N0; M0B T3, T4; N0; M0C T1-4; N1; M0D Any T; any N; M1
Table 11-12 Tumor-Node-Metastasis Classification of Colon and Rectal Carcinoma
Primary tumorRegionallymph nodes Distant metastases
Tx: Cannot be assessed Nx: Cannot be assessed
Mx: Cannot be assessed
T0: No evidence of tumor N0: None M0: None
TIS: Carcinoma in situ Nl: 1-3 positive nodes
Ml: Distant metastases
Tl: Submucosal invasion N2: ≥4
T2: Invades muscularis propria
N3: Central nodes
T3: Through propria
T4: Invades other organs
Other Tumors of the Gastrointestinal TractThe use of F-18 FDG PET in other tumors of the gastro-intestinal tract is more limited, and CT remains critical in the analysis of these tumors. However, PET may be help-ful in tumors of pancreatic, biliary, and hepatic origin. PET is often used in patients with CT scans that are difficult to evaluate or in patients with elevated serum tumor mark-ers, including alpha-fetoprotein in hepatocellular carci-noma and Ca 19-9 in pancreatic cancer.
Pancreatic CancerPET is highly sensitive for the detection of adenocarci-noma of the pancreas (Fig. 11-42). However, CT is essen-tial in defining tumor extent and vascular involvement, as well as in determining resectability. Detection of hepatic and lymph node metastasis is usually done with CT or MRI. However, PET may identify lymph nodes difficult to visualize on CT, such as in the upper portal regions, and can identify undiagnosed distant metastases in 14% of cases. These factors can lead to alterations in surgical management in a significant number of cases. PET is often limited by poor sensitivity in small tumors and in acute pancreatitis. The uptake in acute pancreatitis can be as intense as in malignancy and can mask underlying tumor. Acute pancreatitis often accompanies therapy or obstruction by tumor, and PET in these cases is often nondiagnostic.
Some pancreatic masses seen on CT are benign, and PET can often differentiate benign and malignant pro-cesses (with accuracies of 85%-93%). This can support a negative fine-needle biopsy finding. PET may also detect occult cancers not seen on CT in symptomatic patients.
Primary tumors of the liver are much less common than involvement by metastases and are most often evaluated by CT. The two most common primary liver tumors are hepatocellular carcinoma and cholangiocarcinoma. F-18 FDG PET is highly accurate for detecting metastases to the liver but has low sensitivity for the detection of pri-mary hepatic tumors. PET may detect 50% to 70% of hepatocellular carcinomas.
Cholangiocarcinoma is a rare cancer of the bile ducts that may not be detected on CT. It may occur in extrahe-patic or intrahepatic locations. Tumors arising peripher-ally have a better prognosis because they may be resected, whereas those near the hilum are infrequently resectable. Tumors can be infiltrating, exophytic, or a polypoid intraluminal mass. The sensitivity of PET is lower for the infiltrating type in particular. Gallbladder cancer is a rare tumor that is generally diagnosed late in the course of disease and may present with distant metastases. PET usually shows intense uptake and may identify nodal metastases difficult to detect with CT, including distant nodes and those high along the com-mon biliary duct.
One tumor in which PET has proved quite useful is the gastrointestinal stromal tumor (GIST). These tumors usu-ally show high levels of F-18 FDG accumulation. In cases in which tumors respond to imatinib (Gleevec) therapy, markedly decreased F-18 FDG accumulation is seen with PET in a matter of days. PET more accurately assesses early response than CT and predicts improved patient sur-vival (Fig. 11-43).

Genitourinary Tumors
Ovarian CarcinomaTumors may arise from any of the cellular elements of the ovary (Box 11-9). Ovarian carcinoma diagnosis is challenging because physical examination may not reveal disease and symptoms do not present until late in the course of disease. Tumor staging is outlined in Box 11-10.
OncOlOgy: POsiTrOn emissiOn TOmOgraPhy 259
Hematogenous spread is rare, but direct spread and seeding of the omentum and organ surfaces is common (Fig. 11-44). Lymphatic spread can lead to malignant pleural effusions. Although patients with localized dis-ease have a more than 90% survival chance, most patients present with stage III or IV disease. The prognosis of ovarian carcinoma is poor, with overall survival of only 46% at 5 years.
A
B
C
Figure 11-41. Evaluation of metastatic rectal carcinoma. Axial-enhanced CT and PET images before (A) and after (B) chemotherapy show a decrease in activity in a malignant rectal mass. C, Coronal images before (left) and after therapy (right) in this patient show a decrease in hepatic lesions, only one of which was ever detected by CT.

A
B
Figure 11-42. PET imaging of the pancreas. A, A malignant pancreatic head mass seen on contrast-enhanced CT had a high level of F-18 FDG uptake consistent with malignancy. However, the inflammation that accompanies pancreatitis also can cause intense uptake. B, CT following biopsy of a pancreatic mass showed inflammatory changes around the pancreatic tail positive on PET. Note the central “cold” area corresponding to a pancreatic duct dilated as a result of proximal obstruction from the mass.
Figure 11-43. FDG PET in gastrointestinal stromal tumor (GIST). PET has proved useful in monitoring the remarkable effects of imitinib (Gleevec) therapy on GIST tumors. A baseline study (left) is needed to confirm the tumor is FDG avid. Unlike with CT, rapid improvement is often seen within days of therapy. In this case (right), uptake has resolved even though the mass has decreased on CT only after 4 weeks of therapy.

Box 11-9. Histopathological Classification of Ovarian Carcinoma
EPITHELIAL TUMORSSerousMucinousEndometrioidBrennerTransitional cellMixed epithelialSmall cellClear cell
SEX CORD–STROMAL TUMORSGranulosa cellSerotoli-Leydig cell
GERM CELLDysgerminomaYolk sacEmbryonalTeratomas
Box 11-10. Ovarian Carcinoma Staging
Stage I: Growth limited to ovaries with an intact capsule
Stage II: Extension onto pelvic organs or into ascitesStage III: Peritoneal implants outside of the pelvis;
retroperitoneal or inguinal lymph node involvementStage IV: Distant metastasis
OncOlOgy: POsiTrOn emissiOn TOmOgraPhy 261
Preoperative evaluation of patients often includes imag-ing with sonography, CT, and MRI. Staging with CT has 70% to 90% accuracy. However, small peritoneal lesions found with surgical exploration are frequently overlooked or undetectable by CT. PET/CT often highlights abnor-mal activity in lesions that were overlooked on CT.
F-18 FDG PET has been used for staging and restaging but is most widely used to detect recurrent disease. Often, this involves patients with elevated serum markers (Ca-125, Ca 19-9, alpha fetoprotein, and human chorionic gonadotropin) and negative or inconclusive CT findings. The reported sensitivity of PET varies from 50% to 90% and the specificity from 60% to 80%. The accuracy of PET depends on tumor size and cell type. As with CT, small peritoneal nodules seen during laparoscopy and small pri-mary tumors confined to the ovary may be missed. Well-differentiated and mucinous tumors may not be seen, causing false negative results (Box 11-11). Also, PET scan-ning may not be useful for initial tumor diagnosis because several benign conditions may accumulate F-18 FDG (Table 11-13). Despite these limitations, PET is especially helpful in cases in which CT is negative but suspicion for
Box 11-11. Processes Causing False Negative Results in Ovarian Cancer
Well-differentiated serous cystadenocarcinomaMucinous cystadenocarcinomaDisseminated peritoneal carcinomatosisBorderline tumorsStage I tumors confined to the ovary
Figure 11-44. Recurrent ovarian carcinoma. A patient with a rising CA-125 had numerous metastases on the coronal PET, including a left axillary lymph node, metastases studding the surface of the liver, and a right lower quadrant peritoneal lesion studding the right colon on axial images.

262 Nuclear Medicine: The Requisites
recurrence is high. Overall, PET alters management in approximately 15% of cases.
Cervical CarcinomaCervical carcinoma is the most common gynecological can-cer. It may be treated effectively by surgery when localized, but radiation and chemoradiation may be required for locally advanced disease. The spread of cervical carcinoma usually occurs by local extension or lymphatic spread to pelvic, paraaortic, and retroperitoneal lymph nodes. How-ever, distant metastases occur, such as to the supraclavicular lymph nodes. Detection of nodal involvement is important in planning therapy but may be difficult by CT.
F-18 FDG PET has shown greater than 90% sensitivity for detection of cervical cancer, with marked uptake in pri-mary tumors and lymph node metastasis. In patients whose disease appears to be confined to the pelvis on CT and MRI, PET has been shown to be useful in more accurate disease staging (Fig. 11-45) and can identify disease that might otherwise be outside of the field of treatment for radiation therapy. In patients who have had prior resection, scar may make detection of recurrent disease by CT diffi-cult. Evaluation may be complicated by normal uptake in the bowel and urinary tract. Although increased uptake can occur in tissues affected by radiation therapy, usually tumor response is evident (Fig. 11-45, B and C ).
Testicular CarcinomaTesticular cancer can be divided into seminoma and non-seminoma germ-cell tumors. The spread of testicular tumor is most commonly to retroperitoneal lymph nodes. Although the overall prognosis for these tumors is good, accurate staging and surveillance are necessary. Disease is frequently incorrectly staged by CT. Disease initially clas-sified as stage I is commonly then found to have nodal involvement at surgery. Other patients placed incorrectly in high-risk groups may undergo unnecessary therapy. For example, it has been common practice to treat all patients with seminoma with radiation.
Standard imaging of testicular carcinoma consists of ultrasound for diagnosis and CT for staging. However, F-18 FDG PET is accurate for tumor staging and detect-ing recurrence in seminomas. In comparison with CT, PET has shown superior sensitivity (80% vs. 70%), speci-ficity (100% vs. 74%), positive predictive value (100% vs. 37%), and negative predictive value (96% vs. 92%) in the
Table 11-13 Fluorine-18 Fluorodeoxyglucose Positive Processes Mimicking Ovarian Carcinoma
Gastrointestinal activityInfection/inflammationBenign tumors
Germ cell: Benign teratomas
Epithelial tumors: Mucinous cystadenoma, serous cystadenomaDermoid cysts, hemorrhagic follicle cyst, corpus luteum cyst
EndometriomaFibromaBenign thecomaSchwannoma
CMS, Centers for Medicaid and Medicare Services.
multicenter SEMPET trial. The high negative predic-tive value of PET is useful for evaluation of residual masses, which are frequently seen on CT after therapy. F-18 FDG uptake is lower in nonseminomatous germ cell tumors, with a sensitivity of perhaps 59%. Detection of small tumors and well-differentiated teratomas is especially limited with PET. Relapse of testicular carci-noma is a frequent occurrence, and PET is useful for surveillance.
Prostate CarcinomaF-18 FDG PET has very limited sensitivity for prostate carcinoma. Uptake in primary tumor is often low and simi-lar to that in benign prostatic hypertrophy. In terms of stag-ing, F-18 FDG PET detected fewer than two thirds of osseous metastases found on bone scintigraphy and approximately half of nodal metastases found on CT. CT is superior to F-18 FDG for the detection of pulmonary metastases.
However, F-18 FDG PET is often abnormal in advanced prostate carcinoma that has escaped hormonal control. In such cases, abnormal lesions may be identified in many areas, including bone and lymph nodes.
Renal and Bladder Carcinomas
CT is the most common imaging modality for the diagno-sis and staging of renal cell carcinoma and bladder carci-noma. F-18 FDG PET is not useful in the diagnosis of primary tumors. Although some have suggested that the urinary excretion of F-18 FDG might obscure adjacent tumors, these masses often show no radiotracer uptake (Fig. 11-46). The cause for this finding, such as variations in glucose transporter expression, is being investigated. However, PET may play a role in diagnosing distant metastases and detecting recurrent disease.
Data are limited concerning the use of F-18 FDG PET in bladder and renal tumors. While transitional cell tumors reportedly should increased F-18 FDG accumulation, detection of primary tumors is limited by excreted activ-ity in urine; PET shows a high sensitivity for distant metastases. In renal cell carcinoma, only about 60% of pri-mary tumors are identified by PET, although 65% to 80% of recurrent or metastatic lesions may be detected, many of which are not seen on CT. Cell type may affect sensitivity.
Musculoskeletal Tumors
Malignant primary bone tumors are usually F-18 FDG avid, as are many benign conditions. Benign tumors such as giant cell tumor, fibrous dysplasia, and eosinophilic granulomas have been shown to accumulate F-18 FDG. PET may be useful in both evaluating patients who cannot undergo MRI imaging and monitoring the effects of therapy. If a nonre-sponder is identified early by showing little change in SUV values on PET, the course of therapy can be altered. F-18 FDG may influence therapy by identifying other sites of disease, such as in patients with plasmacytoma.
For the evaluation of soft tissue sarcomas, the accuracy of F-18 FDG PET appears related to tumor grade. The increased uptake in high-grade tumors such as malignant

OncOlOgy: POsiTrOn emissiOn TOmOgraPhy 263
B
A
C
D
Figure 11-45. A, PET images of vaginal cuff show tumor (arrow) responding to radiation therapy (B) in a patient with cervical cancer. In the same patient, the detection of F-18 FDG uptake in a normal-size right paraaortic lymph node (C) lead to the disease being upstaged, requiring chemotherapy in addition to radiotherapy of the pelvis. D, Follow-up showed resolution of the active tumor.
Figure 11-46. Bladder carcinoma. Renal cell carcinoma and bladder tumors are often negative on FDG PET. A mass along the posterior bladder (arrow) on CT (left) shows no FDG uptake on the PET portion of the examination (right).

264 Nuclear Medicine: The Requisites
fibrous histiocytoma allows detection with a high degree of sensitivity. Low-grade tumors, on the other hand, show minimal or nonexistent uptake, leading to poor sensitivity. Although MRI remains the main imaging modality of the primary tumor, the ability of MRI to detect recurrence is limited in the postoperative patient. PET may help detect recurrent tumors, although the effects of surgery and radia-tion therapy lower sensitivity.
SuggeSted Reading
Alessio AM, Kinahan PE, Manchanda V, et al. Weight-based, low dose pediatric whole body PET/CT protocols. J Nucl Med. 2009;50(10):1570-1577.
Coleman RE, Hillner BE, Shields AF, et al. PET and PET/CT reports: observations from the National Oncologic PET Registry. J Nucl Med. 2010;51(1):158-163.
Delbeke D, Martin WH. PET and PET-CT for the evaluation of colorectal carcinoma. Semin Nucl Med. 2004;34:209-223.
Delbeke D, Coleman RF, Guiberteau MJ, et al. Procedure guideline for tumor imaging with 18F-FDG PET/CT 1.0. J Nucl Med. 2006;47(5):885-895.
Eary JF, Conrad EU. Imaging in sarcoma. J Nucl Med. 2011;52(12):1903-1913.Eubank WB, Mankoff DA. Evolving role of positron emission tomography in
breast cancer imaging. Semin Nucl Med. 2005;35:84-95.Gupta NC, Maloof J, Gunel E. Probability of malignancy in solitary pulmonary
nodules using fluorine-18-FDG and PET. J Nucl Med. 1996;37:943-947.Hillner BE, Siegel BA, Liu D, et al. Impact of positron emission tomography/
computed tomography and positron emission tomography (PET) alone on expected management of patients with cancer: initial results from the National Oncologic PET Registry. J Clin Oncol. 2008;26(13):2155-2161.
Ko JP, Drucker EA, Shepard JO, et al. CT depiction of regional node stations for lung cancer staging. AJR Am J Roentgenol. 2000;174(3):775-782.
Kresnik E, Mikosch P, Gallowitsch HJ, et al. Evaluation of head and neck cancer with F-18 FDG PET: a comparison with conventional methods. Eur J Nucl Med. 2001;28(7):816-821.
Kumar R, Kubota K, Yokoyama J, Yamaguchi K, et al. FDG-PET delayed imaging for the detection of head and neck cancer recurrence after radio-chemotherapy: comparison with MRI/CT. Eur J Nucl Med. 2004;31(4):590-595.
Alavi A. PET imaging in gynecologic malignancies. Radiol Clin North Am. 2004;42(6):1155-1167.
Macapinlac HA. FDG PET and PET/CT imaging in lymphoma and melanoma. Cancer J. 2004;10(4):262-270.
Pantvaidya GH, Agarwal JP, Deshpande MS, et al. PET-CT in recurrent head and neck cancers: a study to evaluate impact on patient management. J Surg Oncol. 2009;100(5):401–401.
Shankar LK, Hoffman JM, Bacharach S, et al. Consensus recommendations for the use of 18F-FDG PET as an indicator of therapeutic response in patients in National Cancer Institute trials. J Nucl Med. 2006;47(6):1059-1066.
Som PM, Curtin HD, Mancuso AA. Imaging-based nodal classification for evaluation of neck metastatic adenopathy. AJR Am J Roentgenol. 2000;174(3):837-844.
Velasquez LM, Boellaard R, Kollia G, et al. Repeatability of 18F-FDG PET in a multicenter phase I study of patients with advanced gastrointestinal malignan-cies. J Nucl Med. 2009;50(10):1646-1654.
Vesselle H, Pugsley JM, Vallieres E, et al. The impact of fluorodeoxyglucose F-18 positron-emission tomography on the surgical staging of non-small cell lung cancer. J Thorac Cardiovasc Surg. 2002;124:511-519.
Wahl RL. Principles and Practice of Positron Emission Tomography. 2nd ed Baltimore: Lippincott Williams & Wilkins; 2009.
Wong RJ, Lin DT, Schüder H, et al. Diagnostic and prognostic value of F-18 fluorodeoxyglucose positron emission tomography for recurrent head and neck squamous cell carcinoma. J Clin Oncol. 2002;20(20):4199-4208.