1.1. CREDIT RISK - Sito Istituzionale IntesaSanpaolo · by-case approach and require the...
37
Notes to the consolidated financial statements – Part E – Information on risks and relative hedging policies 291 1.1. CREDIT RISK The Group adopts credit strategies and policies aimed at: – coordination of the actions aimed at the achievement of a sustainable objective, consistent with the risk appetite and value creation; – portfolio diversification, limiting the concentration of exposures on single counterparties/groups, single sectors or geographical areas; – efficient selection of the single borrowers via an attentive creditworthiness analysis aimed at containing default risk, notwithstanding the objective of privileging commercial lending or loans to support new production capacity with respect to merely financial interventions; – control of relationship characteristics, carried out with information technology procedures and systematic surveillance of the relationships which present irregularities, both aimed at rapidly identifying any signs of deterioration in risk exposures. The quality of the loan portfolio is constantly monitored by specific operating checks for all the phases of loan management (analysis, granting, monitoring, management of non-performing loans). The management of credit risk profiles of the loan portfolio is assured, starting from the analysis and granting phases, by: – regulations on Credit policies; – checks on the existence of the necessary conditions for creditworthiness, with particular focus on the client’s current and prospective capacity to produce satisfactory income and congruous cash flows; – the assessment of the nature and size of proposed loans, considering the actual requirements of the counterparty requesting the loan, the course of the relationship already in progress and the presence of any relationship between the client and other borrowers. QUALITATIVE INFORMATION Credit risk management policies Organisation In 2008, the areas of responsibility relating to credit operations were redefined through a new organisational structure based on a rigorous segregation of functions and tasks. Within the specific area of Group credit management, the Chief Financial Officer - in accordance with the strategic guidelines and risk management policies set out by the Management Board and approved by the Supervisory Board - sets out the credit strategies and assesses the need for their adjustment over time; the Chief Lending Officer coordinates the implementation of the credit guidelines established for the Group, makes the significant credit decisions and supervises doubtful credit and the recovery of non-performing loans; the Chief Risk Officer ensures the measurement and control of the Group risk exposures and monitors risk performance and credit quality on an ongoing basis; and the Chief Operating Officer provides specialist support in the setting out of the credit processes ensuring the synergy between costs and excellence of the service offered. Approval limits attributed to the credit approval functions of the Parent Company and of subsidiaries are defined in terms of total Bank/Banking Group exposure to each counterparty/economic group, with a case- by-case approach and require the attribution of an internal rating to each counterparty at the time of granting and monitoring and the periodic update of the rating at least once a year. The rating and any credit risk mitigation factors, influence the determination of the credit approval competence of each delegated body, which is formulated to ensure its credit risk equivalence in terms of capital absorbed. Intesa Sanpaolo, as the Parent Company, has set out codes of conduct in relation to credit risk acceptance, in order to prevent excessive concentrations, limit potential losses and ensure credit quality. In the credit-granting phase, coordination mechanisms have been introduced with which Intesa Sanpaolo exercises its direction, governance and support of the Group: – “Credit policies”, which discipline the conduct to be followed when taking on credit risk with customers; – “Credit-granting limit”, intended as the overall limit of loans which may be granted by companies of the Intesa Sanpaolo Group to the larger Economic Groups; – “Compliance opinion” on credit-granting to large customers (single name or Economic Group) which exceeds certain thresholds. The Chief Risk Officer is responsible, at Group level, for the definition and the development of credit risk
Transcript of 1.1. CREDIT RISK - Sito Istituzionale IntesaSanpaolo · by-case approach and require the...

Notes to the consolidated financial statements – Part E – Information on risks and relative hedging policies
291
1.1. CREDIT RISK The Group adopts credit strategies and policies aimed at: – coordination of the actions aimed at the achievement of a sustainable objective, consistent with the risk
appetite and value creation; – portfolio diversification, limiting the concentration of exposures on single counterparties/groups, single
sectors or geographical areas; – efficient selection of the single borrowers via an attentive creditworthiness analysis aimed at containing
default risk, notwithstanding the objective of privileging commercial lending or loans to support new production capacity with respect to merely financial interventions;
– control of relationship characteristics, carried out with information technology procedures and systematic surveillance of the relationships which present irregularities, both aimed at rapidly identifying any signs of deterioration in risk exposures.
The quality of the loan portfolio is constantly monitored by specific operating checks for all the phases of loan management (analysis, granting, monitoring, management of non-performing loans). The management of credit risk profiles of the loan portfolio is assured, starting from the analysis and granting phases, by: – regulations on Credit policies; – checks on the existence of the necessary conditions for creditworthiness, with particular focus on the
client’s current and prospective capacity to produce satisfactory income and congruous cash flows; – the assessment of the nature and size of proposed loans, considering the actual requirements of the
counterparty requesting the loan, the course of the relationship already in progress and the presence of any relationship between the client and other borrowers.
QUALITATIVE INFORMATION Credit risk management policies
Organisation In 2008, the areas of responsibility relating to credit operations were redefined through a new organisational structure based on a rigorous segregation of functions and tasks. Within the specific area of Group credit management, the Chief Financial Officer - in accordance with the strategic guidelines and risk management policies set out by the Management Board and approved by the Supervisory Board - sets out the credit strategies and assesses the need for their adjustment over time; the Chief Lending Officer coordinates the implementation of the credit guidelines established for the Group, makes the significant credit decisions and supervises doubtful credit and the recovery of non-performing loans; the Chief Risk Officer ensures the measurement and control of the Group risk exposures and monitors risk performance and credit quality on an ongoing basis; and the Chief Operating Officer provides specialist support in the setting out of the credit processes ensuring the synergy between costs and excellence of the service offered. Approval limits attributed to the credit approval functions of the Parent Company and of subsidiaries are defined in terms of total Bank/Banking Group exposure to each counterparty/economic group, with a case-by-case approach and require the attribution of an internal rating to each counterparty at the time of granting and monitoring and the periodic update of the rating at least once a year. The rating and any credit risk mitigation factors, influence the determination of the credit approval competence of each delegated body, which is formulated to ensure its credit risk equivalence in terms of capital absorbed. Intesa Sanpaolo, as the Parent Company, has set out codes of conduct in relation to credit risk acceptance, in order to prevent excessive concentrations, limit potential losses and ensure credit quality. In the credit-granting phase, coordination mechanisms have been introduced with which Intesa Sanpaolo exercises its direction, governance and support of the Group: – “Credit policies”, which discipline the conduct to be followed when taking on credit risk with
customers; – “Credit-granting limit”, intended as the overall limit of loans which may be granted by companies of
the Intesa Sanpaolo Group to the larger Economic Groups; – “Compliance opinion” on credit-granting to large customers (single name or Economic Group) which
exceeds certain thresholds. The Chief Risk Officer is responsible, at Group level, for the definition and the development of credit risk

Notes to the consolidated financial statements – Part E – Information on risks and relative hedging policies
292
measurement methodologies, with the objective of ensuring alignment to best practice, as well as for the analysis of the risk profile and the preparation of summary reports for the Bank’s top management on the changes in the credit quality of the Group’s assets. Control structures operating within the single Companies are responsible for the measurement and monitoring the portion of the loan book assigned to them. For the main subsidiaries such functions are performed, on the basis of an outsourcing contract, by the Parent Company’s risk control functions which periodically report to the Board of Directors and the Audit Committee of the subsidiary. With reference to concentration risk, limits are periodically defined for single counterparties and for significant industrial and geographical aggregates. Post loan origination interventions are aimed at acting on the risk profile of the entire portfolio, using all the opportunities present on the secondary loan market, in view of an active management of business assets. Management, measurement and control systems Intesa Sanpaolo has developed a set of instruments which ensure analytical control over the quality of the loans to customers and financial institutions, and loans subject to country risk. Risk measurement uses rating models that are differentiated according to the borrower’s segment (Corporate, Small Business, Mortgage, Personal Loans, Sovereigns, Italian public sector entities, Financial institutions). These models make it possible to summarise the credit quality of the counterparty in a measurement, the rating, which reflects the probability of default over a period of one year, adjusted on the basis of the average level of the economic cycle. Statistical calibrations have rendered these ratings fully consistent with those awarded by rating agencies, forming a single scale of reference. As described in the paragraph relating to the Basel 2 Project, the Group: – has obtained the authorisation for the use of the IRB Foundation approach for the Corporate segment; – has implemented the rating models and the credit processes for the SME Retail and Retail (Residential
mortgages); with the release of the Loss Given Default (LGD) model, which is in the completion stage, it will be possible to send the request for authorisation for the use of the IRB Advanced approach during 2009;
– the rating models for the other segments are also being developed and extended to the other Group lending banks, according to a progressive rollout plan for the advanced approaches presented to the Supervisory authority.
The allocation of the rating is generally spread across the branches, except for certain types of counterparty (mainly large groups and complex conglomerates, non-banking financial institutions and insurance companies), which are centralised in specialist Head Office units and require expert assessments. As mentioned above, ratings and credit-risk mitigation factors (guarantees, facility types and covenants) are used in credit-granting processes as part of the determination of autonomy limits; ratings also contribute to defining Credit policies. Furthermore, the rating system includes a behavioural score available on a monthly basis, which is the main element used for monitoring credit. It interacts with processes and procedures for loan management and credit risk control and allows timely assessments to be formulated when any anomalies arise or persist. The positions to which the synthetic risk index mentioned above attributes a high risk valuation, which is confirmed over time, are intercepted by the Non-performing Loan Process. This process, supported by a dedicated electronic procedure, enables constant monitoring, largely with automatic interventions, of all the phases for the management of anomalous positions. The positions which show an anomalous trend are classified into different processes based on the risk level, including the automatic classification in non-performing assets, as described in the related paragraph below. The entire loan portfolio is subject to a specific periodic review carried out for each counterparty/economic group by the competent central or peripheral structures based on the credit line limits. The Credit Information Portal offers the Operating Units of the Banca dei Territori and the Corporate and Investment Banking Divisions, down to the respective Area structures, access via the Bank’s Intranet to a wide range of specific monthly reports for their respective portfolios and to a series of “Alerts” that identify the potentially-critical situations among those analysed. In 2009, the review of the content and layout will be completed and the target version of the Credit Information Portal will be made available to the Parent Company and the Network Banks. The exchange of basic information flows among different Group entities is assured by the Group’s “Centrale Rischi” (exposure monitoring and control system) and by “Posizione Complessiva di Rischio” (global risk position), that highlight and analyse credit risks for each client/economic group both towards the Group as a whole and towards individual Group companies. Directional control of credit risks is achieved through a portfolio model which summarises the information

Notes to the consolidated financial statements – Part E – Information on risks and relative hedging policies
293
on asset quality in risk indicators, including expected loss and capital at risk. The expected loss is the product of exposure at default, probability of default (derived from the rating) and loss given default. The latter is measured with reference to an economic rather than an accounting concept of loss, based on the discounting of recoveries net of internal and external costs associated to recovery activities. The expected loss represents the average of the loss distribution, whereas the capital at risk is defined as the maximum “unexpected” loss that the Group may incur with particular confidence levels. These indicators are calculated with reference to the current portfolio situation and on a dynamic basis, by determining the projected level, based on both the forecasted macro economic scenario and on stress scenarios. The expected loss, transformed into “incurred loss” as indicated by IAS 39, is used in the collective assessment of loans, while capital at risk is the fundamental element in the assessment of the Group’s capital adequacy. Both indicators are also used in the value-based management reporting system. The credit portfolio model also allows identification of the undesired concentration effects and extent and content of actions:
– aimed at ex ante limitation of exposures with significant concentration effects, in particular with reference to so-called “large exposures”, to loans subject to country risk and to loans to financial institutions;
– aimed at ex post correction of the profile, through the secondary loan market, through specific judgement metrics based on maximisation of overall portfolio value.
Techniques for the mitigation of credit risk The techniques for the mitigation of credit risk are the elements that contribute to reducing the loss given default. They include guarantees, facility types and covenants. The evaluation of the mitigating factors is performed through a procedure that assigns a loss given default to each individual loan, assuming the highest values in the case of ordinary non-guaranteed financing and decreasing in accordance with the strength given to any mitigating factors present. The loss given default values are subsequently aggregated at customer level in order to provide a summary evaluation of the strength of the mitigating factors on the overall credit relation. Within the credit granting and management process, Credit policies favour higher mitigating factors for counterparties classified by the rating system as non investment grade and for certain types of medium-long term exposures. The “very strong” and "strong" mitigating factors include pledges on financial collateral and residential mortgages. Other mitigating guarantees include pledges on non-financial assets, non-residential mortgages and personal guarantees issued by unrated parties, provided they have sufficient personal assets. The strength of the personal guarantees issued by rated parties typically banks/insurance companies, Credit Guarantee Consortia and corporations, is instead assessed on the basis of the guarantor’s credit quality.
Non-performing financial assets For the classification of non-performing assets in the various risk categories (doubtful loans, substandard loans, restructured loans and exposures expired and/or past due), the Bank applies regulations issued by the Bank of Italy, supplemented by internal provisions that establish criteria and automatic rules for the transfer of loans to the various risk categories. With reference to loans expired and/or past due, restructured loans and substandard loans, the structures responsible for their management are identified, on the basis of pre-determined thresholds of increasing significance, within the decentralised organisational units in the Areas/Banks that perform specialist activities and within the Head Office structures, responsible for the overall management and coordination of these matters. During 2008, the management of doubtful loans - pending the implementation of a project aimed at the overall redefinition of the loan recovery operations within the Group - continued using essentially the same procedures as those adopted in the year 2007. Specifically, for the former Sanpaolo Network this management remained centralised in specialised head office functions within the Loan Recovery Department that rely on personnel located throughout the branch network to conduct the related recovery activities. As part of these activities, in order to identify the optimal strategies to be implemented for each position, judicial and non-judicial solutions have been examined in terms of costs and benefits, also considering the financial impact of the estimated recovery times.

Notes to the consolidated financial statements – Part E – Information on risks and relative hedging policies
294
The assessment of the loans has been reviewed whenever events capable of significantly changing recovery prospects became known to the Bank. In order to identify such events rapidly, the information set relative to borrowers is periodically monitored and the development of out-of-court agreements and the various phases of the judicial procedures under way are constantly controlled. As regards the former Intesa Network, the management of doubtful loans - with the exception of loans of an amount up to 15,500 euro that are sold without recourse to third party companies when classified as doubtful - has been assigned by management mandate and within set limits to the company Italfondiario S.p.A.. The activities carried out by Italfondiario have already been subject to ongoing monitoring by the relevant internal functions of the Bank. Please note in particular that the assessment of loans has been conducted using similar procedures to those established for the internal management of positions, and the other management activities are progressively being brought into line with the guidelines established for the internally managed positions. On this point please note that, since June 2008, the Loan Recovery Department has also supervised the management of the positions assigned to Italfondiario. The classification of positions within non-performing financial assets and in the relative management systems was undertaken on proposal of both central and local territorial structure owners of the commercial relation or of specialised central and local territorial structures in charge of loan monitoring and recovery. For financial statement purposes, the classification in substandard loans also occurs automatically for exposures which exceed objective payment terms, such as expired and/or past due loans as well as positions that meet the criteria of Objective Substandard Loan established by the Bank of Italy. The return to performing of exposures classified as Substandard, Restructured and Doubtful, is governed by the Supervisory Authority and specific internal regulations, and takes place on the proposal of the aforementioned structures responsible for their management, upon ascertainment that the critical conditions or state of default no longer exist. As for exposures classified in “loans expired and past due” the return to performing occurs automatically when the exposure is reimbursed. The overall non-performing loan portfolio is continually monitored through a predetermined control system and periodic managerial reporting.
Notes to the consolidated financial statements – Part E – Information on risks and relative hedging policies
295
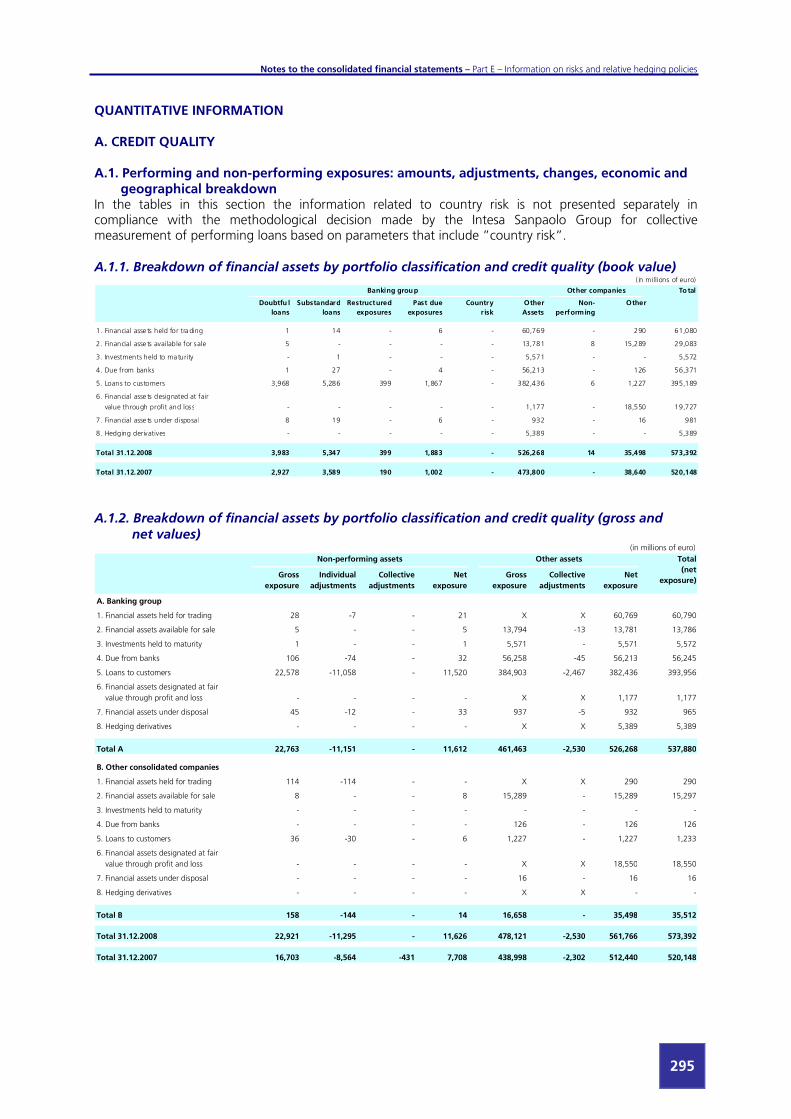
QUANTITATIVE INFORMATION A. CREDIT QUALITY A.1. Performing and non-performing exposures: amounts, adjustments, changes, economic and
geographical breakdown In the tables in this section the information related to country risk is not presented separately in compliance with the methodological decision made by the Intesa Sanpaolo Group for collective measurement of performing loans based on parameters that include ”country risk”. A.1.1. Breakdown of financial assets by portfolio classification and credit quality (book value)
( in millions of euro)
Total
Doubtfu l
loans
Substandard
loans
Restructured
exposures
Past due
exposures
Country
r isk
Other
Assets
Non-
performing
Other
1. Financial asse ts held for trading 1 14 - 6 - 60,769 - 290 61,080
2. Financial asse ts available for sale 5 - - - - 13,781 8 15,289 29,083
3. Investments held to maturity - 1 - - - 5,571 - - 5,572
4. Due from banks 1 27 - 4 - 56,213 - 126 56,371
5. Loans to customers 3,968 5,286 399 1,867 - 382,436 6 1,227 395,189
6. Financial asse ts designated at fair
value through profit and loss - - - - - 1,177 - 18,550 19,727
7. Financial asse ts under disposa l 8 19 - 6 - 932 - 16 981
8. Hedging derivatives - - - - - 5,389 - - 5,389
Total 31.12.2008 3,983 5,347 399 1,883 - 526,268 14 35,498 573,392
Total 31.12.2007 2,927 3,589 190 1,002 - 473,800 - 38,640 520,148
Banking group Other companies
A.1.2. Breakdown of financial assets by portfolio classification and credit quality (gross and
net values) (in millions of euro)
Gross
exposure
Individual
adjustments
Collective
adjustments
Net
exposure
Gross
exposure
Collective
adjustments
Net
exposure
A. Banking group
1. Financial assets held for trading 28 -7 - 21 X X 60,769 60,790
2. Financial assets available for sale 5 - - 5 13,794 -13 13,781 13,786
3. Investments held to maturity 1 - - 1 5,571 - 5,571 5,572
4. Due from banks 106 -74 - 32 56,258 -45 56,213 56,245
5. Loans to customers 22,578 -11,058 - 11,520 384,903 -2,467 382,436 393,956
6. Financial assets designated at fair
value through profit and loss - - - - X X 1,177 1,177
7. Financial assets under disposal 45 -12 - 33 937 -5 932 965
8. Hedging derivatives - - - - X X 5,389 5,389-
Total A 22,763 -11,151 - 11,612 461,463 -2,530 526,268 537,880
B. Other consolidated companies
1. Financial assets held for trading 114 -114 - - X X 290 290
2. Financial assets available for sale 8 - - 8 15,289 - 15,289 15,297
3. Investments held to maturity - - - - - - - -
4. Due from banks - - - - 126 - 126 126
5. Loans to customers 36 -30 - 6 1,227 - 1,227 1,233
6. Financial assets designated at fair
value through profit and loss - - - - X X 18,550 18,550
7. Financial assets under disposal - - - - 16 - 16 16
8. Hedging derivatives - - - - X X - - -
Total B 158 -144 - 14 16,658 - 35,498 35,512
Total 31.12.2008 22,921 -11,295 - 11,626 478,121 -2,530 561,766 573,392
Total 31.12.2007 16,703 -8,564 -431 7,708 438,998 -2,302 512,440 520,148
Non-performing assets Other assets Total
(net
exposure)

Notes to the consolidated financial statements – Part E – Information on risks and relative hedging policies
296
A.1.3. On- and off-balance sheet exposures to banks: gross and net values (in millions of euro)
Gross
exposure
Individual
adjustments
Collective
adjustments
Net
exposure
A. ON-BALANCE SHEET EXPOSURES
A.1 Banking group
a) Doubtful loans 15 -13 - 2
b) Substandard loans 90 -63 - 27
c) Restructured exposures - - - -
d) Past due exposures 4 - - 4
e) Country risk - X - -
f) Other assets 64,085 X -45 64,040
Total A.1 64,194 -76 -45 64,073
A.2 Other companies
a) Non-performing 82 -74 - 8
b) Other 2,425 - - 2,425
Total A.2 2,507 -74 - 2,433
TOTAL A 66,701 -150 -45 66,506
B. OFF-BALANCE SHEET EXPOSURES
B.1 Banking group
a) Non-performing 5 - - 5
b) Other 48,108 X -13 48,095
Total B.1 48,113 - -13 48,100
B.2 Other companies
a) Non-performing - - - -
b) Other - X - -
Total B.2 - - - -
TOTAL B 48,113 - -13 48,100

Notes to the consolidated financial statements – Part E – Information on risks and relative hedging policies
297
A.1.4. On-balance sheet exposures to banks: changes in non-performing exposures and gross exposures subject to “country risk”
(in millions of euro)
Doubtful
loans
Substandard
loans
Restructured
exposures
Past due
exposures
Country
risk
A. Initial gross exposure 7 - - 7 -
- of which exposures sold not derecognised - - - - -
B. Increases 8 92 - 4 -
B.1 inflows from performing exposures 4 92 - 6 -
B.2 transfers from other non-performing
exposure categories - - - - -
B.3 other increases 4 - - -2 -
B.4 business combinations - - - - -
C. Decreases - -2 - -7 -
C.1 outflows to performing exposures - - - - -
C.2 write-offs - - - - -
C.3 repayments - -2 - -7 -
C.4 credit disposals - - - - -
C.5 transfers to other non-performing
exposure categories - - - - -
C.6 other decreases - - - - -
C.7 business combinations - - - - -
D. Final gross exposure 15 90 - 4 -
- of which exposures sold not derecognised - - - - -
On-balance sheet exposures include all on-balance sheet financial assets, irrespective of their portfolio of allocation: trading, available for sale, held to maturity, loans, assets designated at fair value through profit and loss, discontinued operations. A.1.5. On-balance sheet exposures to banks: changes in total adjustments
(in millions of euro)
Doubtful
loans
Substandard
loans
Restructured
exposures
Past due
exposures
Country
risk
A. Initial total adjustments 7 - - - -
- of which exposures sold not derecognised - - - - -
B. Increases 6 63 - - -
B.1 impairment losses 6 63 - - -
B.2 transfers from other non-performing
exposure categories - - - - -
B.3 other increases - - - - -
B.4 business combinations - - - - -
C. Decreases - - - - -
C.1 recoveries on impairment losses - - - - -
C.2 recoveries on repayments - - - - -
C.3 write-offs - - - - -
C.4 transfers to other non-performing
exposure categories - - - - -
C.5 other decreases - - - - -
C.6 business combinations - - - - -
D. Final total adjustments 13 63 - - -
- of which exposures sold not derecognised - - - - -
On-balance sheet exposures include all on-balance sheet financial assets, irrespective of their portfolio of allocation: trading, available for sale, held to maturity, loans, assets designated at fair value through profit and loss, discontinued operations.

Notes to the consolidated financial statements – Part E – Information on risks and relative hedging policies
298
A.1.6. On- and off-balance sheet exposures to customers: gross and net values (in millions of euro)
Gross
exposure
Individual
adjustments
Collective
adjustments
Net
exposure
A. ON-BALANCE SHEET EXPOSURES
A.1 Banking group
a) Doubtful loans 13,048 -9,067 - 3,981
b) Substandard loans 7,018 -1,712 - 5,306
c) Restructured exposures 534 -135 - 399
d) Past due exposures 2,035 -161 - 1,874
e) Country risk - X - -
f) Other assets 417,088 X -2,488 414,600
Total A.1 439,723 -11,075 -2,488 426,160
A.2 Other companies
a) Non-performing 77 -70 - 7
b) Other 33,025 - - 33,025
Total A.2 33,102 -70 - 33,032
TOTAL A 472,825 -11,145 -2,488 459,192
B. OFF-BALANCE SHEET EXPOSURES
B.1 Banking group
a) Non-performing 767 -158 - 609
b) Other 133,009 X -292 132,717
Total B.1 133,776 -158 -292 133,326
B.2 Other companies
a) Non-performing - - - -
b) Other 6 X - 6
Total B.2 6 - - 6
TOTAL B 133,782 -158 -292 133,332

Notes to the consolidated financial statements – Part E – Information on risks and relative hedging policies
299
A.1.7. On-balance sheet exposures to customers: changes in non-performing exposures and gross exposures subject to “country risk”
(in millions of euro)
Doubtful
loans
Substandard
loans
Restructured
exposures
Past due
exposures
Country
risk
A. Initial gross exposure 10,267 5,019 262 1,120 -
- of which exposures sold not derecognised - - - - -
B. Increases 4,630 8,087 482 4,635 -
B.1 inflows from performing loans 775 4,869 253 3,877 -
B.2 transfers from other
non-performing exposure categories 2,542 1,713 147 94 -
B.3 other increases 977 1,299 65 431 -
B.4 business combinations 336 206 17 233 -
C. Decreases -1,849 -6,088 -210 -3,720 -
C.1 outflows to performing loans -106 -1,214 -10 -1,104 -
C.2 write-offs -557 -177 -72 -18 -
C.3 repayments -1,025 -1,885 -80 -818 -
C.4 credit disposals -58 -18 - - -
C.5 transfers to other
non-performing exposure categories -78 -2,709 -47 -1,689 -
C.6 other decreases -25 -85 -1 -91 -
C.7 business combinations - - - - -
D. Final gross exposure 13,048 7,018 534 2,035 -
- of which exposures sold not derecognised 9 15 - 7 -
On-balance sheet exposures include all on-balance sheet financial assets, irrespective of their portfolio of allocation: trading, available for sale, held to maturity, loans, assets designated at fair value through profit and loss, discontinued operations. A.1.8. On-balance sheet exposures to customers: changes in total adjustments
(in millions of euro)
Doubtful
loans
Substandard
loans
Restructured
exposures
Past due
exposures
Country
risk
A. Initial total adjustments 7,340 1,444 72 131 -
- of which exposures sold not derecognised - - - - -
B. Increases 3,185 1,764 168 271 -
B.1 impairment losses 1,839 1,359 93 210 -
B.2 transfers from other
non-performing exposure categories 618 186 63 16 -
B.3 other increases 488 159 8 38 -
B.4 business combinations 240 60 4 7 -
C. Decreases -1,458 -1,496 -105 -241 -
C.1 recoveries on impairment losses -415 -391 -9 -26 -
C.2 recoveries on repayments -309 -155 -3 -18 -
C.3 write-offs -557 -177 -72 -18 -
C.4 transfers to other
non-performing exposure categories -42 -683 -21 -145 -
C.5 other decreases -135 -90 - -34 -
C.6 business combinations - - - - -
D. Final total adjustments 9,067 1,712 135 161 -
- of which exposures sold not derecognised - - - - -
On-balance sheet exposures include all on-balance sheet financial assets, irrespective of their portfolio of allocation: trading, available for sale, held to maturity, loans, assets designated at fair value through profit and loss, discontinued operations.

Notes to the consolidated financial statements – Part E – Information on risks and relative hedging policies
300
A.2. Classification of exposures based on external and internal ratings A.2.1. Breakdown of on- and off-balance sheet exposures by external rating classes Breakdown of exposures by external rating class is based on ratings assigned by Standard and Poor's, Moody’s and Fitch; where two ratings for the one customer are available, the more prudential of the two is adopted and, where three are available, the intermediate. The ratings of the non-performing loans are included in the column “under B-“.
(in millions of euro)
AAA/AA- A+/A- BBB+/BBB- BB+/BB- B+/B- Under B-
A. On-balance sheet exposures 55,527 39,601 13,796 2,967 754 12,957 364,630 490,232
B. Derivatives 17,513 14,537 4,626 303 237 27 4,256 41,499
B.1. Financial derivatives 15,754 13,209 4,298 97 212 22 3,409 37,001
B.2. Credit derivatives 1,759 1,328 328 206 25 5 847 4,498
C. Guarantees given 5,352 2,593 2,978 996 84 454 40,847 53,304
D. Commitments to lend funds 7,885 4,101 4,636 1,232 1,443 596 66,728 86,621
Total 86,277 60,832 26,036 5,498 2,518 14,034 476,461 671,656
External rating classes Unrated Total
A.2.2. Breakdown of on- and off-balance sheet exposures by internal rating classes Breakdown of exposures by internal rating class is based on all ratings available in the credit risk management system. These ratings include credit ratings assigned by external agencies for counterparties in customer segments for which an internal model is not available. Unrated loans account for 35% of all loans and refer to customer segments for which a rating model is not yet available (loans to private parties), to counterparties for which the roll-out of new internal models is still underway, to Group companies whose mission is not related to credit and loans, and to international subsidiaries in Eastern Europe and other emerging nations, which have yet to be fully integrated into the credit risk management system. For the purposes of calculating the risk indicators, unrated counterparties are assigned an estimated rating on the basis of the average probabilities of default, deriving from the past experience of the respective sectors. When unrated counterparties and non-performing assets are excluded, rating classes at investment grade account for the majority, 68% of the total, whilst 21% fall within the BB+/BB- range and 11% fall under higher risk classes (of which around 1% are below B-).
(in millions of euro)
AAA/AA- A+/A- BBB+/BBB- BB+/BB- B+/B- Under B-
Non-
performing
exposures
A. On-balance sheet exposures 69,641 52,806 87,545 73,041 34,246 3,782 11,593 157,578 490,232
B. Derivatives 17,253 14,211 4,958 1,098 563 31 22 3,363 41,499
B.1. Financial derivatives 15,874 12,997 4,630 892 538 27 20 2,023 37,001
B.2. Credit derivatives 1,379 1,214 328 206 25 4 2 1,340 4,498
C. Guarantees given 6,334 6,656 9,922 10,184 3,400 490 415 15,903 53,304
D. Commitments to lend funds 8,157 5,101 8,189 5,374 2,864 171 177 56,588 86,621
Total 101,385 78,774 110,614 89,697 41,073 4,474 12,207 233,432 671,656
External rating classes Unrated Total

Notes to the consolidated financial statements – Part E – Information on risks and relative hedging policies
301
A.3. Breakdown of guaranteed exposures by type of guarantee A.3.1. Guaranteed on-balance sheet exposures to banks and customers
(in millions of euro)
TOTAL
Totally
guaranteed
Partly
guaranteed
Totally
guaranteed
Partly
guaranteed
EXPOSURE 23,759 458 188,887 30,810 243,914
COLLATERAL(1)
Real estate assets 8 1 128,442 2,161 130,612
Securities 23,195 2 13,184 2,637 39,018
Other assets 3 6 3,076 2,921 6,006
GUARANTEES (1)
Credit derivatives
Governments - - - - -
Other public entities - - - - -
Banks - - 30 11 41
Other counterparties - - - - -
Guarantees given
Governments 100 100 3,802 6,621 10,623
Other public entities 124 19 614 428 1,185
Banks 324 49 3,311 2,082 5,766
Other counterparties 9 178 45,213 6,281 51,681
TOTAL GUARANTEES (1) 23,763 355 197,672 23,142 244,932
(1) Fair value of the guarantee or, if difficult to determine, contractual value.
GUARANTEED EXPOSURES TO
BANKS
GUARANTEED EXPOSURES TO
CUSTOMERS
A.3.2. Guaranteed off-balance sheet exposures to banks and customers
(in millions of euro)
TOTAL
Totally
guaranteed
Partly
guaranteed
Totally
guaranteed
Partly
guaranteed
EXPOSURE 1,987 22 21,051 5,702 28,762
COLLATERAL(1)
Real estate assets 22 - 7,192 544 7,758
Securities 2 - 630 626 1,258
Other assets 2,371 4 1,054 221 3,650
GUARANTEES (1)
Credit derivatives
Governments - - - - -
Other public entities - - - - -
Banks - - - - -
Other counterparties - - - - -
Guarantees given
Governments - - 2,029 - 2,029
Other public entities 4 - 9 48 61
Banks 64 7 1,099 125 1,295
Other counterparties 47 - 9,333 1,186 10,566
TOTAL GUARANTEES (1) 2,510 11 21,346 2,750 26,617
(1) Fair value of the guarantee or, if difficult to determine, contractual value.
GUARANTEED EXPOSURES TO
BANKS
GUARANTEED EXPOSURES TO
CUSTOMERS

Notes to the consolidated financial statements – Part E – Information on risks and relative hedging policies
302
A.3.3. Non-performing guaranteed on-balance sheet exposures to banks and customers (in millions of euro)
Over 150% Between 100%
and 150%
Between 50%
and 100%
Up to 50% Over 150% Between 100%
and 150%
Between 50%
and 100%
Up to 50%
EXPOSURE - - - - 4,536 2,157 711 224
AMOUNT GUARANTEED - - - - 4,536 2,157 668 107
COLLATERAL(1)
Real estate assets - - - - 3,687 1,218 159 26
Securities - - - - 77 79 85 20
Other assets - - - - 27 33 38 6
GUARANTEES (1)
Credit derivatives
Governments and Central Banks - - - - - - - -
Other public entities - - - - - - - -
Banks - - - - - - - -
Financial institutions - - - - - - - -
Insurance companies - - - - - - - -
Non-financial companies - - - - - - - -
Other counterparties - - - - - - - -
Guarantees given
Governments and Central Banks - - - - 1 2 3 -
Other public entities - - - - 3 6 7 -
Banks - - - - 6 8 8 2
Financial institutions - - - - 31 4 15 2
Insurance companies - - - - 1 - 1 -
Non-financial companies - - - - 15 17 3 -
Other counterparties - - - - 1,940 825 355 59
TOTAL GUARANTEES (1)
- - - - 5,788 2,192 674 115
EXCESS FAIR VALUE GUARANTEE - - - - 1,252 35 6 8
(1) Fair value of the guarantee or, if difficult to determine, guaranteed exposure.
GUARANTEED EXPOSURES TO BANKS GUARANTEED EXPOSURES TO CUSTOMERS
A.3.4. Non-performing guaranteed off-balance sheet exposures to banks and customers
(in millions of euro)
Over 150% Between 100%
and 150%
Between 50%
and 100%
Up to 50% Over 150% Between 100%
and 150%
Between 50%
and 100%
Up to 50%
EXPOSURE - - - - 155 116 39 27
AMOUNT GUARANTEED - - - - 145 117 35 10
COLLATERAL(1)
Real estate assets - - - - 83 23 6 1
Securities - - - - 9 1 10 1
Other assets - - - - 3 2 3 1
GUARANTEES (1)
Credit derivatives
Governments and Central Banks - - - - - - - -
Other public entities - - - - - - - -
Banks - - - - - - - -
Financial institutions - - - - - - - -
Insurance companies - - - - - - - -
Non-financial companies - - - - - - - -
Other counterparties - - - - - - - -
Guarantees given
Governments and Central Banks - - - - - - - -
Other public entities - - - - - - 1 -
Banks - - - - 1 - - 6
Financial institutions - - - - - - - -
Insurance companies - - - - - - - -
Non-financial companies - - - - 3 - - -
Other counterparties - - - - 60 90 16 1
TOTAL GUARANTEES (1)
- - - - 159 116 36 10
EXCESS FAIR VALUE GUARANTEE - - - - 14 -1 1 -
(1) Fair value of the guarantee or, if difficult to determine, guaranteed exposure.
GUARANTEED EXPOSURES TO BANKS GUARANTEED EXPOSURES TO CUSTOMERS

Notes to the consolidated financial statements – Part E – Information on risks and relative hedging policies
303
B. BREAKDOWN AND CONCENTRATION OF LOANS B.1. Breakdown of on- and off-balance sheet exposures to customers by sector
(in millions of euro)
Doubtful
loans
Substandard
loans
Restructured
exposures
Past due
exposures
Other
exposures
Doubtful
loans
Substandard
loans
Restructured
exposures
Past due
exposures
Other
exposures
GOVERNMENTS AND
CENTRAL BANKS
Gross exposure 4 - - 11 22,608 22,623 - - - - 3,529 3,529 26,152 22,969
Individual impairment losses -2 - - - - -2 - - - - - - -2 -54
Collective impairment losses - - - - -6 -6 - - - - -1 -1 -7 -18
Net exposure 2 - - 11 22,602 22,615 - - - - 3,528 3,528 26,143 22,897
OTHER PUBLIC ENTITIES
Gross exposure 2 76 - 556 22,111 22,745 - - - - 3,773 3,773 26,518 26,170
Individual impairment losses -1 -6 - -12 - -19 - - - - - - -19 -1
Collective impairment losses - - - - -50 -50 - - - - -2 -2 -52 -49
Net exposure 1 70 - 544 22,061 22,676 - - - - 3,771 3,771 26,447 26,120
FINANCIAL INSTITUTIONS
Gross exposure 568 43 13 26 38,040 38,690 1 4 - - 17,121 17,126 55,816 52,587
Individual impairment losses -487 -17 -2 -9 - -515 - - - - - - -515 -361
Collective impairment losses - - - - -92 -92 - - - - -52 -52 -144 -122
Net exposure 81 26 11 17 37,948 38,083 1 4 - - 17,069 17,074 55,157 52,104
INSURANCE COMPANIES
Gross exposure - - - - 2,980 2,980 - - - - 2,069 2,069 5,049 5,949
Individual impairment losses - - - - - - - - - - - - - -
Collective impairment losses - - - - -2 -2 - - - - -4 -4 -6 -7
Net exposure - - - - 2,978 2,978 - - - - 2,065 2,065 5,043 5,942
NON-FINANCIAL
COMPANIES
Gross exposure 9,509 4,958 521 982 233,468 249,438 217 424 - 110 99,787 100,538 349,976 353,229
Individual impairment losses -6,606 -1,252 -133 -68 - -8,059 -85 -56 - -16 - -157 -8,216 -6,818
Collective impairment losses - - - - -1,909 -1,909 - - - - -190 -190 -2,099 -2,035
Net exposure 2,903 3,706 388 914 231,559 239,470 132 368 - 94 99,597 100,191 339,661 344,376
OTHER COUNTERPARTIES
Gross exposure 2,965 1,941 - 460 97,881 103,247 1 7 - 3 6,730 6,741 109,988 99,883
Individual impairment losses -1,971 -437 - -72 - -2,480 - -1 - - - -1 -2,481 -1,525
Collective impairment losses - - - - -433 -433 - - - - -43 -43 -476 -768
Net exposure 994 1,504 - 388 97,448 100,334 1 6 - 3 6,687 6,697 107,031 97,590
TOTAL OFF-
BALANCE
SHEET
EXPOSURES
TOTAL
31.12.2008
TOTAL
31.12.2007
OFF-BALANCE SHEET EXPOSURESON-BALANCE SHEET EXPOSURES TOTAL ON-
BALANCE
SHEET
EXPOSURES
B.2. Breakdown of on- and off-balance sheet exposures to customers by geographical area
(book value) (in millions of euro)
gross net gross net gross net gross net gross net
A. ON-BALANCE SHEET
EXPOSURES
A.1. Doubtful loans 11,527 3,727 1,094 209 97 21 43 9 295 23
A.2. Substandard loans 6,025 4,605 861 628 63 28 10 - 52 36
A.3. Restructured exposures 493 363 39 35 - - 2 1 - -
A.4. Past due exposures 2,008 1,855 23 15 3 3 1 1 - -
A.5. Other exposures 334,957 332,989 63,213 62,770 8,079 8,060 4,539 4,529 6,302 6,251
Total A 355,010 343,539 65,230 63,657 8,242 8,112 4,595 4,540 6,649 6,310
B. OFF-BALANCE SHEET
EXPOSURES
B.1. Doubtful loans 175 125 14 8 - - - - 29 -
B.2. Substandard loans 378 323 54 52 1 1 - - 2 2
B.3. Restructured exposures - - - - - - - - - -
B.4. Past due exposures 111 95 - - - - 3 3 - -
B.5. Other exposures 65,706 65,552 44,466 44,344 20,883 20,875 1,226 1,224 728 722
Total B 66,370 66,095 44,534 44,404 20,884 20,876 1,229 1,227 759 724
TOTAL (A+B) 31.12.2008 421,380 409,634 109,764 108,061 29,126 28,988 5,824 5,767 7,408 7,034
TOTAL 31.12.2007 402,071 392,070 123,116 121,824 25,853 25,791 3,890 3,855 5,857 5,489
ITALY OTHER EUROPEAN
COUNTRIES
AMERICA
exposure exposure exposure exposure exposure
ASIA REST OF
THE WORLD

Notes to the consolidated financial statements – Part E – Information on risks and relative hedging policies
304
B.3. Breakdown of on- and off-balance sheet exposures to banks by geographical area (book value)
(in millions of euro)
gross net gross net gross net gross net gross net
A. ON-BALANCE SHEET
EXPOSURES
A.1. Doubtful loans 1 - 6 - 8 2 - - - -
A.2. Substandard loans - - 90 27 - - - - - -
A.3. Restructured exposures - - - - - - - - - -
A.4. Past due exposures - - 4 4 - - - - - -
A.5. Other exposures 17,133 17,131 38,485 38,452 3,114 3,111 2,779 2,774 2,573 2,571
Total A 17,134 17,131 38,585 38,483 3,122 3,113 2,779 2,774 2,573 2,571
B. OFF-BALANCE SHEET
EXPOSURES
B.1. Doubtful loans - - - - - - - - - -
B.2. Substandard loans - - - - 1 1 - - - -
B.3. Restructured exposures - - - - - - - - - -
B.4. Past due exposures - - 4 4 - - - - - -
B.5. Other exposures 14,178 14,178 30,121 30,116 1,585 1,584 1,940 1,934 284 283
Total B 14,178 14,178 30,125 30,120 1,586 1,585 1,940 1,934 284 283
TOTAL (A+B) 31.12.2008 31,312 31,309 68,710 68,603 4,708 4,698 4,719 4,708 2,857 2,854
TOTAL 31.12.2007 27,834 27,830 55,795 55,746 5,201 5,197 4,046 4,035 3,818 3,816
ITALY OTHER EUROPEAN
COUNTRIES
AMERICA
exposure exposure exposure exposure exposure
ASIA REST OF
THE WORLD
B.4. Large credit risks
Large risks
a) Amount (in millions of euro) 10,959
b) Number 2

Notes to the consolidated financial statements – Part E – Information on risks and relative hedging policies
305
C. SECURITISATIONS AND ASSET SALES C.1. Securitisations Qualitative information Securitisations structured in the year are described in the paragraphs below. Adriano Finance On 4 August 2008, a securitisation was completed of a portfolio of performing residential mortgages through the vehicle Adriano Finance. The structuring of the transaction was carried out by Intesa Sanpaolo and Banca IMI as Arrangers. Adriano Finance issued RMBS securities at par (Adriano Finance F/R Notes due December 2055) for a total amount of 7,998 million euro, made up as follows: – Class A for an amount of 7,558 million euro (senior tranche); – Class B for an amount of 440 million euro (junior tranche). The Class A notes (with an expected average lifetime of 4.9 years), eligible for ECB refinancing operations, are quoted on the Luxembourg Stock Exchange and have obtained a AAA rating from both the Standard & Poor’s and Moody’s agencies. The Class B notes on the other hand are unrated. Both classes of Notes have been fully underwritten by Intesa Sanpaolo. The transaction’s financial structure provides for the half-yearly payment of interest on 5 February and 5 August of each year. The first coupon was paid on 5 February 2009, whereas the repayment of the principal will start, after 18 months from the issue, from the payment date of 5 February 2010. The Bank also granted the vehicle a subordinated loan with limited recourse (with the same maturity date as the legal maturity for the notes) for an amount of 50 million euro that was used on the date of the issue of the notes to establish the Cash Reserve required by the Rating Agencies. Given that the securities in question have not been sold definitively to parties outside the Group, in accordance with the IAS/IFRS the conditions have not been met for the derecognition of the underlying loans with respect to which the Group continues to maintain all the risks and benefits and that are, therefore, still recorded under the consolidated balance sheet assets. On 18 December 2008, a second securitisation was completed, again through the vehicle Adriano Finance, of a portfolio of performing residential mortgages. The structuring of the transaction was performed by Intesa Sanpaolo as Arranger. Adriano Finance issued RMBS notes with a price corresponding to 100% of their nominal amount (Adriano Finance F/R Notes due December 2058) for a total amount of 5,679 million euro, made up as follows: – Class A for an amount of 5,281 million euro (senior tranche); – Class B for an amount of 398 million euro (junior tranche). For the Class A notes, with an average expected lifetime of 4.9 years, quoted on the Luxembourg Stock Exchange and assigned a AAA rating by Standard & Poor’s, a request has been made to the Luxembourg central bank for eligibility for use for ECB refinancing operations. The Class B notes on the other hand are unrated. Both classes of Notes have been fully underwritten by Intesa Sanpaolo. The transaction’s financial structure provides for the half-yearly payment of interest on 31 January and 31 July of each year. The first coupon will be paid on 31 July 2009, whereas the repayment of the principal will start, after at least 18 months from the issue, from the payment date of 31 July 2010. The Bank also granted the vehicle a subordinated loan with limited recourse (with the same maturity date as the legal maturity for the notes) for an amount of 50 million euro that was used on the date of the issue of the notes to establish the Cash Reserve required by Standard & Poor’s. Given that the securities in question have not been sold definitively to parties outside the Group, in accordance with the IAS/IFRS the conditions have not been met for the derecognition of the underlying loans with respect to which the Group continues to maintain all the risks and benefits and that are, therefore, still recorded under the consolidated balance sheet assets. Adriano Finance 2 On 31 December 2008, a securitisation was completed of a portfolio of performing residential mortgages through the vehicle Adriano Finance 2. The structuring of the transaction was performed by Intesa Sanpaolo and Banca IMI as Arrangers. Adriano Finance 2 issued RMBS notes with a price corresponding to 100% of their nominal amount (Adriano Finance F/R Notes due June 2061) for a total amount of 13,050 million euro, made up as follows:

Notes to the consolidated financial statements – Part E – Information on risks and relative hedging policies
306
– Class A for an amount of 12,174 million euro (senior tranche); – Class B for an amount of 876 million euro (junior tranche). For the Class A notes, with an average expected lifetime of 5 years, quoted on the Luxembourg Stock Exchange and assigned a AAA rating by Fitch, a request has already been made to the Luxembourg central bank for eligibility for use for ECB refinancing operations. The Class B notes are unrated. The transaction’s financial structure provides for the half-yearly payment of interest on 29 January and 29 July of each year. The first coupon will be paid on 29 July 2009, whereas the repayment of the principal will start, after at least 18 months from the issue, from the payment date of 29 July 2010. The Bank also granted the vehicle a subordinated loan with limited recourse (with the same maturity date as the legal maturity for the notes) for an amount of 150 million euro that was used on the date of the issue of the notes to establish the Cash Reserve required by Fitch. Given that the securities in question have not been sold definitively to parties outside the Group, in accordance with the IAS/IFRS the conditions have not been met for the derecognition of the underlying loans with respect to which the Group continues to maintain all the risks and benefits and that are, therefore, still recorded in the consolidated balance sheet assets. SPQRII In July 2008, in order to reduce the overall cost of funding and increase the level of liquidity of its assets, Banca IMI completed a securitisation of securities recorded under financial assets held for trading, aimed at making the portfolio sold more effective for the purposes of funding from the European Central Bank. This transaction included the sale without recourse to SPQR II S.r.l. (a multi-segment Special Purpose Vehicle regulated by Law 130/99, already used for a similar transaction originated by the former Banca OPI) of a portfolio of bonds issued by Italian and foreign banks, insurance companies, corporates and securitisation vehicles, for a market value of around 747.8 million euro. SPQR II in turn issued: – Class A senior notes for 696,250,000 euro, with an A rating (Fitch Ratings) and quoted on the
Luxembourg stock exchange; – Class D junior notes for 82,195,000 euro, without a rating and unquoted. Both classes were subscribed for by Banca IMI at nominal value, and because the Company had consequently substantially maintained all the risks and benefits attached to the transferred assets, the transaction was not derecognised in these financial statements. From an operational perspective, the Senior class was set aside with the European Central Bank by means of repurchase agreements carried out through the Parent Company Intesa Sanpaolo. For this transaction Banca IMI acted as originator, sole arranger, lead manager and swap counterparty for the hedging. It also supported the credit enhancement of the overall structure, through a subordinated loan agreement commitment for a maximum amount of 100 million euro, which could be requested by SPQR II S.r.l. when certain conditions were met. Banca IMI also undertook the role of servicer. On 23 December 2008, Banca Infrastrutture Innovazione e Sviluppo (BIIS) carried out a securitisation of one of its portfolios for 1,330 million euro, consisting of bonds issued by Italian local authorities (municipal, provincial and regional) through the vehicle SPQR II, as part of the prudential enhancement of the already broad availability of the Intesa Sanpaolo Group’s eligible assets for the Central Banks. The structuring of the transaction was performed by Banca IMI as Arranger. Banca IMI was responsible for the offer of securities, as Lead Manager and Book Runner. The transaction consists of one single senior tranche (class A) of 1,238 million euro, with an expected average lifetime of 9.3 years, quoted on the Luxembourg Stock Exchange and rated A by Fitch Ratings, and one junior tranche (class D) of 92 million euro. The Notes are issued at a price equal to 100% of the nominal amount of the Notes and pay a floating rate coupon based on the 6 month Euribor rate. Both classes of notes were purchased in full by BIIS. Given that the securities in question have not been sold definitively to parties outside the Group, in accordance with the IAS/IFRS the conditions have not been met for the derecognition of the underlying loans with respect to which the Group continues to maintain all the risks and benefits and that are, therefore, still recorded in the consolidated balance sheet assets.

Notes to the consolidated financial statements – Part E – Information on risks and relative hedging policies
307
CR Firenze Mutui Although not realised during the year, please note that Carifirenze, consolidated for the first time in the complete financial statements of the Intesa Sanpaolo Group, as at the year end had an outstanding securitisation relating to “performing” mortgages, carried out in the fourth quarter of 2002, through the special purpose vehicle CR Firenze Mutui S.r.l.. For this transaction the vehicle had issued securities for 521 million euro. As at the year end date the securities issued amounted to 197.8 million euro. Of these, Carifirenze kept the entire junior tranche (class D) of 8.2 million euro in its portfolio. With regard to the performance of the transaction, as at the year end, in consideration of the residual value of the securitised loans and outstanding commitments, a value adjustment was made to the class “D” notes with the recognition in the income statement of the amount of 1.4 million euro, including 0.3 million euro from the reversal to the income statement of the valuation reserve. For these securities, monitoring is performed on a quarterly basis of the performance of the transaction, in order to determine the valuation of the class “D” notes included in the Bank’s portfolio, and to adjust them to their estimated realisable value. Quantitative information Please note that the tables below (with the exception of those of paragraph C.1.8) do not include the transactions in which the Group, as originator, has fully repurchased the securities issued by the vehicle used for the securitisation (self-securitisations). These involved, as at 31 December 2008, the transactions carried out through the vehicles Adriano Finance, Adriano Finance 2 and SPQR II. For this type of transaction, as stated in the paragraphs above, given that the securities in question have not been sold definitively to parties outside the Group, in accordance with the IAS/IFRS the conditions have not been met for the derecognition of the underlying loans with respect to which the Group continues to maintain all the risks and benefits and that are, therefore, still recorded under the consolidated balance sheet assets. C.1.1. Breakdown of exposures deriving from securitisations by quality of underlying asset On-balance sheet
(in millions of euro)
gross net gross net gross net
A. Originated underlying assets 241 230 146 133 116 107
a) Non-performing - - 63 54 22 16
b) Other 241 230 83 79 94 91
B. Third party underlying assets 5,475 5,135 749 664 67 65
a) Non-performing - - - - - -
b) Other 5,475 5,135 749 664 67 65
Total 5,716 5,365 895 797 183 172
On-balance sheet exposures
Senior Mezzanine Junior
exposure exposure exposure
Part of the positions shown in the table above has been included within the structured credit products: 3,607 million euro of gross exposures and 3,185 million euro net, in any case almost entirely attributable to exposures not included in US subprime exposures. For further information on the relative economic and risk effects, see the chapter on market risks in this Part of the Notes to the consolidated financial statements.

Notes to the consolidated financial statements – Part E – Information on risks and relative hedging policies
308
Off- balance sheet (in millions of euro)
gross net gross net gross net gross net gross net gross net
A. Originated underlying assets 13 13 - - 19 19 - - - - - -
a) Non-performing - - - - - - - - - - - -
b) Other 13 13 - - 19 19 - - - - - -
B. Third party underlying assets - - 70 70 2 2 - - 774 774 - -
a) Non-performing - - - - - - - - - - - -
b) Other - - 70 70 2 2 - - 774 774 - -
TOTAL 13 13 70 70 21 21 - - 774 774 - -
exposure
Guarantees given Credit lines
Senior Mezzanine Junior Senior Mezzanine Junior
exposureexposure exposure exposure exposure
C.1.2. Breakdown of exposures deriving from main “originated” securitisations by type of
securitised asset and by type of exposure On-balance sheet
(in millions of euro)
Book
value
Adjust./
recoveries
Book
value
Adjust./
recoveries
Book
value
Adjust./
recoveries
A. Fully derecognised 42 - 59 -8 62 -9
A.1 Intesa Lease Sec
- performing leasing contracts 25 - - - - -
A.2 Intesa Sec 2
- performing residential mortgages 15 - 5 - 31 -
A.3 Intesa Sec
- performing mortgages - - - - 8 -1
A.4 Intesa Sec Npl
- doubtful mortgages - - 54 -8 16 -6
A.5 Cr Firenze Mutui
- performing mortgages 2 - - - 7 -2
B. Partly derecognised - - - - - -
C. Not derecognised 188 -11 74 -5 45 -
C.1 Intesa Sec 3
- performing residential mortgages 165 -7 - - 27 -
C.2 Da Vinci
- Loans to the aircraft sector 2 -4 1 -1 - -
C.3 Vespucci
- - 70 -4 - -
C.4 Split 2
- performing leasing contracts 21 - 3 - 18 -
TOTAL 230 -11 133 -13 107 -9
- Asset backed securities and
collateralised debt obligations
On-balance sheet exposures
Senior Mezzanine Junior
The securitisations in the previous table include those for which the Group availed itself of the exemption from compliance to IAS/IFRS permitted on first-time adoption by IFRS 1. Based on such exemption, assets or liabilities sold and derecognised, based on previous accounting principles and deriving from securitisations prior to 1 January 2004, have not been recorded in the financial statements, even if derecognition does not meet the requirements of IAS 39.

Notes to the consolidated financial statements – Part E – Information on risks and relative hedging policies
309
Off- balance sheet (in millions of euro)
Book
value
Adjust./
recoveries
Book
value
Adjust./
recoveries
Book
value
Adjust./
recoveries
Book
value
Adjust./
recoveries
Book
value
Adjust./
recoveries
Book
value
Adjust./
recoveries
A. Fully derecognised 13 - - - - - - - - - - -
A.1 Intesa Sec
- performing mortgages 13 - - - - - - - - - - -
A.2 Intesa Sec Npl
- doubtful mortgages - - - - - - - - - - - -
B. Partly derecognised - - - - - - - - - - - -
C. Not derecognised - - - - 19 - - - - - - -
C.1 Da Vinci
- loans to the aircraft
and aeronautical sector - - - - 19 - - - - - - -
TOTAL 13 - - - 19 - - - - - - -
Guarantees given Credit lines
Senior Mezzanine Junior Senior Mezzanine Junior

Notes to the consolidated financial statements – Part E – Information on risks and relative hedging policies
310
C.1.3. Breakdown of exposures deriving from main “third party” securitisations by type of securitised asset and by type of exposure
On-balance sheet
(in millions of euro)
Book
value
Adjust./
recoveries
Book
value
Adjust./
recoveries
Book
value
Adjust./
recoveries
A.1 AYT Cedulas
- public sector financing 295 -2 - - - -
A.2 Capital Mortgages
- residential mortgages 59 -1 4 - - -
A.3 Cartesio
- loans 122 - - - - -
A.4 Cordusio RMBS Securitisation
- residential mortgages 57 - 11 -2 - -
A.5 CPG tranche AEM
- public utilities 52 - - - - -
A.6 D'Annunzio
- trade receivables 185 - - - - -
A.7 Duchess (*)
- securities 119 -59 - - - -
A.8 Euterpe
- amounts due from tax authorities - utilities 145 - - - - -
A.9 Fondo Immobili Pubblici
- public real estate assets 84 -2 173 -6 - -
A.10 Geldilux
- loans 235 -3 - - - -
A.11 Posillipo Finance
- securities 199 - - - - -
A.12 Rhodium (*)
- securities 74 -12 - - - -
A.13 Santander Hipotecario
- residential mortgages 51 - - - - -
A.14 Soc. Cart. Crediti INPS
- social security contributions 495 -1 - - - -
A.15 Smstr (*)
- securities 57 -35 - - - -
A.16 Società di Cartolarizzazione Italiana
Crediti 1
- personal loans 205 - - - - -
A.17 Stone tower (*)
- securities 55 -3 - - - -
A.18 Duomo portfolio 489 - 3 - - -
A.19 Romulus portfolio 398 -33 4 - - -
A.20 Single management portfolio of investment grade ABS 101 - - - - -
A.21 Residual portfolio divided in 406 securities 1,658 -189 (**) 469 -77 (***) 65 -2
TOTAL 5,135 -340 664 -85 65 -2
(*) Position included in packages, whose credit risk is entirely hedged by a specific credit default swap (CDS). The adjustment highlighted was, therefore, practically identical to the positive
fair value of the derivative. For further information on the relevant economic and risk impacts, please see the paragraph of the Notes to the consolidated financial statements dedicated to
structured credit products.
(**) Of which -9 million euro related to securities included in packages.
(***) Of which -42 million euro related to securities included in packages.
On-balance sheet exposures
Senior Mezzanine Junior

Notes to the consolidated financial statements – Part E – Information on risks and relative hedging policies
311
Off- balance sheet (in millions of euro)
Book
value
Adjust./
recoveries
Book
value
Adjust./
recoveries
Book
value
Adjust./
recoveries
Book
value
Adjust./
recoveries
Book
value
Adjust./
recoveries
Book
value
Adjust./
recoveries
A.1 Duomo
- Asset Backed Securities and Collateralised
debt obligations - - - - - - - - - - - -
A.2 Manzoni
- Asset Backed Securities - - - - 2 - - - - - - -
A.3 Romulus
- Asset Backed Securities and Collateralised
debt obligations - - 70 - - - - - 774 - - -
Total - - 70 - 2 - - - 774 - - -
Guarantees given Credit lines
Senior Mezzanine Junior Senior JuniorMezzanine
C.1.4. Breakdown of exposures to securitisations by financial assets portfolio and by type
(in millions of euro)
Senior Mezzanine Junior Senior Mezzanine Junior
Financial assets held for trading 936 82 13 - - -
Financial assets measured at fair value - - - - - -
Financial assets available for sale 247 62 43 - - -
Investments held to maturity 120 - - - - -
Loans (**)
3,874 579 71 13 844 2
Total 31.12.2008 5,177 723 127 13 844 2
Total 31.12.2007 6,978 770 130 13 1,233 2
(**) This caption includes off-balance sheet exposures referred to "Guarantees given" and "Credit lines".
(*) Excluding on- and off-balance sheet exposures deriving from originated securitisations in which assets sold have not been fully derecognised from assets
for a total respectively of 307 million euro and of 19 million euro.
On-balance sheet exposures (*) Off-balance sheet exposures

Notes to the consolidated financial statements – Part E – Information on risks and relative hedging policies
312
C.1.5. Total amount of securitised assets underlying junior securities or other forms of backing
(in millions of euro)
Traditional
securitisations
Synthetic
securitisations
A. Originated underlying assets 1,922 384
A.1 Fully derecognised 390 X
1. Doubtful loans 86 X
2. Substandard loans 2 X
3. Restructured exposures - X
4. Past due exposures - X
5. Other assets 302 X
A.2 Partly derecognised - X
1. Doubtful loans - X
2. Substandard loans - X
3. Restructured exposures - X
4. Past due exposures - X
5. Other assets - X
A.3 Not derecognised 1,532 384
1. Doubtful loans 6 -
2. Substandard loans 8 -
3. Restructured exposures - -
4. Past due exposures 4 -
5. Other assets 1,514 384
B. Third party underlying assets 1,413 100
B.1. Doubtful loans - -
B.2. Substandard loans - -
B.3. Restructured exposures - -
B.4. Past due exposures 2 -
B.5. Other assets 1,411 100
C.1.6. Interests in special purpose vehicles
Name Direct ownership Registered office % Stake
Intesa Lease Sec Intesa Sanpaolo Milano 60.00%
Intesa Sec Intesa Sanpaolo Milano 60.00%
Intesa Sec 2 Intesa Sanpaolo Milano 60.00%
Intesa Sec 3 Intesa Sanpaolo Milano 60.00%
Intesa Sec Npl Intesa Sanpaolo Milano 60.00%
Augusto Intesa Sanpaolo Milano 5.00%
Adriano Finance Intesa Sanpaolo Milano 5.00%
Adriano Finance 2 Intesa Sanpaolo Milano 5.00%
Adriano Finance 3 Intesa Sanpaolo Milano 5.00%
Colombo Intesa Sanpaolo Milano 5.00%
Diocleziano Intesa Sanpaolo Milano 5.00%
CR Firenze Mutui CR Firenze Conegliano Veneto 10.00%
The vehicles ISP CB Ipotecario, ISP CB Pubblico and Intesa Sec 4, were formed in 2007 to support future securitisations. They are wholly owned
by the Parent Company and have registered offices in Milano.

Notes to the consolidated financial statements – Part E – Information on risks and relative hedging policies
313
C.1.7. Servicer activities – collection of securitised loans and repayment of securities issued by
special purpose vehicles
Servicer Special purpose vehicles
Non-
performing
Performing Non-
performing
Performing Non-
performing
Performing Non-
performing
Performing Non-
performing
Performing
Intesa Sanpaolo Intesa Sec - 20 - 20 - 100 - 93 - -
Intesa Sanpaolo Intesa Sec 2 - 487 - 219 - 79 - - - -
Italfondiario Intesa Sec Npl 84 17 56 - 100 - 44 - - -
Intesa Sanpaolo Intesa Sec 3 19 2,417 - 767 - 31 - - - -
Leasint Split 2 10 604 - 399 - 66 - - - -
Leasint Intesa Lease Sec - 261 - 209 - 88 - - - -
CR Firenze CR Firenze Mutui 4 184 - 65 - 68 - - - -
Total 117 3,990 56 1,679
Percentage of reimbursed securities (period-end figure)
Senior
Collections of loans
in the year
(in millions of euro)
Securitised assets
(in millions of euro)
Mezzanine Junior
C.1.8. Banking group’s special purpose vehicles Intesa Sec Securitisation of performing mortgages
(in millions of euro)
A. Securitised assets 20
A.1 Loans 18
- loans outstanding 17
- past due loans 1
A.2 Securities -
A.3 Other assets 2
- accrued income on IRS 1
- other loans 1
B. Investments of the funds collected from
loan management 10
B.1 Debt securities -
B.2 Equities -
B.3 Liquidity 10
C. Securities issued 25
C.1 Class A1 -
C.2 Class A2 10
C.3 Class B 7
C.4 Class C 8
D. Financing received 2
E. Other liabilities 3
E.1 Due to Parent Company -
E.2 Accrued expenses – interest on securities issued 1
E.3 Accrued expenses on IRS 1
E.4 “Additional return” allowance 1
F. Interest expense on securities issued 2
G. Commissions and fees -
G.1 Servicing -
G.2 Other services -
H. Other expenses 2
H.1 Interest expense 2
H.2 Additional return -
I. Interest income on securitised assets 2
L. Other revenues 2
L.1 Interest income 2

Notes to the consolidated financial statements – Part E – Information on risks and relative hedging policies
314
Intesa Sec 2 Securitisation of performing residential mortgages
(in millions of euro)
A. Securitised assets 487
A.1 Loans 470
- loans outstanding 450
- past due loans 20
A.2 Securities -
A.3 Other assets 17
- accrued income on IRS 2
- suspended items for DPP 9
- tax credits 6
B. Investments of the funds collected from
loan management 82
B.1 Debt securities -
B.2 Equities -
B.3 Liquidity 82
C. Securities issued 504
C.1 Class A1 -
C.2 Class A2 402
C.3 Class B 41
C.4 Class C 61
D. Financing received 19
E. Other liabilities 18
E.1 Due to Parent Company 4
E.2 Other DPP liabilities 9
E.3 Accrued expenses – interest on securities issued 2
E.4 Accrued expenses on IRS 3
F. Interest expense on securities issued 31
G. Commissions and fees 1
G.1 Servicing 1
G.2 Other services -
H. Other expenses 44
H.1 Interest expense 35
H.2 Cost of liquidation DPP of the period 9
I. Interest income on securitised assets 35
L. Other revenues 41
L.1 Interest income 41
L.2 Revenues from penalties for advanced extinguishment and other -

Notes to the consolidated financial statements – Part E – Information on risks and relative hedging policies
315
Intesa Sec 3 Securitisation of performing residential mortgages
(in millions of euro)
A. Securitised assets 2,436
A.1 Loans 2,411
- loans outstanding 2,371
- past due loans 40
A.2 Securities -
A.3 Other assets 25
- accrued income on IRS 24
- tax credits/ others 1
B. Investments of the funds collected from
loan management 236
B.1 Debt securities -
B.2 Equities -
B.3 Liquidity 236
C. Securities issued 2,551
C.1 class A1 182
C.2 Class A2 1,275
C.3 Class A3 948
C.4 Class B 73
C.5 Class C 73
D. Financing received 23
E. Other liabilities 86
E.1 Due to Parent Company 1
E.2 Allowance for “additional return” 35
E.3 Accrued expenses – interest on securities issued 22
E.4 Accrued expenses on IRS 28
F. Interest expense on securities issued 170
G. Commissions and fees 4
G.1 Servicing 4
G.2 Securities placement commissions -
H. Other expenses 180
H.1 Interest expense 147
H.2 Additional return 33
I. Interest income on securitised assets 166
L. Other revenues 186
L.1 Interest income 184
L.2 Revenues from penalties for advanced extinguishment and other 2

Notes to the consolidated financial statements – Part E – Information on risks and relative hedging policies
316
Intesa Sec Npl Securitisation of non-performing mortgages
(in millions of euro)
A. Securitised assets 101
A.1 Loans 93
- loans outstanding 1
- past due loans 84
- loans for overdue interest 8
A.2 Securities -
A.3 Other assets 8
- cap premium paid 6
- other loans 2
B. Investments of the funds collected from
loan management 21
B.1 Debt securities -
B.2 Equities -
B.3 Liquidity 21
C. Securities issued 159
C.1 Class A -
C.2 Class B -
C.3 Class C 118
C.4 Class D 41
C.5 Class E -
D. Financing received 2
E. Other liabilities 20
E.1 Amounts due for services rendered 3
E.2 Accrued expenses – interest on securities issued 15
E.3 Other accrued expenses -
E.4 Floor option premium 2
F. Interest expense on securities issued 15
G. Commissions and fees 3
G.1 Servicing 3
G.2 Other services -
H. Other expenses 18
H.1 Interest expense 1
H.2 Other expenses 3
H.3 Losses on overdue interest 11
H.4 Forecasted losses on loans 3
I. Interest income on securitised assets 18
L. Other revenues 28
L.1 Interest income 1
L.2 Recovery of legal expenses 1
L.3 Write-backs 26

Notes to the consolidated financial statements – Part E – Information on risks and relative hedging policies
317
Split 2 Securitisation of loans arising from leasing contracts
(in millions of euro)
A. Securitised assets 614
A.1 Loans 614
A.2 Securities -
A.3 Other assets -
B. Investments of the funds collected from
loan management 116
B.1 Debt securities -
B.2 Equities -
B.3 Liquidity 116
C. Securities issued 705
C.1 Class A 577
C.2 Class B 64
C.3 Class C 46
C.4 Class D 18
D. Financing received -
E. Other liabilities 23
F. Interest expense on securities issued 42
G. Commissions and fees 1
G.1 Servicing 1
G.2 Other services -
H. Other expenses 1
I. Interest income on securitised assets 38
L. Other revenues 5

Notes to the consolidated financial statements – Part E – Information on risks and relative hedging policies
318
SPQR II (CBO 1 transaction) Performing securities AFS issued by public entities
(in millions of euro)
A. Securitised assets 1,834
A.1 Loans -
A.2 Securities 1,834
A.3 Other assets -
B. Investments of the funds collected from
loan management 180
B.1 Debt securities -
B.2 Equities -
B.3 Liquidity 17
B.4 Investments and cash equivalents 121
B.5 Accrued income and prepaid expenses 42
C. Securities issued 1,917
C.1 Class A1 1,850
C.4 Class D 67
D. Financing received -
E. Other liabilities 97
E.1 Accrued expenses and deferred income 82
E.2 Due to the originator 15
F. Interest expense on securities issued 99
G. Commissions and fees -
H. Other expenses 7
I. Interest income on securitised assets 84
L. Other revenues 22

Notes to the consolidated financial statements – Part E – Information on risks and relative hedging policies
319
SPQR II (CBO 2 transaction) Performing securities AFS issued by public entities
(milioni di euro)
A. Securitised assets 1,309
A.1 Loans -
A.2 Securities 1,307
A.3 Other assets 2
B. Investments of the funds collected
from loan management 53
B.1 Debt securities -
B.2 Equities -
B.3 Liquidity 52
B.4 Investments and cash equivalents -
B.5 Accrued income and prepaid expenses 1
C. Securities issued 1,330
C.1 Class A1 1,238
C.4 Class D 92
D. Financing received -
E. Other liabilities 32
E.1 Accrued expenses and deferred income 2
E.2 Due to the originator 30
F. Interest expense on securities issued 1
G. Commissions and fees -
H. Other expenses 10
I. Interest income on securitised assets 11
L. Other revenues -
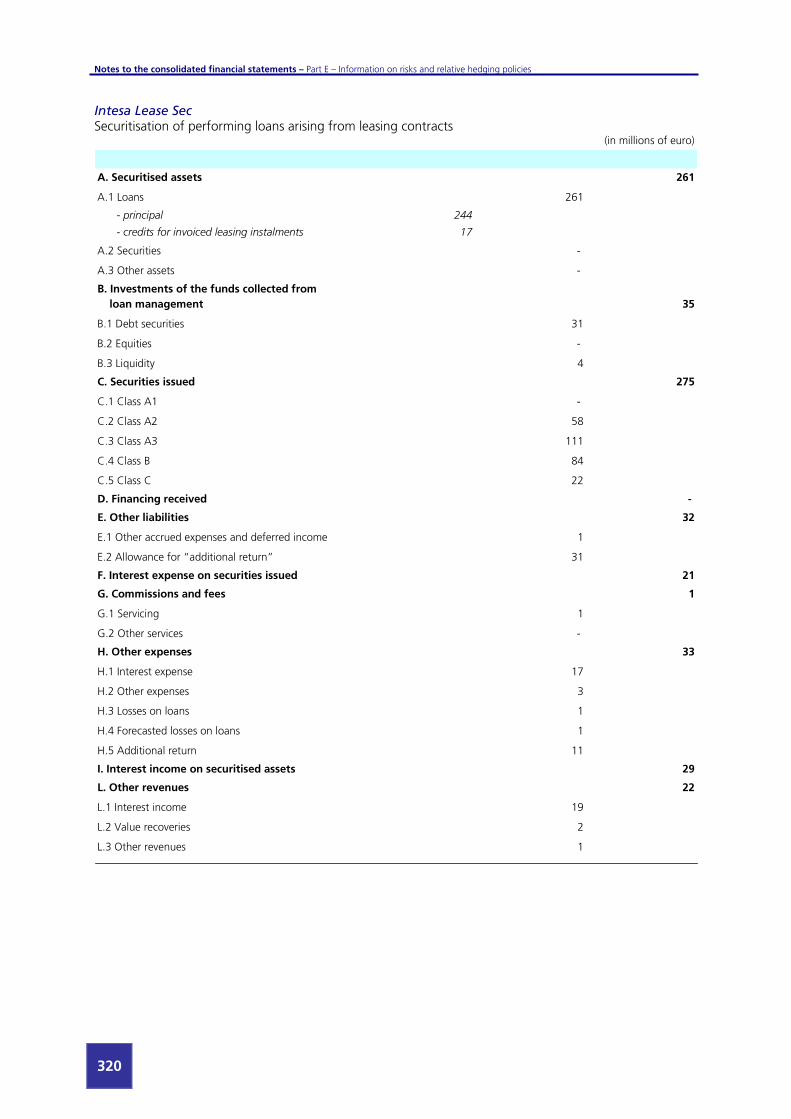
Notes to the consolidated financial statements – Part E – Information on risks and relative hedging policies
320
Intesa Lease Sec Securitisation of performing loans arising from leasing contracts
(in millions of euro)
A. Securitised assets 261
A.1 Loans 261
- principal 244
- credits for invoiced leasing instalments 17
A.2 Securities -
A.3 Other assets -
B. Investments of the funds collected from
loan management 35
B.1 Debt securities 31
B.2 Equities -
B.3 Liquidity 4
C. Securities issued 275
C.1 Class A1 -
C.2 Class A2 58
C.3 Class A3 111
C.4 Class B 84
C.5 Class C 22
D. Financing received -
E. Other liabilities 32
E.1 Other accrued expenses and deferred income 1
E.2 Allowance for “additional return” 31
F. Interest expense on securities issued 21
G. Commissions and fees 1
G.1 Servicing 1
G.2 Other services -
H. Other expenses 33
H.1 Interest expense 17
H.2 Other expenses 3
H.3 Losses on loans 1
H.4 Forecasted losses on loans 1
H.5 Additional return 11
I. Interest income on securitised assets 29
L. Other revenues 22
L.1 Interest income 19
L.2 Value recoveries 2
L.3 Other revenues 1

Notes to the consolidated financial statements – Part E – Information on risks and relative hedging policies
321
CR Firenze Mutui Securitisation of performing residential mortgages
(milioni di euro)
A. Securitised assets 188
A.1 Loans 188
A.2 Securities -
A.3 Other assets -
B. Investments of the funds collected from loan
management 22
B.1 Debt securities -
B.2 Equities -
B.3 Liquidity 22
C. Securities issued 198
C.1 Class A 154
C.2 Class B 28
C.3 Class C 8
C.4 Class D 8
D. Financing received -
E. Other liabilities 12
F. Interest expense on securities issued 11
G. Commissions and fees 4
G.1 Servicing 4
G.2 Other services -
H. Other expenses -
I. Interest income on securitised assets 13
L. Other revenues 2

Notes to the consolidated financial statements – Part E – Information on risks and relative hedging policies
322
Adriano Finance (Tranche 1) Securitisation of performing residential mortgages
(milioni di euro)
A. Securitised assets 7,333
A.1 Loans 7,119
- loans outstanding 7,080
- past due loans 39
A.2 Securities -
A.3 Other assets 214
- accrued income on IRS 208
- tax credits/ others 6
B. Investments of the funds collected from loan
management 1,289
B.1 Debt securities -
B.2 Equities -
B.3 Liquidity 1,289
C. Securities issued 7,998
C.1 Class A 7,558
C.2 Class B 440
D. Financing received 51
E. Other liabilities 575
E.1 Due to Parent Company 6
E.2 Allowance for “additional return” 39
E.3 Accrued expenses – interest on securities issued 175
E.4 Accrued expenses on IRS 355
F. Interest expense on securities issued 175
G. Commissions and fees 7
G.1 Servicing 6
G.2 Other services 1
H. Other expenses 395
H.1 Interest expense 356
H.2 Additional return 39
I. Interest income on securitised assets 344
L. Other revenues 231
L.1 Interest income 229
L.2 Revenues from penalties for advanced extinguishment and other 2

Notes to the consolidated financial statements – Part E – Information on risks and relative hedging policies
323
Adriano Finance (Tranche 2) Securitisation of performing residential mortgages
(milioni di euro)
A. Securitised assets 5,577
A.1 Loans 5,566
- loans outstanding 5,523
- past due loans 43
A.2 Securities -
A.3 Other assets 11
- accrued income on IRS 11
- tax credits -
B. Investments of the funds collected from loan
management 260
B.1 Debt securities -
B.2 Equities -
B.3 Liquidity 260
C. Securities issued 5,679
C.1 Class A 5,281
C.2 Class B 398
D. Financing received 50
E. Other liabilities 106
E.1 Due to Parent Company 1
E.3 Accrued expenses – interest on securities issued 9
E.4 Accrued expenses on IRS 96
F. Interest expense on securities issued 9
G. Commissions and fees 1
G.1 Servicing 1
G.2 Other services -
H. Other expenses 96
H.1 Interest expense 96
H.2 Other expenses -
I. Interest income on securitised assets 58
L. Other revenues 50
L.1 Interest income 50
L.2 Revenues from penalties for advanced extinguishment and other -

Notes to the consolidated financial statements – Part E – Information on risks and relative hedging policies
324
Adriano Finance 2 Securitisation of performing residential mortgages
(milioni di euro)
A. Securitised assets 13,058
A.1 Loans 12,998
- loans outstanding 12,996
- past due loans 2
A.2 Securities -
A.3 Other assets 60
- accrued income on mortgages 60
B. Investments of the funds collected from loan
management 233
B.1 Debt securities -
B.2 Equities -
B.3 Liquidity 233
C. Securities issued 13,050
C.1 Class A 12,174
C.2 Class B 876
D. Financing received 150
E. Other liabilities 94
E.1 Due to customers 29
E.3 Accrued expenses – interest on securities issued 2
E.4 Accrued expenses on IRS 63
F. Interest expense on securities issued 1
G. Commissions and fees 1
G.1 Servicing 1
G.2 Other services -
H. Other expenses 64
H.1 Interest expense 63
H.2 Forecast losses on loans 1
I. Interest income on securitised assets 35
L. Other revenues 28
L.1 Interest income 28
L.2 Revenues from penalties for advanced extinguishment and other -

Notes to the consolidated financial statements – Part E – Information on risks and relative hedging policies
325
C.2. Sales
C.2.1. Financial assets sold not derecognised (in millions of euro)
Debt
securities
Equities UCITS Loans Non-
performing
assets
FINANCIAL ASSETS HELD FOR TRADING 3,040 - - - - - 3,040 6,777
- Financial assets sold totally recognised
(book value) 3,040 - - - - - 3,040 6,777
- Financial assets sold partly recognised
(book value) - - - - - - - -
- Financial assets sold partly recognised
(full value) - - - - - - - -
FINANCIAL ASSETS MEASURED AT FAIR
VALUE 10 - - - - X 10 12
- Financial assets sold totally recognised
(book value) 10 - - - - X 10 12
- Financial assets sold partly recognised
(book value) - - - - - X - -
- Financial assets sold partly recognised
(full value) - - - - - X - -
FINANCIAL ASSETS AVAILABLE FOR SALE 3,349 - - - - X 3,349 2,787
- Financial assets sold totally recognised
(book value) 3,349 - - - - X 3,349 2,787
- Financial assets sold partly recognised
(book value) - - - - - X - -
- Financial assets sold partly recognised
(full value) - - - - - X - -
INVESTMENTS HELD TO MATURITY 596 X X - - X 596 1,689
- Financial assets sold totally recognised
(book value) 596 X X - - X 596 1,689
- Financial assets sold partly recognised
(book value) - X X - - X - -
- Financial assets sold partly recognised
(full value) - X X - - X - -
DUE FROM BANKS 359 X X - - X 359 55
- Financial assets sold totally recognised
(book value) 359 X X - - X 359 55
- Financial assets sold partly recognised
(book value) - X X - - X - -
- Financial assets sold partly recognised
(full value) - X X - - X - -
LOANS TO CUSTOMERS 2,358 X X 49 - X 2,407 1,308
- Financial assets sold totally recognised
(book value) 2,358 X X 49 - X 2,407 1,308
- Financial assets sold partly recognised
(book value) - X X - - X - -
- Financial assets sold partly recognised
(full value) - X X - - X - -
Total 31.12.2008 9,712 - - 49 - - 9,761 X
Total 31.12.2007 12,557 - - 71 - - X 12,628
Cash assets Derivatives Total
31.12.2008
Total
31.12.2007
Financial assets sold not derecognised are made up of securities relative to repurchase agreements.
C.2.2. Financial liabilities corresponding to financial assets sold not derecognised (in millions of euro)
Fully
recognised
Partly
recognised
Fully
recognised
Partly
recognised
Fully
recognised
Partly
recognised
Financial assets held for trading 2,779 - 6,319 - - - 9,098 6,777
Financial assets measured at fair value - - 8 - - - 8 12
Financial assets available for sale 1,313 - 68 - - - 1,381 2,787
Investments held to maturity 408 - - - - - 408 1,689
Due from banks - - - - - - - 55
Loans to customers - - 1 - 3,159 - 3,160 1,308
Total 4,500 - 6,396 - 3,159 - 14,055 12,628
Due to customers Due to banks Total
31.12.2008
Total
31.12.2007
Securities issued

Notes to the consolidated financial statements – Part E – Information on risks and relative hedging policies
326
The financial liabilities corresponding to financial assets sold and not derecognised (shown in the columns Due to banks and Due to customers) relate to reverse repurchase agreements, as shown in the tables 1.1 Due to banks and 2.1 Due to customers. The column Securities issued shows (as required by the regulations) the securities issued by the vehicles Split 2 and Intesa Sec 3.

Notes to the consolidated financial statements – Part E – Information on risks and relative hedging policies
327
D. MODELS FOR THE MEASUREMENT OF CREDIT RISK As at 31 December, the expected loss on core banks (Basel 2 validation area) was made up 0.46% of disbursed loans, a 0.05 percentage point increase on the figure as at the end of 2007. This increase was partly due to the introduction of the new rating models in the Retail segment and partly to the general deterioration of credit quality, as a result of the economic crisis. The economic capital corresponded to 3.5% of disbursed loans, a reduction of 0.1% compared to the figure in 2007. This figure runs counter to the expected loss as a result of the greater diversification of the portfolio.