1.0GENERAL DISCUSSION 1.2Measurement Principle densitometer readings tend to be quite stable over...
16
DRI STANDARD OPERATING PROCEDURE Page: 1 of 16 Date: 8/31/90 Title:Procedure for Light Transmission Number: 2-107.2 Analysis Revision: 2 Last Review: 5/15/07 1.0GENERAL DISCUSSION 1.1Purpose of Procedure This procedure outlines the method of light transmission analysis using the Tobias TBX-10 Densitometer. 1.2Measurement Principle This instrument is used to measure optical density (O.D.): O.D. = log 10 1 T where T = light transmitted through a particle filter. The instrument is adjusted so T = 1.0 (O.D. = 0.00) when no filter is present. 1.3 Measurement Interferences and Their Minimization Densitometer readings are subject to measurement biases due to: •Inhomogeneous deposits: the densitometer measures a small area in the center of each filter. Collection of samples using an in-line filter holder with insufficient collimation of the air flow before the filter will result in a heavier deposit in the center of the filters. Such inhomogeneities are avoided by using properly designed samplers and utilizing open face filters with sufficient collimation. •Filter media thickness: variations among filters of a given type of substrate are insignificant, as the absorbance of the filter deposit is determined as a difference between initial and final OD readings. However, different filter media have various inherent absorbencies. For example, quartz fiber filters have a higher absorbance than Teflon membrane filters. The primary effect of such baseline differences is to push absolute absorbance readings higher. Such an effect may pose a problem if deposit absorbencies approach the detection limit of the instrument(i.e. Densitometer). The use of Teflon membrane filters, with lower baseline absorbencies, will avoid such problems. 1.4 Ranges and Typical Values of Measurements Ranges and typical values of O.D. measurements can only be defined on a project-by-project basis, as the O.D. values obtained depend on the density of deposit material (μg/cm 2 ) on the filter substrate. The deposit density in turn is dependent upon the type of samples collected
Transcript of 1.0GENERAL DISCUSSION 1.2Measurement Principle densitometer readings tend to be quite stable over...

DRI STANDARD OPERATING PROCEDURE Page: 1 of 16 Date: 8/31/90 Title: Procedure for Light Transmission Number: 2-107.2 Analysis Revision: 2 Last Review: 5/15/07
1.0GENERAL DISCUSSION 1.1Purpose of Procedure This procedure outlines the method of light transmission analysis using the
Tobias TBX-10 Densitometer. 1.2Measurement Principle This instrument is used to measure optical density (O.D.): O.D. = log
10 1
T where T = light transmitted through a particle filter. The instrument is
adjusted so T = 1.0 (O.D. = 0.00) when no filter is present. 1.3 Measurement Interferences and Their Minimization Densitometer readings are subject to measurement biases due to: •Inhomogeneous deposits: the densitometer measures a small area in the
center of each filter. Collection of samples using an in-line filter holder with insufficient collimation of the air flow before the filter will result in a heavier deposit in the center of the filters. Such inhomogeneities are avoided by using properly designed samplers and utilizing open face filters with sufficient collimation.
•Filter media thickness: variations among filters of a given type of
substrate are insignificant, as the absorbance of the filter deposit is determined as a difference between initial and final OD readings. However, different filter media have various inherent absorbencies. For example, quartz fiber filters have a higher absorbance than Teflon membrane filters. The primary effect of such baseline differences is to push absolute absorbance readings higher. Such an effect may pose a problem if deposit absorbencies approach the detection limit of the instrument(i.e. Densitometer). The use of Teflon membrane filters, with lower baseline absorbencies, will avoid such problems.
1.4 Ranges and Typical Values of Measurements Ranges and typical values of O.D. measurements can only be defined on a
project-by-project basis, as the O.D. values obtained depend on the density of deposit material (μg/cm2) on the filter substrate. The deposit density in turn is dependent upon the type of samples collected
DRI STANDARD OPERATING PROCEDURE Page: 2 of 16 Date: 8/31/90 Title: Procedure for Light Transmission Number: 2-107.2 Analysis Revision: 2 Last Review: 5/15/07
(ambient or source), concentrations of material sampled (μg/m3), total air flow through the filters, and the size of the filters. Adjustment of any or all of these parameters is usually performed to keep deposit concentrations within ranges optimal for other analyses (e.g., x-ray fluorescence, thermal/optical reflectance carbon analysis, atomic absorption, ion chromatography, and others).
1.5 Lower Quantifiable Limits and Precision The Tobias densitometer presents measurements to 0.01 O.D. units. Because
O.D. values are ultimately reported as differences between pre- and post-sampling O.D. measurements, the Lower Quantifiable Limits are ± 0.02 O.D. units.
Precision and accuracy for the densitometer values were most recently
evaluated in the Denver Brown Cloud Study (Watson, 1988). Teflon laboratory blank filters yielded OD values of -0.02 ± 0.01 (N=14 ± 1σ), and quartz laboratory blank filters yielded values of -0.01 ± 0.03 (N=5 ± 1σ). Inter-laboratory comparisons with the University of California at Davis (UCD) yielded DRI/UCD ratios of 0.845 for Teflon membrane filters and 1.024 for quartz fiber filters. The relative standard deviation for these ratios was 4% for the Teflon filters and 3% for the quartz filters.
1.6Personnel Responsibilities All technicians should read and understand the entire standard operating
procedure before performing optical density measurements. This includes familiarity with the chain-of-custody, measuring, and replicate measuring forms and procedures.
It is the responsibility of the laboratory manager to ensure that the
procedures are being followed and the proper documentation is properly filled out.
The DRI quality assurance (QA) officer should revise the procedures when
necessary. It is also the responsibility of the QA officer to estimate the level of effort involved in this quality assurance and to make sure the tasks are budgeted and carried out as a part of the performance on each contract.
1.7 Definitions There are no terms which require further definition. 1.8 Related Procedures Related procedures include:
DRI STANDARD OPERATING PROCEDURE Page: 3 of 16 Date: 8/31/90 Title: Procedure for Light Transmission Number: 2-107.2 Analysis Revision: 2 Last Review: 5/15/07
•DRI SOP # 2-208.1Filter Pack Assembling, Disassembling, and Cleaning
Procedure. • DRI SOP # 2-209.1Sample Shipping, Receiving, and Chain-of-
Custody. 2.0 APPARATUS, INSTRUMENTATION, REAGENTS, AND FORMS 2.1 Apparatus and Instrumentation 2.1.1Instrument Description for Tobias TBX-10 Densitometer (Figures 2-1 and 2-
2): •Power Switch (On/Off) - Located on lower left side. •Display - a 4-digit red LED. •Probe Arm - Contains light detectors; must be pushed completely
down while making a measurement and released gently. •Push Button - Located on top of probe arm. The instrument is
actively measuring optical density while the push button is depressed. Releasing the push button freezes the value currently on the display. Release the push button before raising the probe arm.
•Null/Zero Switch - Normally in center (horizontal) position (the
null feature is not used). The zero feature is used to zero and calibrate the instrument.
•Xmit Switch - Controls RS-232 serial port. This feature is not
currently used; keep in center (horizontal) position. •Zero Adjustment - Potentiometer located near the back on the
right side of instrument. •Cal Adjustment - Potentiometer located near the back on the
right side of the instrument. •Aperture - A 10 mm diameter black metal ring directly below the
probe arm sensor through which light is directed at the sample.
•Filter Locator - Black ring that centers filters over the
aperture.

DRI STANDARD OPERATING PROCEDURE Page: 4 of 16 Date: 8/31/90 Title: Procedure for Light Transmission Number: 2-107.2 Analysis Revision: 2 Last Review: 5/15/07
Figure 2-1. Tobias TBX-10 Densitometer
DRI STANDARD OPERATING PROCEDURE Page: 5 of 16 Date: 8/31/90 Title: Procedure for Light Transmission Number: 2-107.2 Analysis Revision: 2 Last Review: 5/15/07
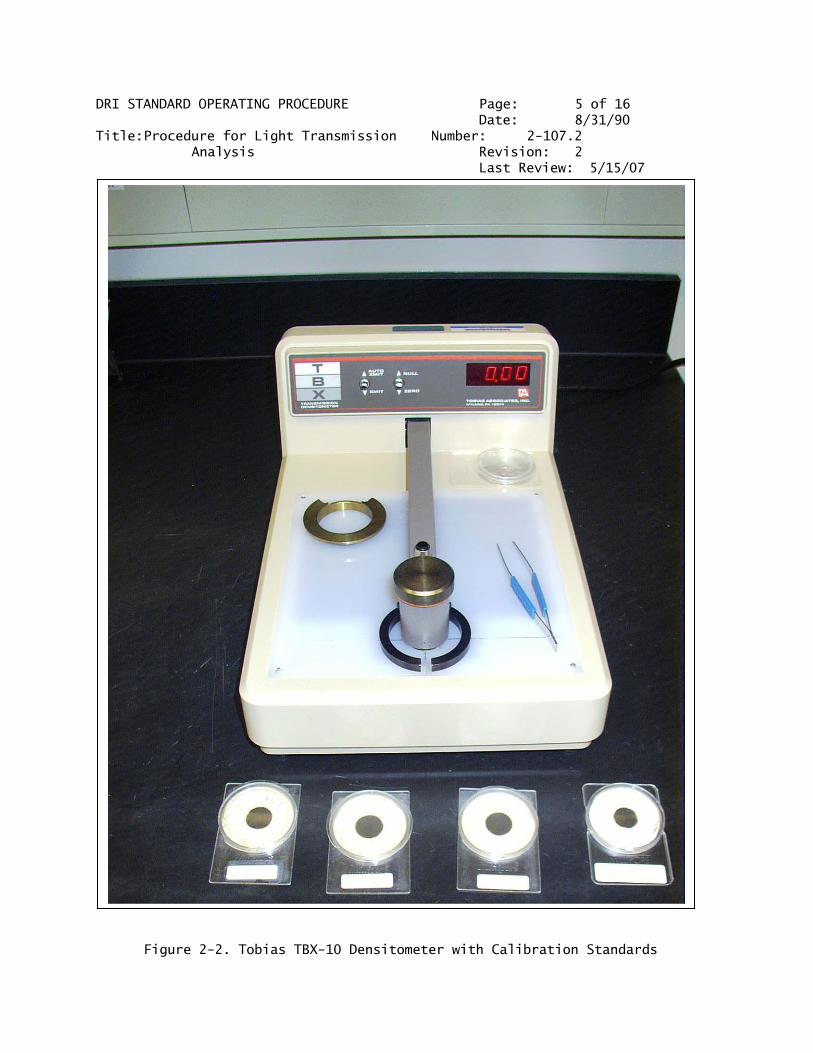
Figure 2-2. Tobias TBX-10 Densitometer with Calibration Standards
DRI STANDARD OPERATING PROCEDURE Page: 6 of 16 Date: 8/31/90 Title: Procedure for Light Transmission Number: 2-107.2 Analysis Revision: 2 Last Review: 5/15/07
•Ring Weight - Fits over filters in the filter locator. This ring holds Teflon filters flat; it is not required with quartz filters.
2.1.2 Characterization The Tobias TBX-10 densitometer takes readings continuously while the
push button is depressed. When the push button is released prior to releasing the probe arm, the last reading is captured and displayed on the LED display.
The densitometer readings tend to be quite stable over time and rarely require
recalibration during a set of filters. The densitometer is allowed to sit for at least 20 minutes after applying power to allow the electronics to reach operating temperature.
2.1.3 Spare Parts List The following items are required for O.D. measurements as described in
this procedure: •Transmission Densitometer (Tobias Associates, Inc., Ivyland,
PA). •Flat-tipped tweezers (Millipore, So. San Francisco, CA). •Can of compressed air, used to blow dust and particles off the
aperture (i.e. "Dust Remover" from Radio Shack). •Calibration Standards (Tobias Associates, Inc., Ivyland, PA). 2.2Reagents (Not Applicable) 2.3Forms The following forms are required for densitometer operation: •Data Sheet for Optical Density (Figure 2-3). •Data Sheet for Replicate Optical Density (Figure 2-4). •Data Sheet for Densitometer Calibrations (Figure 2-5). •Densitometer Logbook (Figure 2-6).

DRI STANDARD OPERATING PROCEDURE Page: 7 of 16 Date: 8/31/90 Title: Procedure for Light Transmission Number: 2-107.2 Analysis Revision: 2 Last Review: 5/15/07
Acrobat Document
Acrobat Document
Acrobat Document
Figure 2-3. Data Sheet for Optical Density.

DRI STANDARD OPERATING PROCEDURE Page: 8 of 16 Date: 8/31/90 Title: Procedure for Light Transmission Number: 2-107.2 Analysis Revision: 2 Last Review: 5/15/07
Figure 2-4. Data Sheet for Replicate Optical Density
DRI STANDARD OPERATING PROCEDURE Page: 9 of 16 Date: 8/31/90 Title: Procedure for Light Transmission Number: 2-107.2 Analysis Revision: 2 Last Review: 5/15/07
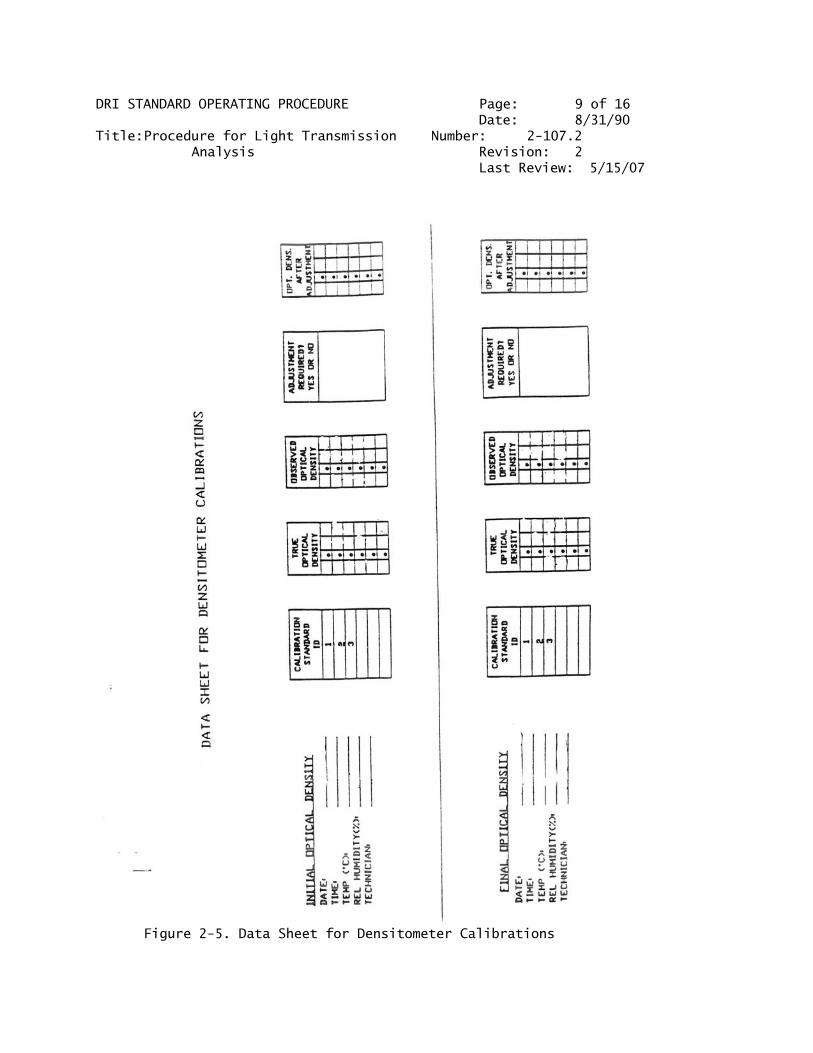
Figure 2-5. Data Sheet for Densitometer Calibrations
DRI STANDARD OPERATING PROCEDURE Page: 10 of 16 Date: 8/31/90 Title: Procedure for Light Transmission Number: 2-107.2 Analysis Revision: 2 Last Review: 5/15/07
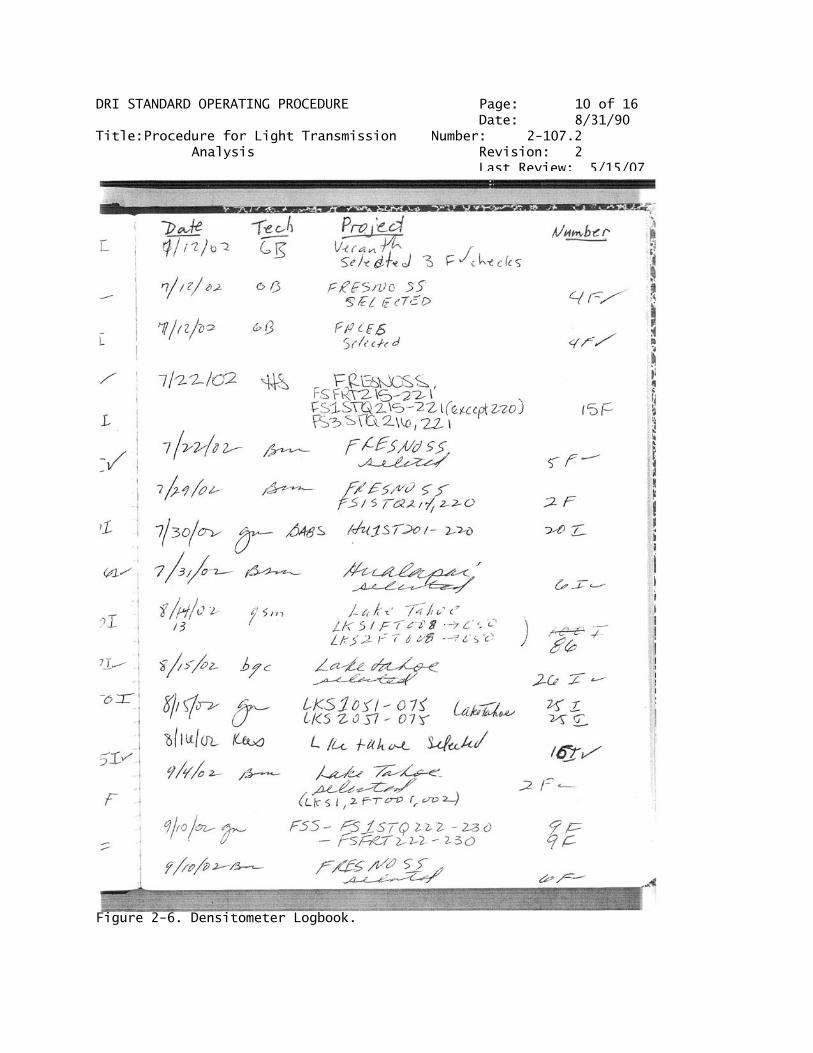
Figure 2-6. Densitometer Logbook.
DRI STANDARD OPERATING PROCEDURE Page: 11 of 16 Date: 8/31/90 Title: Procedure for Light Transmission Number: 2-107.2 Analysis Revision: 2 Last Review: 5/15/07
3.0CALIBRATION STANDARDS 3.1Preparation of Standards Calibration standards are supplied by Tobias Associates. 3.2Use of Standards The densitometer is calibrated against a known zero and three standards of
known O.D. before and after each set of measurements. 3.3 Accuracy of Calibration Standards The calibration standards are typically within ± 0.02 units of the specified
values. 4.0PROCEDURES 4.1Start-Up 4.1.1 Instrument Performance Check •Remove the cover. Using the rocker switch on the left side,
turn on power to the instrument. Allow about 20 minutes for the electronics to reach operating temperature to minimize drift during the measurements. The LED display should read 8888.
•Remove all objects from the aperture. Insure that the frosted
glass is in place over the aperture. If the aperture is dusty, clean it with a quick blast of compressed air in a can (i.e. "Dust Remover" from Radio Shack). CAUTION: DO NOT USE METHANOL ON THE APERTURE.
•Press the right toggle switch on the control panel to "ZERO"; hold the switch until the display reads "CAL" (about 5 seconds).
•Move the probe arm completely down and depress the push button
for 4 to 5 seconds. If the display reads 0.00 ± 0.02, proceed to the next step; otherwise, calibrate instrument as described in Section 4.1.2.
•Place the Calibration Standard #1 directly over the aperture,
shiny side up. Depress and hold the probe arm and the push button. The display should match the value indicated on

DRI STANDARD OPERATING PROCEDURE Page: 12 of 16 Date: 8/31/90 Title: Procedure for Light Transmission Number: 2-107.2 Analysis Revision: 2 Last Review: 5/15/07
the standard within ± 0.02. Repeat with the other calibration standards. If a match is obtained with all values, proceed to Section 4.2; otherwise, calibrate the instrument as described in Section 4.1.2.
•Keep the calibration standards in their containers between
usage. 4.1.2Calibration A calibration is performed at the beginning and the end of all measurements.
The technician who uses the densitometer at the start of the day does the initial calibration and the technician who performs the replicates does the final calibration. If the replicates are not going to be performed on the same day, the technician who performs the initial calibration also performs the final calibration.
•Obtain a calibration form (Figure 2-5) and fill out the required
information. •Press the right toggle switch to "ZERO". Hold the switch until
the display reads "CAL". •Remove all objects from the aperture. •Depress and hold the probe arm and the push button. Use a small
screw driver to turn the zero adjustment until the display reads 0.00 ± 0.01. Release the push button and the probe arm.
•Place the first calibration standard directly over the aperture,
shiny side up. Depress and hold the probe arm; depress the push button. Use a small screw driver to turn the calibration adjustment screw until the number displaced matches the number recorded on the calibration standard. Recheck zero as described in the previous step. Repeat with the other calibration standards as necessary. CAUTION: do not adjust for the high standard if the other two are correct; just record the value.
4.2Routine Operation •Obtain an O.D. measurement form (Figure 2-3) and staple an O.D.
replicate measurement form (Figure 2-4) behind it. Fill out the top of the measurement form.

DRI STANDARD OPERATING PROCEDURE Page: 13 of 16 Date: 8/31/90 Title: Procedure for Light Transmission Number: 2-107.2 Analysis Revision: 2 Last Review: 5/15/07
•Wear gloves and handle the filters with flat-tipped tweezers. Hold the filters near the edge, as far as possible from the deposit area.
•Clear the aperture of all objects. •Depress and hold the probe arm. Press the push button. The reading
should be 0.00. If it is not, press the zero switch to zero the display. Release the push button first, then the probe arm.
•Using tweezers, place the filter in the filter holder. Exposed filters
are placed with the deposit side up. Unexposed filters are loaded as follows:
--Teflon: with the shiny support ring facing up. -- Quartz: with the smoother of the two sides up. •Place the weight ring over the Teflon filters, being careful not to
scratch the surface. The weight ring serves to hold the filters flat; it is not necessary with the quartz filters.
•Depress and hold the probe arm and depress the push button. Release
the push button after 2 to 3 seconds. The measurement typically varies ± 0.01 during that period of time.
•Record the reading on the measurement form (Figure 2-3). Insure that
the top section of the form is completed and that the filter ID of the sample matches the one recorded on the form.
•Remove the weight ring, if used, and replace the filter into its petri
dish or PetriSlide. •Rezero the machine between each reading as described at the beginning
of this section. •Record your work in the Densitometer Log Book (Figure 2-6). •If the initial O.D. measurement is being made, be sure to record the
filter lot and ID numbers on the Filter Assignment Logbook (see SOP 2-208.1, Filter Pack Assembling, Disassembling, and Cleaning Procedure). If the filters have been preweighed, this information will be already recorded.
4.3 Shut-Down After all samples are measured for the day, perform calibration checks as
described in Section 4.1.2, recording all readings on the calibration
DRI STANDARD OPERATING PROCEDURE Page: 14 of 16 Date: 8/31/90 Title: Procedure for Light Transmission Number: 2-107.2 Analysis Revision: 2 Last Review: 5/15/07
form (Figure 2-5). Turn the power to the instrument off and replace the dust cover.
5.0 QUANTIFICATION 5.1 Calibration Procedures Calibrations are performed on the densitometer at the beginning and end of
each set of filters. The calibration procedure is described in Section 4.1.2.
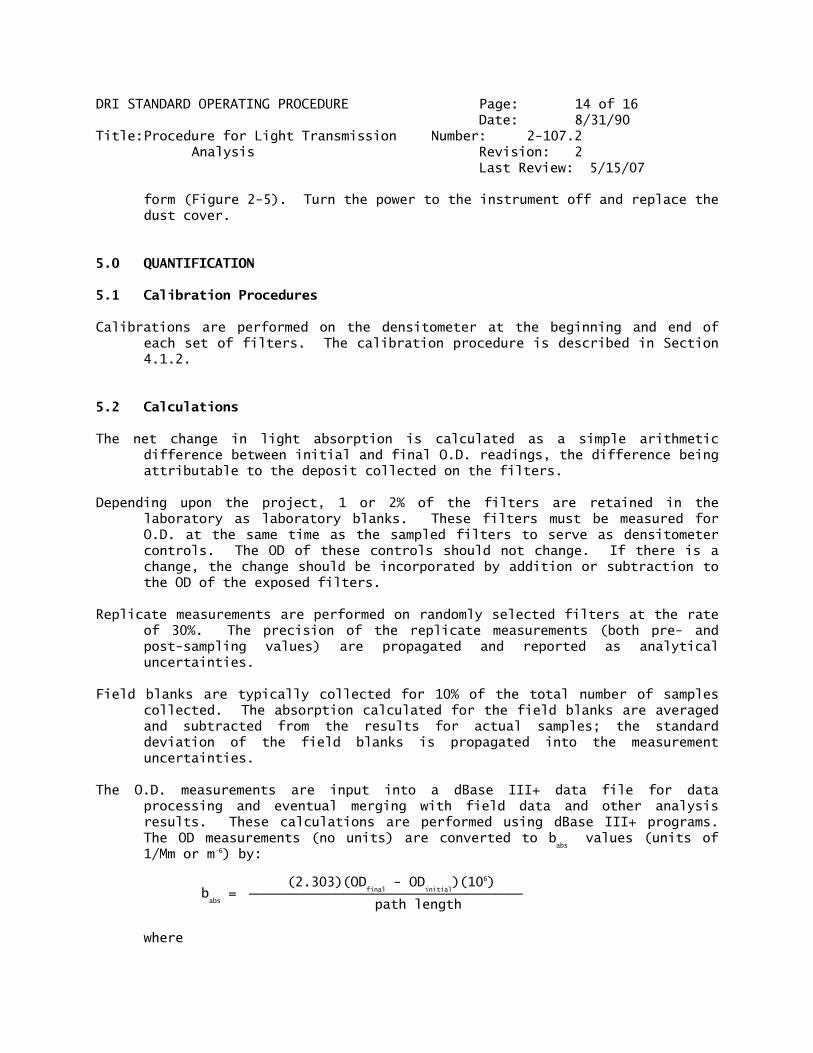
5.2 Calculations The net change in light absorption is calculated as a simple arithmetic
difference between initial and final O.D. readings, the difference being attributable to the deposit collected on the filters.
Depending upon the project, 1 or 2% of the filters are retained in the
laboratory as laboratory blanks. These filters must be measured for O.D. at the same time as the sampled filters to serve as densitometer controls. The OD of these controls should not change. If there is a change, the change should be incorporated by addition or subtraction to the OD of the exposed filters.
Replicate measurements are performed on randomly selected filters at the rate
of 30%. The precision of the replicate measurements (both pre- and post-sampling values) are propagated and reported as analytical uncertainties.
Field blanks are typically collected for 10% of the total number of samples
collected. The absorption calculated for the field blanks are averaged and subtracted from the results for actual samples; the standard deviation of the field blanks is propagated into the measurement uncertainties.
The O.D. measurements are input into a dBase III+ data file for data
processing and eventual merging with field data and other analysis results. These calculations are performed using dBase III+ programs. The OD measurements (no units) are converted to b
abs values (units of
1/Mm or m-6) by: (2.303)(OD
final - OD
initial)(106)
babs = ───────────────────────────────────
path length where

DRI STANDARD OPERATING PROCEDURE Page: 15 of 16 Date: 8/31/90 Title: Procedure for Light Transmission Number: 2-107.2 Analysis Revision: 2 Last Review: 5/15/07
sample volume (m3) path length = ─────────────────── deposit area (m2) The two above equations may be combined as: (2.303)(_
OD)(deposit area in cm2)(102)
babs = ───────────────────────────────────────
sample volume in m3 6.0 QUALITY CONTROL 6.1 Performance Testing Blanks corresponding to 1-2% of the total number of samples are retained in
the laboratory as control filters. Measurements of these filters provide an estimation of the variability of the filters and densitometer over time.
6.2 Reproducibility Testing Replicate O.D. measurements are made on 30% of the filters by a different
technician on the same day or, if time does not allow, within 24 hours. The use of a different technician eliminates any personal bias (i.e. handling of the filters or placement on the aperture):
•Select any three filters out of a set of ten filters that have the initial
O.D. readings. •Perform the O.D. reading as outlined in Section 4.3, recording the
measurements on the O.D. replicate measurement form (Figure 2-4) which is attached to the O.D. measurement form. Be sure to record the readings in the correct columns.
•Record the original reading from the O.D. measurement form in the
correct column on the O.D. replicate measurement form. •Record whether the replicate reading is initial (I) or final (F) in the
correct column. •Calculate and record the differences between the original and replicate
readings. The differences should be < ± 0.02 units. If the differences are within the limits, put "OK" in the comments column. If the differences are outside ± 0.02 units is not, notify the supervisor.
DRI STANDARD OPERATING PROCEDURE Page: 16 of 16 Date: 8/31/90 Title: Procedure for Light Transmission Number: 2-107.2 Analysis Revision: 2 Last Review: 5/15/07
•Complete the technician and date columns. 6.3 Control Charts Control charts are not currently plotted of O.D. replicate measurements. 6.4 Measurement Flags (Not applicable) 6.5 Data Validation Level I data validation is performed on the dBase III+ files for data entry
errors by the project manager. 7.0 QUALITY ASSURANCE 7.1 Performance Audit Schedule The densitometer is audited only for those projects which include such an
audit in their work plans. Performance audits generally consist of inter-laboratory comparisons and are defined on a project-by-project basis.
7.2 Systems Audit Schedule See the discussion in Section 7.1. 8.0 REFERENCES Tobias Associates, "Instructions for Tobias Densitometer Model TBX10",
Ivyland, PA, Sept. 28, 1987. Watson, J.G., et al., "The 1987-88 Metro Denver Brown Cloud Study; Volume II:
Measurements", Final report prepared for the Metro Denver Brown Cloud Study, Inc., Nov. 8, 1988.