10.4072/rbp.2013.3.02 - Sociedade Brasileira de … · the Last Glacial Maximum (LGM), ... obtained...
14
361 Rev. bras. paleontol. 16(3):361-374, Setembro/Dezembro 2013 © 2013 by the Sociedade Brasileira de Paleontologia doi: 10.4072/rbp.2013.3.02 INTRODUCTION The oceanic circulation of the South Atlantic has an important role in the global climatic system, via the formation of deep water in the Southern Ocean and the heat transport to the northern hemisphere. Since the density variations that affect global thermohaline circulation are determined by the heat and water fluxes occurring in the ocean surface (Rahmstorf, 1996), studies on the development of superficial hydrography contribute to the knowledge of the global paleoceanography. There are little data about the surface circulation in the Southwestern Atlantic during the Late Quaternary. During the Last Glacial Maximum (LGM), Heinrich Event 1 and the Younger Dryas, the South Atlantic worked as a heat and salt reservoir, as a consequence of the slowdown of the Atlantic THE PRODUCTIVITY HISTORY IN THE SOUTHWESTERN ATLANTIC AS INFERRED FROM COCCOLITHOPHORE RECORD FOR THE LAST 130 KYR ADRIANA LEONHARDT Instituto de Oceanografia, Universidade Federal do Rio Grande, Av. Itália, km 8, Cx.P. 474, 96201-900, Rio Grande, RS, Brasil. [email protected] FELIPE A. L. TOLEDO Instituto Oceanográfico, Universidade de São Paulo, Praça do Oceanográfico, 191, 05508-900, São Paulo, SP, Brasil. [email protected] JOÃO CARLOS COIMBRA Instituto de Geociências, Universidade Federal do Rio Grande do Sul, Av. Bento Gonçalves, 9500, Cx.P. 15001, 91501-970, Porto Alegre, RS, Brasil. [email protected] ABSTRACT – In this work, fossil assemblages of coccolithophorids, oxygen stable isotopes (Globigerinoides ruber), and radiocarbon dating were used as proxies. The sediment core, obtained on the slope of Campos Basin, was analyzed, comprising the last 130 kyr. The results show that placolith-bearing taxa, such as Gephyrocapsa spp. and Emiliania huxleyi, as well as Florisphaera profunda, which inhabits the lower photic zone, dominated the assemblage during the whole study interval. Over the past 130 kyr, there was a relationship between productivity (based on N ratio) and climate cyclicity. In a general way, it can be said that sensu stricto interglacial stages (MIS 5e and the Holocene) showed low productivity, while the others (MIS 5d-a, 4, 3 and 2) had large fluctuations. During interglacial-like conditions, a northward shift in the Intertropical Convergence Zone position would take place, along with a weakening of the NE winds associated with the Southern Atlantic Subtropical High and a weakening of the Brazil Current, leading to the maintenance of the water stratification. On the other hand, during glacial-like conditions, the inverse conditions would be favorable to a shallower nutricline, increasing productivity in surface waters. Maximum productivity is achieved between 14-6.5 ky (during deglaciation), which could be a reflection of the events of the Last Glacial Maximum. Key words: paleoceanography, coccolithophorids, productivity, Quaternary, Southwestern Atlantic. RESUMO – Neste trabalho, assembleias fósseis de cocolitoforídeos, isótopos estáveis de oxigênio (Globigerinoides ruber) e datações radiocarbônicas foram usados como proxies. Um testemunho sedimentar obtido no talude da bacia de Campos foi analisado, compreendendo os últimos 130 ka. Os resultados mostram que táxons placolitoformes, como Gephyrocapsa spp. e Emiliania huxleyi, bem como Florisphaera profunda, que habita a zona fótica inferior, dominam a assembleia durante todo o intervalo estudado. Ao longo dos últimos 130 ka há uma relação entre a produtividade (baseada na razão N) e a ciclicidade climática. De uma maneira geral, pode ser dito que estágios interglaciais sensu stricto (EIM 5e e o Holoceno) mostraram baixa produtividade, enquanto os outros (EIM 5d-a, 4, 3 e 2) apresentaram grandes flutuações. Durante condições do tipo interglacial, uma migração para o norte da posição da Zona de Convergência Intertropical, juntamente com um enfraquecimento dos ventos de nordeste associados à Alta Subtropical do Atlântico Sul e um enfraquecimento da Corrente do Brasil, possivelmente levava à manutenção da estratificação das águas. Por outro lado, durante condições do tipo glacial, as condições inversas favoreceriam uma nutriclina mais rasa, aumentando a produtividade das águas superficiais. O máximo de produtividade foi registrado entre 14-6,5 ka (durante a deglaciação), o que pode ser um reflexo de eventos do Último Máximo Glacial. Palavras-chave: paleoceanografia, cocolitoforídeos, produtividade, Quaternário, Atlântico Sudoeste.
Transcript of 10.4072/rbp.2013.3.02 - Sociedade Brasileira de … · the Last Glacial Maximum (LGM), ... obtained...
361
Rev. bras. paleontol. 16(3):361-374, Setembro/Dezembro 2013© 2013 by the Sociedade Brasileira de Paleontologiadoi: 10.4072/rbp.2013.3.02
INTRODUCTION
The oceanic circulation of the South Atlantic has an important role in the global climatic system, via the formation of deep water in the Southern Ocean and the heat transport to the northern hemisphere. Since the density variations that affect global thermohaline circulation are determined by the heat and water fl uxes occurring in the ocean surface
(Rahmstorf, 1996), studies on the development of superfi cial hydrography contribute to the knowledge of the global paleoceanography.
There are little data about the surface circulation in the Southwestern Atlantic during the Late Quaternary. During the Last Glacial Maximum (LGM), Heinrich Event 1 and the Younger Dryas, the South Atlantic worked as a heat and salt reservoir, as a consequence of the slowdown of the Atlantic
THE PRODUCTIVITY HISTORY IN THE SOUTHWESTERN ATLANTIC AS INFERREDFROM COCCOLITHOPHORE RECORD FOR THE LAST 130 KYR
ADRIANA LEONHARDTInstituto de Oceanografi a, Universidade Federal do Rio Grande, Av. Itália, km 8, Cx.P. 474, 96201-900, Rio Grande, RS, Brasil.
FELIPE A. L. TOLEDOInstituto Oceanográfi co, Universidade de São Paulo, Praça do Oceanográfi co, 191, 05508-900, São Paulo, SP, Brasil.
JOÃO CARLOS COIMBRAInstituto de Geociências, Universidade Federal do Rio Grande do Sul, Av. Bento Gonçalves, 9500, Cx.P. 15001, 91501-970,
Porto Alegre, RS, Brasil. [email protected]
ABSTRACT – In this work, fossil assemblages of coccolithophorids, oxygen stable isotopes (Globigerinoides ruber), and radiocarbon dating were used as proxies. The sediment core, obtained on the slope of Campos Basin, was analyzed, comprising the last 130 kyr. The results show that placolith-bearing taxa, such as Gephyrocapsa spp. and Emiliania huxleyi, as well as Florisphaera profunda, which inhabits the lower photic zone, dominated the assemblage during the whole study interval. Over the past 130 kyr, there was a relationship between productivity (based on N ratio) and climate cyclicity. In a general way, it can be said that sensu stricto interglacial stages (MIS 5e and the Holocene) showed low productivity, while the others (MIS 5d-a, 4, 3 and 2) had large fl uctuations. During interglacial-like conditions, a northward shift in the Intertropical Convergence Zone position would take place, along with a weakening of the NE winds associated with the Southern Atlantic Subtropical High and a weakening of the Brazil Current, leading to the maintenance of the water stratifi cation. On the other hand, during glacial-like conditions, the inverse conditions would be favorable to a shallower nutricline, increasing productivity in surface waters. Maximum productivity is achieved between 14-6.5 ky (during deglaciation), which could be a refl ection of the events of the Last Glacial Maximum.
Key words: paleoceanography, coccolithophorids, productivity, Quaternary, Southwestern Atlantic.
RESUMO – Neste trabalho, assembleias fósseis de cocolitoforídeos, isótopos estáveis de oxigênio (Globigerinoides ruber) e datações radiocarbônicas foram usados como proxies. Um testemunho sedimentar obtido no talude da bacia de Campos foi analisado, compreendendo os últimos 130 ka. Os resultados mostram que táxons placolitoformes, como Gephyrocapsa spp. e Emiliania huxleyi, bem como Florisphaera profunda, que habita a zona fótica inferior, dominam a assembleia durante todo o intervalo estudado. Ao longo dos últimos 130 ka há uma relação entre a produtividade (baseada na razão N) e a ciclicidade climática. De uma maneira geral, pode ser dito que estágios interglaciais sensu stricto (EIM 5e e o Holoceno) mostraram baixa produtividade, enquanto os outros (EIM 5d-a, 4, 3 e 2) apresentaram grandes fl utuações. Durante condições do tipo interglacial, uma migração para o norte da posição da Zona de Convergência Intertropical, juntamente com um enfraquecimento dos ventos de nordeste associados à Alta Subtropical do Atlântico Sul e um enfraquecimento da Corrente do Brasil, possivelmente levava à manutenção da estratifi cação das águas. Por outro lado, durante condições do tipo glacial, as condições inversas favoreceriam uma nutriclina mais rasa, aumentando a produtividade das águas superfi ciais. O máximo de produtividade foi registrado entre 14-6,5 ka (durante a deglaciação), o que pode ser um refl exo de eventos do Último Máximo Glacial.
Palavras-chave: paleoceanografi a, cocolitoforídeos, produtividade, Quaternário, Atlântico Sudoeste.
Meridional Overturning Circulation (Toledo et al., 2007a). In fact, even in the subtropical gyre region the temperature remained relatively high during the LGM, since the input of warm waters into the Atlantic via Agulhas Current occurred continuously (Gersonde et al., 2003).
Regarding the local precipitation (25º50’S), it increased during the LGM and in the Late Holocene (Pivel et al., 2010), probably because in these intervals there was higher summer insolation in the studied latitude (due to the precession cycle), leading to a stronger monsoon. It is also known that the transition to the Marine Isotope Stage (MIS) 5 was particularly warm in the South Atlantic due to the reduction of the Atlantic Meridional Overturning Circulation (Gersonde et al., 2003).
The paleoproductivity is an important object of study because it provides clues about variations of atmospheric and oceanographic systems in the past. Furthermore, oceanic productivity has an important role in the modulation of the fl ow of CO2 between the ocean and the atmosphere; the lower level of atmospheric CO2 during the glacial intervals is often explained (at least partly) by the intensifi ed oceanic productivity (Martínez-Garcia et al., 2009). In the southwestern Atlantic, the productivity seems to be higher during the deglaciation than in the LGM and Holocene (Toledo et al., 2007b), although other studies have shown maximum peaks during the LGM and the Younger Dryas in the same studied area (24º26’S) (Toledo et al., 2008).
In the context of paleoceanographic research, the coccolithophorids (unicellular algae) have been highlighted as excellent sea surface proxies (e.g. Beaufort, 1996; Beaufort et al., 1997; Flores et al., 2000; Andruleit et al., 2008; Grelaud et al., 2009), since species distribution is affected by factors such as latitude, ocean currents, nutrient availability, salinity, temperature and light availability, showing higher diversity in warm and oligotrophic regions (Winter et al., 1994). Their coccoliths, made of calcite, are preserved in marine sediments, allowing paleoenvironmental and biostratigraphical studies as well.
This study presents coccolith data obtained from the analysis of a piston core from the western South Atlantic for the last 130 kyr. The study area is located on the continental slope of the SE Brazilian continental margin. The collected samples have been investigated for their coccolith composition (absolute numbers and relative abundances). The authors attempt to (i) investigate the changes in the productivity of surface waters as revealed by coccolithophores, (ii) observe the general pattern of oceanographic features in relation to the alternation of glacial and interglacial intervals, (iii) relate oscillations in the nutricline depth to oceanographic and climatic changes.
Modern oceanography of the study areaThe upper-level circulation in the South Atlantic Ocean
is dominated by a system of gyres and by the equatorial and circumpolar current systems (Figure 1), controlled by the atmospheric system. The subtropical gyre is associated with a high atmosphere pressure center, the South Atlantic Subtropical High (SASH), which is responsible for the
predominance of NE winds in the Brazilian southeast region. The equatorial current system is driven by the trade winds and by the Intertropical Convergence Zone (ITCZ). The ITCZ and the SASH migrate throughout the year. During winter in the southern hemisphere, the ITCZ reaches its northernmost position (Peterson & Stramma, 1991) and the SASH, its northwesternmost position (Hastenrath, 1991). Thus, in the studied area, northerly winds prevail in austral summer, while southerly winds dominate austral winter (Lass & Mohrholz, 2008).
When the South Equatorial Current (SEC) reaches the Brazilian shelf region, it bifurcates into the North Brazil Current (NBC) to the north and the Brazil Current (BC) to the south. The local bifurcation is seasonal as well: when the SEC bifurcates in its northernmost position (austral summer), the NBC transport decreases and the BC transport increases (Rodrigues et al., 2007).
The studied area is directly infl uenced by the BC. The sea surface temperature, evaporation, precipitation, and surface current intensity are linked to seasonal changes in the wind intensity. The BC fl ows in open sea, transporting the Tropical Water (TW) and the South Atlantic Central Water (SACW). The TW occurs in the fi rst 200 m depth and it’s a warm (> 18ºC) and saline (> 36‰) water mass. Below that, there is the SACW, characterized by lower temperatures (6-20ºC), lower salinity (34.6-36‰) and higher nutrient concentration. A signifi cant and continuous supply of nutrients in the photic zone is necessary to promote an increase in productivity. There are two types of upwelling in the southeastern Brazilian Continental Margin (Palma & Matano, 2009): the coastal upwelling near Cabo Frio, which is intensifi ed in the summer due to the action of NE winds, and the shelf break upwelling that operates all the year. In the studied area, the SACW constitutes the main source of nutrients, due to the shoaling of the nutricline induced by the NE winds or by the upwelling in cyclonic eddies formed in the BC at the shelf break (Silveira et al., 2000).
MATERIAL AND METHODS
Core KF13 was obtained from the Brazilian Continental Margin at 20º02’24”S/ 38º59’24”W, at 1,774 m water depth (Figure 1), on the continental slope. It is located in the north of the Campos Basin. The 392-cm-long sediment sequence mainly consists of continuous hemipelagic mud, representing the time interval between 130-2.5 kyr (MIS 5-1). Micropaleontological and geochemical analyses were performed on the same samples, chosen on the basis of carbonate content in sediments, covering the major variations found.
Age model and sedimentation rateThe age model is based on the correlation of the isotopic
record of planktonic foraminifera with the LR04 isotopic curve of Lisiecki & Raymo (2005), using the Analyseries 2.0 software (Paillard et al., 1996) (Figure 2). Two radiocarbon datings, performed on 120 specimens of planktonic foraminifera Globigerinoides ruber (> 150 μm) each,
REVISTA BRASILEIRA DE PALEONTOLOGIA, 16(3), 2013362

were used as control points. The planktonic foraminiferal biostratigraphy of the core (Iwai, 2010) agrees with the boundaries of the isotopic stages, supporting the presented age model. The biozones X (MIS 5), Y (MIS 4, 3 and 2) and Z (MIS 1) were found. In the lowermost part of the core, the values of the isotopic record reach levels similar to those of the Holocene, suggesting that the record includes the MIS 5e. The correlation coeffi cient between the curves was 0.87.
Radiocarbon datings were performed at the National Ocean Science Accelerator Mass Spectrometer Facility (NOSAMS) in the Woods Hole Oceanographic Institution. The results were converted to calendar ages using the calibration program of Stuiver & Reimer (1993) (Table 1).
The oxygen isotope stratigraphy of the core is based on the record of the planktonic foraminifera Globigerinoides ruber (white) (> 150 μm). Stable isotope measurements were made at the Mass Spectrometry Laboratory of the University of California (Santa Cruz, USA), with Dual Inlet Isotope Ratio equipment (fi ve specimens per sample). The sedimentation rates were 2.3 cm/kyr during MIS 5, 4, 3 and part of MIS 2, but increased to 24.4 cm/kyr during MIS 2 and then decreased to 6.3 cm/kyr during MIS1.
Sample preparationSlides for microscope analyses of coccolithophores
were prepared according to Koch & Young (2007). After oven drying the sediment, it was removed a sub-sample of about 0.1-0.2 g, and diluted it in 10 ml of buffered distilled water. The volume of suspension which contained 0.008 g of sediment was calculated, and a micropipette was used to transfer this volume to a second test-tube, with 10 ml of buffered distilled water. 100 μl of this second solution was pipetted onto a coverslip. After being quickly dried on a hot-plate, Canada balsam was used to mount slides.
Since the weight of sediment transferred to the slide is known, counts of coccoliths per fi eld of view can readily be converted into numbers of specimens per gram of sediment, as follows:
(number of specimens)(gram of sediment)
A × Nf × n ×W=
where: A = coverslip area; N = number of specimens counted; f = area of one fi eld of view; n = number of fi elds of view counted; W = weight of sediment on coverslip.
Observations were made using a light polarizing microscope (1000×). At least 300 specimens were counted and identifi ed, whereas Florisphaera profunda, ascidian spicules and Thoracosphaera sp. were considered separately. Species were identifi ed according to the studies of Hay (1977) and Perch-Nielsen (1985), which present images in optical microscopy. The genus Gephyrocapsa was divided in three morphotypes: small Gephyrocapsa (< 2.4 μm), medium Gephyrocapsa (2.4-3.9 μm) and large Gephyrocapsa (> 3.9 μm). A taxonomic list of all identifi ed species is given in Appendix 1. The most relevant species for the paleoceanographic interpretation were photographed using a light polarizing microscope (1200×) (Figure 3).
Statistical analysisThe N ratio (Flores et al., 2000) was calculated to
assess the paleoproductivity. It is represented by the ratio of the absolute abundance of reticulofenestrids (Emiliania
Table 1. 14C dating results and calendar ages.
Depth (cm) 14C age 14C age corrected
Calendar age
0 2780±20 2430 2.44050 9570±35 9220 10.410
Figure 1. Schematic representation of the large-scale, upper-level circulation in the South Atlantic and the location of KF13 core (modifi ed from Peterson & Stramma, 1991).
Figure 2. KF13 core model age from correlation with the standard curve LR04, indicating the Marine Isotope Stage (MIS) and the planktonic foraminiferal biozones (X, Y and Z).
363LEONHARDT ET AL. – THE PRODUCTIVITY HISTORY IN THE SOUTHWESTERN ATLANTIC

Figure 3. Photographs under optical microscope (1200×) of selected species: A, Calcidiscus leptoporus; B, Calciosolenia murrayi; C, Emiliania huxleyi; D, Florisphaera profunda; E, large Gephyrocapsa; F, medium Gephyrocapsa; G, small Gephyrocapsa; H, Helicosphaera carteri; I, Helicosphaera hyalina; J, Helicosphaera pavimentum; K, Rhabdosphaera claviger; L, Syracosphaera histrica; M, Syracosphaera pulchra; N, Umbilicosphaera sibogae; O, Umbellosphaera irregularis. Scale bars = 2 μm.
A
D
G
J
M
B
E
H
K
N
C
F
I
L
O
REVISTA BRASILEIRA DE PALEONTOLOGIA, 16(3), 2013364

The Shannon diversity index was calculated using the free software PAST 2.05 (Hammer et al., 2001). The dissolution index (CEX) proposed by Baumann & Freitag (2004) was used to verify the preferential dissolution of coccoliths.
For the ordination analysis, the abundance of Gephyrocapsa spp. and Emiliania huxleyi were grouped because these species substitute each other over time, occupying similar ecological niche. Abrupt changes in their abundances probably represent a long term evolutionary trend, with superimposed short-term ecological variations (Baumann et al., 2004), generating non-analogous situations. The analyses were performed using the statistical software MULTIV (Pillar, 2006) and the PAST 2.05 software (Hammer et al., 2001) was used to build the graphs. The data matrix is composed of the species percentage for each depth level. The dissimilarity between sample units was measured by Euclidean distance. The ordination was performed using the technique of principal co-ordinates analysis (PCoA); the signifi cance of the axes was assessed by bootstrapping, with 1000 iterations, α = 0.1 (Pillar, 1999).
The authors also performed a multivariate analysis of variance (MANOVA) between groups previously defi ned by the isotope stages. The dissimilarity between sampling units (relative abundances of species for each depth level) was measured by Euclidean distance. The test was based on the sum of squares between groups, using randomization with 10,000 iterations, α = 0.05 (Pillar & Orlóci, 1996). Additionally, the species occurring in at least ⅓ of the sample units, with relative abundance of 1% or more in at least one deep level, were selected and subjected to the same statistical procedure.
RESULTS
Coccolithophore assemblage variationsIn total, 36 coccolithophore taxa were identifi ed, besides
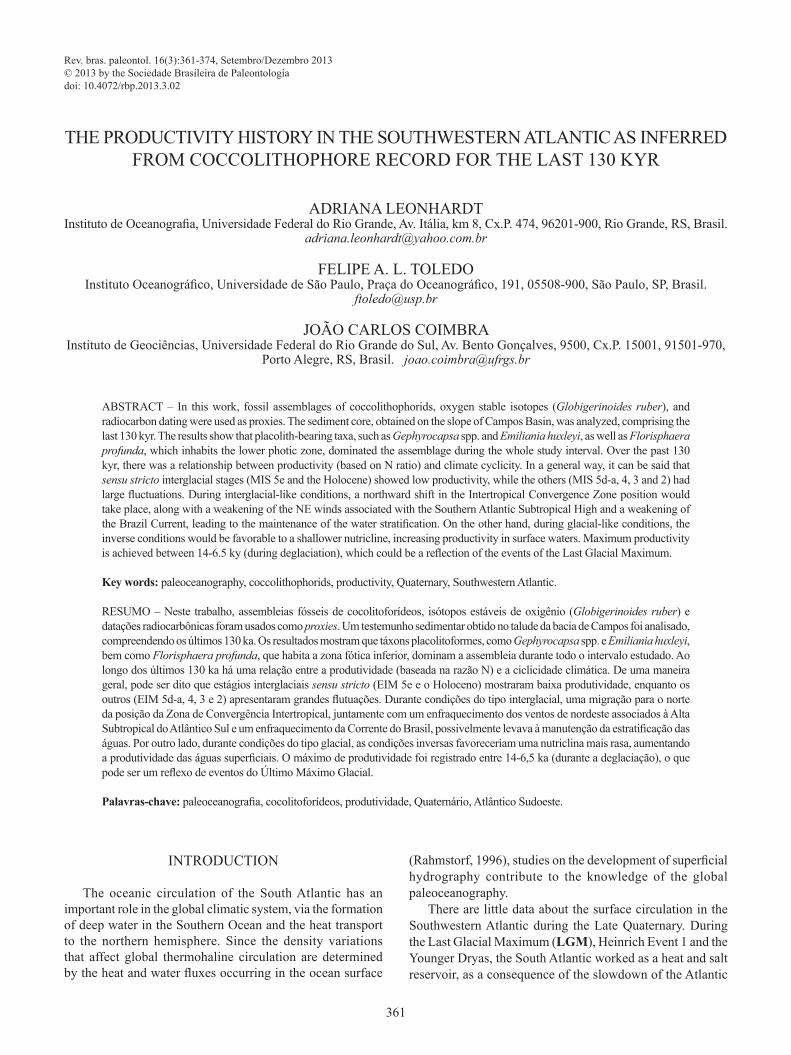
Thoracosphaera spp. and ascidian spicules. The total coccolith numbers were higher in MIS 1 and 5, reaching 26.4 ×10⁸coccoliths/g sediment; the lowest numbers were registered also in MIS 1, around 11 ka, with an almost barren sample. The Shannon diversity varied between 1.66 and 1.97. High diversity peaks occurred between 123-119 kyr (MIS 5e), 75-67 kyr (MIS 5a-4) and 32.5-15 kyr (MIS 3-2). Low diversity intervals occurred between 104-84 kyr (MIS 5d-5a) and 12.5-4 kyr (MIS 1). In a general way, diversity is higher when total coccolith numbers are higher; the N ratio has an opposite behavior (Figure 4). In the studied interval, only fi ve taxa are responsible for the behavior of the total coccolith
Part I (130-125 kyr). Characterized by high total coccolith numbers, decreasing from 24.6 to 18.5 ×10⁸coccoliths/g sediment. The N ratio shows low values (Figure 4).
In this interval, the taxa with higher absolute numbers are Gephyrocapsa (large, medium and small) and Florisphaera profunda. Also standing out in smaller abundances are Rhabdosphaera stylifera, R. claviger, Calcidiscus leptoporus, Helicosphaera hyalina, H. carteri (Figure 5) and Thoracosphaera spp.
The coccolith assemblage is dominated by Florisphaera profunda (32-40%), followed by Gephyrocapsa spp. (Figure 6). Reticulofenestra spp. also stands out.Part II (125-14 kyr). Characterized by several oscillations in total coccolith numbers, with values ranging from 14.7 to 4.9 ×10⁸ coccoliths/g sediment. The N ratio is characterized by large fl uctuations: fi rst, an increase (125-104 kyr), then a large decrease (104-75 kyr), followed by progressively higher values (75-14 kyr) (Figure 4).
In this interval, the coccolith numbers of morphotypes of Gephyrocapsa were very much lower than during part I. However, there is an increase in their abundance around 84-71 kyr, and a decrease later. The fi rst important rise in coccolith numbers of Emiliania huxleyi was found around 41 ka, followed by a decrease and then an increase in the fi nal portion of part II (around 20 ka). The coccolith numbers of Florisphaera profunda also showed a large decline in the beginning of part II; between 98-71 kyr the numbers are higher and there are peaks in 41 ka and in 15 ka. Also stand out, with peaks in the initial and middle portions of part II: Rhabdosphaera claviger, Calcidiscus leptoporus, Helicosphaera hyalina, H. pavimentum, Syracosphaera pulchra, Thoracosphaera spp. and ascidian spicules. In the fi nal portion of part II, stand out taxa are C. leptoporus, H. hyalina, H. carteri, Calciosolenia murrayi and S. pulchra (Figure 4).
Large and medium Gephyrocapsa had their relative abundance in coccolith assemblage progressively reduced, but small Gephyrocapsa showed fl uctuations, with peaks in 104 ka and 63 ka. The rise of Emiliania huxleyi started from 63 ka onwards; it becomes the most abundant species in recent samples. The relative abundance of Florisphaera profunda is important in part II; between 98-37 kyr it is always higher than 28.8%. Also standing out are Rhabdosphaera stylifera, R. claviger, Calcidiscus leptoporus, Umbilicosphaera sibogae, Helicosphaera hyalina, H. pavimentum, Calciosolenia murrayi, Syracosphaera pulchra (Figure 6) and ascidian spicules, with several fl uctuations.Part III (14-6.5 kyr). Characterized by very low values of total coccolith numbers, between 4.2-0 ×108coccoliths/g
huxleyi and Gephyrocapsa spp. - opportunistic species) and reticulofenestrids and Florisphaera profunda (lower photic zone dweller). High values in the N ratio imply a relatively shallow nutricline/thermocline position. Low values are interpreted as a relatively deep nutricline/thermocline position.
% Emiliania huxleyi + % Gephyrocapsa “small”
% Emiliania huxleyi + % Gephyrocapsa “small” + % Calcidiscus leptoporusCEX =
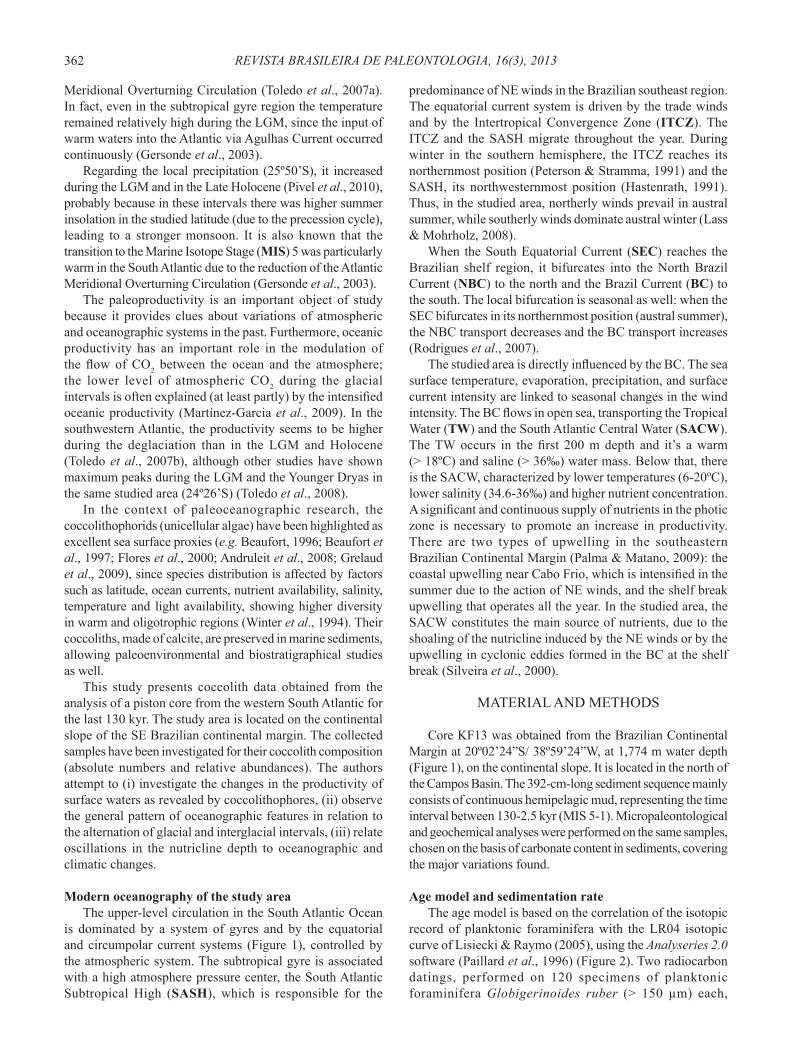
numbers curve: large, medium and small Gephyrocapsa, Emiliania huxleyi and Florisphaera profunda (Figure 5). All the other taxa put together reached a maximum of 13.1%.
In order to facilitate data analysis, four parts can be defi ned in the study interval based on total coccolith numbers.
365LEONHARDT ET AL. – THE PRODUCTIVITY HISTORY IN THE SOUTHWESTERN ATLANTIC
Figure 4. General data for the last 130 kyr of KF13 core. MIS 1-5 are labeled on top and indicated by white and gray bars. I, II, III and IV indicate a subdivision of the study section into four coccolith periods.
sediment. The N ratio showed the highest values of the core (Figure 4). In this interval, all taxa showed a large decrease in coccolith numbers, not only the dominant species, but also the subordinate species (Figure 5).
The morphotypes of Gephyrocapsa show a slight increase in their relative abundance, but Emiliania huxleyi is the dominant species in part III, reaching 45% of the assemblage. Florisphaera profunda, important before, shows in this part its lower percentage. Also standing out in smaller percentages are Rhabdosphaera stylifera, Helicosphaera pavimentum (Figure 6), Thoracosphaera spp. and ascidian spicules.Part IV (6.5-2.5 kyr). Characterized by high values of total coccolith numbers, rising progressively from 18.3 to 26.4 ×10⁸coccoliths/g sediment. The N ratio showed a progressive decrease in values (Figure 4).
In this interval, the coccolith numbers of Gephyrocapsa, Emiliania huxleyi and Florisphaera profunda increased considerably once again. A marked rise was also observed in the numbers of Rhabdosphaera claviger, Calcidiscus leptoporus, Umbilicosphaera sibogae, Helicosphaera hyalina, Calciosolenia murrayi and Syracosphaera pulchra (Figure 5).
Figure 5. Total coccolith numbers of selected species at KF13 core. MIS 1-5 and coccolith periods I-IV are labeled.
REVISTA BRASILEIRA DE PALEONTOLOGIA, 16(3), 2013366
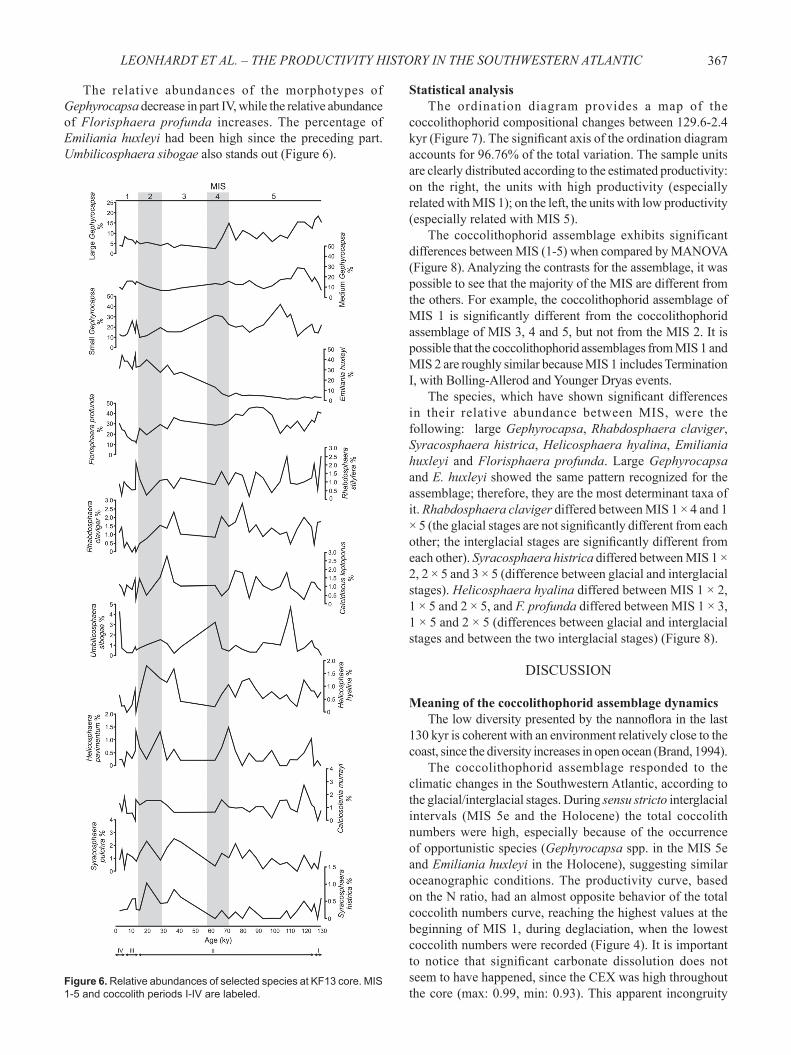
The relative abundances of the morphotypes of Gephyrocapsa decrease in part IV, while the relative abundance of Florisphaera profunda increases. The percentage of Emiliania huxleyi had been high since the preceding part. Umbilicosphaera sibogae also stands out (Figure 6).
Statistical analysisThe ordination diagram provides a map of the
coccolithophorid compositional changes between 129.6-2.4 kyr (Figure 7). The signifi cant axis of the ordination diagram accounts for 96.76% of the total variation. The sample units are clearly distributed according to the estimated productivity: on the right, the units with high productivity (especially related with MIS 1); on the left, the units with low productivity (especially related with MIS 5).
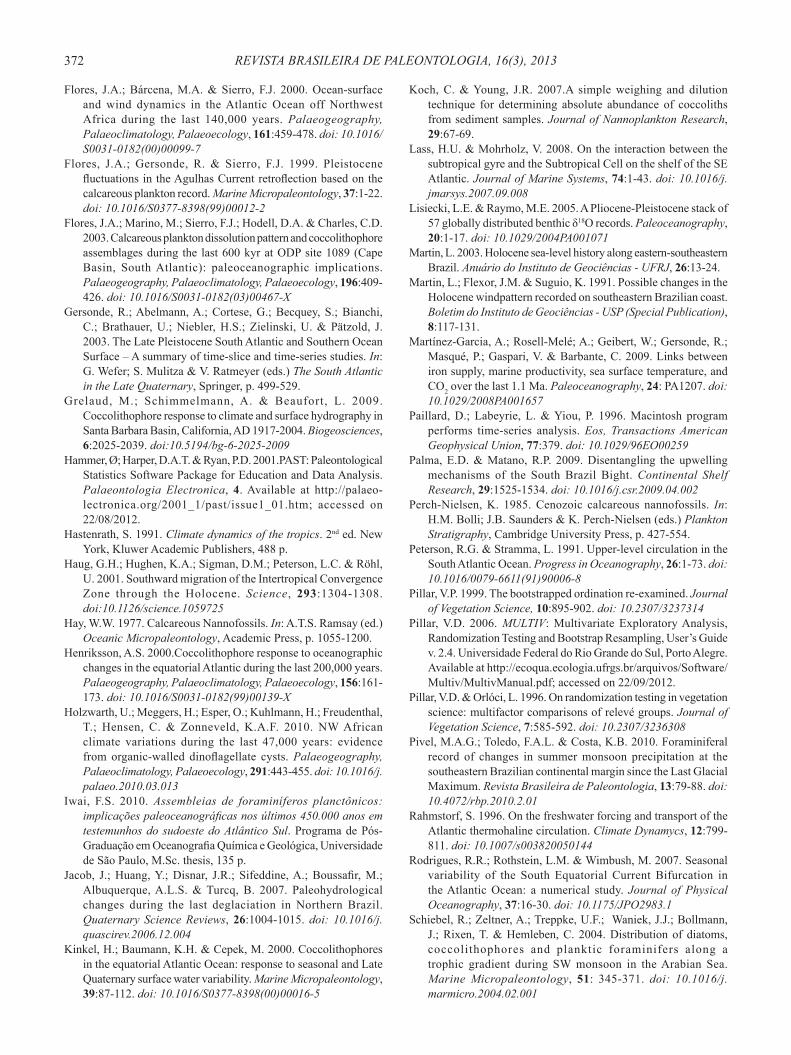
The coccolithophorid assemblage exhibits significant differences between MIS (1-5) when compared by MANOVA (Figure 8). Analyzing the contrasts for the assemblage, it was possible to see that the majority of the MIS are different from the others. For example, the coccolithophorid assemblage of MIS 1 is signifi cantly different from the coccolithophorid assemblage of MIS 3, 4 and 5, but not from the MIS 2. It is possible that the coccolithophorid assemblages from MIS 1 and MIS 2 are roughly similar because MIS 1 includes Termination I, with Bolling-Allerod and Younger Dryas events.
The species, which have shown signifi cant differences in their relative abundance between MIS, were the following: large Gephyrocapsa, Rhabdosphaera claviger, Syracosphaera histrica, Helicosphaera hyalina, Emiliania huxleyi and Florisphaera profunda. Large Gephyrocapsa and E. huxleyi showed the same pattern recognized for the assemblage; therefore, they are the most determinant taxa of it. Rhabdosphaera claviger differed between MIS 1 × 4 and 1 × 5 (the glacial stages are not signifi cantly different from each other; the interglacial stages are signifi cantly different from each other). Syracosphaera histrica differed between MIS 1 × 2, 2 × 5 and 3 × 5 (difference between glacial and interglacial stages). Helicosphaera hyalina differed between MIS 1 × 2, 1 × 5 and 2 × 5, and F. profunda differed between MIS 1 × 3, 1 × 5 and 2 × 5 (differences between glacial and interglacial stages and between the two interglacial stages) (Figure 8).
DISCUSSION
Meaning of the coccolithophorid assemblage dynamicsThe low diversity presented by the nannofl ora in the last
130 kyr is coherent with an environment relatively close to the coast, since the diversity increases in open ocean (Brand, 1994).
The coccolithophorid assemblage responded to the climatic changes in the Southwestern Atlantic, according to the glacial/interglacial stages. During sensu stricto interglacial intervals (MIS 5e and the Holocene) the total coccolith numbers were high, especially because of the occurrence of opportunistic species (Gephyrocapsa spp. in the MIS 5e and Emiliania huxleyi in the Holocene), suggesting similar oceanographic conditions. The productivity curve, based on the N ratio, had an almost opposite behavior of the total coccolith numbers curve, reaching the highest values at the beginning of MIS 1, during deglaciation, when the lowest coccolith numbers were recorded (Figure 4). It is important to notice that signifi cant carbonate dissolution does not seem to have happened, since the CEX was high throughout the core (max: 0.99, min: 0.93). This apparent incongruity
Figure 6. Relative abundances of selected species at KF13 core. MIS 1-5 and coccolith periods I-IV are labeled.
367LEONHARDT ET AL. – THE PRODUCTIVITY HISTORY IN THE SOUTHWESTERN ATLANTIC
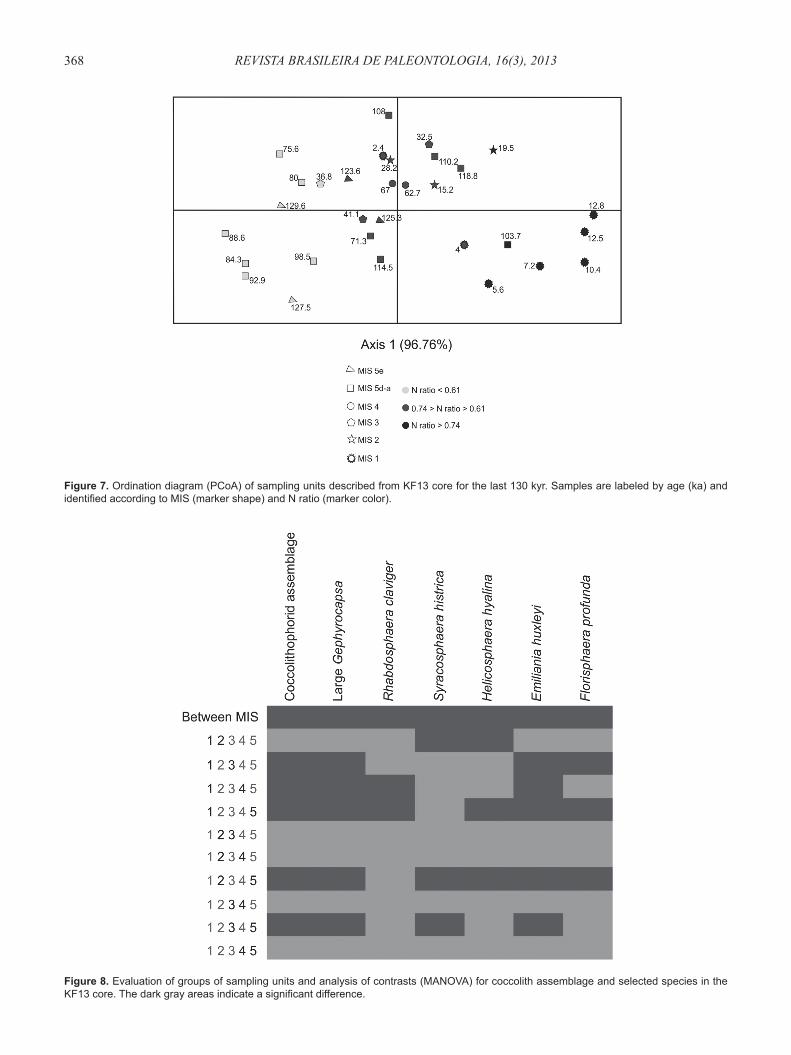
Figure 8. Evaluation of groups of sampling units and analysis of contrasts (MANOVA) for coccolith assemblage and selected species in the KF13 core. The dark gray areas indicate a signifi cant difference.
Figure 7. Ordination diagram (PCoA) of sampling units described from KF13 core for the last 130 kyr. Samples are labeled by age (ka) and identifi ed according to MIS (marker shape) and N ratio (marker color).
REVISTA BRASILEIRA DE PALEONTOLOGIA, 16(3), 2013368

can be explained by the adaptation of coccolithophorids to oligotrophic waters. With the enhancement of nutrient availability, opportunistic species quickly respond, becoming more abundant in relation to Florisphaera profunda; thus, the N ratio increases. However, coccolithophorids cannot compete with phytoplankton groups that explore more effi ciently this nutrient availability and have higher reproductive rates, such as diatoms, and their absolute numbers remain low.
In the Arabian Sea, for instance, the competition with diatoms partly controls the coccolithophorid abundance and diversity. Coccolithophorids become scarcer where diatoms dominate (Andruleit et al., 2003). In the South China Sea, coccolithophorids become abundant when the nutrient concentration is higher, especially Emiliania huxleyi and Gephyrocapsa spp. Nevertheless, whenever silicate is also abundant, diatoms become dominant (Chen et al., 2007). In the oligotrophic region of the Northeast Atlantic, the coccolithophorid fl ux is larger than the diatom fl ux. In the temperate region (nutrient rich), diatoms dominate, and the coccolithophorid populations only grow when silicate become scarce (Broerse et al., 2000). During the Late Pleistocene, in the Southeast Atlantic, the warm intervals are characterized by higher coccolith numbers associated with lower nutrient availability (reduced upwelling in the studied area) (Baumann & Freitag, 2004). Thus, the competition between coccolithophorids and other phytoplankton groups seems to be a coherent explanation for core KF13 data. Today, oligotrophic waters favor the development of coccolithophorid populations, but not the productivity, leading to antagonic results between total coccolith numbers and N ratio. Diversity also increases when the N ratio is low (Figure 4), once the group is better adapted to oligotrophic conditions.
Besides the productivity, the other factor that must be considered is the dilution of coccoliths caused by the terrigenous sediment input. Thus, coccoliths become more abundant in open sea sediments than close to the coast (Andruleit et al., 2008). This pattern was recognized in surface sediments of the Arabian Sea (Andruleit & Rogalla, 2002) and of the Southeast Atlantic (Boeckel & Baumann, 2004). In fact, in core KF13, samples with lower total coccolith numbers are related to high sedimentation rate intervals.
Andruleit et al. (2008), researching the Late Quaternary in the East Indian Ocean, noticed that species with different ecological requirements show very similar curves of coccolith numbers; the same was observed in other regions. On the other hand, relative abundance can better show the response of indicator species to changes in environmental conditions. The same was observed in core KF13: the curves of coccolith numbers are very similar among different species (Figure 5); their percentages (Figure 6) can be better used in paleoceanography.
Looking at the PCoA (Figure 7), it is possible to see that the productivity is the dispersal factor of sample units. The units related to MIS 5e and 1 do not overlap on the axis. Thus, although MIS 5e and 1 seem very similar, MIS 1 shows higher productivity. This difference may be related to the fact that the record is from the fi nal MIS 5e and from the initial MIS
1 (including Bolling-Allerod and Younger Dryas events), representing different moments in interglacial periods. Besides, the highest values of productivity were registered at the beginning of the MIS 1, probably still related to events of the LGM (discussed below). MIS 5 seems to be a stage with larger climatic fl uctuations, since the units are distributed along the whole axis. This is expected, since MIS 5 is globally divided in substages. MIS 4 and 3 are plotted near the diagram center, representing intermediate climatic conditions. MIS 2 has some overlap with MIS 1, probably because MIS 1 includes Termination I. This is a very likely explanation, since the same problem was detected in MANOVA (Figure 8).
In a general way, it can be said that sensu stricto interglacial stages (MIS 5e and the Holocene) show low productivity. The others (MIS 5d-a, 4, 3 and 2) show many fl uctuations of this oceanographic parameter. The same pattern was observed in the east equatorial Atlantic (Flores et al., 2000; Henriksson, 2000). Thus, in milder stages (MIS 5d-a and 3), productivity tends to decrease along with the deepening of the nutricline.Time-interval 130-125 kyr. This interval comprehends the MIS 5e. The productivity was low (Figure 4); possibly, the deep nutricline did not enable the fertilization of surface waters. In high latitudes of the North Atlantic, coccolithophorids are abundant in MIS 5e also, characterizing a relatively warm stage, with stratifi ed waters (Stolz & Baumann, 2010).
The percentage of large Gephyrocapsa (Figure 6) deserves attention: the majority of specimens of this morphotype is related to Gephyrocapsa oceanica. This species prefer open ocean warm waters (Schiebel et al., 2004). In fact, large Gephyrocapsa reaches the highest percentage values during MIS 5e. Time-interval 125-14 kyr. This interval comprises MIS 5d-a, 4, 3 and 2. The end of MIS 5e is marked by an increase in productivity until 104 ka, when the nutricline should be shallower. Thereafter, the productivity decreases, showing the lowest recorded values until 75 ka. Near the beginning of MIS 4 until the end of the interval, productivity increases progressively (Figure 4).
The percentage of large Gephyrocapsa is not important from 71 ka onwards, with the end of MIS 5 (Figure 6). Similarly, Baumann & Freitag (2004) found high percentages of G. oceanica only in warm intervals (MIS 19, 7 and 5) in middle latitudes of the southeast Atlantic. This agrees with the interpretation that the species prefers warm waters, although other authors claim a preference for eutrophic environments: in the Indian Ocean, G. oceanica is associated to monsoon-induced upwelling (Andruleit et al., 2000; Broerse et al., 2000).Time-interval 14-6.5 kyr. This interval corresponds to part of MIS 1, including the deglaciation. The productivity reaches its maximum in this interval, with a peak around 12.8 ka (Figure 4). The highest sedimentation rates were estimated between 13-10.6 ka. Higher sedimentation rates were also found during MIS 2 in a nearby area (24º26’S) (Toledo et al., 2007b). In this interval, the sediments are siliciclastic, suggesting a greater contribution of terrigenous input, which may be related to the raised nutrient availability.
369LEONHARDT ET AL. – THE PRODUCTIVITY HISTORY IN THE SOUTHWESTERN ATLANTIC

Time-interval 6.5-2.5 kyr. This interval corresponds to part of MIS 1 (Holocene). Here, indicators have become very similar to the ones of part I (MIS 5e), with low productivity and high total coccolith numbers (Figure 4). It seems that the climatic conditions in both sensu stricto interglacial stages were very similar, with well stratifi ed waters.
Paleoceanographic interpretation and the Brazil Current system
To interpret the changes in climate and in productivity identified in the coccolithophorid and oxygen isotopes record it is necessary to make analogies with the current climatic conditions. For this purpose, a paleoceanographic reconstruction is presented, linking the glacial/interglacial cyclicity, the intensity of winds, the position of the SEC bifurcation and the nutricline depth. This reconstruction is an extrapolation of the information obtained from the proxies, in order to relate the observed variations in the KF13 core with global and regional paleoceanographic changes.
As the ITCZ migrates seasonally to the warmer hemisphere, during glacial-like conditions it would be displaced to the south. The NE trade winds and the NE winds associated with the SASH would be intensifi ed, favoring the shoaling of the nutricline. Thus, the SACW would fertilize the surface waters, resulting in high productivity. In interglacial like-conditions, the characteristics would be opposite, leading to stratifi ed waters, with deep nutricline and low productivity.
In the Southeast Equatorial Atlantic, the glacial stages are also characterized by high productivity, since the intensifi ed northeast trade winds enhanced the equatorial divergence and a shallower nutricline (Flores et al., 2000; Henriksson, 2000; Kinkel et al., 2000). At the same time, the nutricline is deeper in the equatorial southwest Atlantic (Kinkel et al., 2000). In the Southeast Atlantic, in high latitudes, productivity is also higher in cold intervals, especially in transition from MIS 2 to 1, caused by the infl uence of the Subantartic Front (Flores et al., 2003). The coccolithophorid record shows that the Subtropical Front in the Southern Ocean also migrates to the north during cold intervals in the last 130 kyr (Findlay & Flores, 2000). In interglacial stages in the Southeast Atlantic, the Subtropical Convergence Zone migrates to the south, probably linked to westward displacement of the Agulhas Current retrofl exion, bringing warm waters from the Indian Ocean to the Atlantic Ocean (interpretation based in the coccolithophorid and planktonic foraminifera record) (Flores et al., 1999).Time-interval 130-125 kyr. Here, the oceanographic conditions should have been similar to the current ones, as pointed out by the composition and abundance of coccolithophorids, since it is an interglacial stage (MIS 5e). The low intensity of NE winds led to stratifi ed waters, resulting in an interval of low productivity (although higher than the Holocene).Time-interval 125-14 kyr. The productivity fl uctuations are related to changes in the atmospheric and oceanic circulation.
Productivity increases until 104 ka, near the peak of substage 5d (a colder interval in a lato sensu interglacial stage). The high intensity of NE winds favor the shoaling of the nutricline.
Productivity between 104 to 75 kyr is low, covering the sub-stages 5c, 5b and 5a. 5c and 5a are warm sub-stages. 5b is cold, but shorter than the others. The whole interval seems characterized as warm very likely because of the low resolution of the core. In warm intervals, the atmospheric circulation leads to stratifi ed waters. MIS 5 as a whole is a stage of mild climatic conditions.
Since then, the nutricline seems to remain shallower until the end of the interval (covering MIS 4, 3 and 2). During MIS 3 the productivity slightly decreased (therefore, the nutricline deepened) probably because it is a milder stage than MIS 4 and 2.
During MIS 2, the climatic conditions are even harsher, reaching the LGM around 19 ka. Modeling studies show that the ITCZ would be displaced to the South during the LGM because the land ice sheet (northern hemisphere) forces increased northeast trade winds (Chiang et al., 2003). Holzwarth et al. (2010) also found a strengthening of northeast trade winds from LGM to Heinrich Event 1 (24-14 kyr) analyzing the dinofl agellate record in northeast Atlantic. In the north of Brazil, climate seems arid during LGM, showing a large humidity increase between 17.3-16.8 kyr (hydrogen isotope record in Caçó Lake). The authors also interpreted this data as a displacement of the ITCZ to the south during the LGM (Jacob et al., 2007).
Besides the effects on the atmospheric and oceanic circulation, during the LGM the retraction of the coastline reaches its maximum, exposing a large part of continental shelf to erosion. Thus, the terrigenous nutrient input to the continental slope should have been much larger, leading to increased productivity. Filippelli et al. (2007) presented the phosphorus variation record during glacial intervals in the Southern Ocean and the Equatorial Pacifi c Ocean. The authors showed that the redistribution of phosphorus from the margin to the deep ocean during regressions has had impact in the oceanic phosphorus cycle. There is a lag between cause and effect, and the productivity increases in the transition of glacial to interglacial stages. This pattern occurs in core KF13, since the maximum productivity is reached after the LGM.Time-interval 14-6.5 kyr. In this study, the productivity is high since the LGM, but reaches its maximum at 12.8 ka, during deglaciation.
These results agree with the data found in a nearby area, using planktonic foraminifera, coccolithophorids and Cd/Ca as proxies: the deglaciation (14-8 kyr) seems to be the more productive interval in the last 25 kyr (Toledo et al., 2007b). Nevertheless, different results were obtained when the Globigerina bulloides/Globigerinoides ruber ratio (planktonic foraminifera) was used: productivity would have decreased severely during deglaciation (Toledo et al., 2008). The authors believe that this discrepancy is due to the multivariate character of planktonic foraminifera adaptations. The increased G. bulloides/G. ruber ratio would be more related to a northward shift in the climatic belts than is related to the nutrient availability.
Around 11 ka, the Holocene begins. Data point to a displacement to the north of the ITCZ during early Holocene (Haug et al., 2001; Holzwarth et al., 2010). However, the coccolithophorid record of core KF13 did not show any
REVISTA BRASILEIRA DE PALEONTOLOGIA, 16(3), 2013370

signifi cant changes at this time. Around 7.2 ka the productivity was still high.Time-interval 6.5-2.5 kyr. Similarly to MIS 5e, the productivity decreases. Many climatic changes characterize this interval. A general southward shift of the ITCZ over the course of the Holocene may have resulted from changes in the seasonality of insolation associated with the 21 kyr precession component of Milankovitch forcing (Haug et al., 2001). Besides, supporting evidence for an increase in El Niño-like conditions in the late Holocene comes from both paleoclimatic reconstructions and modeling studies (Martin et al., 1991; Haug et al., 2001; Ybert et al., 2001). A secondary factor is the marine transgression that took place since 7.8 ka. It reaches its maximum at 5.6 ka (4.7±0.5 m above the current coastline) and lasted until 2.3 ka (Martin, 2003).
CONCLUSIONS
The dynamics of coccolithophorid assemblages in the last 130 kyr allowed a paleoceanographic reconstruction for the Southwestern Atlantic, especially related to the productivity (based on N ratio). The main conclusions can be summarized as follows: (i) general changes related to the cyclicity of glacial and interglacial stages are perceived. It can be said that sensu stricto interglacial stages (MIS 5e and the Holocene) are characterized by low productivity, while the lato sensu interglacial and glacial stages (MIS 5d-a, 4, 3 and 2) are characterized by large variations in this parameter. These variations refl ect fl uctuations in the depth of the nutricline; (ii) the productivity increase seems to be related with strongest NE winds and strengthening of BC, that leads to a shallower nutricline; (iii) maximum productivity is reached between 14-6.5 kyr (including the deglaciation and the beginning of the Holocene), with a peak around 12.8 ka. The increase of nutrient availability can also be related to the input of continental sediments (by the erosion of the exposed shelf during marine regression in the LGM) and the consequent redistribution of phosphorus from the margins to the deep ocean. Thus, the productivity increases with some delay between cause and effect.
ACKNOWLEDGMENTS
The authors are indebted to Brazilian National Council for Scientifi c and Technological Development (CNPq) for the financial support (processes numbers 471611/2010-7 and 300703/2009-0) and to Petróleo Brasileiro S.A. (PETROBRAS) by the samples. A.L. is grateful to CNPq for having granted a scholarship. Thanks to the reviewers by the great intellectual contribution to this work.
REFERENCES
Andruleit, H.A.; von Rad, U.; Bruns, A. & Ittekkot, V. 2000. Coccolithophore fl uxes from sediment traps in the northeastern Arabian Sea off Pakistan. Marine Micropaleontology, 38:285-308. doi: 10.1016/S0377-8398(00)00007-4
Andruleit, H. & Rogalla, U. 2002.Coccolithophores in surface sediments of the Arabian Sea in relation to environmental gradients in surface waters. Marine Geology, 186:505-526. doi: 10.1016/S0025-3227(02)00312-2
Andruleit, H.; Stäger, S.; Rogalla, U.& Čepek, P. 2003. Living coccolithophores in the northern Arabian Sea: ecological tolerances and environmental control. Marine Micropaleontology, 49:157-181. doi: 10.1016/S0377-8398(03)00049-5
Andruleit, H.; Lückge, A.; Wiedicke, M. & Stäger, S. 2008.Late Quaternary development of the Java upwelling system (eastern Indian Ocean) as revealed by coccolithophores. Marine Micropaleontology, 69:3-15. doi: 10.1016/j.marmicro.2007.11.005
Baumann, K.H.; Böckel, B. & Frenz, M. 2004. Coccolith contribution to South Atlantic carbonate sedimentation. In: H.R. Thierstein & J.R. Young (eds.) Coccolithophores. From Molecular Processes to Global Impact, Springer, p. 367-402. doi: 10.1007/978-3-662-06278-4_14
Baumann, K.H. & Freitag, T. 2004. Pleistocene fl uctuations in the northern Benguela Current system as revealed by coccolith assemblages. Marine Micropaleontology, 52:195-215. doi: 10.1016/j.marmicro.2004.04.011
Beaufort, L. 1996. Dynamics of the monsoon in the equatorial Indian Ocean over the last 260,000 years. Quaternary International, 31:13-18. doi: 10.1016/1040-6182(95)00017-D
Beaufort, L.; Lancelot, Y.; Camberlin, P.; Cayre, O.; Vincent, E.; Bassinot, F. & Labeyrie, L. 1997. Insolation Cycles as a Major Control of Equatorial Indian Ocean Primary Production. Science, 278:1451-1454. doi: 10.1126/science.278.5342.1451
Boeckel, B. & Baumann, K-H. 2004. Distribution of coccoliths in surface sediments in the south-eastern South Atlantic Ocean: ecology, preservation and carbonate contribution. Marine Micropaleontology, 51:301-320. doi: 10.1016/j.marmicro.2004.01.001
Brand, L.E. 1994. Physiological ecology of marine coccolithophores. In: A. Winter & W.G. Siesser (eds.) Coccolithophores, Cambridge University, p. 39-49.
Broerse, A.T.C.; Brummer, G.J.A. & Van Hinte, J.E. 2000. Coccolithophore export production in response to monsoonal upwelling off Somalia (northwestern Indian Ocean). Deep-Sea Research II, 47:2179-2205. doi: 10.1016/S0967-0645(00)00021-7
Broerse, A.T.C.; Ziveri, P.; van Hinte, J.E. & Honjo, S. 2000. Coccolithophore export production, species composition, and coccolith CaCO3 fl uxes in the NE Atlantic (34ºN 21ºW and 48ºN 21ºW). Deep Sea Research II: Topical Studies in Oceanography, 47:1877-1905. doi: 10.1016/S0967-0645(00)00010-2
Chen, Y.L.; Chen, H.Y. & Chung, C.W. 2007. Seasonal variability of coccolithophore abundance and assemblage in the northern South China Sea. Deep Sea Research II: Topical Studies in Oceanography, 54:1617-1633. doi: 10.1016/j.dsr2.2007.05.005
Chiang, J.C.H.; Biasutti, M. & Battisti, D.S. 2003.Sensitivity of the Atlantic Intertropical Convergence Zone to Last Glacial Maximum boundary conditions. Paleoceanography, 18:1-18. doi: 10.1029/2003pa000916
Filippelli, G.M.; Latimer, J.C.; Murray, R.W. & Flores, J.A. 2007. Productivity records from the Southern Ocean and the equatorial Pacifi c Ocean: testing the glacial shelf-nutrient hypothesis. Deep-Sea Research II: Topical Studies in Oceanography, 54:2443-2452. doi: 10.1016/j.dsr2.2007.07.021
Findlay, C.S. & Flores, J.A. 2000.Subtropical front fl uctuations south of Australia (45º09’S, 146º17’E) for the last 130 ka years based in calcareous nannoplankton. Marine Micropaleontology, 40:403-416. doi: 10.1016/S0377-8398(00)00045-1
371LEONHARDT ET AL. – THE PRODUCTIVITY HISTORY IN THE SOUTHWESTERN ATLANTIC
Flores, J.A.; Bárcena, M.A. & Sierro, F.J. 2000. Ocean-surface and wind dynamics in the Atlantic Ocean off Northwest Africa during the last 140,000 years. Palaeogeography, Palaeoclimatology, Palaeoecology, 161:459-478. doi: 10.1016/S0031-0182(00)00099-7
Flores, J.A.; Gersonde, R. & Sierro, F.J. 1999. Pleistocene fl uctuations in the Agulhas Current retrofl ection based on the calcareous plankton record. Marine Micropaleontology, 37:1-22. doi: 10.1016/S0377-8398(99)00012-2
Flores, J.A.; Marino, M.; Sierro, F.J.; Hodell, D.A. & Charles, C.D. 2003. Calcareous plankton dissolution pattern and coccolithophore assemblages during the last 600 kyr at ODP site 1089 (Cape Basin, South Atlantic): paleoceanographic implications. Palaeogeography, Palaeoclimatology, Palaeoecology, 196:409-426. doi: 10.1016/S0031-0182(03)00467-X
Gersonde, R.; Abelmann, A.; Cortese, G.; Becquey, S.; Bianchi, C.; Brathauer, U.; Niebler, H.S.; Zielinski, U. & Pätzold, J. 2003. The Late Pleistocene South Atlantic and Southern Ocean Surface – A summary of time-slice and time-series studies. In: G. Wefer; S. Mulitza & V. Ratmeyer (eds.) The South Atlantic in the Late Quaternary, Springer, p. 499-529.
Grelaud, M.; Schimmelmann, A. & Beaufort, L. 2009. Coccolithophore response to climate and surface hydrography in Santa Barbara Basin, California, AD 1917-2004. Biogeosciences, 6:2025-2039. doi:10.5194/bg-6-2025-2009
Hammer, Ø; Harper, D.A.T. & Ryan, P.D. 2001.PAST: Paleontological Statistics Software Package for Education and Data Analysis. Palaeontologia Electronica, 4. Available at http://palaeo-lectronica.org/2001_1/past/issue1_01.htm; accessed on 22/08/2012.
Hastenrath, S. 1991. Climate dynamics of the tropics. 2nd ed. New York, Kluwer Academic Publishers, 488 p.
Haug, G.H.; Hughen, K.A.; Sigman, D.M.; Peterson, L.C. & Röhl, U. 2001. Southward migration of the Intertropical Convergence Zone through the Holocene. Science, 293:1304-1308. doi:10.1126/science.1059725
Hay, W.W. 1977. Calcareous Nannofossils. In: A.T.S. Ramsay (ed.) Oceanic Micropaleontology, Academic Press, p. 1055-1200.
Henriksson, A.S. 2000.Coccolithophore response to oceanographic changes in the equatorial Atlantic during the last 200,000 years. Palaeogeography, Palaeoclimatology, Palaeoecology, 156:161-173. doi: 10.1016/S0031-0182(99)00139-X
Holzwarth, U.; Meggers, H.; Esper, O.; Kuhlmann, H.; Freudenthal, T.; Hensen, C. & Zonneveld, K.A.F. 2010. NW African climate variations during the last 47,000 years: evidence from organic-walled dinofl agellate cysts. Palaeogeography, Palaeoclimatology, Palaeoecology, 291:443-455. doi: 10.1016/j.palaeo.2010.03.013
Iwai, F.S. 2010. Assembleias de foraminíferos planctônicos: implicações paleoceanográfi cas nos últimos 450.000 anos em testemunhos do sudoeste do Atlântico Sul. Programa de Pós-Graduação em Oceanografi a Química e Geológica, Universidade de São Paulo, M.Sc. thesis, 135 p.
Jacob, J.; Huang, Y.; Disnar, J.R.; Sifeddine, A.; Boussafi r, M.; Albuquerque, A.L.S. & Turcq, B. 2007. Paleohydrological changes during the last deglaciation in Northern Brazil. Quaternary Science Reviews, 26:1004-1015. doi: 10.1016/j.quascirev.2006.12.004
Kinkel, H.; Baumann, K.H. & Cepek, M. 2000. Coccolithophores in the equatorial Atlantic Ocean: response to seasonal and Late Quaternary surface water variability. Marine Micropaleontology, 39:87-112. doi: 10.1016/S0377-8398(00)00016-5
Koch, C. & Young, J.R. 2007.A simple weighing and dilution technique for determining absolute abundance of coccoliths from sediment samples. Journal of Nannoplankton Research, 29:67-69.
Lass, H.U. & Mohrholz, V. 2008. On the interaction between the subtropical gyre and the Subtropical Cell on the shelf of the SE Atlantic. Journal of Marine Systems, 74:1-43. doi: 10.1016/j.jmarsys.2007.09.008
Lisiecki, L.E. & Raymo, M.E. 2005. A Pliocene-Pleistocene stack of 57 globally distributed benthic δ18O records. Paleoceanography, 20:1-17. doi: 10.1029/2004PA001071
Martin, L. 2003. Holocene sea-level history along eastern-southeastern Brazil. Anuário do Instituto de Geociências - UFRJ, 26:13-24.
Martin, L.; Flexor, J.M. & Suguio, K. 1991. Possible changes in the Holocene windpattern recorded on southeastern Brazilian coast. Boletim do Instituto de Geociências - USP (Special Publication), 8:117-131.
Martínez-Garcia, A.; Rosell-Melé; A.; Geibert, W.; Gersonde, R.; Masqué, P.; Gaspari, V. & Barbante, C. 2009. Links between iron supply, marine productivity, sea surface temperature, and CO2 over the last 1.1 Ma. Paleoceanography, 24: PA1207. doi: 10.1029/2008PA001657
Paillard, D.; Labeyrie, L. & Yiou, P. 1996. Macintosh program performs time-series analysis. Eos, Transactions American Geophysical Union, 77:379. doi: 10.1029/96EO00259
Palma, E.D. & Matano, R.P. 2009. Disentangling the upwelling mechanisms of the South Brazil Bight. Continental Shelf Research, 29:1525-1534. doi: 10.1016/j.csr.2009.04.002
Perch-Nielsen, K. 1985. Cenozoic calcareous nannofossils. In: H.M. Bolli; J.B. Saunders & K. Perch-Nielsen (eds.) Plankton Stratigraphy, Cambridge University Press, p. 427-554.
Peterson, R.G. & Stramma, L. 1991. Upper-level circulation in the South Atlantic Ocean. Progress in Oceanography, 26:1-73. doi: 10.1016/0079-6611(91)90006-8
Pillar, V.P. 1999. The bootstrapped ordination re-examined. Journal of Vegetation Science, 10:895-902. doi: 10.2307/3237314
Pillar, V.D. 2006. MULTIV: Multivariate Exploratory Analysis, Randomization Testing and Bootstrap Resampling, User’s Guide v. 2.4. Universidade Federal do Rio Grande do Sul, Porto Alegre. Available at http://ecoqua.ecologia.ufrgs.br/arquivos/Software/Multiv/MultivManual.pdf; accessed on 22/09/2012.
Pillar, V.D. & Orlóci, L. 1996. On randomization testing in vegetation science: multifactor comparisons of relevé groups. Journal of Vegetation Science, 7:585-592. doi: 10.2307/3236308
Pivel, M.A.G.; Toledo, F.A.L. & Costa, K.B. 2010. Foraminiferal record of changes in summer monsoon precipitation at the southeastern Brazilian continental margin since the Last Glacial Maximum. Revista Brasileira de Paleontologia, 13:79-88. doi: 10.4072/rbp.2010.2.01
Rahmstorf, S. 1996. On the freshwater forcing and transport of the Atlantic thermohaline circulation. Climate Dynamycs, 12:799-811. doi: 10.1007/s003820050144
Rodrigues, R.R.; Rothstein, L.M. & Wimbush, M. 2007. Seasonal variability of the South Equatorial Current Bifurcation in the Atlantic Ocean: a numerical study. Journal of Physical Oceanography, 37:16-30. doi: 10.1175/JPO2983.1
Schiebel, R.; Zeltner, A.; Treppke, U.F.; Waniek, J.J.; Bollmann, J.; Rixen, T. & Hemleben, C. 2004. Distribution of diatoms, coccolithophores and planktic foraminifers along a trophic gradient during SW monsoon in the Arabian Sea. Marine Micropaleontology, 51: 345-371. doi: 10.1016/j.marmicro.2004.02.001
REVISTA BRASILEIRA DE PALEONTOLOGIA, 16(3), 2013372
Silveira, I.C.A.; Schmidt, A.C.K.; Campos, E.J.D.; Godoi, S.S. & Ikeda, Y. 2000.A Corrente do Brasil ao largo da costa leste brasileira. Revista Brasileira de Oceanografi a, 48:171-183. doi: 10.1590/S1413-77392000000200008
Stolz, K. & Baumann, K.H. 2010. Changes in palaeoceanography and palaeoecology during Marine Isotope Stage (MIS) 5 in the eastern North Atlantic (ODP Site 980) deduced from calcareous nannoplankton observation. Palaeogeography, Palaeoclimatology, Palaeoecology, 292:295-305. doi: 10.1016/j.palaeo.2010.04.002
Stuiver, M. & Reimer, P.J. 1993. Extended 14C data base and revised Calib 3.0 14C age calibration program. Radiocarbon, 35:215-230.
Toledo, F.A.L.; Costa, K.B. & Pivel, M.A.G. 2007a. Salinity changes in the western tropical South Atlantic during the last 30 kyr. Global and Planetary Change, 57:383-395. doi: 10.1016/j.gloplacha.2007.01.001
Toledo, F.A.L.; Cachão, M.; Costa, K.B. & Pivel, M.A.G. 2007b. Planktonic foraminifera, calcareous nannoplankton and ascidian
variations during the last 25 kyr in the Southwestern Atlantic: a paleoproductivity signature? Marine Micropaleontology, 64:67-79. doi: 10.1016/j.marmicro.2007.03.001
Toledo, F.A.L.; Costa, K.B.; Pivel, M.A.G. & Campos, E.J.D. 2008. Tracing past circulation changes in the western South Atlantic based on planktonic foraminifera. Revista Brasileira de Paleontologia, 11:169-178. doi: 10.4072/rbp.2008.3.03
Winter, A.; Jordan, R.W. & Roth, P.H. 1994. Biogeography of living coccolithophores in ocean waters. In: A. Winter & W.G. Siesser (eds.) Coccolithophores, Cambridge University Press, p. 161-177.
Ybert, J.P.; Bissa, W.M. & Kutner, M. 2001.Relative sea level variations and climatic evolution in southeastern and southern Brazil during the late Holocene. Pesquisas em Geociências, 28:75-83.
Received in June, 2013; accepted in November, 2013
373LEONHARDT ET AL. – THE PRODUCTIVITY HISTORY IN THE SOUTHWESTERN ATLANTIC
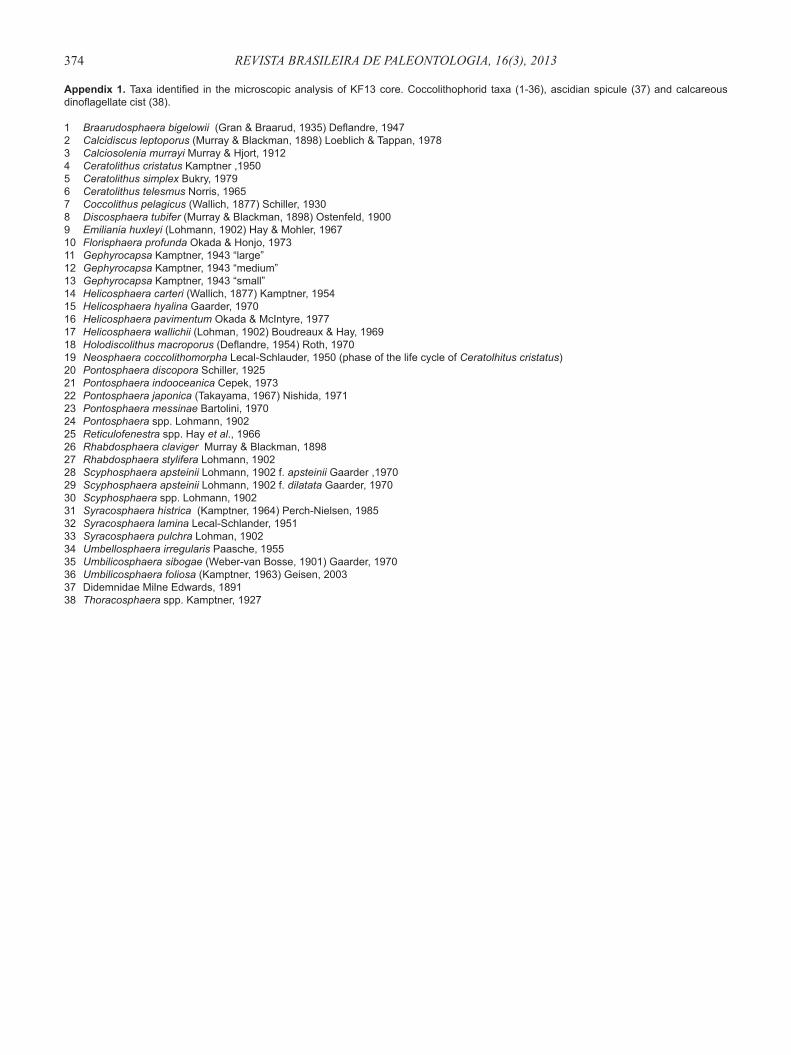
Appendix 1. Taxa identifi ed in the microscopic analysis of KF13 core. Coccolithophorid taxa (1-36), ascidian spicule (37) and calcareous dinofl agellate cist (38).
1 Braarudosphaera bigelowii (Gran & Braarud, 1935) Deflandre, 19472 Calcidiscus leptoporus (Murray & Blackman, 1898) Loeblich & Tappan, 19783 Calciosolenia murrayi Murray & Hjort, 19124 Ceratolithus cristatus Kamptner ,19505 Ceratolithus simplex Bukry, 19796 Ceratolithus telesmus Norris, 19657 Coccolithus pelagicus (Wallich, 1877) Schiller, 19308 Discosphaera tubifer (Murray & Blackman, 1898) Ostenfeld, 19009 Emiliania huxleyi (Lohmann, 1902) Hay & Mohler, 196710 Florisphaera profunda Okada & Honjo, 197311 Gephyrocapsa Kamptner, 1943 “large”12 Gephyrocapsa Kamptner, 1943 “medium”13 Gephyrocapsa Kamptner, 1943 “small”14 Helicosphaera carteri (Wallich, 1877) Kamptner, 195415 Helicosphaera hyalina Gaarder, 197016 Helicosphaera pavimentum Okada & McIntyre, 197717 Helicosphaera wallichii (Lohman, 1902) Boudreaux & Hay, 196918 Holodiscolithus macroporus (Deflandre, 1954) Roth, 197019 Neosphaera coccolithomorpha Lecal-Schlauder, 1950 (phase of the life cycle of Ceratolhitus cristatus)20 Pontosphaera discopora Schiller, 192521 Pontosphaera indooceanica Cepek, 197322 Pontosphaera japonica (Takayama, 1967) Nishida, 197123 Pontosphaera messinae Bartolini, 197024 Pontosphaera spp. Lohmann, 190225 Reticulofenestra spp. Hay et al., 196626 Rhabdosphaera claviger Murray & Blackman, 189827 Rhabdosphaera stylifera Lohmann, 190228 Scyphosphaera apsteinii Lohmann, 1902 f. apsteinii Gaarder ,197029 Scyphosphaera apsteinii Lohmann, 1902 f. dilatata Gaarder, 197030 Scyphosphaera spp. Lohmann, 190231 Syracosphaera histrica (Kamptner, 1964) Perch-Nielsen, 198532 Syracosphaera lamina Lecal-Schlander, 195133 Syracosphaera pulchra Lohman, 190234 Umbellosphaera irregularis Paasche, 195535 Umbilicosphaera sibogae (Weber-van Bosse, 1901) Gaarder, 197036 Umbilicosphaera foliosa (Kamptner, 1963) Geisen, 200337 Didemnidae Milne Edwards, 189138 Thoracosphaera spp. Kamptner, 1927
REVISTA BRASILEIRA DE PALEONTOLOGIA, 16(3), 2013374


![ROP is Still Dangerous - USENIX · pop rbx pop rbp ret . Normal Execution and [rax],0xfd mov edx,0x768 mov esi,0x4ab632 mov rdi,rbx call 0x2b2130 test rbp,rbp cmov [rbp],0x0 add rsp,0x8](https://static.fdocuments.us/doc/165x107/5ffcfe1846f16d3fff4c6e50/rop-is-still-dangerous-usenix-pop-rbx-pop-rbp-ret-normal-execution-and-rax0xfd.jpg)