1030 WED GS 2017 Economic and Insurance Market Conditions ... · 2017 Economic and Insurance Market...
27
2017 Economic and Insurance Market Conditions_Kevelighan 7/19/2017 1 Sean Kevelighan Chief Executive Officer Insurance Information Institute Insurance: Leading Through Disruption
Transcript of 1030 WED GS 2017 Economic and Insurance Market Conditions ... · 2017 Economic and Insurance Market...
2017 Economic and Insurance Market Conditions_Kevelighan 7/19/2017
1
Sean Kevelighan Chief Executive Officer
Insurance Information Institute
Insurance: Leading Through Disruption
2017 Economic and Insurance Market Conditions_Kevelighan 7/19/2017
2
I.I.I. Mission Statement
Improving public understanding of insurance...
…what it does and how it works
Disruption is Everywhere
2017 Economic and Insurance Market Conditions_Kevelighan 7/19/2017
3
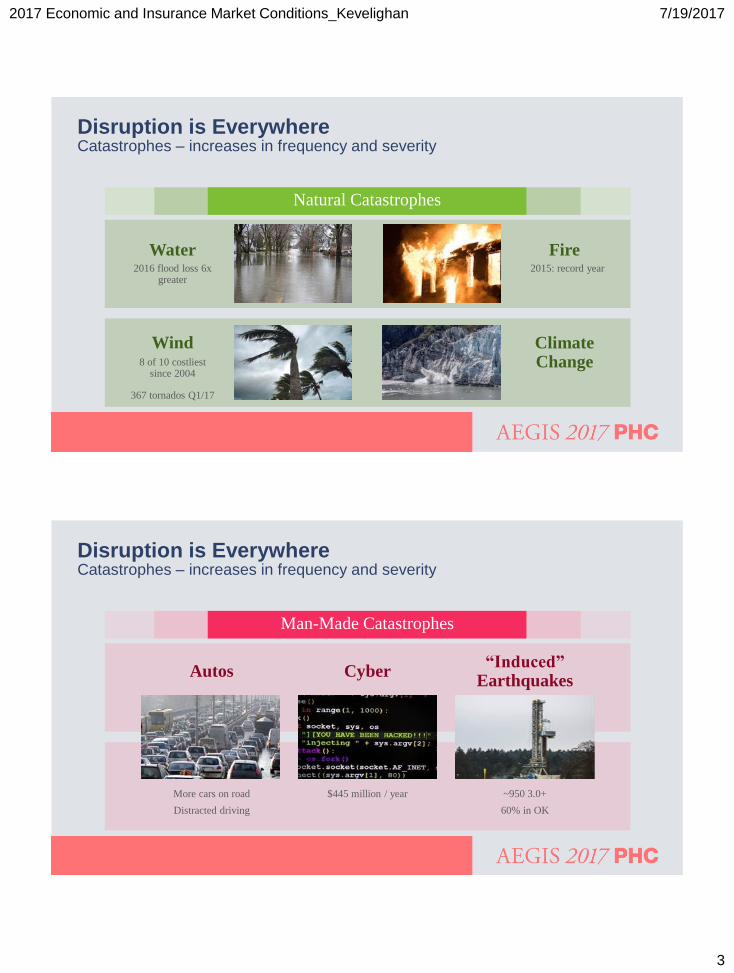
Disruption is Everywhere Catastrophes – increases in frequency and severity
Natural Catastrophes
Wind
Water Fire
8 of 10 costliest since 2004
367 tornados Q1/17
2015: record year 2016 flood loss 6x greater
Climate Change
Disruption is Everywhere Catastrophes – increases in frequency and severity
Man-Made Catastrophes
Autos “Induced”
Earthquakes Cyber
~950 3.0+
60% in OK
$445 million / year More cars on road
Distracted driving
2017 Economic and Insurance Market Conditions_Kevelighan 7/19/2017
4
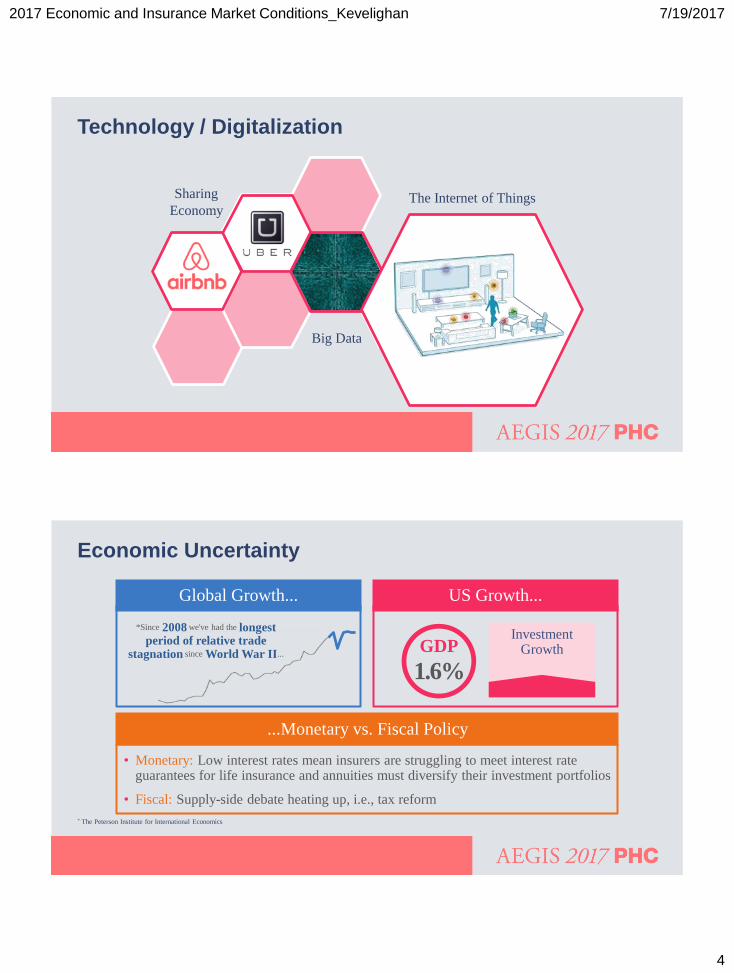
Technology / Digitalization
Big Data
Sharing
Economy The Internet of Things
Economic Uncertainty
Global Growth...
*Since 2008 we've had the longest period of relative trade
stagnation since World War II...
US Growth...
1.6% GDP
Investment Growth
...Monetary vs. Fiscal Policy
• Monetary: Low interest rates mean insurers are struggling to meet interest rate guarantees for life insurance and annuities must diversify their investment portfolios
• Fiscal: Supply-side debate heating up, i.e., tax reform
* The Peterson Institute for International Economics
2017 Economic and Insurance Market Conditions_Kevelighan 7/19/2017
5
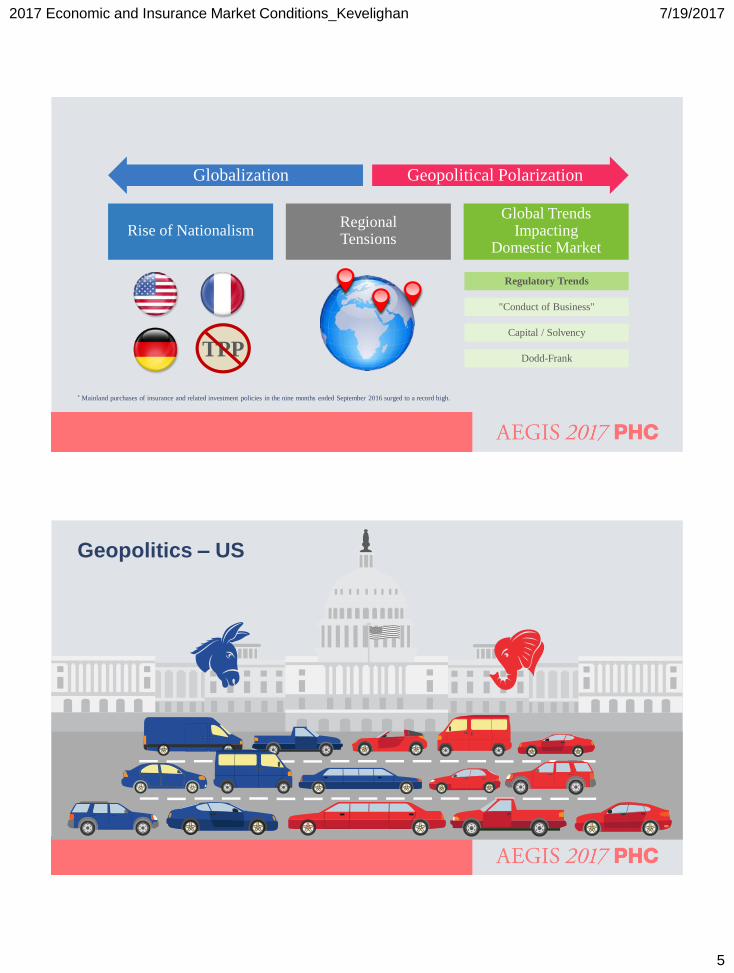
TPP
Globalization
Global Trends Impacting
Domestic Market
Geopolitical Polarization
Regional Tensions
Rise of Nationalism
Regulatory Trends
"Conduct of Business"
Capital / Solvency
Dodd-Frank
* Mainland purchases of insurance and related investment policies in the nine months ended September 2016 surged to a record high.
Geopolitics – US
2017 Economic and Insurance Market Conditions_Kevelighan 7/19/2017
6
-5%
0%
5%
10%
15%
20%
25%
50 52 54 56 58 60 62 64 66 68 70 72 74 76 78 80 82 84 86 88 90 93 95 97 99 1 3 5 7 9 11 13 15
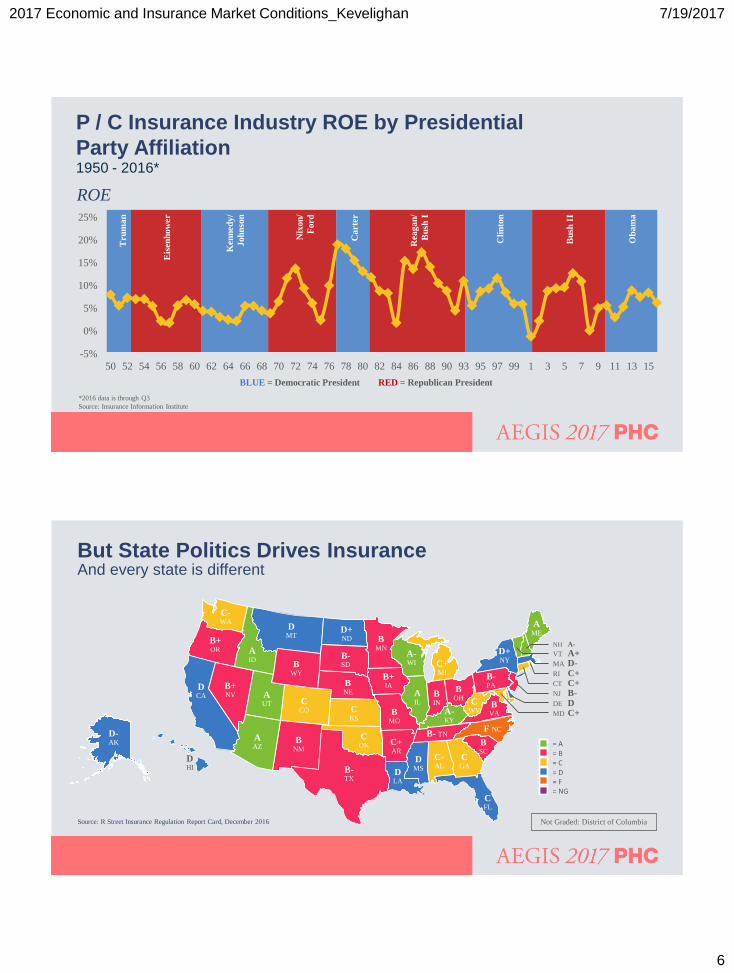
P / C Insurance Industry ROE by Presidential
Party Affiliation 1950 - 2016*
ROE
Tru
man
Eis
en
how
er
Ken
ned
y/
Joh
nso
n
Nix
on
/
Ford
Ca
rter
Reagan
/
Bu
sh I
Cli
nto
n
Bu
sh I
I
Ob
am
a
BLUE = Democratic President RED = Republican President
*2016 data is through Q3
Source: Insurance Information Institute
But State Politics Drives Insurance And every state is different
= A = B = C = D = F = NG
C- WA
D- AK
B+ OR
D CA
A ID
B+ NV
A AZ
B NM
C CO
B WY
A UT
D MT
B- TX
D LA
D MS
C FL
D HI
B- SD
D+ ND B
MN
B NE
C KS
C OK
B+ IA
B MO
C+ AR
A IL
A- WI C+
MI
B IN
B OH
A- KY
B- TN
B SC
C- AL
C GA
F NC
B VA
C WV
B- PA
D+ NY
A ME
NH A-
VT A+ MA D- RI C+ CT C+ NJ B- DE D MD C+
Not Graded: District of Columbia Source: R Street Insurance Regulation Report Card, December 2016
2017 Economic and Insurance Market Conditions_Kevelighan 7/19/2017
7
Insurance Industry Snapshot
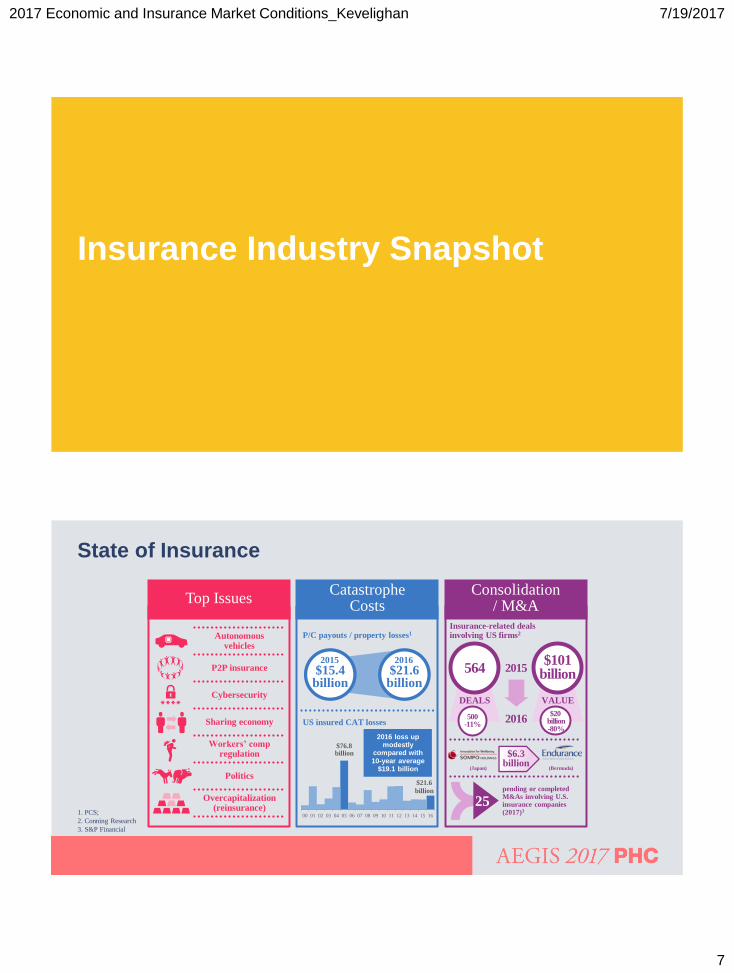
State of Insurance
$76.8 billion
$21.6
billion
00 01 02 03 04 05 06 07 08 09 10 11 12 13 14 15 16
2016 loss up modestly
compared with 10-year average
$19.1 billion
US insured CAT losses
P/C payouts / property losses1
$15.4 billion
2015
$21.6 billion
2016
Catastrophe Costs
Autonomous vehicles
P2P insurance
Cybersecurity
Sharing economy
Workers’ comp regulation
Politics
Overcapitalization (reinsurance)
Top Issues
2016
2015
500 -11%
564
$20 billion -80%
$101 billion
DEALS VALUE
Insurance-related deals involving US firms2
$6.3 billion
(Japan) (Bermuda)
25 pending or completed M&As involving U.S. insurance companies (2017)3
Consolidation / M&A
1. PCS;
2. Conning Research
3. S&P Financial
2017 Economic and Insurance Market Conditions_Kevelighan 7/19/2017
8
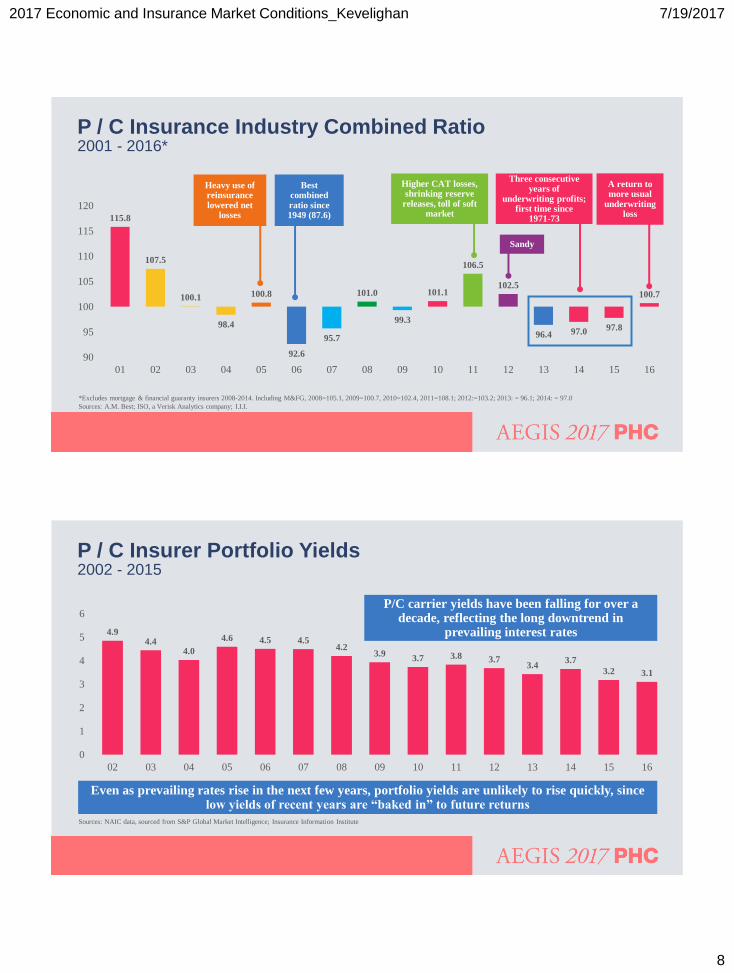
P / C Insurance Industry Combined Ratio 2001 - 2016*
*Excludes mortgage & financial guaranty insurers 2008-2014. Including M&FG, 2008=105.1, 2009=100.7, 2010=102.4, 2011=108.1; 2012:=103.2; 2013: = 96.1; 2014: = 97.0
Sources: A.M. Best; ISO, a Verisk Analytics company; I.I.I.
115.8
107.5
100.1
98.4
100.8
92.6
95.7
101.0
99.3
101.1
106.5
102.5
96.4 97.0 97.8
100.7
90
95
100
105
110
115
120
01 02 03 04 05 06 07 08 09 10 11 12 13 14 15 16
A return to more usual
underwriting loss
Best combined ratio since 1949 (87.6)
Higher CAT losses, shrinking reserve
releases, toll of soft market
Sandy
Three consecutive years of
underwriting profits; first time since
1971-73
Heavy use of reinsurance lowered net
losses
P / C Insurer Portfolio Yields 2002 - 2015
4.9 4.4
4.0
4.6 4.5 4.5 4.2
3.9 3.7 3.8 3.7
3.4 3.7
3.2 3.1
0
1
2
3
4
5
6
02 03 04 05 06 07 08 09 10 11 12 13 14 15 16
Even as prevailing rates rise in the next few years, portfolio yields are unlikely to rise quickly, since low yields of recent years are “baked in” to future returns
P/C carrier yields have been falling for over a decade, reflecting the long downtrend in
prevailing interest rates
Sources: NAIC data, sourced from S&P Global Market Intelligence; Insurance Information Institute
2017 Economic and Insurance Market Conditions_Kevelighan 7/19/2017
9
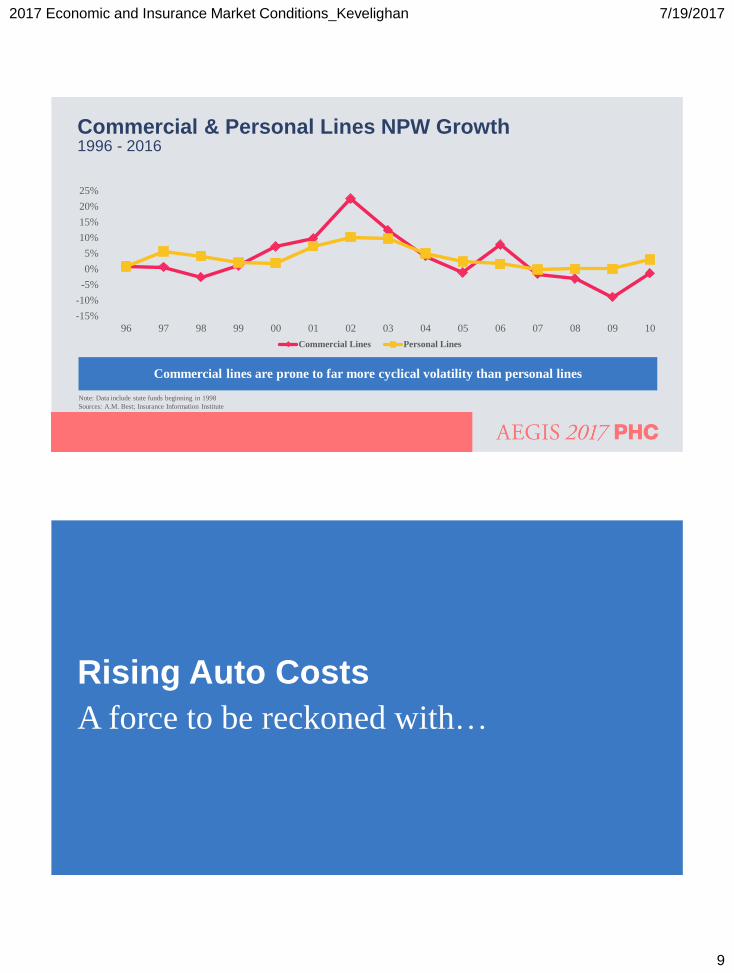
Commercial lines are prone to far more cyclical volatility than personal lines
Commercial & Personal Lines NPW Growth 1996 - 2016
Note: Data include state funds beginning in 1998
Sources: A.M. Best; Insurance Information Institute
-15%
-10%
-5%
0%
5%
10%
15%
20%
25%
96 97 98 99 00 01 02 03 04 05 06 07 08 09 10
Commercial Lines Personal Lines
Rising Auto Costs
A force to be reckoned with…
2017 Economic and Insurance Market Conditions_Kevelighan 7/19/2017
10
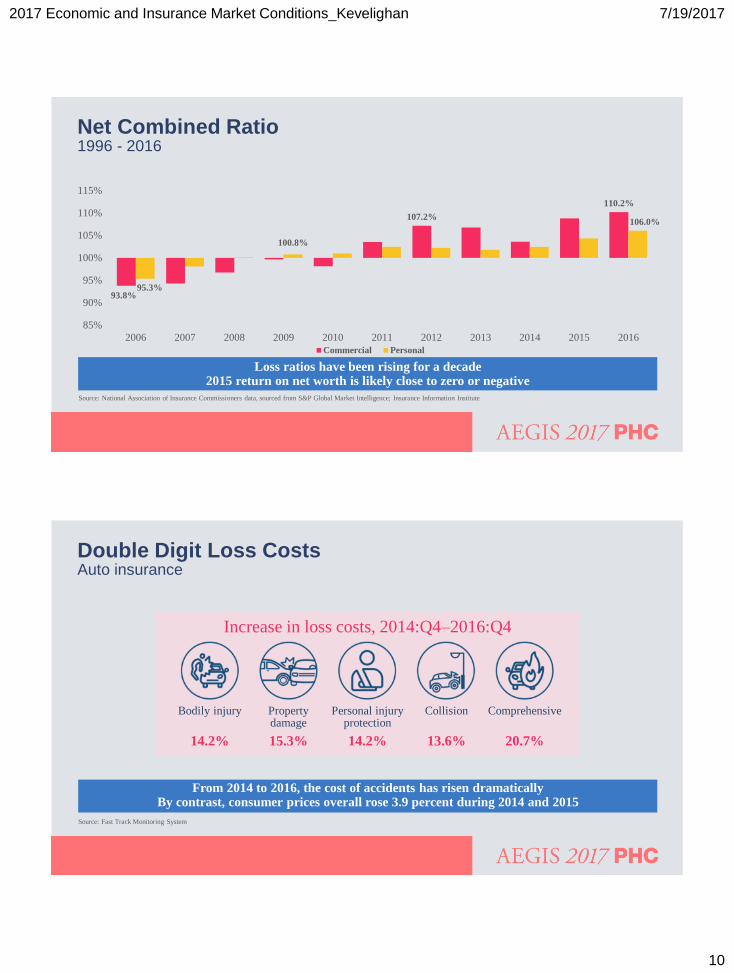
93.8%
107.2%
110.2%
95.3%
100.8%
106.0%
85%
90%
95%
100%
105%
110%
115%
2006 2007 2008 2009 2010 2011 2012 2013 2014 2015 2016
Commercial Personal
Loss ratios have been rising for a decade 2015 return on net worth is likely close to zero or negative
Source: National Association of Insurance Commissioners data, sourced from S&P Global Market Intelligence; Insurance Information Institute
Net Combined Ratio 1996 - 2016
Double Digit Loss Costs Auto insurance
From 2014 to 2016, the cost of accidents has risen dramatically By contrast, consumer prices overall rose 3.9 percent during 2014 and 2015
Bodily injury Property damage
Personal injury protection
Collision Comprehensive
Increase in loss costs, 2014:Q4–2016:Q4
14.2% 15.3% 14.2% 13.6% 20.7%
Source: Fast Track Monitoring System
2017 Economic and Insurance Market Conditions_Kevelighan 7/19/2017
11
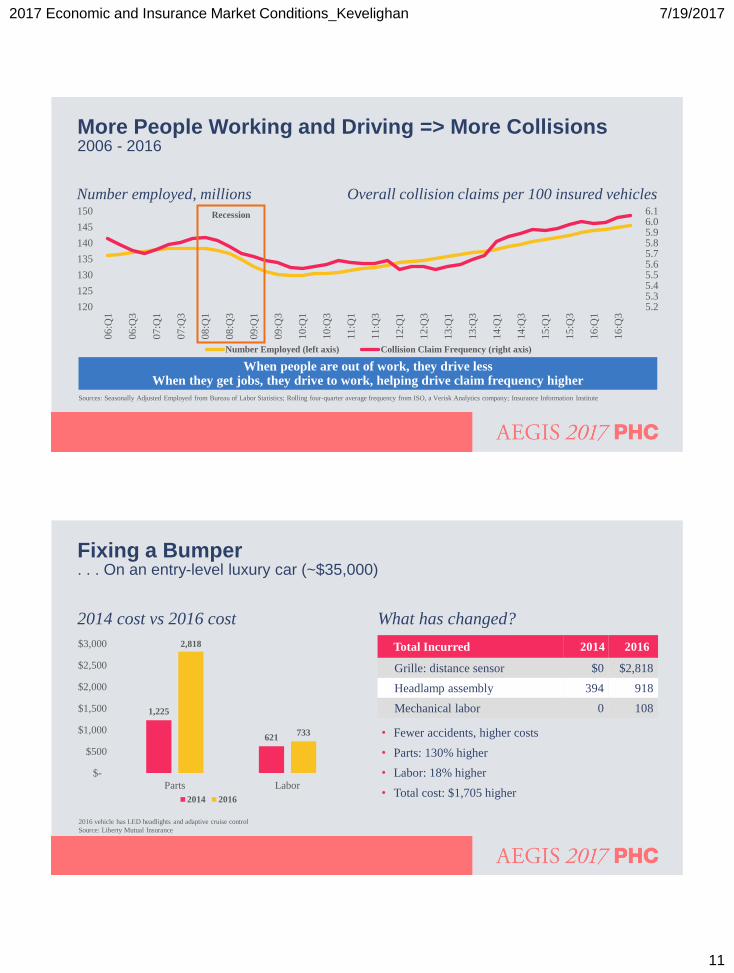
2006 - 2016 More People Working and Driving => More Collisions
When people are out of work, they drive less When they get jobs, they drive to work, helping drive claim frequency higher
5.25.35.45.55.65.75.85.96.06.1
120
125
130
135
140
145
150
06:Q
1
06:Q
3
07:Q
1
07:Q
3
08:Q
1
08:Q
3
09:Q
1
09:Q
3
10:Q
1
10:Q
3
11:Q
1
11:Q
3
12:Q
1
12:Q
3
13:Q
1
13:Q
3
14:Q
1
14:Q
3
15:Q
1
15:Q
3
16:Q
1
16:Q
3
Number Employed (left axis) Collision Claim Frequency (right axis)
Recession
Sources: Seasonally Adjusted Employed from Bureau of Labor Statistics; Rolling four-quarter average frequency from ISO, a Verisk Analytics company; Insurance Information Institute
Number employed, millions Overall collision claims per 100 insured vehicles
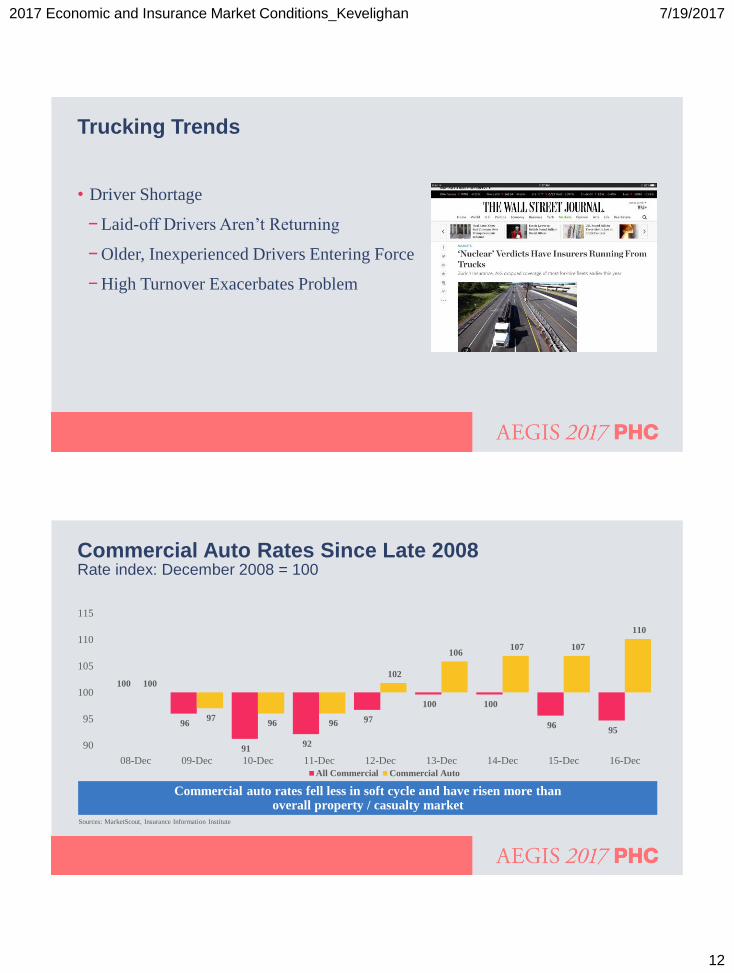
Fixing a Bumper . . . On an entry-level luxury car (~$35,000)
• Fewer accidents, higher costs
• Parts: 130% higher
• Labor: 18% higher
• Total cost: $1,705 higher
1,225
621
2,818
733
$-
$500
$1,000
$1,500
$2,000
$2,500
$3,000
Parts Labor
2014 2016
2016 vehicle has LED headlights and adaptive cruise control
Source: Liberty Mutual Insurance
Total Incurred 2014 2016
Grille: distance sensor $0 $2,818
Headlamp assembly 394 918
Mechanical labor 0 108
2014 cost vs 2016 cost What has changed?
2017 Economic and Insurance Market Conditions_Kevelighan 7/19/2017
12
Trucking Trends
• Driver Shortage
− Laid-off Drivers Aren’t Returning
− Older, Inexperienced Drivers Entering Force
− High Turnover Exacerbates Problem
100
96
91 92
97
100 100
96 95
100
97 96 96
102
106 107 107
110
90
95
100
105
110
115
08-Dec 09-Dec 10-Dec 11-Dec 12-Dec 13-Dec 14-Dec 15-Dec 16-Dec
All Commercial Commercial Auto
Commercial auto rates fell less in soft cycle and have risen more than overall property / casualty market
Sources: MarketScout, Insurance Information Institute
Rate index: December 2008 = 100 Commercial Auto Rates Since Late 2008
2017 Economic and Insurance Market Conditions_Kevelighan 7/19/2017
13
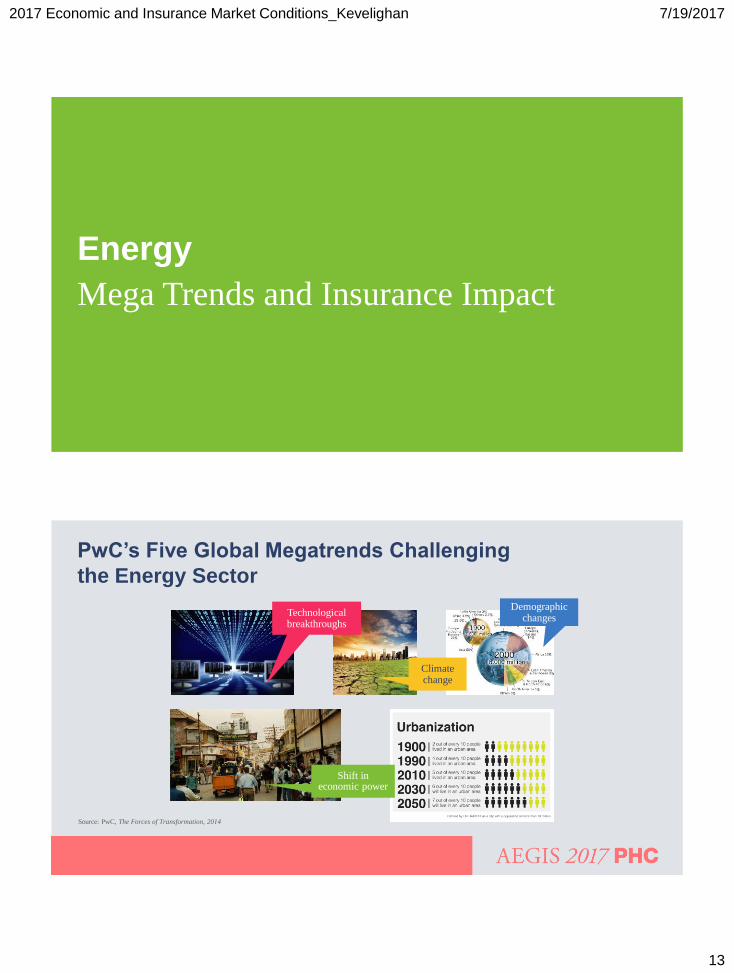
Energy
Mega Trends and Insurance Impact
PwC’s Five Global Megatrends Challenging
the Energy Sector
Technological breakthroughs
Climate change
Demographic changes
Shift in economic power
Source: PwC, The Forces of Transformation, 2014
2017 Economic and Insurance Market Conditions_Kevelighan 7/19/2017
14
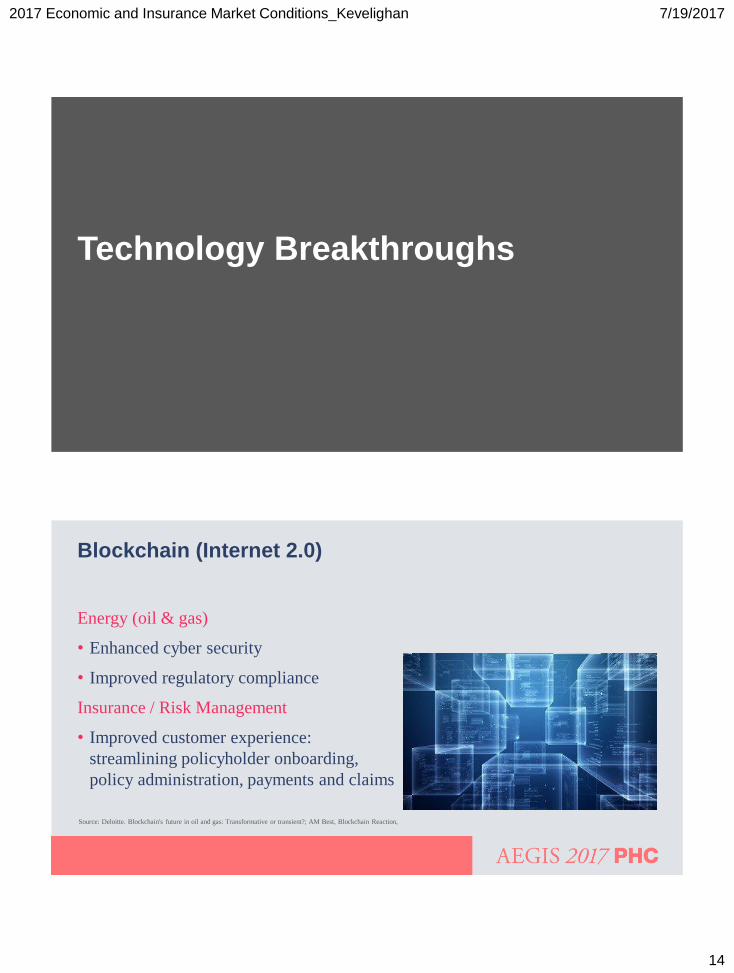
Technology Breakthroughs
Blockchain (Internet 2.0)
Energy (oil & gas)
• Enhanced cyber security
• Improved regulatory compliance
Insurance / Risk Management
• Improved customer experience:
streamlining policyholder onboarding,
policy administration, payments and claims
Source: Deloitte. Blockchain's future in oil and gas: Transformative or transient?; AM Best, Blockchain Reaction,
2017 Economic and Insurance Market Conditions_Kevelighan 7/19/2017
15
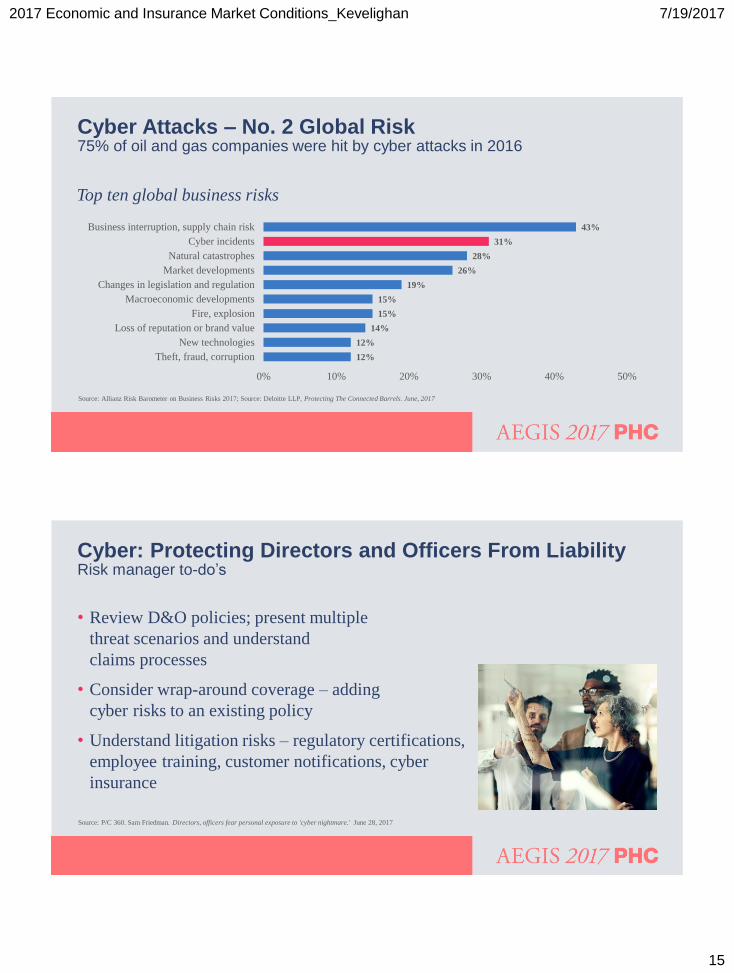
Cyber Attacks – No. 2 Global Risk 75% of oil and gas companies were hit by cyber attacks in 2016
12%
12%
14%
15%
15%
19%
26%
28%
31%
43%
0% 10% 20% 30% 40% 50%
Theft, fraud, corruption
New technologies
Loss of reputation or brand value
Fire, explosion
Macroeconomic developments
Changes in legislation and regulation
Market developments
Natural catastrophes
Cyber incidents
Business interruption, supply chain risk
Top ten global business risks
Source: Allianz Risk Barometer on Business Risks 2017; Source: Deloitte LLP, Protecting The Connected Barrels. June, 2017
Risk manager to-do’s Cyber: Protecting Directors and Officers From Liability
• Review D&O policies; present multiple
threat scenarios and understand
claims processes
• Consider wrap-around coverage – adding
cyber risks to an existing policy
• Understand litigation risks – regulatory certifications,
employee training, customer notifications, cyber
insurance
Source: P/C 360. Sam Friedman. Directors, officers fear personal exposure to 'cyber nightmare.' June 28, 2017
2017 Economic and Insurance Market Conditions_Kevelighan 7/19/2017
16
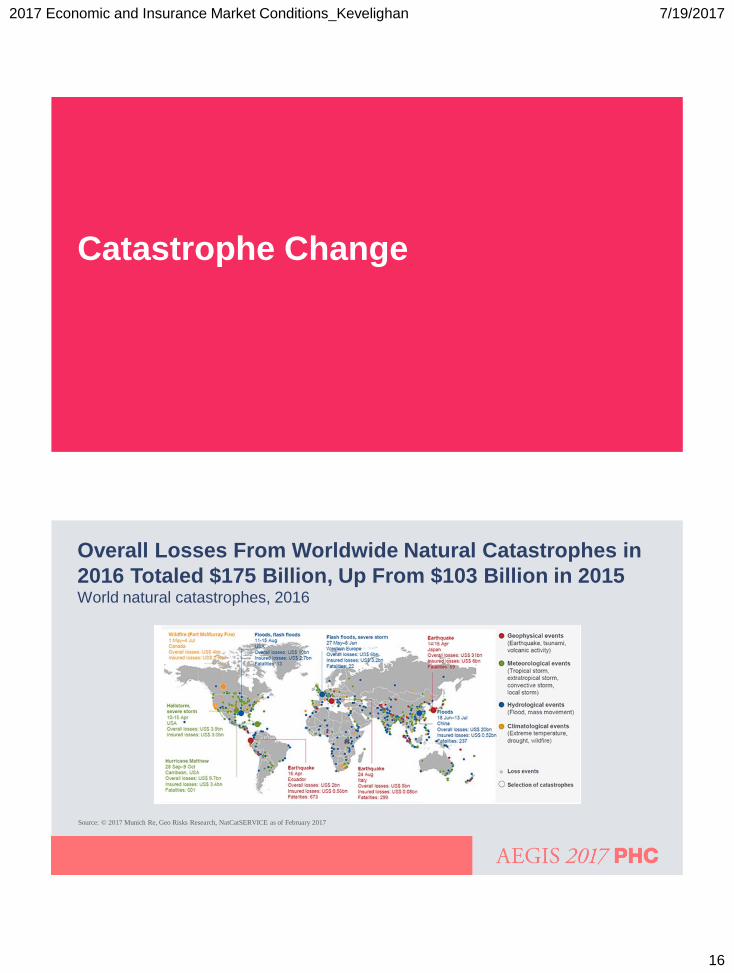
Catastrophe Change
Overall Losses From Worldwide Natural Catastrophes in
2016 Totaled $175 Billion, Up From $103 Billion in 2015
World natural catastrophes, 2016
Source: © 2017 Munich Re, Geo Risks Research, NatCatSERVICE as of February 2017
2017 Economic and Insurance Market Conditions_Kevelighan 7/19/2017
17
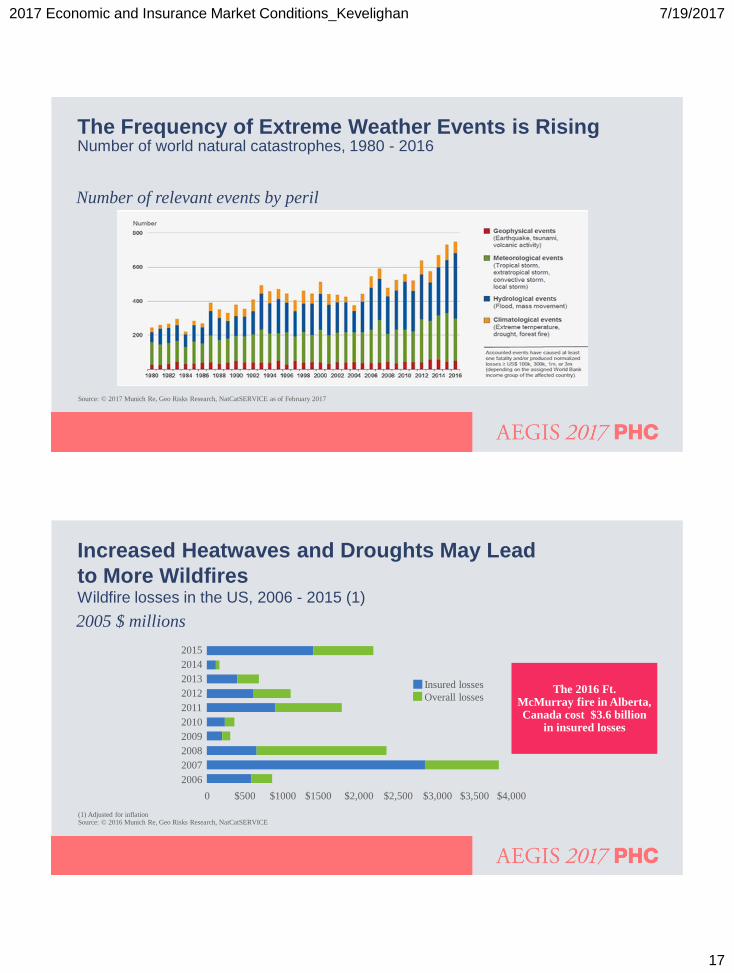
The Frequency of Extreme Weather Events is Rising
Number of world natural catastrophes, 1980 - 2016
Source: © 2017 Munich Re, Geo Risks Research, NatCatSERVICE as of February 2017
Number of relevant events by peril
The 2016 Ft. McMurray fire in Alberta, Canada cost $3.6 billion
in insured losses
Increased Heatwaves and Droughts May Lead
to More Wildfires
Wildfire losses in the US, 2006 - 2015 (1)
2005 $ millions
(1) Adjusted for inflation Source: © 2016 Munich Re, Geo Risks Research, NatCatSERVICE
2015
2014
2013
2012
2011
2010
2009
2008
2007
2006
Insured losses
Overall losses
0 $500 $1000 $1500 $2,000 $2,500 $3,000 $3,500 $4,000
2017 Economic and Insurance Market Conditions_Kevelighan 7/19/2017
18
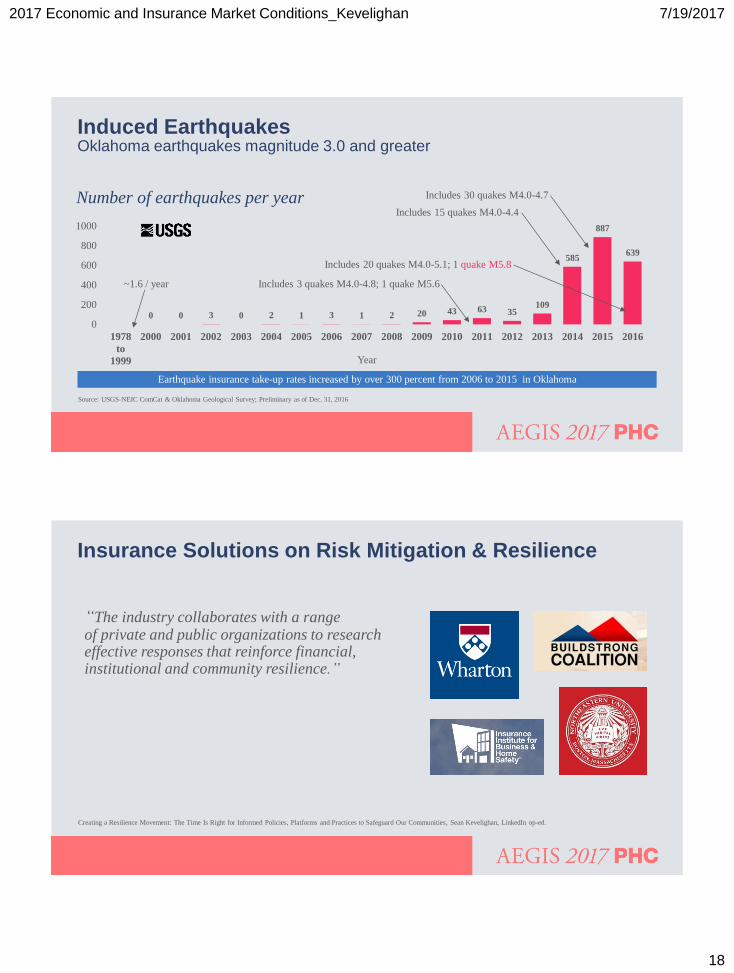
Induced Earthquakes Oklahoma earthquakes magnitude 3.0 and greater
0 0 3 0 2 1 3 1 2 20 43 63 35 109
585
887
639
0
200
400
600
800
1000
1978
to
1999
2000 2001 2002 2003 2004 2005 2006 2007 2008 2009 2010 2011 2012 2013 2014 2015 2016
Includes 30 quakes M4.0-4.7
Includes 15 quakes M4.0-4.4
Includes 20 quakes M4.0-5.1; 1 quake M5.8
Includes 3 quakes M4.0-4.8; 1 quake M5.6 ~1.6 / year
Source: USGS-NEIC ComCat & Oklahoma Geological Survey; Preliminary as of Dec. 31, 2016
Year
Earthquake insurance take-up rates increased by over 300 percent from 2006 to 2015 in Oklahoma
Number of earthquakes per year
Insurance Solutions on Risk Mitigation & Resilience
Creating a Resilience Movement: The Time Is Right for Informed Policies, Platforms and Practices to Safeguard Our Communities, Sean Kevelighan, LinkedIn op-ed.
“The industry collaborates with a range of private and public organizations to research effective responses that reinforce financial, institutional and community resilience.”
2017 Economic and Insurance Market Conditions_Kevelighan 7/19/2017
19
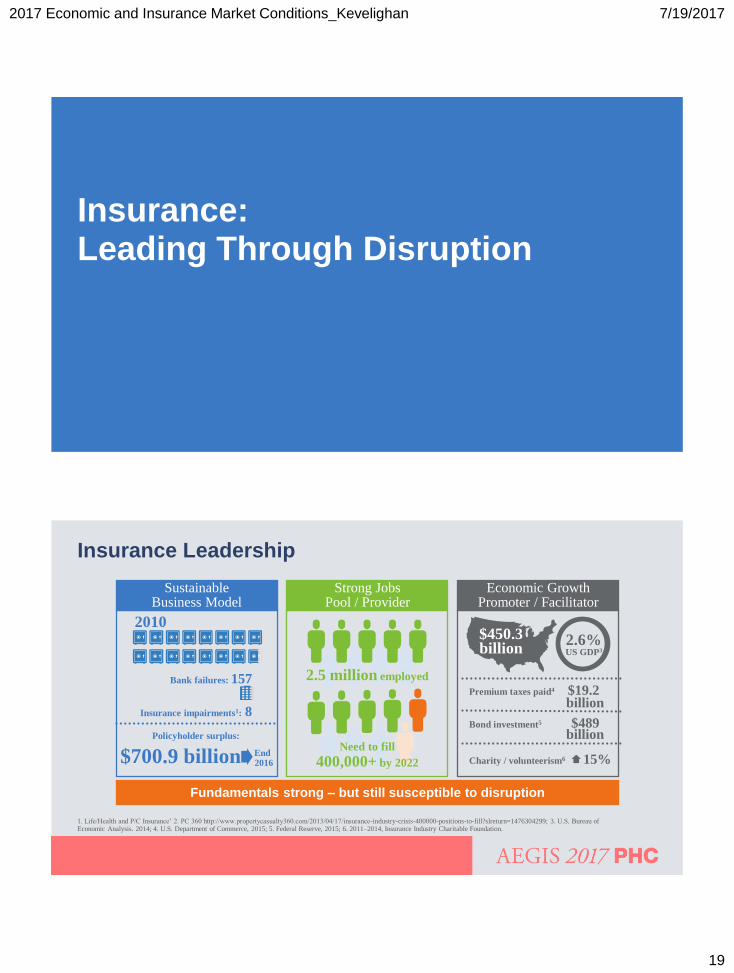
Insurance: Leading Through Disruption
Insurance Leadership
Sustainable Business Model
Strong Jobs Pool / Provider
Economic Growth Promoter / Facilitator
2010
Bank failures: 157
Insurance impairments1: 8
Policyholder surplus:
$700.9 billion End 2016
2.5 million employed
Need to fill
400,000+ by 2022
$450.3 billion
2.6% US GDP3
Premium taxes paid4 $19.2
Bond investment5 $489
Charity / volunteerism6 15%
billion
billion
1. Life/Health and P/C Insurance’ 2. PC 360 http://www.propertycasualty360.com/2013/04/17/insurance-industry-crisis-400000-positions-to-fill?slreturn=1476304299; 3. U.S. Bureau of Economic Analysis. 2014; 4. U.S. Department of Commerce, 2015; 5. Federal Reserve, 2015; 6. 2011–2014, Insurance Industry Charitable Foundation.
Fundamentals strong – but still susceptible to disruption
2017 Economic and Insurance Market Conditions_Kevelighan 7/19/2017
20
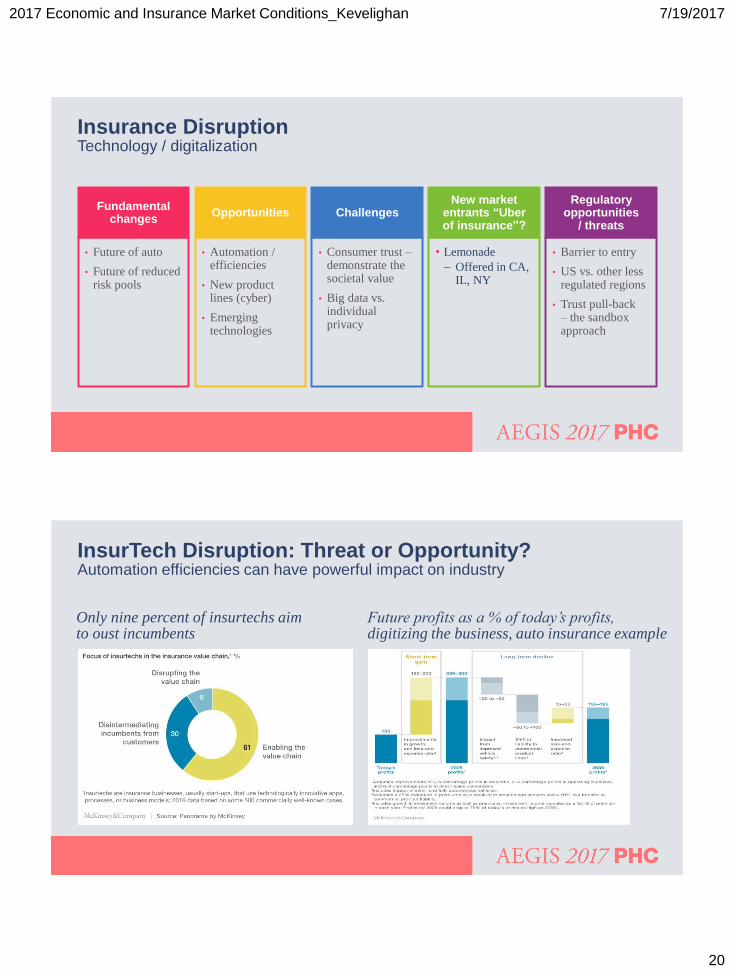
Insurance Disruption Technology / digitalization
Fundamental changes
• Future of auto
• Future of reduced risk pools
Opportunities
• Automation / efficiencies
• New product lines (cyber)
• Emerging technologies
Challenges
• Consumer trust – demonstrate the societal value
• Big data vs. individual privacy
New market entrants “Uber of insurance”?
• Lemonade
– Offered in CA, IL, NY
Regulatory opportunities
/ threats
• Barrier to entry
• US vs. other less regulated regions
• Trust pull-back – the sandbox approach
InsurTech Disruption: Threat or Opportunity? Automation efficiencies can have powerful impact on industry
Only nine percent of insurtechs aim to oust incumbents
Future profits as a % of today’s profits, digitizing the business, auto insurance example
2017 Economic and Insurance Market Conditions_Kevelighan 7/19/2017
21
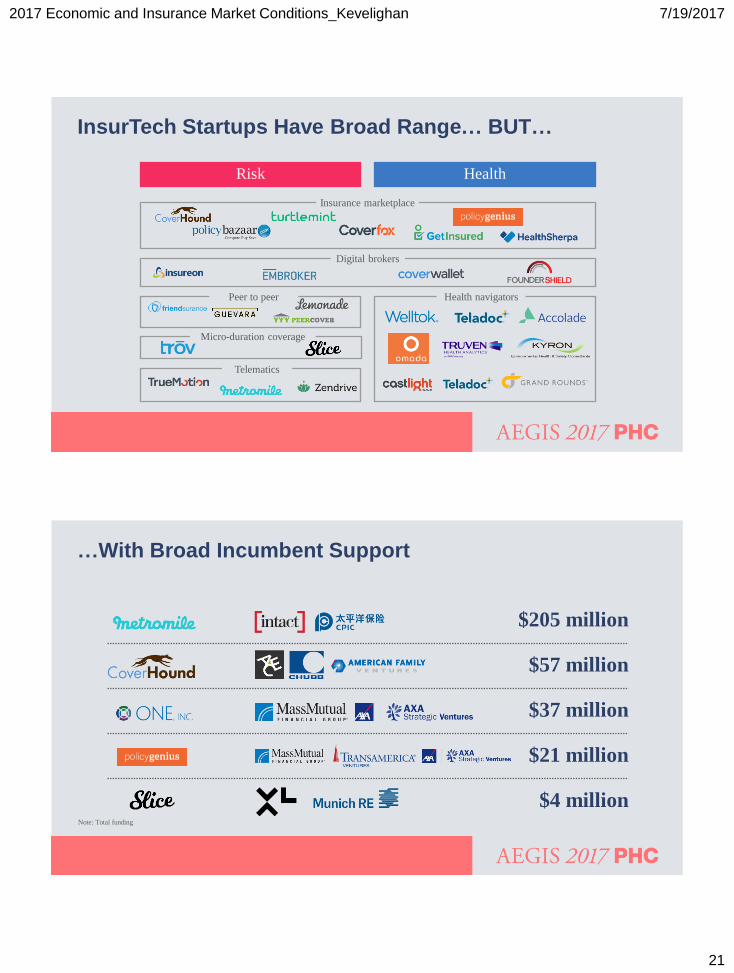
InsurTech Startups Have Broad Range… BUT…
Risk Health
Insurance marketplace
Digital brokers
Health navigators Peer to peer
Micro-duration coverage
Telematics
…With Broad Incumbent Support
$205 million
$57 million
$37 million
$21 million
$4 million Note: Total funding
2017 Economic and Insurance Market Conditions_Kevelighan 7/19/2017
22
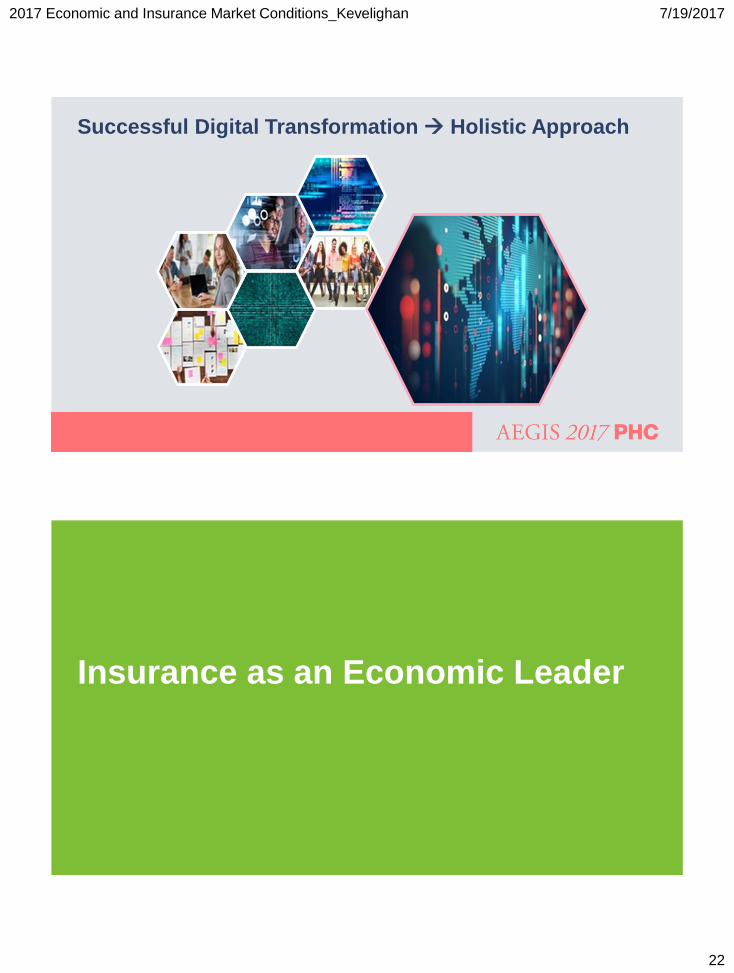
Successful Digital Transformation Holistic Approach
Insurance as an Economic Leader
2017 Economic and Insurance Market Conditions_Kevelighan 7/19/2017
23
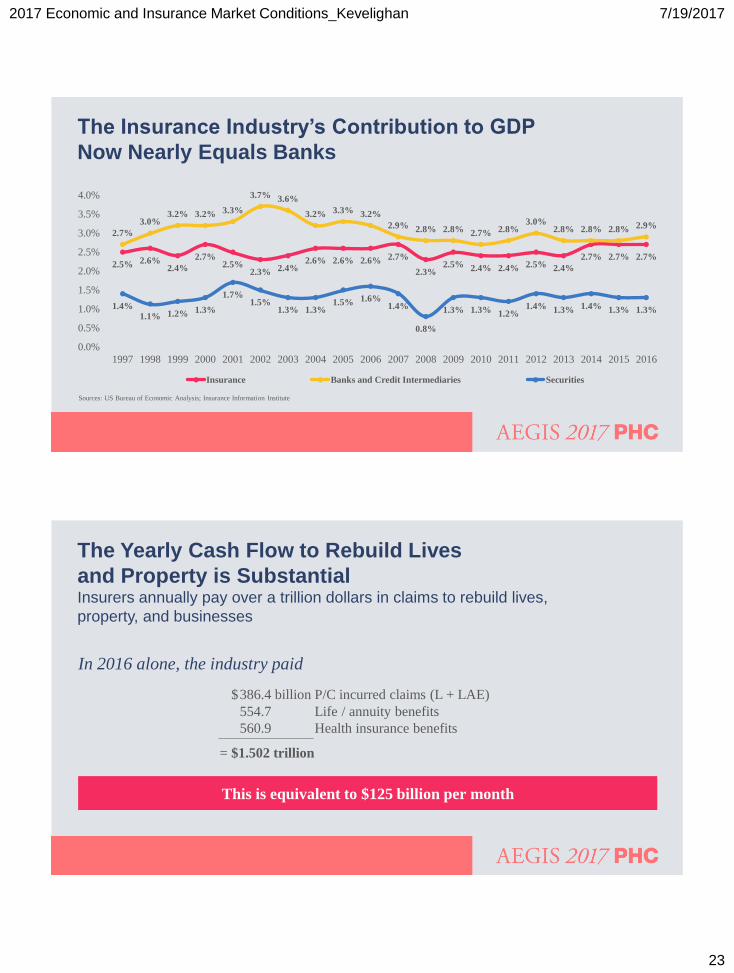
2.5% 2.6% 2.4%
2.7% 2.5%
2.3% 2.4% 2.6% 2.6% 2.6% 2.7%
2.3% 2.5% 2.4% 2.4% 2.5% 2.4%
2.7% 2.7% 2.7%
2.7%
3.0% 3.2% 3.2% 3.3%
3.7% 3.6%
3.2% 3.3% 3.2%
2.9% 2.8% 2.8% 2.7% 2.8% 3.0%
2.8% 2.8% 2.8% 2.9%
1.4% 1.1% 1.2% 1.3%
1.7% 1.5%
1.3% 1.3% 1.5% 1.6%
1.4%
0.8%
1.3% 1.3% 1.2% 1.4% 1.3% 1.4% 1.3% 1.3%
0.0%
0.5%
1.0%
1.5%
2.0%
2.5%
3.0%
3.5%
4.0%
1997 1998 1999 2000 2001 2002 2003 2004 2005 2006 2007 2008 2009 2010 2011 2012 2013 2014 2015 2016
Insurance Banks and Credit Intermediaries Securities
The Insurance Industry’s Contribution to GDP
Now Nearly Equals Banks
Sources: US Bureau of Economic Analysis; Insurance Information Institute
The Yearly Cash Flow to Rebuild Lives
and Property is Substantial
Insurers annually pay over a trillion dollars in claims to rebuild lives,
property, and businesses
In 2016 alone, the industry paid
This is equivalent to $125 billion per month
$ 386.4 billion P/C incurred claims (L + LAE)
554.7 Life / annuity benefits
560.9 Health insurance benefits
= $1.502 trillion
2017 Economic and Insurance Market Conditions_Kevelighan 7/19/2017
24
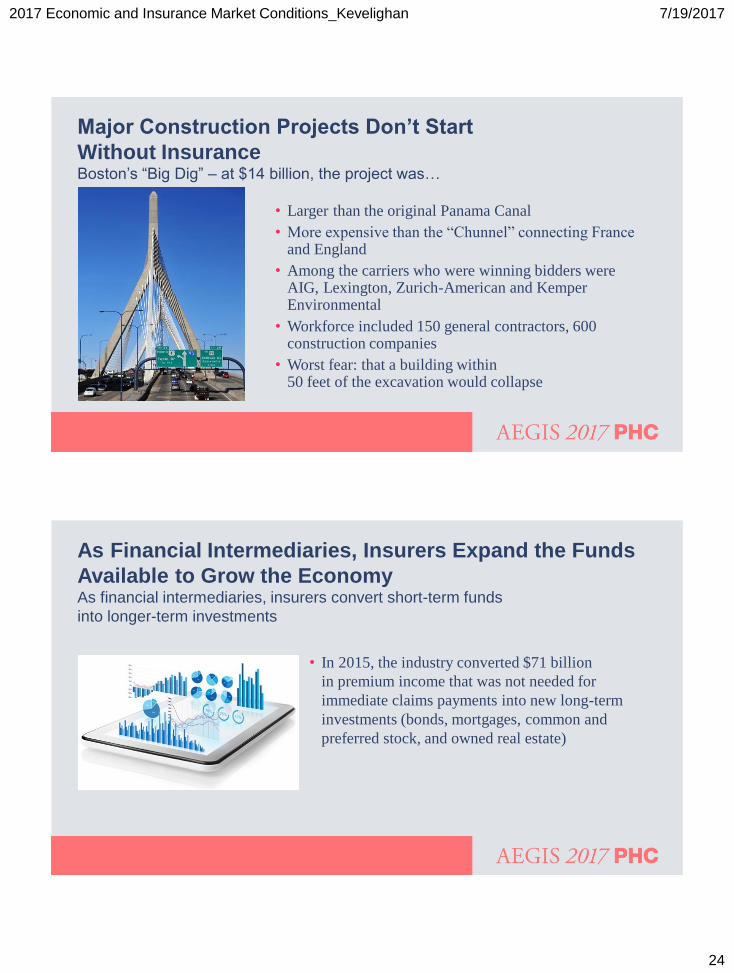
Major Construction Projects Don’t Start
Without Insurance
Boston’s “Big Dig” – at $14 billion, the project was…
• Larger than the original Panama Canal
• More expensive than the “Chunnel” connecting France and England
• Among the carriers who were winning bidders were AIG, Lexington, Zurich-American and Kemper Environmental
• Workforce included 150 general contractors, 600 construction companies
• Worst fear: that a building within 50 feet of the excavation would collapse
As Financial Intermediaries, Insurers Expand the Funds
Available to Grow the Economy
As financial intermediaries, insurers convert short-term funds
into longer-term investments
• In 2015, the industry converted $71 billion
in premium income that was not needed for
immediate claims payments into new long-term
investments (bonds, mortgages, common and
preferred stock, and owned real estate)
2017 Economic and Insurance Market Conditions_Kevelighan 7/19/2017
25
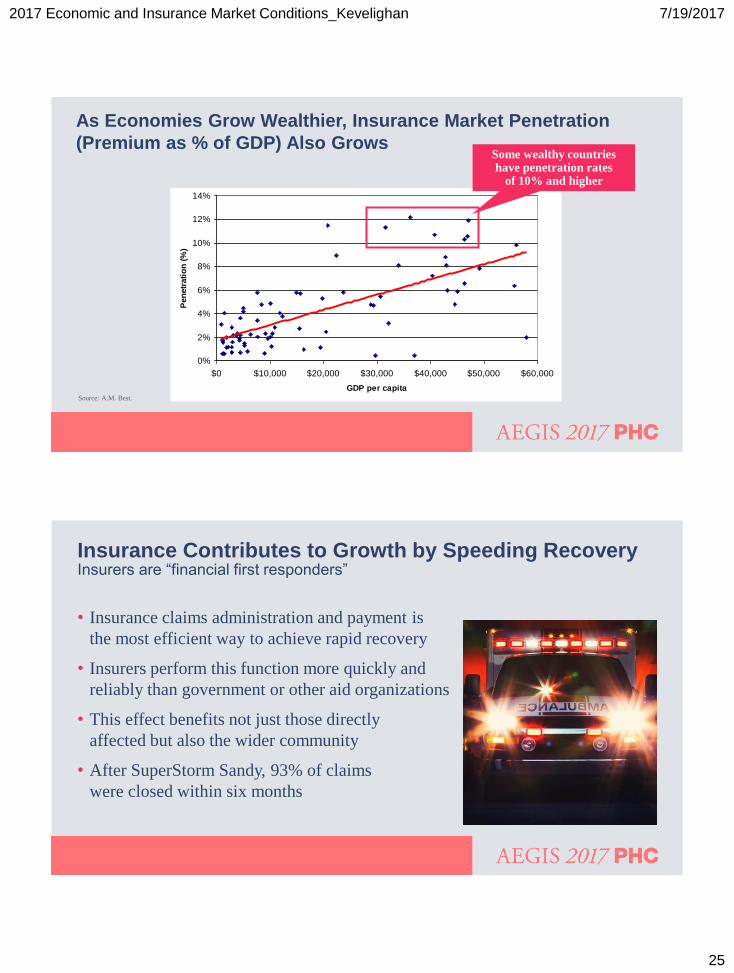
As Economies Grow Wealthier, Insurance Market Penetration
(Premium as % of GDP) Also Grows
Source: A.M. Best.
0%
2%
4%
6%
8%
10%
12%
14%
$0 $10,000 $20,000 $30,000 $40,000 $50,000 $60,000
GDP per capita
Pen
etr
ati
on
(%
)
Some wealthy countries have penetration rates
of 10% and higher
Insurers are “financial first responders” Insurance Contributes to Growth by Speeding Recovery
• Insurance claims administration and payment is
the most efficient way to achieve rapid recovery
• Insurers perform this function more quickly and
reliably than government or other aid organizations
• This effect benefits not just those directly
affected but also the wider community
• After SuperStorm Sandy, 93% of claims
were closed within six months
2017 Economic and Insurance Market Conditions_Kevelighan 7/19/2017
26
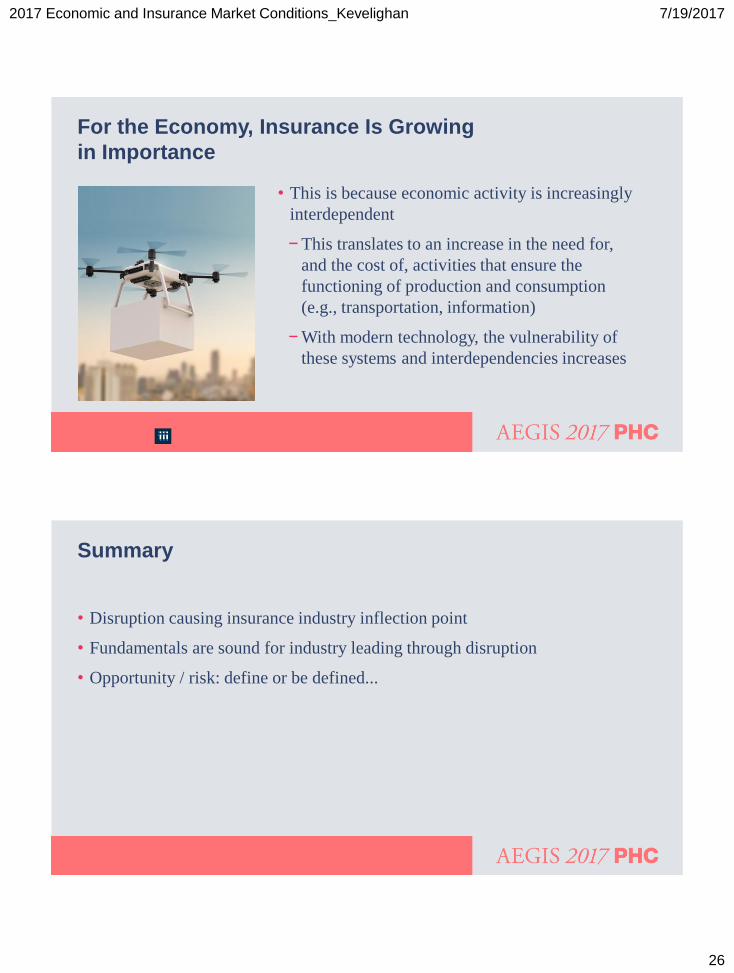
For the Economy, Insurance Is Growing
in Importance
• This is because economic activity is increasingly
interdependent
− This translates to an increase in the need for,
and the cost of, activities that ensure the
functioning of production and consumption
(e.g., transportation, information)
− With modern technology, the vulnerability of
these systems and interdependencies increases
Summary
• Disruption causing insurance industry inflection point
• Fundamentals are sound for industry leading through disruption
• Opportunity / risk: define or be defined...
2017 Economic and Insurance Market Conditions_Kevelighan 7/19/2017
27
Insurance: Leading Through Disruption
Q&A