101044 IOB Impact Evaluation - · PDF fileIOB Impact Evaluation ... Policy and Operations...
206
Policy and Operations Evaluation Department | IOB Impact Evaluations | no. 327 | May 2010 | Policy and Operations Evaluation Department | IOB Imp IOB Impact Evaluation Drinking water supply and sanitation programme supported by the Netherlands in Fayoum Governorate, Arab Republic of Egypt, 1990-2009
Transcript of 101044 IOB Impact Evaluation - · PDF fileIOB Impact Evaluation ... Policy and Operations...
IOB Im
pact Evaluation | no. 327 D
rinking water supply and sanitation program
me in Fayoum
, Egypt, 1990-2009
Policy and Operations Evaluation Department | IOB Impact Evaluations | no. 327 | May 2010 | Policy and Operations Evaluation Department | IOB Impn Department | IOB Impact Evaluations | no. 327 | May 2010 | Policy and Operations Evaluation Department | IOB Impact Evaluations | no. 327 | May 2010
IOB Impact Evaluation
Drinking water supply and sanitation programme supported by the Netherlands in Fayoum Governorate, Arab Republic of Egypt, 1990-2009
Published by:
Ministry of Foreign Affairs of the Netherlands
P.O. Box 20061 | 2500 EB The Hague
The Netherlands | www.minbuza.nl
© Ministry of Foreign Affairs of the Netherlands | May 2010
10BUZ281478|E
Support to water supply and sanitary facilities
has been a priority for Netherlands development
co-operation for many years. The purpose of
support goes beyond sustainable access to
improved facilities: it is intended to reduce the
burden of water collection, improve health, raise
school enrolment; improve livelihoods and
ultimately reduce poverty. IOB is undertaking a
series of impact studies in five countries to
measure the effects of supported programmes,
using a combination of quantitative and
qualitative methods and techniques. Dutch
support provided to the drinkwater supply and
sanitation programme in Fayoum Governorate,
Arab Republic of Egypt started in 1990. The
impact evaluation report is the third report
published in the series.
IOB Impact Evaluation
Drinking water supply and sanitation programme supported by the Netherlands in Fayoum Governorate, Arab Republic of Egypt, 1990-2009

| 2 |
Drinking water supply and sanitation programme in Fayoum, Egypt, 1990-2009
| 3 |
Preface
Support to water supply and sanitary facilities has been a priority for the Netherlands’ development co-operation for many years. Current policy on development co-operation is guided by the Millennium Development Goals. The MDGs include the target to halve, by 2015, the proportion of people in 1990 without sustainable access to safe drinking water and basic sanitation.
The objective of the support to water supply and sanitary facilities goes beyond sustainable access: it aims to reduce the burden of water collection (typically a task for women and girls), improve health, raise school enrolment and attendance, improve livelihoods and, ultimately, reduce poverty.
The Policy and Operations Evaluation Department (IOB) of the Netherlands Ministry of Foreign Affairs has initiated a series of impact evaluations of water supply and sanitation projects and programmes supported by the Netherlands. There is a worldwide consensus on the impacts of programmes for water supply and sanitary facilities; conventional evaluation studies do not, however, normally quantify these. The impact evaluations have used a combination of quantitative and qualitative methods and techniques. Through the evaluations, IOB wishes to explore how the effects of these programmes can be measured.
The third in the series is the impact evaluation of the drinking water and sanitation programme supported by the Netherlands in Fayoum Governorate, Arab Republic of Egypt. Dutch support to the Fayoum programme started in 1990 and is ongoing. The thrust of the support aimed to strengthen the institutional performance of the responsible agency for the sector in Fayoum Governorate, supplemented by invest-ments in water supply and sanitation infrastructure. The focus of the study is on the programme’s impact on the local population and on the sustainability of the results.
Rita Tesselaar of IOB was responsible for the evaluation. The main consultants were Jan Willem Gunning, Professor of Development Economics, Chris Elbers, Professor in Economics and Stephen Turner, sr. consultant in Resource Development at the Free University of Amsterdam, and Hanan Radwan, sr. institutional assessment consultant, Cairo. The surveys, data collection at health units and schools, and arrangements for water quality tests were carried out by a team from the American University of Cairo led by Ramadan Hamed Mohamed, Research Professor at the Social Research Centre.
A reference group – consisting of Dr. Susan Watts, social determinants of health expert, Cairo, Dr. Christine Sijbesma of the IRC International Water and Sanitation Centre, The Hague, and Dick van Ginhoven and Rob Swinkels of the relevant policy depart-ments at the Ministry of Foreign Affairs – provided comments and advice on the report.
Preface
| 4 |
The study greatly benefited from support provided by the Fayoum Drinking Water and Sanitation Project, the Netherlands Embassy in Cairo and the Fayoum Drinking Water and Sanitation Company. Maps on Fayoum and its water and sanitation infrastructure were kindly provided by the Fayoum Drinking Water and Sanitation Company. Special thanks are due to Herrie Heckman, team leader of the Fayoum Drinking Water and Sanitation Project and Dr. Tarek Morad, Deputy Head Economic and Development Cooperation Department, Netherlands Embassy, for their information and support throughout the study.
Thanks are also due to all informants and respondents in the impact evaluation. These include Eng. Mahmoud Mohamed Nafei, Chairman of the Fayoum Drinking Water and Sanitation Company; Dr. Abdel Kawy Khalifa and Eng. Mahmoud Raslan, Chairman and Deputy Chairman of the Holding Company for Water and Wastewater; Eng. Mohamed El-Alfy, Deputy Minister for International Relations, Ministry of Housing, Utilities and Urban Communities; staff of the Fayoum Drinking Water and Sanitation Company and of the Fayoum Drinking Water and Sanitation Project; informants of Fayoum Governorate and local authorities, Community Development Associations and Water User Associations: and last but certainly not least, all the respondents to the survey questionnaires and participants of focus group discussions. IOB bears responsibility for the contents of the report.
Henri JorritsmaActing Director IOB
Drinking water supply and sanitation programme in Fayoum, Egypt, 1990-2009
| 5 |
Contents
Preface 3Abbreviations 11Mainfindingsandissues 13
1 Backgroundandmethodology 24
1.1 Reason for and purpose of the evaluation 25
1.2 Evaluation questions 26
1.3 Methodology and data collection 27
1.4 Structure of the report 31
2 Programmecontext 32
2.1 Demography and society 33
2.2 Natural environment 34
2.3 Economy and poverty 35
2.4 Health 38
2.5 Government and institutions 38
2.6 National water supply and sanitation policy, and institutional context 40
2.7 The Netherlands’ policy and support to rural water supply and sanitation 45
3 TheFayoumDrinkingWaterandSanitationProject,1990-2009 48
3.1 Introduction 49
3.2 Phase I, 1990-1994 50
3.3 Phase II, 1994-1996 53
3.4 Phase III, 1997-1999 59
3.5 Phase IV, 2000-2008 65
3.6 Phase V, 2006-2011 70
3.7 Beneficiaries 76
3.8 Cost trends 79
3.9 Summary 81
4 RuralwatersupplyandsanitationinFayoum,2009 84
4.1 Introduction 85
4.2 Water supply 85
4.3 Sanitation 90
4.4 Institutional arrangements 92
4.5 Customers’ views and participation 111
4.6 Summary 114
Contents
| 6 |
5 Impactanalysis 118
5.1 Introduction 119
5.2 Access to a household connection and quality and quantity of water consumed 121
5.3 Access to sanitary facilities 131
5.4 Distribution of facilities 137
5.6 Time use and use and value of time savings 142
5.7 Impact on health and value of health benefits 144
5.8 Summary and conclusion 153
6 Sustainabilityassessment 156
6.1 Introduction 157
6.2 Institutional sustainability 157
6.3 Financial and economic sustainability 159
6.4 Summary and conclusions 161
AnnexesAnnexe 1 About IOB 167
Annexe 2 Terms of reference 169
Annexe 3 Holding Company performance indicators for subsidiary companies 183
Annexe 4 FADWASC performance data 185
Annexe 5 Institutional assessment: list of interviews 195
Annexe 6 References 199
Drinking water supply and sanitation programme in Fayoum, Egypt, 1990-2009
| 7 |
Tables, boxes and figures
TablesTable 1 Types of work done in previous month (unweighted) 37
Table 2 Types of work done in previous month by household head (weighted) 37
Table 3 Phases of FaDWaSP 49
Table 4 FaDWaSP approach, Phase II 55
Table 5 Dutch expenditure: FaDWaSP Phase II 57
Table 6 Budget, FaDWaSP Phase V 74
Table 7 Progress in water and sanitation, Fayoum governorate, 1992-2009 78
Table 8 FADWASC water production cost trend 80
Table 9 FADWASC recent water production costs 80
Table 10 Recent FADWASC wastewater treatment cost trend 80
Table 11 Views on responsibility for water connections 100
Table 12 Where people go when they have water problems 100
Table 13 Whether Local Unit plays a role in water connection 101
Table 14 Role of Local Unit in water connection 101
Table 15 Views on responsibility for sanitation service 102
Table 16 Where people go when they have sanitation problems 103
Table 17 Whether Local Unit plays a role in sanitation service 103
Table 18 Role of Local Unit in sanitation service 103
Table 19 Ibshway Branch Customer Office summary monthly complaints report, 2008 109
Table 20 FADWASC complaints summary, January - March 2009 110
Table 21 FADWASC customer satisfaction survey, 2008 111
Table 22 What happens if water bill not paid 112
Table 23 Ease of enquiring about cost of water bill 112
Table 24 How those complaining to FADWASC are treated 113
Table 25 Main source of drinking water 123
Table 26 Summary of water tests 125
Table 27 Water quantities consumed by connected and not connected households 126
Table 28 Water quantities consumed by connected households before and after connection was established 126
Table 29 Availability of water from piped water supplies (including public taps)% 128
Table 30 Performance of the water network 129
Table 31 Types of toilet facility 132
Table 32 Where toilets drain 132
Tables, boxes and figures
| 8 |
Table 33 Problems reported by households without connection to sewer network 134
Table 34 Garbage disposal arrangements 136
Table 35 Sewerage connection status and household wealth 138
Table 36 Sewerage connection status and average local wealth 138
Table 37 Water pressure 139
Table 38 Water pressure and average local wealth 139
Table 39 Hand-washing practice and hygiene awareness training 140
Table 40 Hand-washing practice and hygiene awareness training 141
Table 41 Time required to fetch water (per trip) in the absence of a house connection 142
Table 42 Water connection and school enrolment 143
Table 43 Estimating total effect on diarrhoea prevalence 146
Table 44 Effect of chlorination on the quality of stored water 147
Table 45 Water pressure affects share of drinking water from tap 148
Table 46 Water pressure affects per capita consumption of drinking water quantity 148
Table 47 Piped sewerage connections at location and household levels (population percentages) 149
Table 48 Local presence of piped sewerage system reduces diarrhoea prevalence 149
Table 49 Household connections to piped sewerage system reduces diarrhoea prevalence 149
Table 50 Effect of share of drinking water from tap on diarrhoea prevalence 150
Table 51 Effect of drinking water quantity on diarrhoea prevalence 151
Table 52 Estimating total programme effect on diarrhoea prevalence (2-week recall) 152
Table 1 Population and water supply and sanitation data 170
Table 2 Access to improved drinking water sources 170
Table 3 Access to improved sanitation 170
BoxesBox 1 Phase I: inputs and cost 51
Box 2 Phase II: inputs and cost 56
Box 3 Phase III: inputs and cost 61
Box 4 Phase III: some challenges 64
Box 5 Phase IV: inputs and cost 68
Box 6 Phase V: inputs and cost 73
Box 7 Local Units’ involvement 102
Box 8 The Seila Community Development Association 105
Box 9 Reports from focus group discussions 130
Box 10 Reports from focus group discussions 134
Drinking water supply and sanitation programme in Fayoum, Egypt, 1990-2009
| 9 |
FiguresFigure 1 Reduction of diarrhoea as a result of water supply,
sanitation and hygiene improvement 28
Figure 2 Fayoum governorate 33
Figure 3 Water treatment plants in Fayoum 85
Figure 4 Water distribution network in Fayoum 86
Figure 5 FADWASC water production, 2005-06 – 2007-08 87
Figure 6 Water pressure distribution, 2002 88
Figure 7 Water pressure distribution, 2008 88
Figure 8 FADWASC UFW, 2005-06 - 2007-08 89
Figure 9 Wastewater treatment plants in Fayoum 91
Figure 10 Organisational structure of FADWASC, April 2009 94
Figure 11 Connecting households to the water network 122
Figure 12 Theory linking diarrhoea prevalence to FADWASC activities 145

| 10 |
Drinking water supply and sanitation programme in Fayoum, Egypt, 1990-2009
| 11 |
Abbreviations
AMP Alexandria Water General Authority Maintenance ProjectAWGA Alexandria Water General AuthorityBCO Branch Customer OfficeCARE Co-operative for Assistance and Relief Everywhere, Inc.CBO community-based organisationCDA Community Development AssociationCU compact unitDGIS Netherlands Directorate-General for International Co-operationDZH Duinwaterbedrijf Zuid-HollandEAWW El Azab Water WorksEKN Embassy of the Kingdom of the Netherlands, CairoEMP Economic Management PlanEUR EuroEWR Energie- en Watervoorziening Rijnland EWRA Egyptian Water and Wastewater Regulatory AuthorityFADWASC Fayoum Drinking Water and Sanitation CompanyFaDWaSP Fayoum Drinking Water and Sanitation ProjectFEGAWS Fayoum Economic General Authority for Water Supply and SanitationFSD Fayoum Sanitation DepartmentGDP Gross Domestic ProductGOE Government of the Arab Republic of EgyptGOF Governorate of FayoumGON Government of the NetherlandsHCWW Holding Company for Water and WastewaterHDI Human Development IndexIMF International Monetary FundIOB Policy and Operations Evaluation Department, MFANLE Egyptian PoundMFAN Ministry of Foreign Affairs of the NetherlandsMHUUD Ministry of Housing, Utilities and Urban DevelopmentMIS management information systemMOLD Ministry of Local Developmentmwc metres of water columnMWRI Ministry of Water Resources and Irrigationnd not datedNEAT New El Azab Water Treatment PlantNGO non-governmental organisationNOPWASD National Organisation for Potable Water and Sanitary Drainagenp no page number
Abbreviations
| 12 |
O&M operation and maintenanceORDEV Organisation for Reconstruction and Development of
Egyptian VillagesSCADA supervisory control and data acquisitionTA technical assistanceUASB upflow anaerobic sludge blanketUFW unaccounted-for waterUSAID United States Agency for International DevelopmentUSD US dollarWHO World Health Organisation WUA Water User Association
Drinking water supply and sanitation programme in Fayoum, Egypt, 1990-2009
| 13 |
Main findings and issues
Introduction
In 2008, the Policy and Operations Evaluation Department (IOB) of the Netherlands Ministry of Foreign Affairs initiated an impact evaluation of the water supply and sanitation programme supported by the Netherlands in Fayoum Governorate in Egypt, covering the period since 1990. This evaluation is the third in a series of impact studies of programmes for water supply and sanitary facilities supported by the Netherlands in selected countries. The purpose of the studies is to account for the support provided by the Netherlands and, based on the findings, to identify lessons and/or issues relevant for policy and policy implementation by the development partners concerned.
The Netherlands first became involved in Egypt’s drinking water and sanitation sector in 1977 when it approved a grant of EUR 1.13 million to the Alexandria Water General Authority for procurement of pumps and related parts. This type of programme aid was phased out in the early 1990s when Egypt’s foreign currency position improved substantially and the Netherlands became increasingly aware of the need for technical assistance to address the sector’s institutional weaknesses. Ultimately, total hardware and input supply funding amounted to EUR 32.9 million. In 1990 agreement was reached on the funding of two major technical assistance projects: the Alexandria Water General Authority Maintenance Project (AMP) and the Fayoum Drinking Water and Sanitation Project (FaDWaSP).
The thrust of both projects was to strengthen the institutional performance of the recipient organisations through on-the-job training, technical studies and advice. The AMP had a relatively narrow scope of work focusing mainly on water treatment plant operation and maintenance practices. The Fayoum project was a much longer-term, more intensive effort to address a broad range of technical, financial and managerial constraints affecting performance of the main responsible organisation for drink water supply and sanitation in Fayoum. The types of technology pursued are capital-intensive surface water treatment plants, wastewater treatment plants, piped transfer, distribution and sewerage systems and house connections. The total Dutch contribution through FaDWaSP (including Phase V to 2011 and covering capital finance contributions as well as technical assistance) has been EUR 44.3 million. In addition, the government of Egypt has contributed some EUR 48 million. FaDWaSP was extended four times and is currently in its fifth phase, up to 2011.
Egypt started reforming its drinking water and sanitation sub-sector in the 1990s. Three presidential decrees issued in 2004 shaped the current reform process. Decree 135 mandated the formation of a national Holding Company for Water and
Main findings and issues
| 14 |
Wastewater (HCWW), to be responsible for the operation and management of water supply and wastewater services, and the transformation of the then 14 Economic General Authorities into subsidiaries of the new HCWW. Decree 136 mandated the formation of the Egyptian Water and Wastewater Regulatory Authority, with the aim of balancing the interests of companies and customers while promoting commercially viable water and wastewater utilities. Decree 1/1/6/4 mandated the creation of subsidiary companies under the control of HCWW elsewhere in Egypt, where responsibility for the sector still rested with the governorates.
IOB opted to focus its evaluation on the impact up to 2009 of water supply, sanitation and hygiene promotion interventions in Fayoum Governorate. Whereas the Fayoum Drinking Water and Sanitation Company (FADWASC) and its predecessors have taken care of operation and maintenance, investments have been made by the Ministry of Housing, Utilities and Urban Development (MUUHD) and the Governorate, combined with special programmes supported by donors and NGOs. The study focuses on the impact on access to and use of water and sanitation facilities, on hygiene practices and, subsequently, on the target population’s health and livelihoods. It further entails an assessment of the institutional arrangements and sustainability of the benefits. The specific contribution by the Netherlands is described and assessed in chapter 3.
The methodology for the evaluation entails a combination of quantitative and qualitative methods and techniques. Impact is measured by comparing impact variables between locations (village blocks and hamlets) with and without programme interventions. The main data collection techniques comprised a survey of a total of 1500 households from 150 locations, focus group discussions, interviews with key informants and field observations. In addition, the impact analysis draws on the results of tests of the quality of drinking water – within the reticulation network and at point of use - and on health and education data.
Mainfindings
1) Between 1990 and 2009 an additional 2 million out of 2.7 million people in Fayoum acquired a household connection for water supply. However limited water pressure is still a widespread problem.
The population of Fayoum governorate was around 1.75 million in 1990, compared to 2.7 million in 2009. In the sample the percentage of connected households rose from around 30% in 1990 to 93% in 2008. Before they had a water tap at home, people mostly obtained water from public taps. Public taps have been widely reported not to function well because of poor management and maintenance, damage, limited water pressure and conflicts between people fetching water about the quantity of water they should take.
Drinking water supply and sanitation programme in Fayoum, Egypt, 1990-2009
| 15 |
Despite the major expansion of the water network and distribution system in the governorate, limited water pressure is still a widespread problem at this stage. Eighty-one percent of households in the sample reported water pressure to be good only at night. Only three percent of households reported pressure to be strong both day and night. In some cases water pressure is almost continuously very low, or taps are completely dry, over longer periods of time. As a result most households store water, mostly in traditional pots (zirs), but also in plastic containers, bottles, basins etc. In addition to their house connection, some households continue to use other water sources for domestic purposes, such as carts with water tanks, canals and, in a few cases, pumped groundwater. There is evidence that water pressure is somewhat better in relatively richer locations, but the differences are very small.
Measures to increase water pressure are continuing, by increasing water production and its reticulation to the different areas of Fayoum. A problem mentioned frequently by user groups with increasing water pressure is that older local distribution networks lack the capacity for increased pressure, resulting in pipe bursts and leakages. In addition multiple interconnections in some parts was reported to contribute to pressure losses.
2) Between 1990 and 2009 about 510.000 people were provided with a connection to a sewerage network. Most of the population uses conservancy tanks that create a range of problems affecting the wider community. Poor sanitary conditions are exacerbated by inadequate arrangements for garbage collection.
Most households with a connection to a sewerage network were connected after 2000. Piped sewerage connections appear to be introduced first in relatively wealthier locations. The expansion of the sewerage network still faces a number of technical and capacity problems, including an inadequate flow of wastewater and insufficient capacity for treatment of wastewater, which are being addressed.
Most people (62% of the sample households) reported to use conservancy tanks1; 10% use pipes connected to a canal (although this is illegal). In terms of sanitary facilities, 82% of the sample households rely on traditional bucket flush systems. Households experience various problems with these facilities, particularly the high cost of tank evacuation and sewage overflows that cause various health hazards. Wastewater disposal into canals affects wider sanitary conditions. An important explanatory factor for the problems faced is that the tanks used are conservancy tanks that have to be evacuated frequently. Local conditions limit the possibilities for septic tanks. Ways of providing adequate wastewater services to small rural settlements are still being investigated.
1 Low infiltration capacities of the soils and high groundwater water levels restrict technological options for on-site sanitation to conservancy tanks in most of Fayoum. Vaults being closed water-tight tanks without overflow have been recommended as best technically feasible on-site technology (Master Plan 1995). The tank has however to be emptied frequently and is therefore rather expensive to use.
Main findings and issues
| 16 |
In 17% of the households in the sample, garbage is taken away by a collector. In other cases households dispose of their own garbage, mostly by burning it, dumping it in canals or drains, taking it to a dump themselves or just leaving it on the street. Inappropriate garbage disposal compounds the environmental health risks created by inadequate wastewater evacuation arrangements.
3) The piped water supply scores high on quality standards, although people’s assessment of the taste and smell of tap water is less favourable. Due to limited water pressure most households store water and the stored water can become contaminated.
According to the results of the water quality tests the water supplied by the FADWSC is generally of very good quality. People’s subjective assessment of tap water quality in terms of taste and smell is however not very favourable. Households that are not connected are more positive about their drinking water than those with connections, and the connected households recall water tasting better before they got a connection. This may reflect the chlorine treatment by the water company.
Currently, the average ratio of tap water to stored water in household drinking water is around 40:60. Water quality tests show significantly lower levels of coliform bacteria in water samples taken directly from the tap than in samples from stored water. Twenty percent of the samples taken from water stored in traditional pots were contaminated with coliform bacteria. Treatment of stored water by boiling or chlorination and use of storage in tanks with a small opening reduces the levels of coliform bacteria.
Connected households report that they consume more water than they did before they had a connection. The increase is greater the longer people are connected to the network. However, this self-reported change in water consumption does not show a substantial increase and there is no significant difference in water use between connected and unconnected households. There is also no evidence that water con-sumption is related to water pressure. One possible explanation is that water consump-tion is more or less fixed but that improvements in pressure reduce the reliance on stored water. Also, no strong correlation was found between water consumption and the type of sanitation system.
4) Households that are connected to water networks and those connected to water and sewerage networks engage in better hygiene practices, although there is room for improvement especially by increasing hygiene training.
From the focus group discussions or the household survey it cannot be determined if there have been major changes in hygiene practices. Both data sources indicate that activities aimed at enhancing hygiene awareness are rather rare. The study has used hand-washing practices as a key proxy for hygiene measures that impact health. Over 60% of households connected to the water network or to both the water and sewerage networks wash their hands with soap, compared to 49% of the few house-holds without a water connection. In the few cases of households that attended a hygiene awareness activity (about 3% in the sample) the probability of hand-washing
Drinking water supply and sanitation programme in Fayoum, Egypt, 1990-2009
| 17 |
with soap increased significantly. Hand-washing with soap is most common amongst those households that have a designated place for hand-washing. The hygienic conditions of bathrooms and toilets leave room for improvement. Differences in hygiene behaviour may well be explained by socio-economic differences between households.
Survey data and focus group discussions point to a lack of awareness of the relation-ship between specific hygiene conditions and prevalence of diseases, e.g. between unhygienic water storage and diarrhoea. Very few households report treating stored water.
5) Three main interventions – controlling water quality, increasing water pressure, and installing piped sewerage systems – have all contributed to a moderate reduction in diarrhoea prevalence. Prevalence of diarrhoea is particularly lower in the small group of households who have reasonable water pressure and a sewerage connection.
The focus of the analysis of impact on health has been on diarrhoea prevalence as the key health indicator. 30% of households in the sample reported recent cases. Statistical analysis suggests that this would have been 32.9% in the absence of the programme, amounting to an 8.7% decline in diarrhoea prevalence. Impact analysis points to a lower prevalence, where water pressure is reasonable. The analysis shows that water pressure affects household water usage: household drinking water does not always come directly from the tap, but is stored for later use. When water pressure becomes more reliable they rely less on stored water. Households in the sample who treat the water from their home storage containers (a small minority) also suffer less from diarrhoea and other diseases. The data further show a slightly lower prevalence of diarrhoea in households with a sewerage connection, indicating that poor sanitary conditions help to explain disease prevalence. The reduced prevalence of diarrhoea can be valued at approximately USD 23 million per year.
There is no easy answer to the question which intervention works best. The company’s policy of virtual universal chlorination has obviously been successful, however without a simultaneous achievement of permanently high water pressure there is still a major problem of water quality. This suggests a very high payoff to improvements in water pressure. This is exactly the major intervention presently underway. The impact on sanitation is substantial, although not as strong as in some other countries, probably because the default mode of sanitation (conservancy tanks) is already effective despite problems with overflowing. Its importance may increase if coverage of sewerage connections increases. Moreover, as households start using more water it becomes increasingly important to have effective means of wastewater disposal.
An unintended effect of the extension of the water network is that improved water availability has in some locations contributed to the overflowing of on-site sanitation tanks and possible health dangers. In focus group discussions people reported that this induced them to use less water.
Main findings and issues
| 18 |
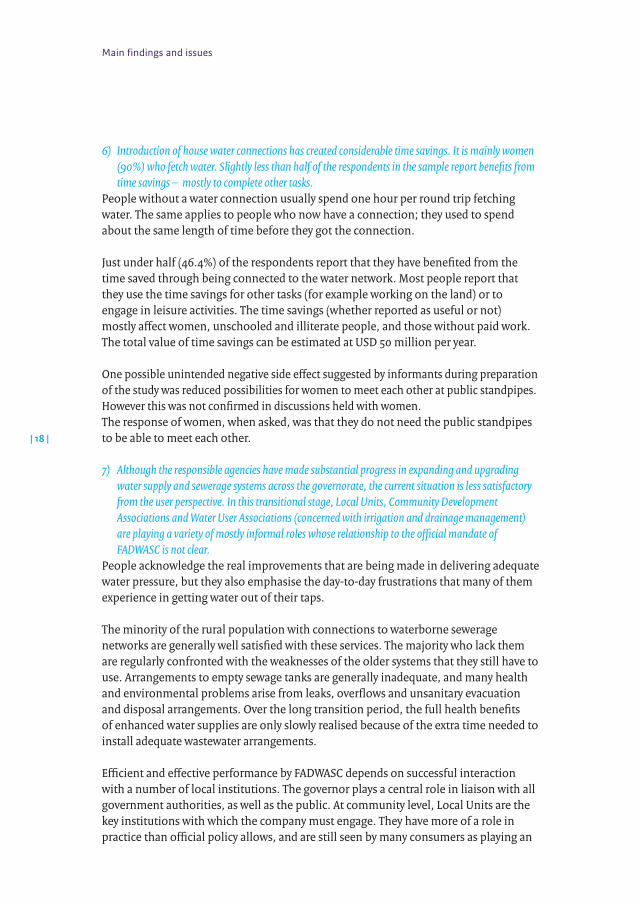
6) Introduction of house water connections has created considerable time savings. It is mainly women (90%) who fetch water. Slightly less than half of the respondents in the sample report benefits from time savings – mostly to complete other tasks.
People without a water connection usually spend one hour per round trip fetching water. The same applies to people who now have a connection; they used to spend about the same length of time before they got the connection.
Just under half (46.4%) of the respondents report that they have benefited from the time saved through being connected to the water network. Most people report that they use the time savings for other tasks (for example working on the land) or to engage in leisure activities. The time savings (whether reported as useful or not) mostly affect women, unschooled and illiterate people, and those without paid work. The total value of time savings can be estimated at USD 50 million per year.
One possible unintended negative side effect suggested by informants during preparation of the study was reduced possibilities for women to meet each other at public standpipes. However this was not confirmed in discussions held with women. The response of women, when asked, was that they do not need the public standpipes to be able to meet each other.
7) Although the responsible agencies have made substantial progress in expanding and upgrading water supply and sewerage systems across the governorate, the current situation is less satisfactory from the user perspective. In this transitional stage, Local Units, Community Development Associations and Water User Associations (concerned with irrigation and drainage management) are playing a variety of mostly informal roles whose relationship to the official mandate of FADWASC is not clear.
People acknowledge the real improvements that are being made in delivering adequate water pressure, but they also emphasise the day-to-day frustrations that many of them experience in getting water out of their taps.
The minority of the rural population with connections to waterborne sewerage networks are generally well satisfied with these services. The majority who lack them are regularly confronted with the weaknesses of the older systems that they still have to use. Arrangements to empty sewage tanks are generally inadequate, and many health and environmental problems arise from leaks, overflows and unsanitary evacuation and disposal arrangements. Over the long transition period, the full health benefits of enhanced water supplies are only slowly realised because of the extra time needed to install adequate wastewater arrangements.
Efficient and effective performance by FADWASC depends on successful interaction with a number of local institutions. The governor plays a central role in liaison with all government authorities, as well as the public. At community level, Local Units are the key institutions with which the company must engage. They have more of a role in practice than official policy allows, and are still seen by many consumers as playing an
Drinking water supply and sanitation programme in Fayoum, Egypt, 1990-2009
| 19 |
important part in the installation and operation of water and sanitation connections and networks. Part of the current necessary transition in consumer perception concerns the shift from water as a free or heavily subsidised service provided by the government to a commodity that users must buy from a more commercially oriented organisation. The widespread Community Development Associations and the growing number of Water User Associations play complementary roles affecting environmental health factors – such as garbage disposal and canal pollution – that in turn influence how far improved water and wastewater services can achieve their intended beneficial impacts. People and local institutions in Fayoum are thus still in a state of transition towards clear definition, understanding and fulfilment of institutional structures and roles with regard to water supply and sanitation.
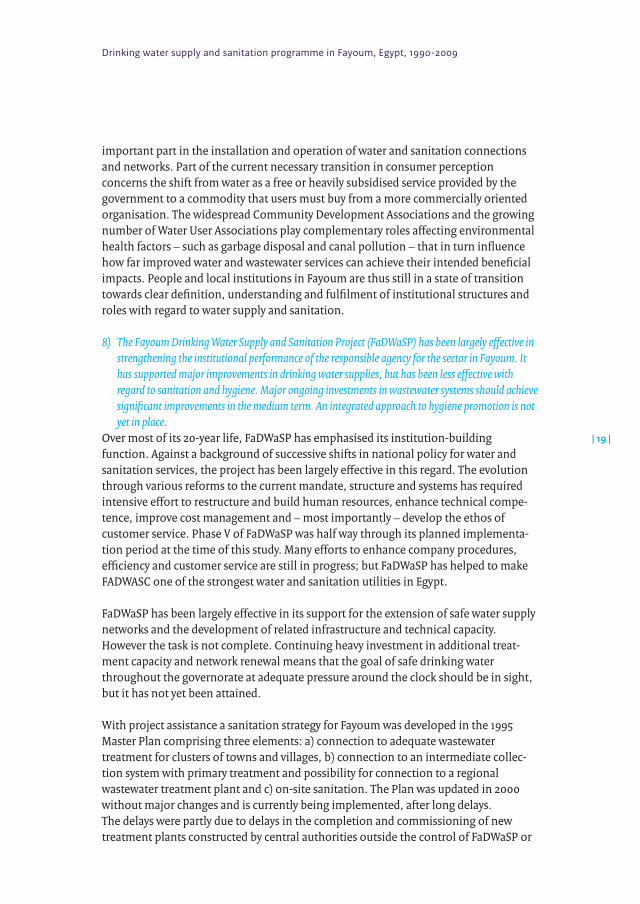
8) The Fayoum Drinking Water Supply and Sanitation Project (FaDWaSP) has been largely effective in strengthening the institutional performance of the responsible agency for the sector in Fayoum. It has supported major improvements in drinking water supplies, but has been less effective with regard to sanitation and hygiene. Major ongoing investments in wastewater systems should achieve significant improvements in the medium term. An integrated approach to hygiene promotion is not yet in place.
Over most of its 20-year life, FaDWaSP has emphasised its institution-building function. Against a background of successive shifts in national policy for water and sanitation services, the project has been largely effective in this regard. The evolution through various reforms to the current mandate, structure and systems has required intensive effort to restructure and build human resources, enhance technical compe-tence, improve cost management and – most importantly – develop the ethos of customer service. Phase V of FaDWaSP was half way through its planned implementa-tion period at the time of this study. Many efforts to enhance company procedures, efficiency and customer service are still in progress; but FaDWaSP has helped to make FADWASC one of the strongest water and sanitation utilities in Egypt.
FaDWaSP has been largely effective in its support for the extension of safe water supply networks and the development of related infrastructure and technical capacity. However the task is not complete. Continuing heavy investment in additional treat-ment capacity and network renewal means that the goal of safe drinking water throughout the governorate at adequate pressure around the clock should be in sight, but it has not yet been attained.
With project assistance a sanitation strategy for Fayoum was developed in the 1995 Master Plan comprising three elements: a) connection to adequate wastewater treatment for clusters of towns and villages, b) connection to an intermediate collec-tion system with primary treatment and possibility for connection to a regional wastewater treatment plant and c) on-site sanitation. The Plan was updated in 2000 without major changes and is currently being implemented, after long delays. The delays were partly due to delays in the completion and commissioning of new treatment plants constructed by central authorities outside the control of FaDWaSP or
Main findings and issues
| 20 |
FADWASC. Other constraints include staff shortages, questions about affordability, and limited demand for sewer connections. The project made a major contribution with the development of appropriate low-cost technology for wastewater treatment. The reforms of 2004 have helped to accelerate performance. Major ongoing invest-ment in network expansion and additional treatment capacity should transform the situation in the medium term. At present, wastewater disposal arrangements are still widely inadequate.
Another factor restricting beneficial health impacts is the intermittent and only partially effective performance of the project’s hygiene promotion efforts. There have been periodic attempts to develop an integrated approach to hygiene promotion with local government institutions, NGOs and CBOs, but these have not been fully succes-sful. The challenge has now been taken up by the FADWASC Public Awareness Directorate.
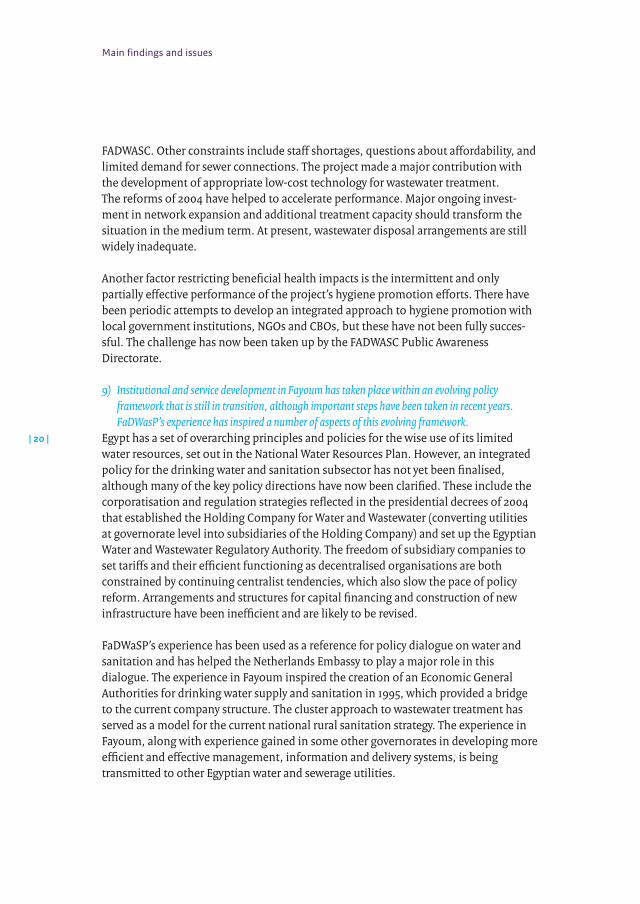
9) Institutional and service development in Fayoum has taken place within an evolving policy framework that is still in transition, although important steps have been taken in recent years. FaDWasP’s experience has inspired a number of aspects of this evolving framework.
Egypt has a set of overarching principles and policies for the wise use of its limited water resources, set out in the National Water Resources Plan. However, an integrated policy for the drinking water and sanitation subsector has not yet been finalised, although many of the key policy directions have now been clarified. These include the corporatisation and regulation strategies reflected in the presidential decrees of 2004 that established the Holding Company for Water and Wastewater (converting utilities at governorate level into subsidiaries of the Holding Company) and set up the Egyptian Water and Wastewater Regulatory Authority. The freedom of subsidiary companies to set tariffs and their efficient functioning as decentralised organisations are both constrained by continuing centralist tendencies, which also slow the pace of policy reform. Arrangements and structures for capital financing and construction of new infrastructure have been inefficient and are likely to be revised.
FaDWaSP’s experience has been used as a reference for policy dialogue on water and sanitation and has helped the Netherlands Embassy to play a major role in this dialogue. The experience in Fayoum inspired the creation of an Economic General Authorities for drinking water supply and sanitation in 1995, which provided a bridge to the current company structure. The cluster approach to wastewater treatment has served as a model for the current national rural sanitation strategy. The experience in Fayoum, along with experience gained in some other governorates in developing more efficient and effective management, information and delivery systems, is being transmitted to other Egyptian water and sewerage utilities.
Drinking water supply and sanitation programme in Fayoum, Egypt, 1990-2009
| 21 |
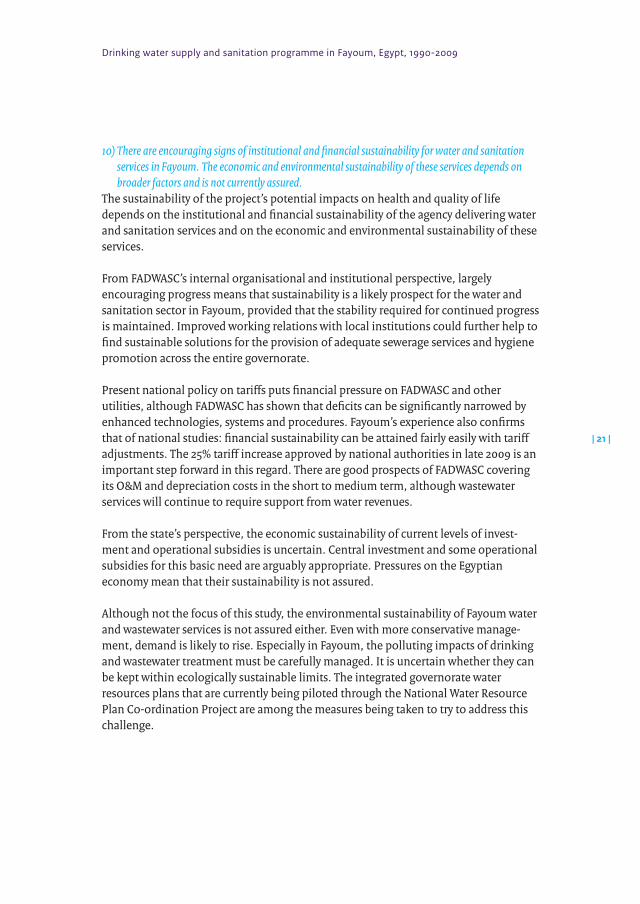
10) There are encouraging signs of institutional and financial sustainability for water and sanitation services in Fayoum. The economic and environmental sustainability of these services depends on broader factors and is not currently assured.
The sustainability of the project’s potential impacts on health and quality of life depends on the institutional and financial sustainability of the agency delivering water and sanitation services and on the economic and environmental sustainability of these services.
From FADWASC’s internal organisational and institutional perspective, largely encouraging progress means that sustainability is a likely prospect for the water and sanitation sector in Fayoum, provided that the stability required for continued progress is maintained. Improved working relations with local institutions could further help to find sustainable solutions for the provision of adequate sewerage services and hygiene promotion across the entire governorate.
Present national policy on tariffs puts financial pressure on FADWASC and other utilities, although FADWASC has shown that deficits can be significantly narrowed by enhanced technologies, systems and procedures. Fayoum’s experience also confirms that of national studies: financial sustainability can be attained fairly easily with tariff adjustments. The 25% tariff increase approved by national authorities in late 2009 is an important step forward in this regard. There are good prospects of FADWASC covering its O&M and depreciation costs in the short to medium term, although wastewater services will continue to require support from water revenues.
From the state’s perspective, the economic sustainability of current levels of invest-ment and operational subsidies is uncertain. Central investment and some operational subsidies for this basic need are arguably appropriate. Pressures on the Egyptian economy mean that their sustainability is not assured.
Although not the focus of this study, the environmental sustainability of Fayoum water and wastewater services is not assured either. Even with more conservative manage-ment, demand is likely to rise. Especially in Fayoum, the polluting impacts of drinking and wastewater treatment must be carefully managed. It is uncertain whether they can be kept within ecologically sustainable limits. The integrated governorate water resources plans that are currently being piloted through the National Water Resource Plan Co-ordination Project are among the measures being taken to try to address this challenge.
Main findings and issues
| 22 |
Issues
The main issues that arise from the findings are:
1) The obvious ongoing technical challenge is to achieve adequate standards of water delivery and wastewater disposal throughout the governorate of Fayoum. Despite many years of effort and progress, reported standards of water supply remain inadequate, and much further development is needed to achieve adequate sanita-tion services.
2) An appropriately integrated approach to hygiene promotion focusing on practices that limit intake of pathogens (such as treatment of stored water, adequate hand-washing, proper handling of infant faeces, hygienic toilets, garbage collection and treatment) is lacking.
3) Constraints on tariff-setting need to be resolved. The history of state subsidies for basic consumer goods and services in Egypt means that this is a sensitive issue, but the viability and sustainability of the current model of water and wastewater service delivery depend on its resolution. The recent approval of tariff increase has brought water and sanitation utilities closer to covering their costs.
4) Minimising non-revenue water (treated by the company but not paid for by consu-mers due to transmission and commercial losses) is a recognised priority, for financial and environmental reasons.
5) Institutional and technical transition is a key theme in this study’s findings. An important issue is whether the multiple challenges of this transition are being optimally addressed. There is scope for a less immediate and absolute application of the policy principle that the water and wastewater company takes sole responsibility for all operations. Greater flexibility in this regard could enhance levels of service, particularly in the wastewater subsector and hygiene promotion.
6) Optimal technical and institutional solutions still have to be identified for wastewa-ter services to small rural settlements. The most feasible arrangements may involve a stronger role for local institutions and the private sector, supplementing that of the water and sewerage company.
7) Given the necessary duration of the transition, more effective interim arrangements for sewage tank evacuation are a high priority. Current policy seems to focus only on installing waterborne sewerage facilities as fast as possible, so that the remaining period of transition will be minimised, and not to include short-term efforts to upgrade household tank evacuation services. Part of the national priorities could be to assess, for each locality, what services are currently available, what institutions are involved, and how capacity and institutional co-ordination – involving the
Drinking water supply and sanitation programme in Fayoum, Egypt, 1990-2009
| 23 |
private sector in particular – can be enhanced to reduce this significant constraint on rural standards of living. Such a strategy could focus on areas that will be difficult to serve with conventional sewerage systems in the short to medium term. Where appropriate it could stimulate the involvement of local government agencies, NGOs or CBOs agencies in servicing such areas.
8) Inadequate levels of public understanding about institutional arrangements and procedures are a significant constraint on levels of water and wastewater service. The problem is partly caused by insufficient service levels and the content of the company’s public information delivery, as well as customer services that do not sufficiently capture the problems and possible solutions to hand at local level. The nature of the technology means that direct consumer responsibility for O&M will not be appropriate. But better structured and more intensive relations between the company and Local Units would be beneficial, as would the development of consultative structures for regular consumer liaison.
9) There are strong political and institutional reasons for Egypt’s history of centralised administration, but progress in the water and wastewater sector at governorate level depends in part on the gradual relaxation of central control and the introduction of greater, though still regulated, discretion for local policy and decision making.
Background and methodology
1
Drinking water supply and sanitation programme in Fayoum, Egypt, 1990-2009
| 25 |
1.1 Reasonforandpurposeoftheevaluation
The Netherlands’ development cooperation has been active in water supply for over thirty years. The Policy and Operations Evaluation Department (IOB) of the Netherlands Ministry of Foreign Affairs has initiated a series of impact evaluations of support to programmes for water supply and sanitation facilities. The evaluations will provide information for a planned policy evaluation. This impact evaluation looks at program-mes supported by the Netherlands in the Fayoum Governorate of Egypt, where Dutch involvement started in 1990.
The Netherlands first became involved in Egypt’s drinking water and sanitation sector in 1977 when it approved a grant of EUR 1.13 million to the Alexandria Water General Authority for the procurement of pumps and related parts. This type of programme aid was phased out in the early 1990s, when Egypt’s foreign currency position improved substantially and the Netherlands became increasingly aware of the need for technical assistance to address the sector’s institutional weaknesses. Ultimately, the total hardware and input supply funding amounted to EUR 32.9 million. In 1990 agreement was reached on the funding of two major technical assistance projects: the Alexandria Water General Authority Maintenance Project (AMP) and the Fayoum Drinking Water and Sanitation Project (FaDWaSP; see section 2.7).
The thrust of both projects was to strengthen the institutional performance of the recipient organisations through on-the-job training, technical studies and advice. The AMP had a relatively narrow scope of work focusing on water treatment plant operation and maintenance practices. The Fayoum project was a much longer-term, more intensive effort to address a broad range of technical, financial and managerial constraints affecting performance in Fayoum. The types of technology pursued are capital-intensive surface water treatment plants, wastewater treatment plants, piped transfer and distribution systems and house connections. Dutch support has consisted of financial and technical assistance.
IOB opted to focus its evaluation on the impact up to 2009 of drinking water supply and sanitation facilities supported by the Netherlands in Fayoum Governorate. Since 2004, the programme has fallen under the responsibility of the Fayoum Drinking Water and Sanitation Company (FADWSC). This evaluation covers the 1990-2009 period, when FaDWaSP Phases I-IV were implemented and Phase V was started. The technical assistance contract for Phase V runs to the end of 2011, although the Netherlands Embassy planning for the project shows it continuing to 2012. Phase V started with a projected Dutch contribution of EUR 15.5 million and an Egyptian contribution of LE 97.5 million (EUR 12.6 million).The total Dutch contribution to FaDWaSP (including Phase V to 2011 and covering both capital finance contributions and technical assistance) has been EUR 44.3m. In addition, the government of Egypt has contributed some EUR 48 million.
1 Background and methodology
| 26 |
The focus of the evaluation is on the impact of the programme on the living conditions of the population at micro level. The ultimate purpose of support to water supply and sanitation facilities goes beyond access to services. It is meant to improve the living conditions of the population, in particular their health. There is consensus on such ultimate impacts, but conventional studies do not usually quantify them. Quantification is a key characteristic of this impact evaluation.
The Egyptian water supply and sanitation sector recognises the importance of the Fayoum Drinking Water and Sanitation Company’s experience for other governorates as well. This study will assess the progress that this core institution has made towards sustainability and the ways in which its evolution has influenced the quality and sustainability of services over the period. The purpose of the impact evaluation is to account for the support provided as well as to identify lessons and/or issues relevant to policy and policy implementation.
1.2 Evaluationquestions
The key evaluation questions addressed by the impact study are as follows.
Problemandcontext1) What have been key aspects of the problem and the context of the Fayoum
Drinking Water and Sanitation Project since 1990? 2) How has the national institutional and policy context for domestic water and
sanitation evolved in Egypt since 1990?
Projectdescription3) What have been the objectives of the Fayoum Drinking Water and Sanitation
project in Phases I to IV and in the current phase?4) What approaches/ strategies were adopted in order to meet the objectives?5) What inputs were provided?6) What main interventions have been undertaken by the project in Phase I to V?7) How has the institutional strategy of the Fayoum Drinking Water and Sanitation
Project evolved since 1990?8) How has the project’s strategy influenced the character and performance of
drinking water and domestic sanitation institutions?9) What were the main outputs for each of the four phases, and were targets
achieved?10) Who were the beneficiaries? 11) What has been the trend in the cost of service delivery?
Outcomesandimpact12) What has been the change in the proportion of the rural population of Fayoum
with access to an improved water source/ house connection since 1990?
Drinking water supply and sanitation programme in Fayoum, Egypt, 1990-2009
| 27 |
13) What has been the change in the quality and quantity of water provided and consumed?
14) What has been the change in the access of the population to an improved sanitary facility/ sewerage connection?
15) How are facilities divided over households in different socio-economic groups? Who are the main beneficiaries?
16) What has been the change in hygiene practices?17) What has been the change in the time required to collect water?18) How are time savings used? E.g. have these been used for educational and or
productive purposes. 19) What have been the effects on the health of the population?20) Have there been positive or negative unintended effects?21) Which interventions work best and why?
Sustainabilityanalysis22) Are institutional structures and roles with regard to domestic water and sanitation
clearly defined, understood and fulfilled in Fayoum?23) Do the relevant institutions, particularly the Fayoum Drinking Water and Sanitation
Company, have the capacity to perform the required functions in the long term?24) How do customers perceive the quality of services provided?25) In Fayoum governorate, to what extent do current institutional arrangements at
local level provide support for sustainable domestic water and sanitation services and the quality of these services?
26) To what extent do current institutional arrangements provide potential for user participation in the planning, operation and maintenance of domestic water and sanitation services?
27) Do institutional arrangements include adequate provision to monitor results and follow up issues?
28) What lessons and/or issues can be derived from the findings that are relevant to policy and policy implementation?
1.3 Methodologyanddatacollection
For the purposes of this study, impact evaluation is defined as the systematic identifica-tion of the effects that the Fayoum drinking water supply and sanitation programme supported by the Netherlands has had – positive or negative, intended or not – on the living conditions of target groups and the society within which they live. The evalua-tion questions on outcomes and impacts indicate the main variables of interest. International studies show that improvements in water and sanitation do not automa-tically improve people’s health: it is important to add a hygiene education component in order to guarantee a positive impact. This is illustrated in figure 1.
1 Background and methodology
| 28 |
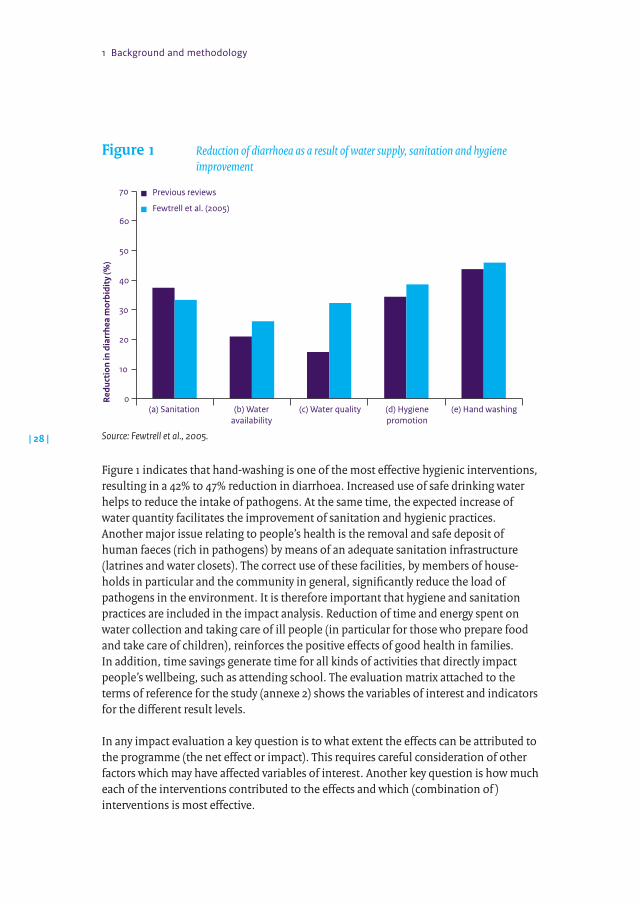
Figure1 Reduction of diarrhoea as a result of water supply, sanitation and hygiene improvement
(a) Sanitation (b) Water (c) Water quality (d) Hygiene (e) Hand washing availability promotion
Redu
ctio
n in
dia
rrhe
a m
orbi
dity
(%)
70
60
50
40
30
20
10
0
Previous reviews
Fewtrell et al. (2005)
Source: Fewtrell et al., 2005.
Figure 1 indicates that hand-washing is one of the most effective hygienic interventions, resulting in a 42% to 47% reduction in diarrhoea. Increased use of safe drinking water helps to reduce the intake of pathogens. At the same time, the expected increase of water quantity facilitates the improvement of sanitation and hygienic practices. Another major issue relating to people’s health is the removal and safe deposit of human faeces (rich in pathogens) by means of an adequate sanitation infrastructure (latrines and water closets). The correct use of these facilities, by members of house-holds in particular and the community in general, significantly reduce the load of pathogens in the environment. It is therefore important that hygiene and sanitation practices are included in the impact analysis. Reduction of time and energy spent on water collection and taking care of ill people (in particular for those who prepare food and take care of children), reinforces the positive effects of good health in families. In addition, time savings generate time for all kinds of activities that directly impact people’s wellbeing, such as attending school. The evaluation matrix attached to the terms of reference for the study (annexe 2) shows the variables of interest and indicators for the different result levels.
In any impact evaluation a key question is to what extent the effects can be attributed to the programme (the net effect or impact). This requires careful consideration of other factors which may have affected variables of interest. Another key question is how much each of the interventions contributed to the effects and which (combination of ) interventions is most effective.
Drinking water supply and sanitation programme in Fayoum, Egypt, 1990-2009
| 29 |
The Fayoum water supply and sanitation programme has affected households in more than one way: by providing them with access to the water network through a yard or house connection, providing them with water more frequently and/or in greater quantity or of better quality, exposing them to public awareness messages on water use and hygiene, and connecting them to the sewerage network. There is therefore not a single intervention (as in standard impact evaluations where treatment and control groups are compared). Instead, households in different locations in the governorate have been exposed to different components of the programme, at different points in time and also to different extents. A regression approach has been used to deal with heterogeneity.
The study used data collected by a questionnaire and focus group discussions with households in a sample of locations in the rural areas of Fayoum governorate (i.e. outside Fayoum City). Fifty locations (village blocks and hamlets) were selected randomly to answer questions on programme outcomes. Another 100 locations (50 planned to be affected and another 50 not to be affected by programme sewerage connection and improvement of water pressure interventions in 2008/2009) were sampled to assess programme outcomes up to 2008 and health outcomes in 2009. Households in areas to be affected by these project interventions in 2008/2009 were to be interviewed twice. A first questionnaire was administered in 2008 and a second survey was to take place at the end of 2009. Following delays in implementation of the planned interventions the second round of surveys could not take place in 2009. This has limited the data for impact analysis.
The statistical analysis of impact on health focuses on the impact of recent interventions. Accordingly, the sample has been designed so to ensure an adequate representation of these locations. To the extent that similar interventions were used in the earlier period (1990-2007) these results show the effectiveness of the programme. However, it should be noted that the evaluation does not do full justice to the programme since the impact of particular interventions may have been greater initially than now, when a large number of households already have house connections.
The method applied has allowed for the heterogeneity of interventions in the programme by including variables which characterise the intervention for a particular location, e.g. in addition to the extent of house connections, water pressure, type of basic sanitation and so on. In each case the coefficient on such a variable indicates how much impact (e.g. in terms of reduced diarrhoea) may be expected from a change in that variable. The results therefore not only indicate what works but also by how much. As a key dimension of impact the study includes an assessment of the sustainability of benefits in Fayoum. The research questions on sustainability focus on institutional factors that explain sustainability. Institutional performance of the responsible agency, which is now the Fayoum Drinking Water and Sanitation Company (FADWASC), has been the focus of much of the Netherlands’ support through five phases of FaDWaSP.
1 Background and methodology
| 30 |
The evolution through various institutional and organisational reforms to the current structure and mandate has required an intensive effort to restructure and build human resources, enhance technical competence and – most importantly – develop the ethos of customer service. At the same time, the company had to maximise its cost recovery in a policy environment that still constrains its freedom of action. The study investigates these aspects in order to assess sustainability.
Linked to sustainability is the question how people in Fayoum perceive the perfor-mance of the sector. In this respect the study has investigated what role, if any, Local Councils and Local Units play in this regard; whether citizens’ voices are heard at the level of the governorate, either through direct contact or via these local institutions; and, of course, how effectively consumers can influence the company’s planning and performance through direct contact with it (notably, though not only, through its customer relations offices). It also looked at differentials in institutional structure and performance across the spectrum from more isolated rural hamlets to the comparatively large ‘villages’ and towns that have been served by the project, and at the role of NGOs, particularly in hygiene practices and solid waste management – helping to explain the programme’s impact on human health.
The parallel sector of water resource management is all-important for Egyptian livelihoods. It has been the scene of intensive institutional development efforts, supported in Fayoum by the Netherlands. This study also assessed the relevance of water management institutions to the achievement of satisfactory and sustainable outcomes in the drinking water and domestic sanitation sector. Institutional developments in Fayoum have largely reflected the evolution of national policy and strategy - although Fayoum is to some extent seen as an institutional model by the central authorities, and there has certainly been much interaction between Fayoum and national strategy. For these reasons, this study’s institutional enquiries have been balanced across the user level, the company (and other institutions) at the level of Fayoum governorate, and central level.
Questions for the sustainability analysis have been addressed in the following ways: a review of documentation; interviews with local government authorities and company officials at district and local levels, including Local Councils, Local Units and company customer relations staff; investigation of people’s perceptions through the main survey instrument and focus group discussions, with particular reference to views on the company’s structure and performance, the role and performance of local government institutions, the role of other water management institutions and community-based organisations in domestic water supply and sanitation; focus group discussions with groups of male and female users; and interviews with key informants in Fayoum City and Cairo.
Drinking water supply and sanitation programme in Fayoum, Egypt, 1990-2009
| 31 |
The main field mission for the sustainability analysis took place in April 2009. Subsequent delays and uncertainty about whether the second round of the questionnaire survey could proceed mean that this report has been published a year after the main institutional investigations. Efforts have been made to update the analysis on the basis of recently received information, but the overall situation described is that of mid 2009.
1.4 Structureofthereport
The study continues in chapter 2 with a description of the context for the water supply and sanitation sector in Egypt generally and in Fayoum governorate specifically. Chapter 3 summarises what the Fayoum Water and Sanitation project has done during its five phases. Chapter 4 describes the current institutional framework, structure and functioning of the water and sanitation sector in the governorate, with particular reference to the Fayoum Drinking Water and Sanitation Company. The evaluation’s findings with regard to the impact and sustainability of programme supported by the Netherlands are presented in Chapters 5 and 6. The report is summarised by a synthesis chapter (above) on the main findings and issues.
Programme context
2
Drinking water supply and sanitation programme in Fayoum, Egypt, 1990-2009
| 33 |
2.1 Demographyandsociety
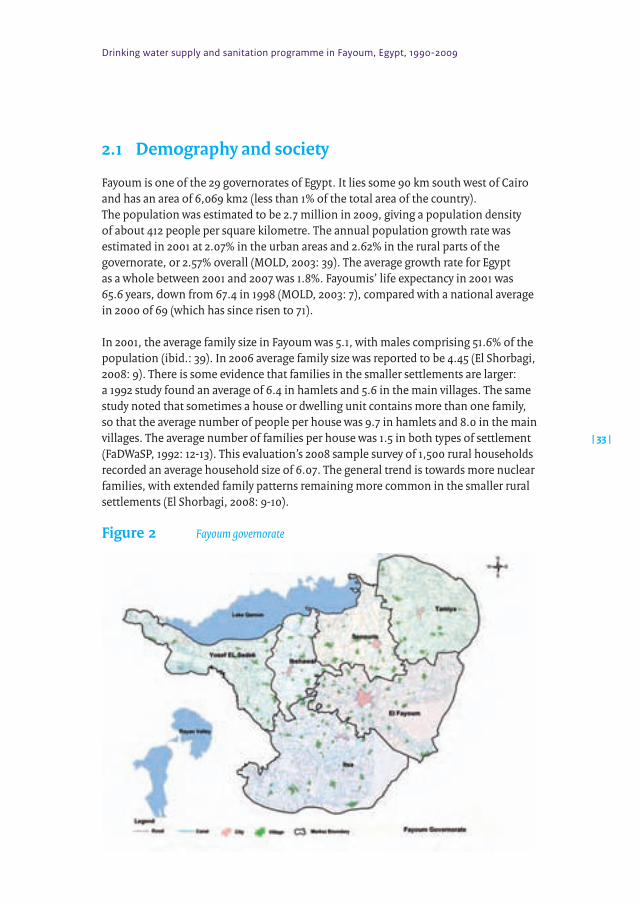
Fayoum is one of the 29 governorates of Egypt. It lies some 90 km south west of Cairo and has an area of 6,069 km2 (less than 1% of the total area of the country). The population was estimated to be 2.7 million in 2009, giving a population density of about 412 people per square kilometre. The annual population growth rate was estimated in 2001 at 2.07% in the urban areas and 2.62% in the rural parts of the governorate, or 2.57% overall (MOLD, 2003: 39). The average growth rate for Egypt as a whole between 2001 and 2007 was 1.8%. Fayoumis’ life expectancy in 2001 was 65.6 years, down from 67.4 in 1998 (MOLD, 2003: 7), compared with a national average in 2000 of 69 (which has since risen to 71).
In 2001, the average family size in Fayoum was 5.1, with males comprising 51.6% of the population (ibid.: 39). In 2006 average family size was reported to be 4.45 (El Shorbagi, 2008: 9). There is some evidence that families in the smaller settlements are larger: a 1992 study found an average of 6.4 in hamlets and 5.6 in the main villages. The same study noted that sometimes a house or dwelling unit contains more than one family, so that the average number of people per house was 9.7 in hamlets and 8.0 in the main villages. The average number of families per house was 1.5 in both types of settlement (FaDWaSP, 1992: 12-13). This evaluation’s 2008 sample survey of 1,500 rural households recorded an average household size of 6.07. The general trend is towards more nuclear families, with extended family patterns remaining more common in the smaller rural settlements (El Shorbagi, 2008: 9-10).
Figure2 Fayoum governorate
2 Programme context
| 34 |
About 22.5% of the population are classified as living in urban areas with the rest in rural settlements. However, most of the rural areas are densely settled and many of what are known locally as ‘villages’ are actually small towns. The smallest settlements are known as ezbas or hamlets. Officially, there are six cities in the governorate, along with 61 main villages, 163 satellite villages and 1,879 hamlets (GOF, 2008: np). The governorate was divided into five marakez or districts, but a sixth, Youssef El Seddik, was added in 2002.
Society in Fayoum is experiencing the same rapid transitions as the rest of Egypt. Growth of Fayoum City and the larger towns and ‘villages’, together with an increasingly youthful age profile, have substantially altered lifestyles and aspirations for a growing proportion of the population. These demographic and social trends are slowed somewhat in Fayoum by continuing heavy dependence on irrigated agriculture, which keeps many of the young, as well as the older generations, closer to the land in smaller settlements. Migrant labour has exposed many male Fayoumis to life in Cairo or further afield (one town in the governorate, Tatun, is known for its strong migrant links to Italy (Schemm, 2008)), but the gender distribution of household, economic and governance roles is changing only gradually. Most women retain their traditional roles in the home, although steadily growing numbers are attaining better education and finding employment – including those working as engineers and technicians in the water and sanitation sector. Small numbers of women are now achieving public office in local governance structures. Islamic principles remain paramount in the lives of most Fayoumis and find expression in many aspects of their social structure, interpersonal relations and daily lives.
2.2 Naturalenvironment
The governorate of Fayoum lies within the Fayoum depression, which until recent times received flood waters each year from the Nile to the east and, like almost all of Egypt, still depends entirely on that river.
This area has a unique physical setting, but also unique environmental and natural resource use problems:a) every gram of water, salt or pollutant that flows into, or is produced within, the basin (if not
lost to deep seepage or evaporation) will be accumulated, thus demanding careful attention for water quality and water balances;
b) a densely settled and growing human population... on 1,428 km2 of fertile cultivated soils requires careful management of the limited land resources, especially in view of often conflicting land use options... (Euroconsult/Darwish Consulting Engineers, 1992: 1).
Nile flood water reaches the Fayoum depression through the Hawara (Lahun) gap, where the altitude is about 25m above sea level. The Bahr Youssef canal that feeds the entire irrigation and drinking water system of the governorate passes through this gap.
Drinking water supply and sanitation programme in Fayoum, Egypt, 1990-2009
| 35 |
The depression slopes down to the north west. At the bottom of the basin is Lake Qarun, at an altitude of 43m below sea level. For the reasons outlined above, the lake is vulnerable to pollution by agricultural chemicals and other contaminants drained into it from across the depression.
Provision of and access to water are the critical factors in present day Fayoum: water acts as the interface between physical resources and biological life... the hydrological situation of the Fayoum is unique: surface waters enter the depression at only one place and leave the depression only through the process of evaporation. The quantities of deep ground water entering or leaving Fayoum are so small that they can be neglected (Euroconsult/Darwish Consulting Engineers, 1992: 18).
The Saharan climate of the area, with average annual rainfall of 10 mm, would ensure desert conditions in Fayoum were it not for the water that now flows through the Bahr Youssef canal. Nile sediments make the soils of the depression fertile and sustain the intensive irrigated cultivation on which the population of the governorate mainly depends. Of the total 179,700 ha of the Fayoum depression, the irrigation system services 152,800 ha, including 136,000 ha of arable land (Euroconsult/Darwish Consulting Engineers, 1992: 44). For various reasons, subsurface drainage is poor in many areas. This may be because of shallow layers of impervious material, water logging due to excess irrigation or saturation with effluent from sewage tanks, or the poor draining qualities of some soils (Ibid: 79). Whatever the reasons, this factor complicates on-site sanitation arrangements.
2.3 Economyandpoverty
The people of Fayoum depend largely on agriculture for their livelihoods, along with migrant earnings from elsewhere in Egypt and beyond. Farming in the governorate is intensive, with a cropping intensity of 170-200%. Common crops include wheat, beans, rice, maize, cotton and many fruit and vegetables for the huge nearby market of Cairo. Aromatic and medicinal plants are also grown for the domestic and international markets. There is relatively little industrial activity in the governorate, although the Qom Oshim industrial city accommodates glass, cardboard, plastics, food and other factories and a second industrial area has been developed (but not yet occupied) in the Qota area (GOF, 2008: np). Other industries in Fayoum include cotton ginning, ceramics, animal feed processing and carpet production.
Despite its high agricultural productivity, Fayoum is one of the poorest parts of Egypt. It offers little industrial employment. In 2004, 46% of its labour force (those aged 15 and above) were engaged in agriculture, 17% in industry and 37% in services, many of which support the agricultural sector (Institute of National Planning, 2005: 224). Its human development index (HDI) for 2004 was calculated as 0.61, ranking it 22nd of all governorates in the country (down from 19th in 1998 (Institute of National Planning,
2 Programme context
| 36 |
2005: 211; MOLD, 2003: 51)). The HDIs for Port Said, Cairo and Suez, the highest three in the country, were 0.78, 0.77 and 0.76 respectively. The average HDI for Lower Egypt was 0.69, and the average for Upper Egypt, within which Fayoum was classified, was 0.66. The HDI for Egypt as a whole was 0.69. Fayoum in fact scored the lowest HDI of all the governorates for which it was calculated in 2004 (none was shown for the five ‘frontier governorates’).
2003-04 data from the national 2005 Human Development Report show a real GDP per capita in Fayoum governorate of USD 2,709. This compares with USD 9,070 for Port Said, USD 7,623 for Cairo and USD 6,865 for Suez. Average real per capita GDP for Lower Egypt in 2003-04 was USD 3,793 and for Upper Egypt, USD 3,758. The national average was USD 4,152. Three governorates had lower real per capita GDP than Fayoum. Not surprisingly, the 2003 Human Development Report for Fayoum governorate found that Fayoum City and district enjoyed the highest HDI in the governorate, as well as the highest GDP per capita. Other sources show an estimated national average GDP per capita in 2009 (based on purchasing power parity) of USD 6,044 (IMF, 2009). Millennium Development Goal data show that, in 2005, Egypt as a whole had a poverty headcount ratio of 2.0%, calculated at USD 1,25 per day (purchasing power parity). This was better than the regional Middle East and North Africa average of 3.6%, which is heavily influenced by Yemen’s ratio of 17.5% in the same year. Tanzania’s figure (2000 data) was 88.5% (World Bank, 2009).
Literacy is one variable on which Fayoum scores particularly weakly in the HDI calculations. Literacy in Fayoum City in 2003 was 62.5% of those aged 15 and over, compared with only 36.7% in Tamya district and a governorate average of 47.6%. In the national 2005 Human Development Report, the average for the governorate was 47.8%, compared with an average for Upper Egypt of 56.5% and an average for all rural areas in Upper Egypt of 44.9% (Institute of National Planning, 2005: 215).
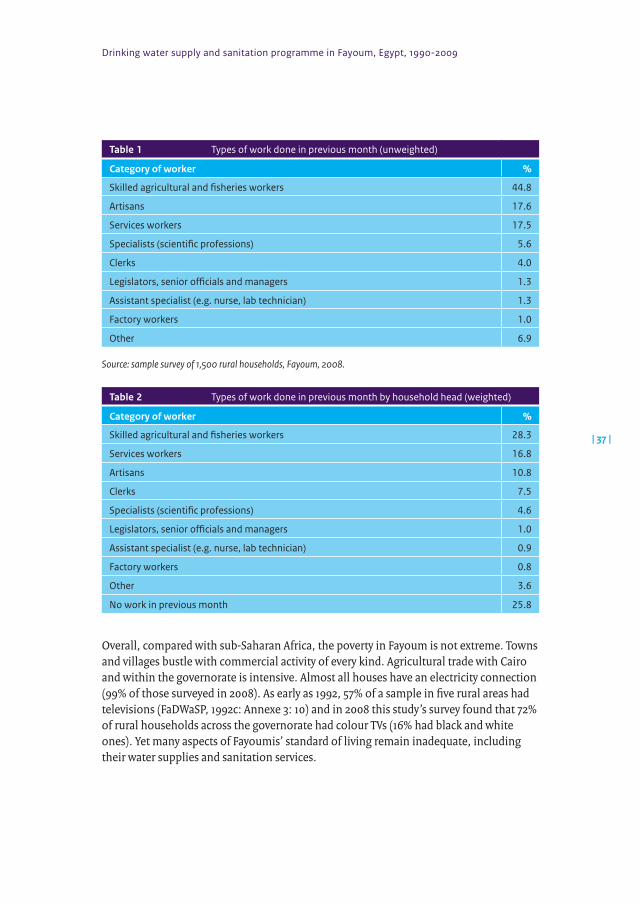
This study’s sample survey of 1,500 households in rural Fayoum asked whether those aged six or older had done any work during the previous month. Of the 86% of the population in this age bracket, almost a third (32.5%) had worked. Tables 1 and 2 show the types of work that were reported. Of those who worked, 76.5% were reported to have been paid in cash and 14.6% in both cash and kind; 8.2% were not paid at all, while only 0.7% was paid in kind only. Agriculture and fisheries workers made up the large majority of these last three categories (94.1%, 93.3% and 64.7% respectively).
Drinking water supply and sanitation programme in Fayoum, Egypt, 1990-2009
| 37 |
Table 1 Types of work done in previous month (unweighted)
Category of worker %
Skilled agricultural and fisheries workers 44.8
Artisans 17.6
Services workers 17.5
Specialists (scientific professions) 5.6
Clerks 4.0
Legislators, senior officials and managers 1.3
Assistant specialist (e.g. nurse, lab technician) 1.3
Factory workers 1.0
Other 6.9
Source: sample survey of 1,500 rural households, Fayoum, 2008.
Table 2 Types of work done in previous month by household head (weighted)
Category of worker %
Skilled agricultural and fisheries workers 28.3
Services workers 16.8
Artisans 10.8
Clerks 7.5
Specialists (scientific professions) 4.6
Legislators, senior officials and managers 1.0
Assistant specialist (e.g. nurse, lab technician) 0.9
Factory workers 0.8
Other 3.6
No work in previous month 25.8
Overall, compared with sub-Saharan Africa, the poverty in Fayoum is not extreme. Towns and villages bustle with commercial activity of every kind. Agricultural trade with Cairo and within the governorate is intensive. Almost all houses have an electricity connection (99% of those surveyed in 2008). As early as 1992, 57% of a sample in five rural areas had televisions (FaDWaSP, 1992c: Annexe 3: 10) and in 2008 this study’s survey found that 72% of rural households across the governorate had colour TVs (16% had black and white ones). Yet many aspects of Fayoumis’ standard of living remain inadequate, including their water supplies and sanitation services.
2 Programme context
| 38 |
2.4 Health
Egypt has an extensive network of public healthcare facilities, and communicable diseases are generally well controlled with the assistance of sustained high immunisa-tion rates (WHO, 2009a). Schistosomiasis infections have been reduced, but this waterborne disease remains a significant health risk in Fayoum and the many other irrigated areas of the country. Viral hepatitis (C and A forms) and tuberculosis are other major public health concerns. The WHO reports that non-communicable diseases are becoming more common, notably neuro-psychiatric disorders, digestive system diseases, chronic respiratory problems and cardio-vascular diseases. Maternal and infant mortality rates remain high: the under-5 mortality rate was 36 per 1,000 in 2004, and maternal mortality was 84 per 100,000 live births in 2000. HIV infection levels remain extremely low in Egypt (ibid.).
Waterborne diseases are a particular concern in Fayoum governorate, due to the extensive irrigation and to the inadequate sanitation arrangements. Egypt is now virtually malaria-free. Fayoum is the only part of Egypt where residual transmission may still occur (WHO, 2009b), although the last reported cases were in 1998 (WHO, 2006a, b).
Most serious disease problems in Fayoum, as in the delta, are water-borne; they are spread either by direct contact with, or use of faecal-contaminated waters (enteritis, intestinal protozoans and worms), or by vectors (bilharzia, malaria, viral encephalitis, other viral diseases)... In comparison to national averages, the prevalence of infections/vector-borne diseases in Fayoum show[s] the following characteristics:• Prevalence of viral encephalitis is higher in Fayoum;• Prevalence of infectious hepatitis and of polio are equal to the national averages, but cause
concern;• Diphtheria, tuberculosis, rabies, bronchopneumonia and tetanus are all present, and
require vigilance to keep outbreaks under control if village environmental conditions continue to deteriorate (Euroconsult/Darwish Consulting Engineers, 1992: 84-85).
The summary quoted above is now 17 years old, and some aspects of disease control and prevalence in Fayoum have since improved. However, the risks posed by inadequate sanitation and by the heavy use of agro chemicals remain significant (although Farmer Field School programmes promoting less polluting methods of soil fertility maintenance may be reducing the latter). Chapter 5 will show the current health status of the rural Fayoum population as revealed by this study’s field surveys.
2.5 Governmentandinstitutions
Any development process in Egypt is framed by the complex contexts of national and local governance and bureaucracy, which combine strongly centralised authority with
Drinking water supply and sanitation programme in Fayoum, Egypt, 1990-2009
| 39 |
institutional and administrative frameworks that allow only the most gradual change. Formal authority structures are strongly respected and provide the means for the exercise of direct power, immediate resource allocation and the achievement of prompt action. Administrative systems and structures are extensive, overlapping and typically inefficient and resistant to change. Their convoluted procedures and internal organisation make reform difficult and action slow. For the citizen or agent of development, there are therefore two ways to get things done: through the conventional systems, structures and procedures, or by finding a way to access the sources of direct political authority. Those reforming the water and sanitation sector must grapple with the conventional institutional challenges of streamlining Egyptian bureaucracies, but must also use political connections judiciously to ensure that central authority and action are on their side. The villager trying to rectify a service billing error or to get an adequate water supply for his community can seek satisfaction through the standard and often tedious bureaucratic procedures but may prefer to appeal directly to someone with political power or institutional connections.
Against this background, the institutional framework for water and sanitation programmes in Fayoum can be briefly described. The governor is the apex of political power and administrative authority. As the personal representative of the President in the governorate, he wields great influence (see section 2.6 below). Under Local Administration Law no. 145 of 1988, each rural governorate is divided into marakez (districts). Each district comprises a main town (its capital), which is divided into neighbourhoods, and a number of Local Units. Each Local Unit is made up of a ‘mother village’ – usually, in fact, a substantial town – and various ‘satellite’ or smaller villages, along with many outlying ezbas or hamlets. The four levels of governance with which any development intervention for primary services must engage are therefore central government in Cairo, the governorate, the district, and the Local Unit.
Within the governorate, participatory representation is provided by a nested structure of Local Popular Councils at all three levels. These bodies are elected every four years by a system of proportional representation. ‘These councils provide an institutional framework by which local demands, complaints and proposals can be channelled to higher governmental authorities’ (Rachid, 1990: 47, quoted in Radwan, 1994: 2). At each level there is also a Local Executive Council, comprising officials of the govern-ment departments operating there. In this way, an executive structure partners the representative body at Local Unit, district and governorate levels.
Thus, there exists in Egypt’s local administration ‘a parallel system of popular elected officials and professional appointed officials [that] runs from the village to the governorate level in an attempt to balance consultative participation democracy and administrative authority’ (Radwan, 1994: 3, quoting Rachid, 1990: 49).
Public utility corporations, too, can delegate staff to represent them on the Local Executive Councils at each level, if they have enough competent personnel. Fayoum
2 Programme context
| 40 |
has 58 Local Units in addition to the structures of its seven districts and at governorate level in Fayoum City (MOLD, 2003: 35). Only the largest ministries and agencies can thus manage to post an official to each Local Executive Council. The Ministry of Local Development appoints a Local Unit Head and his secretariat. Members of Local Executive Councils each report to their respective ministries or departments at higher levels. Egyptian government is still highly centralised. The structure of Local Popular Councils and Local Executive Councils provides scope for consultation and participation, but not for decentralisation and still less for devolution.
In addition to the structures outlined above, more traditional forms of authority are also significant. Notable among these, at local level, is the omdah. Often translated as ‘mayor’, this individual does not in fact have any formal municipal function. Instead, he is supposed to use wisdom, authority and influence to keep the peace: maintaining security, settling feuds and disputes, preventing and reporting crimes etc. The omdah is appointed and paid by the Ministry of Interior in places that do not have police stations, which play these roles where they exist. His deputy, the sheikh el-balad, is appointed and paid by the same ministry.
Community Development Associations (CDAs) are very widespread in Egypt. In fact, they have taken on a semi-official role, having first been authorised by Law 132 of 1964 (most recently amended by Law 84 of 2002). These legal entities are registered and supervised by the Ministry of Social Solidarity and may be involved in a wide range of local service and development activities, such as children’s nurseries, vocational training, micro-finance schemes, literacy and religious education, bakeries, funeral services, social welfare and garbage removal. There is a relatively straightforward procedure for setting up a CDA, although the bureaucratic decision-making may be protracted. In some areas, including Fayoum, CDAs have been funded by Egyptian and foreign development agencies and programmes as local implementing agents for a variety of initiatives to help the poor and improve local social services.
2.6 Nationalwatersupplyandsanitationpolicy,andinstitutionalcontext
Egypt has a set of overarching principles and policies for the wise use of its limited water resources. These are set out in the National Water Resources Plan (GOE, 2005) for the period to 2017. (A new water resources master plan, to 2050, is being prepared.) The overall objectives of the current plan are shown in the box. Many of the key policy principles are part of the integrated water resources management approach that the country has adopted (GOE, 2006: 5). They include recognition of the finite and holistic nature of water as a resource: the interdependency of the hydrological system demands a correspondingly integrated management approach that may transcend national boundaries, as it certainly does in the case of the Nile system on which Egypt depends.
Drinking water supply and sanitation programme in Fayoum, Egypt, 1990-2009
| 41 |
By the same token, Egyptian policy treats water as a common resource that cannot be individually owned, and demands widespread stakeholder participation in water resource management. Emphasising the need for responsible environmental management, Egypt endorses the precautionary principle with regard to water resource development and use, and requires enforcement of the ‘polluter pays’ principle in cases of irresponsible water use or abuse. From the fiscal perspective, it urges cost recovery in all sub-sectors of water resource use: consumers should pay the full cost of what they use, and water delivery and management institutions should be financially self-sufficient. These imperatives must confront the traditional concept of water as a public good in Egypt.
Objectives of water resources development in EgyptTo support the socio-economic development of Egypt on the basis of sustainable resource use (surface water and groundwater), while protecting and restoring the natural environment. Specific policy objectives are:• the supply of drinking water for domestic uses and the provision of sanitation services...
on a cost recovery basis but taking into account the right to basic requirements of all people;• the supply of water for industrial purposes and the provision of sewage treatment facilities;• the supply of water for irrigation based on a participatory approach and cost recovery of operation
and maintenance;• the protection of the water system from pollution, based on a polluter-pays principle and the
restoration of water systems, in particular the ecological valuable areas (GOE, 2006: 4).
There is one fundamental priority in Egyptian water resource allocation, which is the basic human need for a drinking water supply. Islamic principles regarding equitable access to water, and charity in that regard, are a strong influence at all levels in Egyptian water management and distribution, from national policy to the widespread house-hold practice of making water available outside the front door for passers-by. Beyond the basic human need, policy does not accord higher priority to one use over another, emphasising instead that the decisive factor is ‘the social and economic value the water has for a particular use at a particular location’ (GOE, 2006: 7).
The overarching water resource management policy is in place, but an integrated policy for the drinking water and sanitation subsector has not yet been finalised. Proposals have been under preparation for some two years and are expected to be ready soon, leading to the drafting of a new Water Law. A number of key elements of policy for the subsector can already be identified, however.
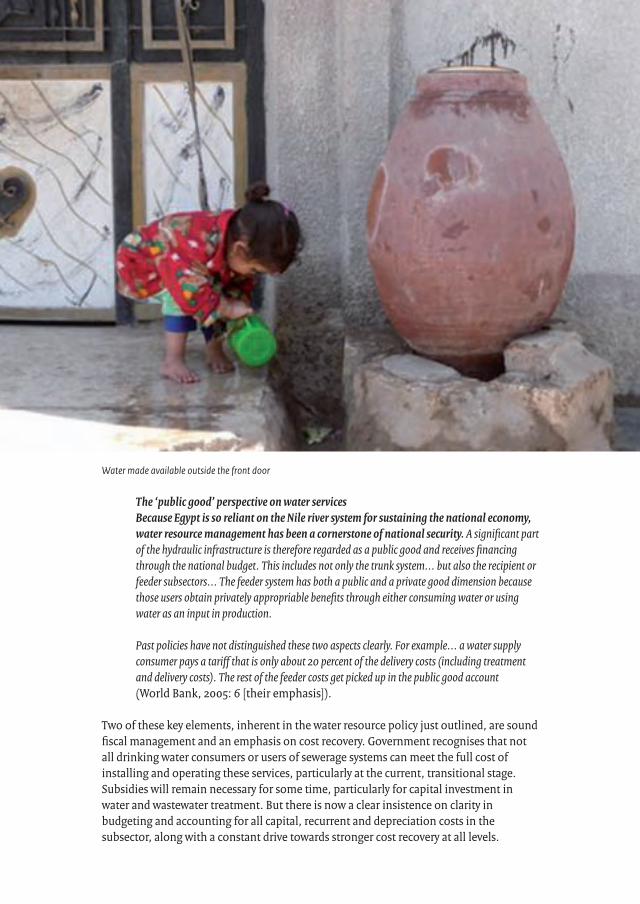
2 Programme context
| 42 |
The ‘public good’ perspective on water servicesBecause Egypt is so reliant on the Nile river system for sustaining the national economy, water resource management has been a cornerstone of national security. A significant part of the hydraulic infrastructure is therefore regarded as a public good and receives financing through the national budget. This includes not only the trunk system... but also the recipient or feeder subsectors... The feeder system has both a public and a private good dimension because those users obtain privately appropriable benefits through either consuming water or using water as an input in production.
Past policies have not distinguished these two aspects clearly. For example... a water supply consumer pays a tariff that is only about 20 percent of the delivery costs (including treatment and delivery costs). The rest of the feeder costs get picked up in the public good account (World Bank, 2005: 6 [their emphasis]).
Two of these key elements, inherent in the water resource policy just outlined, are sound fiscal management and an emphasis on cost recovery. Government recognises that not all drinking water consumers or users of sewerage systems can meet the full cost of installing and operating these services, particularly at the current, transitional stage. Subsidies will remain necessary for some time, particularly for capital investment in water and wastewater treatment. But there is now a clear insistence on clarity in budgeting and accounting for all capital, recurrent and depreciation costs in the subsector, along with a constant drive towards stronger cost recovery at all levels.
Water made available outside the front door
Drinking water supply and sanitation programme in Fayoum, Egypt, 1990-2009
| 43 |
This arises from concern in the Ministry of Finance about poor control of spending on drinking water and sanitation development and delivery, and about correspondingly exaggerated, and potentially unending, demands for subsidies from the central treasury.
This concern has led to much closer scrutiny of tariffs for drinking water and sanitation services, and the related question of affordability. But, despite the emphasis on cost recovery, Egypt has a long heritage of government reluctance to charge users the full cost of their drinking water, and continues to subsidise this basic need just as it subsidises the price of bread. With a flat rate per cubic metre, Cairo has one of the lowest domestic water tariffs of any large city in the world. Until late 2009, Egyptian water utilities were able to charge low-volume domestic users little more than a quarter of the full cost of their water supply, despite affordability studies that show that all but 2.6% of the rural population could pay a tariff of LE 0.75/m3 that would cover supply, operation and maintenance (O&M) of the system and part of the investment cost (Chemonics Egypt, 2009: 5). At the end of that year, an average tariff increase of 25% was announced, making full recovery of O&M a realistic prospect for companies like FADWASC.
National policy for the management and delivery of drinking water and sanitation services in each governorate has passed through three phases during the period under review. In the early 1990s, a variety of local utilities were responsible for water supply and for wastewater treatment, where there was any. As is noted in section 3.3.2 below, it was decided in 1995 to integrate these services under Economic General Authorities in seven governorates, including Fayoum. This important evolution in institutional policy drew strongly on the experience and advice of FaDWaSP, which were used by the then Head of the Parliamentary Committee on Local Government, who was also head of the project’s Advisory Committee. This second institutional phase lasted a little under ten years and was replaced in 2004 by an evolving twin emphasis on corporatisa-tion and regulation. Current institutional policy for the subsector is based on the belief that drinking water and sanitation services are more effectively and efficiently delivered by parastatal entities that are required to function much like private companies. Their private sector characteristics and obligations are qualified by the public service nature of their operations, which means that they continue to be owned by the state and that their performance is monitored and regulated by an independent state agency.
One area of uncertainty that emerging water and sanitation policy will have to resolve concerns sewerage services to small settlements, where the cost of conventional sewer reticulation to distant wastewater treatment plants may be very high. Should the responsible agencies commit themselves to such conventional sewerage connections for 100% of the rural population, or should there be explicit policy recognition that different types of location will receive different types of service? Various approaches are being explored in Fayoum (section 4.3).
The Ministry of Water Resources and Irrigation (MWRI) is central to the institutional framework for water management in Egypt and has overall responsibility for implemen-
2 Programme context
| 44 |
tation of the National Water Resources Plan. For drinking water and sanitation, the Ministry of Housing, Utilities and Urban Development (MHUUD) has the lead responsi-bility, although (as will be shown below) it has outsourced the delivery and regulatory functions and has no water and sanitation department itself. The Ministry of Finance has the all- important role of supplying the subsidies on which the drinking water and sanitation subsector continues to depend, while the Ministry of Economic Development has the related role of overall national investment planning. Most capital finance for water and sanitation is provided through the National Organisation for Potable Water and Sanitary Drainage (NOPWASD, which falls under MHUUD – see below). The broader environmental health factors influencing the impact of water and sanitation programmes are the responsibility of the Ministry of Health and Population, while the Ministry of Local Development (MOLD) is responsible for the local government structures whose roles in rural water and sanitation have recently been adjusted (section 4.4.2 below). Interministerial co-ordination is now the responsibility of the National Water Council, chaired by the Prime Minister but so far meeting only infrequently.
Egypt is divided into 29 governorates, of which Fayoum is one. Many ministries have offices in the governorates, but the overall institutional framework at this level reflects the still strong centralisation of Egyptian government structures. Current proposals to revise the law on local administration include the decentralisation of certain functions, including urban population policy and the management of subsidised bakeries. The tentative nature of these initiatives shows the continuing policy resistance to more significant decentralisation, let alone real devolution. Meanwhile, the governor is the personal representative of the President, and functions as an important channel of political power through which conventional administrative, planning and implemen-tation arrangements can sometimes be bypassed. Conversely, the governor often makes himself directly available to hear citizens’ complaints and concerns, enabling them to sidestep the often dysfunctional bureaucracy at local levels. Effective and efficient delivery of drinking and water sanitation services, in Fayoum or elsewhere, requires strong working relations between the responsible agency and the governor.
As part of the new emphasis on corporatisation and regulation mentioned above, presidential decree 135 of 2004 established a national Holding Company for Water and Wastewater. Presidential decree 136 of the same year established the Egyptian Water and Wastewater Regulatory Authority (EWRA), although that body only began operations in 2007 (section 4.4.3).
The Economic General Authorities in the subsector, such as that for Fayoum, became subsidiaries of the Holding Company, as did various other water and sanitation utilities around the country. So far 23 such subsidiary companies have been established, while three remaining utilities still have to be transferred to company status. These subsidia-ries are theoretically free to set their own tariffs and are expected ultimately to achieve complete financial self-sufficiency. They should begin by covering O&M costs, then be able to balance depreciation of their infrastructure with revenue, and ideally manage
Drinking water supply and sanitation programme in Fayoum, Egypt, 1990-2009
| 45 |
in future to raise and repay their own development finance for capital investments. In practice, however, tariffs must be approved by Cabinet, to which they are submitted by the parent Holding Company on the recommendation of the regulator (see below), and both the subsidiaries and the parent company were frustrated until recently by state reluctance to allow domestic water tariffs to rise anywhere close to cost recovery levels. Wastewater tariffs are set as a fixed percentage of the drinking water charge (35% in the case of Fayoum). As sewerage systems expand, this means that many companies are retreating further into deficit because of their expanded wastewater services. Higher salary, electricity and chemicals costs are also affecting companies’ balance sheets.
The establishment of the Holding Company (and, to a lesser extent, EWRA) has transformed the institutional context for the delivery of water supply and sanitation services. Standards for and control of O&M are increasingly centralised through the Holding Company, which is steadily intensifying its monitoring of each local utility’s performance (section 4.4.3) and can administer incentives and sanctions accordingly. At the same time, although individual utilities such as FADWASC are supposed to take increasing responsibility for planning of and investment in their infrastructure, they are currently still trying to keep up with high levels of central investment in new water and sanitation projects, which it is their responsibility to commission and operate. This is a challenging time of transition, during which FADWASC and its sister companies must not only work to meet growing demand for better service but must also revise their institutional and management arrangements to match the new dispensation.
2.7 TheNetherlands’policyandsupporttoruralwatersupplyandsanitation
In 1989, the Netherlands Ministry of Foreign Affairs produced its first development co-operation policy document on drinking water supply and sanitation facilities. The document strongly endorsed an integrated approach in which improvements in water supply are linked to improvements in sanitation, drainage, solid waste disposal and hygiene behaviour. Furthermore it emphasised the need for user participation, which was seen as an essential element in ensuring more appropriate technology choices, a greater sense of responsibility among users, and in the long run, the devolution of operation and maintenance tasks. The document underlined the importance of sustainability (MFAN, 1989a). In 1998 the policy document ‘Drinking water supply and sanitation’ was published. The central principle for drinking water and sanitation laid down in this document is to ensure the sustainability of water supply and sanitation facilities by designing, implementing and operating facilities which are desired by and can be managed or co-managed by the users themselves (MFAN, 1998). The focus of Dutch support in the 1990s was on rural areas.
2 Programme context
| 46 |
Since the end of the 1990s, the Netherlands has been promoting a sector-wide approach to development co-operation, including its support for water supply and sanitation facilities. This implied a move away from a traditional, bilateral, project-based approach to a multi-donor, sector-wide strategy (MFAN, 2002). In 2004, the Minister for Development Co-operation made a commitment to contribute to Millennium Development Goal 7 – to ensure environmental sustainability – by providing sustainable access to safe drinking water and basic sanitation for an additional 50 million people by 2015 (MFAN, 2005).
In a number of respects the Netherlands policy did not apply to the situation in Egypt. The concept of user participation in (co-) management is only partly relevant to the Egyptian context where higher living standards and technically sophisticated arrange-ments obviate the role users in other partner countries, particularly in rural areas, play in supplying water through more basic localised systems. The Netherlands’ efforts to promote a sector-wide approach to development focused more on certain low income countries selected for long-term development co-operation. These did not include Egypt, which is a middle income country. The UN definition of improved water sources includes public standpipes, to which the majority of the population in Fayoum already had access when the Fayoum Drinking Water Supply and Sanitation Project started in 1990. Yet, as this report shows, many aspects of the water supply and sanitation services were and to some extent still are inadequate, seriously affecting the living standards of the population.
The Netherlands first became involved in Egypt’s drinking water and sanitation sector in 1977 when it approved a grant of EUR 1.13 million to the Alexandria Water General Authority for procurement of pumps and related parts. For the next 13 years support to the sector was continued, mostly in the form of programme aid, which totalled EUR 18.15 million or 40% of total disbursement to the water sector in Egypt. Programme aid was phased out in the early 1990s when Egypt’s foreign currency position improved substantially and the Netherlands became increasingly aware of the need for technical assistance to address the sector’s institutional weaknesses. Ultimately, total hardware and input supply funding amounted to EUR 32.9 million (IOB, 1998).
The identification and formulation of follow up projects proved difficult. Over the years, Egyptian sector authorities resisted the suggestion that they could benefit from technical assistance and were reluctant to finance external consultants. Eventually agreement was reached in 1990 on the funding of two major technical assistance projects: the Alexandria Water General Authority Maintenance Project (AMP) and the Fayoum Drinking Water and Sanitation Project. The two projects had different backgrounds. The AMP was a spinoff of the massive AWGA import support programme. FaDWaSP was originally conceived as part of a Fayoum Rural Development Project. In time it was reformulated into an autonomous project. The thrust of both projects was to strengthen the institutional performance of the recipient organisations through on-the-job training, technical studies and advice. The Netherlands also funded a
Drinking water supply and sanitation programme in Fayoum, Egypt, 1990-2009
| 47 |
NOPWASD Management Training Project providing technical assistance to support the Cairo Training Centre in developing and introducing a set of management level modules for drinking water and sanitation utility staff. The AMP had a relatively narrow scope of work focusing on water treatment plant operation and maintenance practices. The Fayoum project was a much more intensive effort to address a broad range of technical, financial and managerial constraints affecting the performance of Fayoum’s water company, El Azab. This project was extended four times and is currently in its fifth phase, planned up to 2011.
The Netherlands Embassy has played and continues to play an active role in policy dialogue between donors and the Government of Egypt on water sector policy and institutional reform, aiming at an adequate framework and planning for the develop-ment of the sector. Donor support for the sector is provided through project funding, except for the European Commission. The European Commission is supporting a policy-based budget support programme addressing policy-related benchmarks involving MWRI, MHUUD and the Ministry of Finance. These benchmarks strongly relate to the results of project activities, including those funded by the Netherlands. The EU has opted for sectoral budget support, as other donors were considered to be complementary with their more focused/earmarked institutional support to the reform process, including technical assistance. The EU’s assessment of the enabling environment for sectoral budget support is based on its own analysis (e.g. reform process ongoing, water sector considered crucial for Egypt, macro-economic and political environment improving and donors with relevant, policy oriented comple-mentary activities within the sector).
In line with the Dutch focus on selected low income partner countries, the Netherlands-Egypt development co-operation policy was to phase out development support to the water sector in Egypt. One of the consequences was a two year gap before the start of Phase V of the Fayoum Drinking Water and Sanitation Project. However, in light of the progress in the drinking water and sanitation sector, particularly through the 2004 presidential decree that created the Holding Company for Water and Wastewater, Dutch support was extended for five years. For the coming years support will continue to be provided in the context of integrated water resource management and the institutional experience in drinking water supply and sanitation in Fayoum governorate.
The Fayoum Drinking Water and Sanitation Project, 1990-2009
3
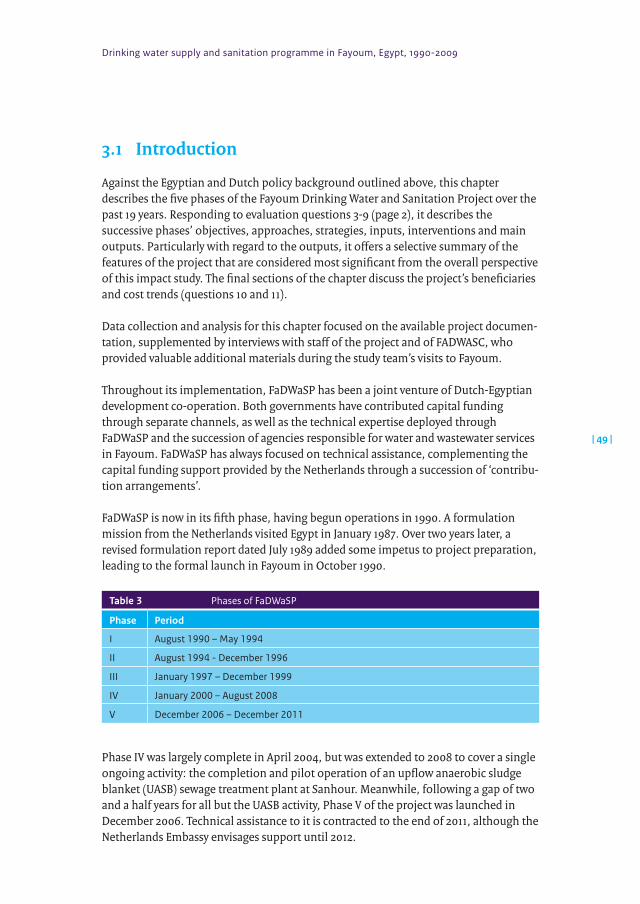
Drinking water supply and sanitation programme in Fayoum, Egypt, 1990-2009
| 49 |
3.1 Introduction
Against the Egyptian and Dutch policy background outlined above, this chapter describes the five phases of the Fayoum Drinking Water and Sanitation Project over the past 19 years. Responding to evaluation questions 3-9 (page 2), it describes the successive phases’ objectives, approaches, strategies, inputs, interventions and main outputs. Particularly with regard to the outputs, it offers a selective summary of the features of the project that are considered most significant from the overall perspective of this impact study. The final sections of the chapter discuss the project’s beneficiaries and cost trends (questions 10 and 11).
Data collection and analysis for this chapter focused on the available project documen-tation, supplemented by interviews with staff of the project and of FADWASC, who provided valuable additional materials during the study team’s visits to Fayoum.
Throughout its implementation, FaDWaSP has been a joint venture of Dutch-Egyptian development co-operation. Both governments have contributed capital funding through separate channels, as well as the technical expertise deployed through FaDWaSP and the succession of agencies responsible for water and wastewater services in Fayoum. FaDWaSP has always focused on technical assistance, complementing the capital funding support provided by the Netherlands through a succession of ‘contribu-tion arrangements’.
FaDWaSP is now in its fifth phase, having begun operations in 1990. A formulation mission from the Netherlands visited Egypt in January 1987. Over two years later, a revised formulation report dated July 1989 added some impetus to project preparation, leading to the formal launch in Fayoum in October 1990.
Table 3 Phases of FaDWaSP
Phase Period
I August 1990 – May 1994
II August 1994 - December 1996
III January 1997 – December 1999
IV January 2000 – August 2008
V December 2006 – December 2011
Phase IV was largely complete in April 2004, but was extended to 2008 to cover a single ongoing activity: the completion and pilot operation of an upflow anaerobic sludge blanket (UASB) sewage treatment plant at Sanhour. Meanwhile, following a gap of two and a half years for all but the UASB activity, Phase V of the project was launched in December 2006. Technical assistance to it is contracted to the end of 2011, although the Netherlands Embassy envisages support until 2012.
3 The Fayoum Drinking Water and Sanitation Project, 1990-2009
| 50 |
3.2 PhaseI,1990-1994
3.2.1 ObjectivesWhen FaDWaSP was appraised in October 1989, the long-term objectives for what was then envisaged as the first phase of a five year intervention were the provision of safe drinking water to the entire population of Fayoum governorate and the purification of wastewater in order to improve general public health. An additional long-term objective was to strengthen institutional capacity in the drinking water and sanitation sector. The short-term objectives of Phase I were:
• provision of safe drinking water to 110 villages;• to launch improved sanitation, notably by testing whether anaerobic purification
techniques were feasible in local conditions;• institutional strengthening of the Al Azab waterworks , which was the initial
institutional home of the project in Fayoum, responsible for water supplies through-out the governorate except in Fayoum City. This objective was linked to enhanced maintenance, planning and implementation procedures for the water supply network (GON, 1989).
Later, nine specific objectives were set out in the plan of operations for this phase. These included:
• support to the Al Azab waterworks to enable it to upgrade its technical and financial performance;
• preparation of a water supply master plan for the rural areas of the governorate, covering the period to 2020;
• preparation of a wastewater master plan for the entire governorate, excluding Fayoum City;
• feasibility studies for sewerage projects for one district town of about 40,000 people and a number of smaller villages with a total population of about 40,000;
• organisational development support for Al Azab waterworks and related organisations (FaDWaSP, 1992b).
3.2.2 ApproachandactivitiesAs its objectives imply, Phase I of FaDWaSP had a three-pronged approach. It supported the construction of new water and sanitation infrastructure. It began the long process of institution building in Fayoum governorate, focusing at that stage on the El Azab waterworks, which was responsible for water supplies. Its third field of work is that for which it is now most remembered: developing a master plan for water and sanitation. The project was thus attempting to tackle the physical and institutional deficits in the local water and sanitation sector and to plan for the medium term.
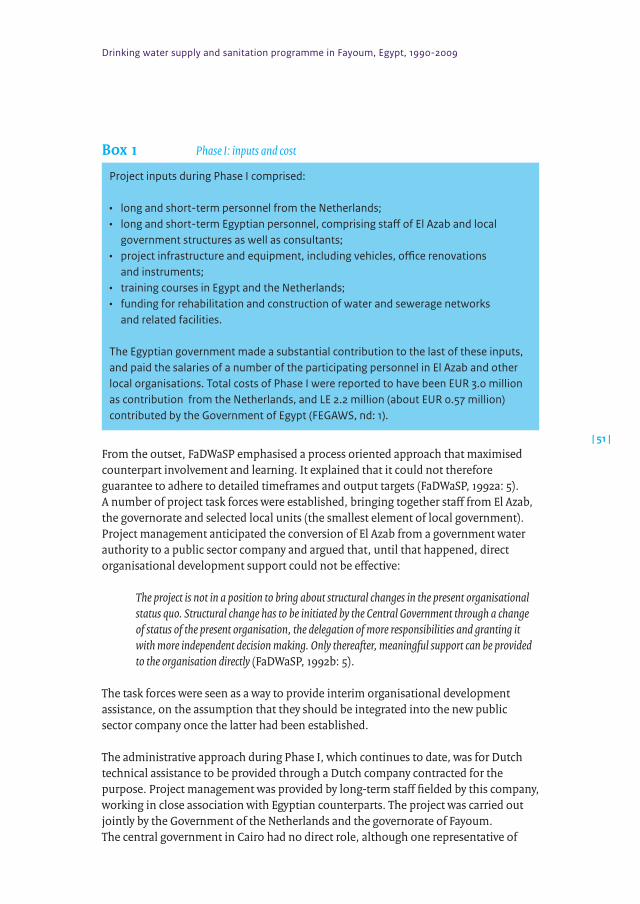
Drinking water supply and sanitation programme in Fayoum, Egypt, 1990-2009
| 51 |
Box1 Phase I: inputs and cost
Project inputs during Phase I comprised:
• long and short-term personnel from the Netherlands;• long and short-term Egyptian personnel, comprising staff of El Azab and local
government structures as well as consultants;• project infrastructure and equipment, including vehicles, office renovations
and instruments;• training courses in Egypt and the Netherlands;• funding for rehabilitation and construction of water and sewerage networks
and related facilities.
The Egyptian government made a substantial contribution to the last of these inputs, and paid the salaries of a number of the participating personnel in El Azab and other local organisations. Total costs of Phase I were reported to have been EUR 3.0 million as contribution from the Netherlands, and LE 2.2 million (about EUR 0.57 million) contributed by the Government of Egypt (FEGAWS, nd: 1).
From the outset, FaDWaSP emphasised a process oriented approach that maximised counterpart involvement and learning. It explained that it could not therefore guarantee to adhere to detailed timeframes and output targets (FaDWaSP, 1992a: 5). A number of project task forces were established, bringing together staff from El Azab, the governorate and selected local units (the smallest element of local government). Project management anticipated the conversion of El Azab from a government water authority to a public sector company and argued that, until that happened, direct organisational development support could not be effective:
The project is not in a position to bring about structural changes in the present organisational status quo. Structural change has to be initiated by the Central Government through a change of status of the present organisation, the delegation of more responsibilities and granting it with more independent decision making. Only thereafter, meaningful support can be provided to the organisation directly (FaDWaSP, 1992b: 5).
The task forces were seen as a way to provide interim organisational development assistance, on the assumption that they should be integrated into the new public sector company once the latter had been established.
The administrative approach during Phase I, which continues to date, was for Dutch technical assistance to be provided through a Dutch company contracted for the purpose. Project management was provided by long-term staff fielded by this company, working in close association with Egyptian counterparts. The project was carried out jointly by the Government of the Netherlands and the governorate of Fayoum. The central government in Cairo had no direct role, although one representative of
3 The Fayoum Drinking Water and Sanitation Project, 1990-2009
| 52 |
the National Organisation for Potable Water and Sanitary Drainage sat on the project’s Advisory Committee (FaDWaSP, 2000a: 14).
The first year of Phase I was described as a year ‘of ups and downs, characterised by administrative bottlenecks’. The project reported that it ‘got well on its feet in the second year, from September 1991 onwards’, when it began work on the basis of a plan of operations that had been drawn up in July (FaDWaSP, 1992: 5). Activities included the rehabilitation of selected pipelines, the expansion and renovation of operating infrastructure at El Azab and pilot offices around the governorate; and preparation of the master plan for water and sanitation in the governorate up to 2020. The purpose of the master plan, which was taken through preliminary, draft and final phases, was to:
• propose investment programmes for the development of water and sanitation infrastructure;
• set out institutional capacity-building programmes;• design awareness-raising activities on the health and hygiene aspects of water
and sanitation (FaDWaSP, 1992: 6).
For preparation of the master plan, a major effort was undertaken to gather the required data, which involved extensive field surveys in the governorate as well as archive searches.
Staff training was another major activity, covering the technical, financial and admini-strative aspects of operating water and sanitation utilities.
The need to improve El Azab’s revenues from its water supply service was identified as a major priority during Phase I, and pilot work was done to this end. It included setting up a customer database in a pilot markaz, establishing an improved water meter management system, developing a computerised billing system and improving meter reading and fee collection systems.
A range of technical activities were undertaken to support the rehabilitation and further development of the water supply network. These included continued mapping of pipelines, measurements of flow and pressure, hydraulic evaluation and computer modelling of the system, leak detection, water demand studies and a public tap inventory.
3.2.3 MainoutputsThe key achievement of Phase I was the Master Plan for Drinking Water Supply and Waste Water that the project produced in October 1993 (FaDWaSP, 1993c). As noted above, this master plan continued to guide the development of water and sanitation services in Fayoum governorate until recently.
Drinking water supply and sanitation programme in Fayoum, Egypt, 1990-2009
| 53 |
Another important achievement was the establishment of the Fayoum Sanitation Department, covering Fayoum City.
There were also significant infrastructural achievements during Phase I, notably in the rehabilitation of water supply networks.
3.3 PhaseII,1994-1996
3.3.1 Objectives
The general objective of FaDWS is to contribute to improved rural health through the improvement of water supply and sanitation conditions in the rural areas of Fayoum. This objective is realised through the execution of a programme which provides technical and financial assistance to El Azab Waterworks of Fayoum and to the Fayoum Sanitation Department (FaDWaSP, 1993b: 1).
Various administrative and implementation delays led to the extension of Phase I until May 1994. Meanwhile, a plan of operations for Phase II had been completed in November 1993, and a monitoring mission gave a favourable verdict on Phase I in February of the following year. The appraisal document was somewhat more modest about the long-term objectives for Phase II than its predecessor had been about Phase I. It referred to the achievement of an improved, continuous domestic water supply to ‘a larger group of residents of rural Fayoum’ as well as improved availability of sanitation facilities. This was intended to lead to improved health conditions among the population, as well as longer term environmental benefits due to more sustainable water use and purification of wastewater. Three short-term objectives were specified:
• support for the El Azab Water Works in the transition to a more autonomous business structure and more efficient business practice;
• the launch of the Fayoum Sanitation Department;• investments in the expansion and upgrading of the physical infrastructure for
water supplies and sanitation according to the Master Plan prepared during Phase I (GON, 1994).
3.3.2 ApproachandactivitiesWith the master plan now available, the core approach of Phase II was to assist the governorate in starting to implement it. ‘The project consultants will act as a Governorate advisor for the implementation of (parts of ) the master plan’ (FaDWaSP, 1993b: 2). Although support for physical expansion of the water and sewerage systems was set to continue, the main focus of Phase II’s approach was institutional.
3 The Fayoum Drinking Water and Sanitation Project, 1990-2009
| 54 |
The approach is based on the concept of interdependence between institutional development, organisational development and performance improvement (including management improvement) (FaDWaSP, 1994a: 2).
The top priority for the project will be the continuation of the technical assistance to El Azab and the FSD [Fayoum Sanitation Department]. For El Azab increased autonomy and performance improvement will be pursued. Important aspects in the support programme are: operation and maintenance, cost recovery, reduction of water losses, project cycle development (planning, design and execution), customer services and organisational development (FaDWaSP, 1993b: 3).
The project’s approach to its institutional challenges had to be revised following presidential decree 281 in 1995, which established FEGAWS and six other Economic General Authorities for drinking water supply and sanitation elsewhere in Egypt. However, the creation of these Economic General Authorities derived in part from experience in Fayoum, whose Secretary General at the time could draw on the institu-tional experience of FaDWaSP in his recommendations to government as Head of the Parliamentary Committee on Local Government. These Authorities were required to raise their own investment funds and to cover their own operation and maintenance costs. This meant accelerating some aspects of the master plan drawn up in Phase I, and deviating from others. For example, the plan envisaged achieving cost recovery in water supply by 2000, but the presidential decree required FEGAWS to operate like that from the start. The master plan proposed separate organisations for water supply and sanitation, but the decree integrated the two functions.
The physical construction works were intended to complement the institution building approach:
Project implementation funds should be used selectively but strategically mainly within the framework of the TA programme (Ibid.: 3).
Phase II also saw new emphasis on sanitation activities, corresponding to the emphasis given to them in the master plan. The project’s approach emphasised the need for low cost technologies and for a major increase in coverage and treatment capacity. Community involvement remained a key aspect of the approach, and the plan of operations envisaged the launch of a third component, the Community Services Unit, for this purpose.
The experience of FaDWS Phase I has taught us that the health and hygiene message to the population should be provided in an integrated way. Information to the communities should be linked directly to tangible, physical improvements. Those improvements are not possible without an improvement in the institutional set-up of the water and wastewater sector.
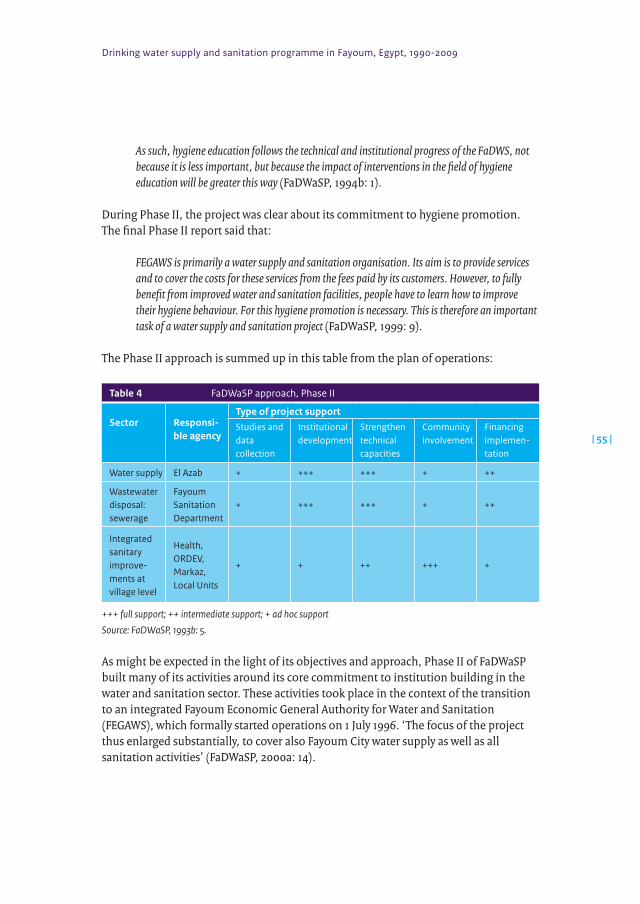
Drinking water supply and sanitation programme in Fayoum, Egypt, 1990-2009
| 55 |
As such, hygiene education follows the technical and institutional progress of the FaDWS, not because it is less important, but because the impact of interventions in the field of hygiene education will be greater this way (FaDWaSP, 1994b: 1).
During Phase II, the project was clear about its commitment to hygiene promotion. The final Phase II report said that:
FEGAWS is primarily a water supply and sanitation organisation. Its aim is to provide services and to cover the costs for these services from the fees paid by its customers. However, to fully benefit from improved water and sanitation facilities, people have to learn how to improve their hygiene behaviour. For this hygiene promotion is necessary. This is therefore an important task of a water supply and sanitation project (FaDWaSP, 1999: 9).
The Phase II approach is summed up in this table from the plan of operations:
Table 4 FaDWaSP approach, Phase II
Sector Responsi-ble agency
Type of project supportStudies and data collection
Institutional development
Strengthen technical capacities
Community involvement
Financing implemen-tation
Water supply El Azab + +++ +++ + ++
Wastewater disposal: sewerage
Fayoum Sanitation Department
+ +++ +++ + ++
Integrated sanitary improve-ments at village level
Health, ORDEV, Markaz, Local Units
+ + ++ +++ +
+++ full support; ++ intermediate support; + ad hoc support
Source: FaDWaSP, 1993b: 5.
As might be expected in the light of its objectives and approach, Phase II of FaDWaSP built many of its activities around its core commitment to institution building in the water and sanitation sector. These activities took place in the context of the transition to an integrated Fayoum Economic General Authority for Water and Sanitation (FEGAWS), which formally started operations on 1 July 1996. ‘The focus of the project thus enlarged substantially, to cover also Fayoum City water supply as well as all sanitation activities’ (FaDWaSP, 2000a: 14).
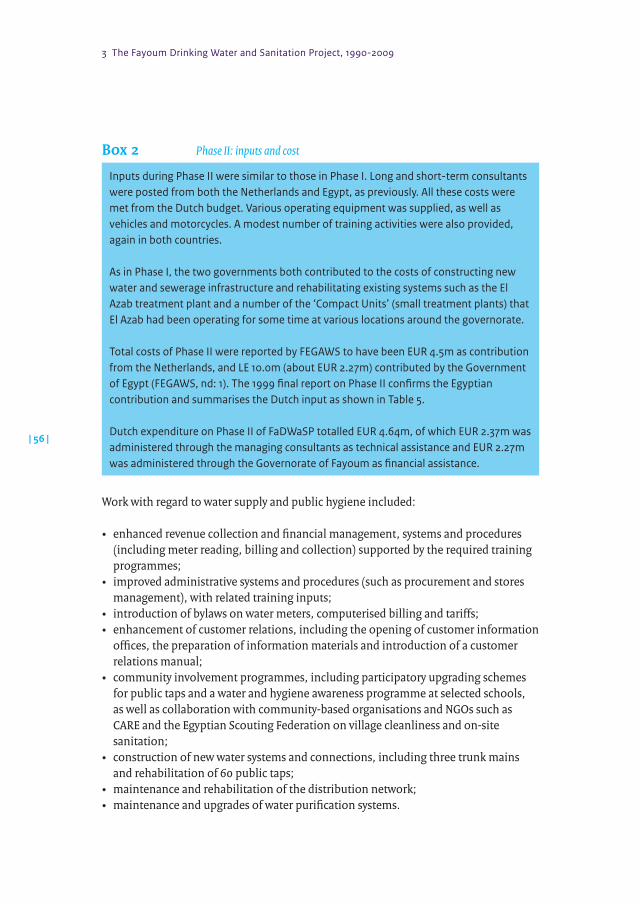
3 The Fayoum Drinking Water and Sanitation Project, 1990-2009
| 56 |
Box2 Phase II: inputs and cost
Inputs during Phase II were similar to those in Phase I. Long and short-term consultants were posted from both the Netherlands and Egypt, as previously. All these costs were met from the Dutch budget. Various operating equipment was supplied, as well as vehicles and motorcycles. A modest number of training activities were also provided, again in both countries.
As in Phase I, the two governments both contributed to the costs of constructing new water and sewerage infrastructure and rehabilitating existing systems such as the El Azab treatment plant and a number of the ‘Compact Units’ (small treatment plants) that El Azab had been operating for some time at various locations around the governorate.
Total costs of Phase II were reported by FEGAWS to have been EUR 4.5m as contribution from the Netherlands, and LE₤10.0m (about EUR 2.27m) contributed by the Government of Egypt (FEGAWS, nd: 1). The 1999 final report on Phase II confirms the Egyptian contribution and summarises the Dutch input as shown in Table 5.
Dutch expenditure on Phase II of FaDWaSP totalled EUR 4.64m, of which EUR 2.37m was administered through the managing consultants as technical assistance and EUR 2.27m was administered through the Governorate of Fayoum as financial assistance.
Work with regard to water supply and public hygiene included:
• enhanced revenue collection and financial management, systems and procedures (including meter reading, billing and collection) supported by the required training programmes;
• improved administrative systems and procedures (such as procurement and stores management), with related training inputs;
• introduction of bylaws on water meters, computerised billing and tariffs;• enhancement of customer relations, including the opening of customer information
offices, the preparation of information materials and introduction of a customer relations manual;
• community involvement programmes, including participatory upgrading schemes for public taps and a water and hygiene awareness programme at selected schools, as well as collaboration with community-based organisations and NGOs such as CARE and the Egyptian Scouting Federation on village cleanliness and on-site sanitation;
• construction of new water systems and connections, including three trunk mains and rehabilitation of 60 public taps;
• maintenance and rehabilitation of the distribution network;• maintenance and upgrades of water purification systems.
Drinking water supply and sanitation programme in Fayoum, Egypt, 1990-2009
| 57 |
Sanitation activities included:
• organisational development to build up a Sanitation Operation and Maintenance Department within FEGAWS;
• introduction and monitoring of 30 pilot latrines;• construction of four new sewerage systems.
Dutch expenditure on Phase II of FaDWaSP totalled EUR 4.64m, of which EUR 2.37m was administered through the managing consultants as technical assistance and EUR 2.27m was administered through the Governorate of Fayoum as financial assistance.
Table 5 Dutch expenditure: FaDWaSP Phase II
Administered through managing consultants (‘Technical Assistance’) EUR
Staff (long and short term) 1,393,421
Project investments (vehicles, equipment etc.) 60,929
Capital investments (pipelines, plant etc.) 755,259
Operational costs 111,018
Training 48,495
Sub total 2,369,122
Administered through Governorate of Fayoum (‘Financial Assistance’)
Capital investments (water supply) 1,202,518
Capital investments (sanitation) 1,066,384
Sub total 2,268,902
Total 4,638,024
3.3.3 MainoutputsPhase II of FaDWaSP realised significant institutional achievements, building capacity for the management of water supply systems that was then absorbed into the new structure of FEGAWS. Much organisational development effort was devoted to the new agency, with understandably limited results at first. One of the major issues was the integration of the Fayoum City water department with the old El Azab structure, which had been responsible for the rest of the governorate. At the same time, the new structure threw up significant new challenges, not least the inclusion of sanitation. This ‘made the establishment of the economic general authority substantially more complicated, as the sanitation sub-sector is less developed [than] the water supply sub-sector. Especially the factor that sanitation does not generate adequate funds to cover its [operation and maintenance] costs, increases the burden for cost recovery of FEGAWS’ (FaDWaSP, 1999: 4).
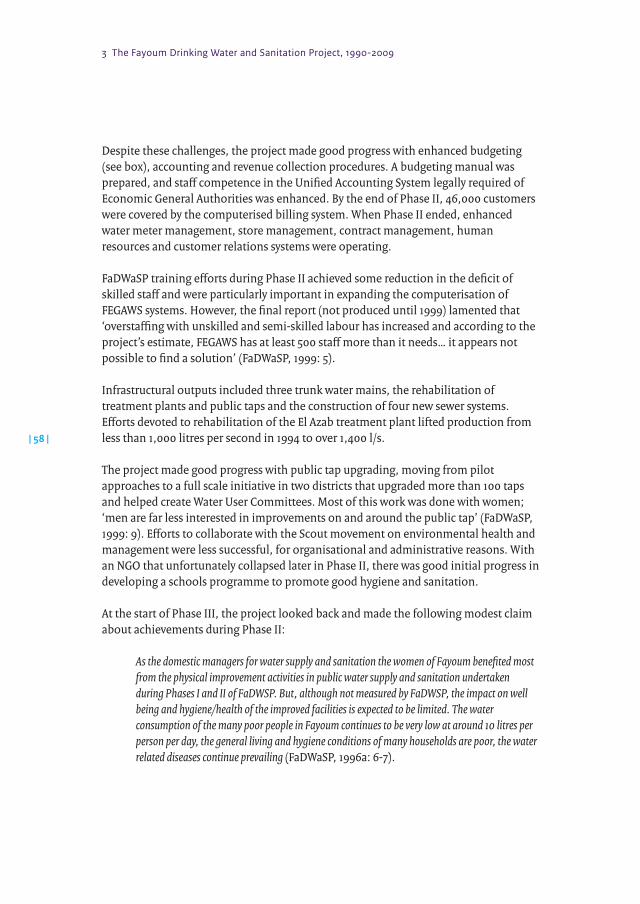
3 The Fayoum Drinking Water and Sanitation Project, 1990-2009
| 58 |
Despite these challenges, the project made good progress with enhanced budgeting (see box), accounting and revenue collection procedures. A budgeting manual was prepared, and staff competence in the Unified Accounting System legally required of Economic General Authorities was enhanced. By the end of Phase II, 46,000 customers were covered by the computerised billing system. When Phase II ended, enhanced water meter management, store management, contract management, human resources and customer relations systems were operating.
FaDWaSP training efforts during Phase II achieved some reduction in the deficit of skilled staff and were particularly important in expanding the computerisation of FEGAWS systems. However, the final report (not produced until 1999) lamented that ‘overstaffing with unskilled and semi-skilled labour has increased and according to the project’s estimate, FEGAWS has at least 500 staff more than it needs… it appears not possible to find a solution’ (FaDWaSP, 1999: 5).
Infrastructural outputs included three trunk water mains, the rehabilitation of treatment plants and public taps and the construction of four new sewer systems. Efforts devoted to rehabilitation of the El Azab treatment plant lifted production from less than 1,000 litres per second in 1994 to over 1,400 l/s.
The project made good progress with public tap upgrading, moving from pilot approaches to a full scale initiative in two districts that upgraded more than 100 taps and helped create Water User Committees. Most of this work was done with women; ‘men are far less interested in improvements on and around the public tap’ (FaDWaSP, 1999: 9). Efforts to collaborate with the Scout movement on environmental health and management were less successful, for organisational and administrative reasons. With an NGO that unfortunately collapsed later in Phase II, there was good initial progress in developing a schools programme to promote good hygiene and sanitation.
At the start of Phase III, the project looked back and made the following modest claim about achievements during Phase II:
As the domestic managers for water supply and sanitation the women of Fayoum benefited most from the physical improvement activities in public water supply and sanitation undertaken during Phases I and II of FaDWSP. But, although not measured by FaDWSP, the impact on well being and hygiene/health of the improved facilities is expected to be limited. The water consumption of the many poor people in Fayoum continues to be very low at around 10 litres per person per day, the general living and hygiene conditions of many households are poor, the water related diseases continue prevailing (FaDWaSP, 1996a: 6-7).
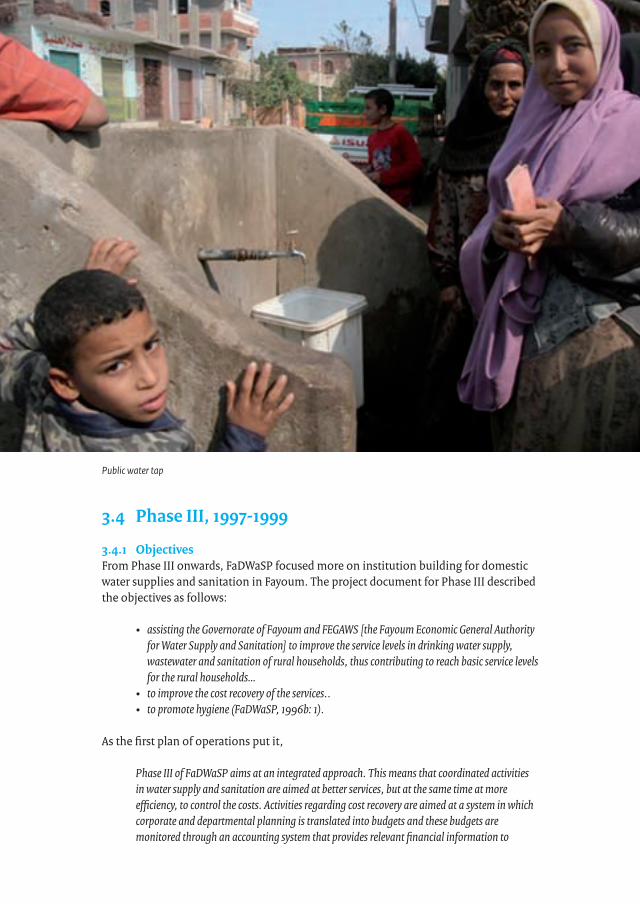
Drinking water supply and sanitation programme in Fayoum, Egypt, 1990-2009
| 59 |
3.4 PhaseIII,1997-1999
3.4.1 ObjectivesFrom Phase III onwards, FaDWaSP focused more on institution building for domestic water supplies and sanitation in Fayoum. The project document for Phase III described the objectives as follows:
• assisting the Governorate of Fayoum and FEGAWS [the Fayoum Economic General Authority for Water Supply and Sanitation] to improve the service levels in drinking water supply, wastewater and sanitation of rural households, thus contributing to reach basic service levels for the rural households…
• to improve the cost recovery of the services..• to promote hygiene (FaDWaSP, 1996b: 1).
As the first plan of operations put it,
Phase III of FaDWaSP aims at an integrated approach. This means that coordinated activities in water supply and sanitation are aimed at better services, but at the same time at more efficiency, to control the costs. Activities regarding cost recovery are aimed at a system in which corporate and departmental planning is translated into budgets and these budgets are monitored through an accounting system that provides relevant financial information to
Public water tap
3 The Fayoum Drinking Water and Sanitation Project, 1990-2009
| 60 |
technical managers, again to promote cost control. Hygiene promotion aims at improving the impact of the improved services and facilities through community involvement and education, combined with specific infrastructural interventions, e.g. public standposts, latrines, water supply and sanitary facilities at schools (FaDWaSP, 1996b: 1).
This Phase III plan of operations reiterated the overall aim of FaDWaSP, quoted in the box on page 34, which was proposed in the original project document for Phase I. It sets out three main tasks for the project on the basis of the aim. First, FEGAWS should be made more effective in fulfilling its water supply and sanitation mission. Secondly, FEGAWS should become more efficient in recovering its costs, by minimising those costs (without compromising its mission) and maximising its revenue. Thirdly, the project should strive to enhance the impact of its water and sanitation work by promoting hygiene among the target population.
3.4.2 ApproachandactivitiesInstitution building remained central to the project’s approach during Phase III. As pointed out above, there was a new scale, scope and urgency in the institutional challenge now that all activities and areas within the governorate had been integrated within the mandate of FEGAWS. The approach of FaDWaSP focused on building an integrated, cost effective, cost recovering organisation out of the various fragments that had operated previously. Part of this approach was to ensure that the new, efficient organisation operated on an appropriately decentralised basis, with field offices accessible to its customers.
During this phase, the role of women in the water and sanitation sector was actively recognised:
…women carry the prime responsibility for water, sanitation and hygiene in and around the home and thus have a vital stake in appropriate planning, maintenance and effective management (FaDWaSP, 1996a: 10).
There was also a more visible gender commitment in the project’s plans to support staff development in the new FEGAWS, ensuring that restructuring did not jeopardise the positions of existing female staff and that as many new local customer service and maintenance positions as possible would be allocated to women, ‘to improve the relation with the prime users of the water supply and sanitation facilities, the women’ (ibid.: 15).
Drinking water supply and sanitation programme in Fayoum, Egypt, 1990-2009
| 61 |
Box3 Phase III: inputs and cost
The Netherlands’ inputs to the project were classified as either technical assistance or financial assistance. As in the previous phases, Dutch and Egyptian personnel, full time and short term, were the core input made by FaDWaSP. Other inputs, as before, comprised training, transport, operating equipment and facilities for FEGAWS. Communications costs for the expanded customer relations function and the expenses of hygiene promotion activities were two other important inputs by the project. Financial assistance covered the expenses for rehabilitation and new construction, shared with the Government of Egypt, which contributed a large proportion of total construction costs.
Phase III of FaDWaSP incurred higher costs than its predecessors, even though it only operated for three years. Summary data provided by FEGAWS indicate total Dutch expenditure as EUR 5.7m, with the Egyptian government contributing the much higher amount of LE 43.7m (about EUR 11.9m)
Phase III’s approach to hygiene and public health had to take into account the approach of FEGAWS, which did not regard these issues as central to its mandate – even though it recognised that hygiene promotion meant more efficient water use and less water loss, as well as better co-operation from the general public with regard to maintenance. The project’s strategy was therefore to promote a multi-partner strategy in this field, involving the Department of Health, NGOs (including CARE and the Scouting move-ment) and CBOs (FaDWaSP, 1996a).
Following the institutional changes during Phase II, Phase III of FaDWaSP was implemented in collaboration with FEGAWS. As the final report of the phase put it, activities aimed ‘to equip FEGAWS with the tools to achieve cost recovery’ (FaDWaSP, 2000b: 6). To this end, much work was done during Phase III to enhance the organisa-tion’s financial management and related administrative procedures in such fields as computerised billing, procurement and stores management. Much detailed work was also done on human resources, such as a restructured organisational structure, grading system and job descriptions. There were many challenges here:
FEGAWS is to become a business-like organisation. This requires efficient operations and matching staff attitude. Achieving such a target is a long and difficult affair… it is still difficult to describe the exact duties of many workers. Moreover, all staff was previously employed as civil servant, with little or no regard for their output. In fact, very few have any appreciation for the overall performance of FEGAWS, whereas most are aware that avoiding mistakes is more important than showing initiative (FaDWaSP, 2000b: 9).
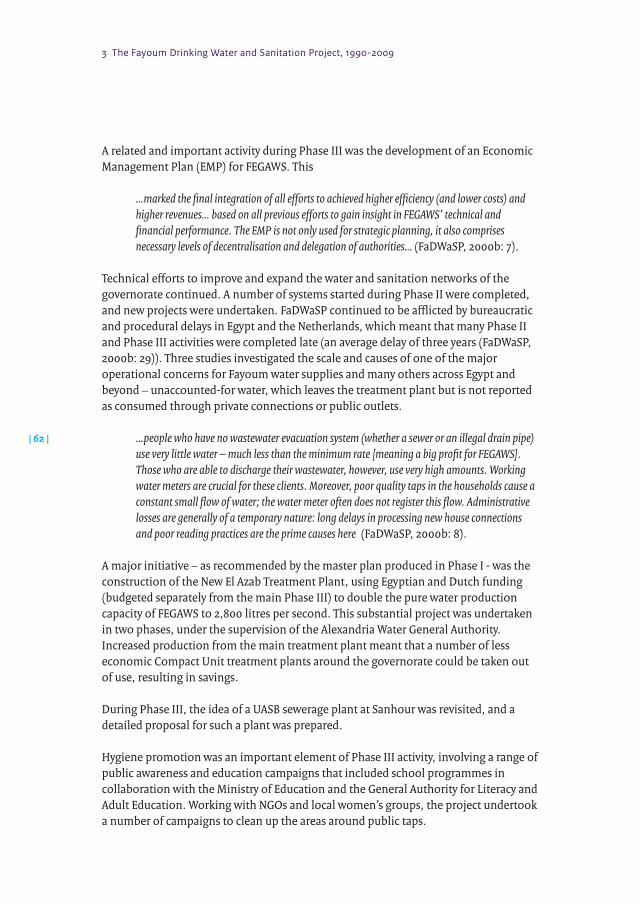
3 The Fayoum Drinking Water and Sanitation Project, 1990-2009
| 62 |
A related and important activity during Phase III was the development of an Economic Management Plan (EMP) for FEGAWS. This
…marked the final integration of all efforts to achieved higher efficiency (and lower costs) and higher revenues… based on all previous efforts to gain insight in FEGAWS’ technical and financial performance. The EMP is not only used for strategic planning, it also comprises necessary levels of decentralisation and delegation of authorities… (FaDWaSP, 2000b: 7).
Technical efforts to improve and expand the water and sanitation networks of the governorate continued. A number of systems started during Phase II were completed, and new projects were undertaken. FaDWaSP continued to be afflicted by bureaucratic and procedural delays in Egypt and the Netherlands, which meant that many Phase II and Phase III activities were completed late (an average delay of three years (FaDWaSP, 2000b: 29)). Three studies investigated the scale and causes of one of the major operational concerns for Fayoum water supplies and many others across Egypt and beyond – unaccounted-for water, which leaves the treatment plant but is not reported as consumed through private connections or public outlets.
…people who have no wastewater evacuation system (whether a sewer or an illegal drain pipe) use very little water – much less than the minimum rate [meaning a big profit for FEGAWS]. Those who are able to discharge their wastewater, however, use very high amounts. Working water meters are crucial for these clients. Moreover, poor quality taps in the households cause a constant small flow of water; the water meter often does not register this flow. Administrative losses are generally of a temporary nature: long delays in processing new house connections and poor reading practices are the prime causes here (FaDWaSP, 2000b: 8).
A major initiative – as recommended by the master plan produced in Phase I - was the construction of the New El Azab Treatment Plant, using Egyptian and Dutch funding (budgeted separately from the main Phase III) to double the pure water production capacity of FEGAWS to 2,800 litres per second. This substantial project was undertaken in two phases, under the supervision of the Alexandria Water General Authority. Increased production from the main treatment plant meant that a number of less economic Compact Unit treatment plants around the governorate could be taken out of use, resulting in savings.
During Phase III, the idea of a UASB sewerage plant at Sanhour was revisited, and a detailed proposal for such a plant was prepared.
Hygiene promotion was an important element of Phase III activity, involving a range of public awareness and education campaigns that included school programmes in collaboration with the Ministry of Education and the General Authority for Literacy and Adult Education. Working with NGOs and local women’s groups, the project undertook a number of campaigns to clean up the areas around public taps.
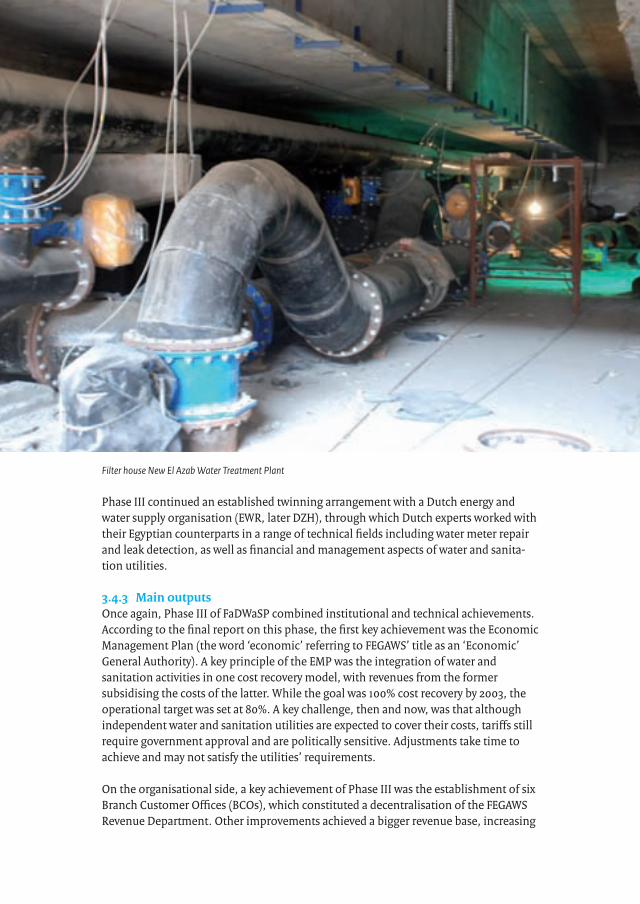
Drinking water supply and sanitation programme in Fayoum, Egypt, 1990-2009
| 63 |
Phase III continued an established twinning arrangement with a Dutch energy and water supply organisation (EWR, later DZH), through which Dutch experts worked with their Egyptian counterparts in a range of technical fields including water meter repair and leak detection, as well as financial and management aspects of water and sanita-tion utilities.
3.4.3 MainoutputsOnce again, Phase III of FaDWaSP combined institutional and technical achievements. According to the final report on this phase, the first key achievement was the Economic Management Plan (the word ‘economic’ referring to FEGAWS’ title as an ‘Economic’ General Authority). A key principle of the EMP was the integration of water and sanitation activities in one cost recovery model, with revenues from the former subsidising the costs of the latter. While the goal was 100% cost recovery by 2003, the operational target was set at 80%. A key challenge, then and now, was that although independent water and sanitation utilities are expected to cover their costs, tariffs still require government approval and are politically sensitive. Adjustments take time to achieve and may not satisfy the utilities’ requirements.
On the organisational side, a key achievement of Phase III was the establishment of six Branch Customer Offices (BCOs), which constituted a decentralisation of the FEGAWS Revenue Department. Other improvements achieved a bigger revenue base, increasing
Filter house New El Azab Water Treatment Plant
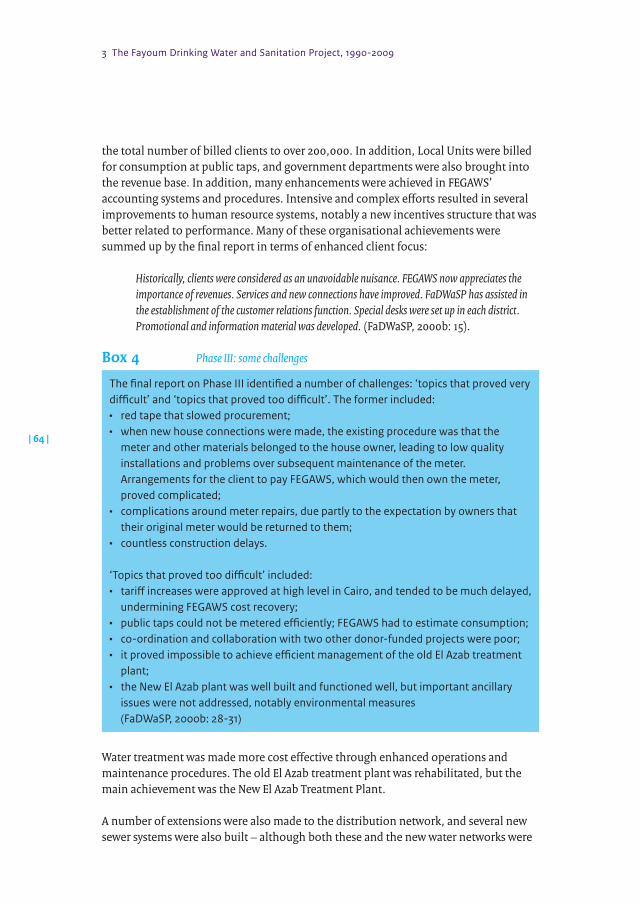
3 The Fayoum Drinking Water and Sanitation Project, 1990-2009
| 64 |
the total number of billed clients to over 200,000. In addition, Local Units were billed for consumption at public taps, and government departments were also brought into the revenue base. In addition, many enhancements were achieved in FEGAWS’ accounting systems and procedures. Intensive and complex efforts resulted in several improvements to human resource systems, notably a new incentives structure that was better related to performance. Many of these organisational achievements were summed up by the final report in terms of enhanced client focus:
Historically, clients were considered as an unavoidable nuisance. FEGAWS now appreciates the importance of revenues. Services and new connections have improved. FaDWaSP has assisted in the establishment of the customer relations function. Special desks were set up in each district. Promotional and information material was developed. (FaDWaSP, 2000b: 15).
Box4 Phase III: some challenges
The final report on Phase III identified a number of challenges: ‘topics that proved very difficult’ and ‘topics that proved too difficult’. The former included:• red tape that slowed procurement;• when new house connections were made, the existing procedure was that the
meter and other materials belonged to the house owner, leading to low quality installations and problems over subsequent maintenance of the meter. Arrangements for the client to pay FEGAWS, which would then own the meter, proved complicated;
• complications around meter repairs, due partly to the expectation by owners that their original meter would be returned to them;
• countless construction delays.
‘Topics that proved too difficult’ included:• tariff increases were approved at high level in Cairo, and tended to be much delayed,
undermining FEGAWS cost recovery;• public taps could not be metered efficiently; FEGAWS had to estimate consumption;• co-ordination and collaboration with two other donor-funded projects were poor;• it proved impossible to achieve efficient management of the old El Azab treatment
plant;• the New El Azab plant was well built and functioned well, but important ancillary
issues were not addressed, notably environmental measures (FaDWaSP, 2000b: 28-31)
Water treatment was made more cost effective through enhanced operations and maintenance procedures. The old El Azab treatment plant was rehabilitated, but the main achievement was the New El Azab Treatment Plant.
A number of extensions were also made to the distribution network, and several new sewer systems were also built – although both these and the new water networks were
Drinking water supply and sanitation programme in Fayoum, Egypt, 1990-2009
| 65 |
hampered by many construction delays. Another area of technical achievement was Phase III’s careful study of unaccounted-for water, leading inter alia to the hypothesis that a continuous supply at full pressure could be cheaper for the utility than intermit-tent supply at lower pressure – since lower pressure seemed to mean that leaks were not so efficiently reported and repaired.
There was less progress with regard to on-site sanitation (as opposed to off-site arrangements, which relate to household connections to sewers). FaDWaSP Phase III included campaigns to promote the construction of cheap latrines by the private sector, without subsidy but with FaDWaSP quality control. However, CARE appeared to be providing a kind of competition with latrines that were partially subsidised – but aimed only at the poorest of the poor. This discouraged people from applying for the FaDWaSP latrine scheme, even though many such people would not in fact have qualified for CARE support. Efforts to resolve this issue were unsuccessful, and the FaDWaSP latrine component was terminated.
Although there was considerable progress for some time with regard to hygiene promotion at schools, ‘in subsequent years the support of the Ministry [of Education] decreased, and the output of the programme was less satisfying’ (FaDWaSP, 2000b: 18). Other efforts involved promoting hygiene awareness through the literacy classes of the General Authority for Literacy and Adult Education. An impact survey found ‘that the objective to create awareness among teachers and students has been met, but that the behavioural changes lag behind’ (ibid.: 18).
3.5 PhaseIV,2000-2008
3.5.1 Objectives
The proposed Phase IV essentially aims to finalise the internal strengthening by rendering FEGAWS an autonomous and economically operated Authority (FaDWaSP, 2000: 6).
Phase IV of FaDWaSP was described as ‘essentially a wrapping up phase’ (GON, 2001: 1) and the project as ‘essentially an institutional development project’ (GON, 2000: 4). At appraisal, the overall objective of Phase IV was described as ‘to further assist FEGAWS to provide water and sanitation services to the population in Fayoum Governorate adhering to relevant health and environmental standards, whereby most of the operation and maintenance costs are covered by revenues’ (GON, 2000: 2). The specific objectives of Phase IV were to:
• improve service delivery for water and sanitation, such that a continuous flow of safe drinking water for 95% of the clients will be achieved by the middle of 2003, whether through house connections, or through public taps, and 25% of the households will be connected to a wastewater facility by June 2004;
3 The Fayoum Drinking Water and Sanitation Project, 1990-2009
| 66 |
• enhance cost recovery of operation and maintenance costs to at least 80% in 2003, and to decrease the difference between costs and revenues to less than LE 5 million (GON, 2000: 3).
The project document for Phase IV repeated these statements, and pointed out the linkages between the two specific objectives: in order for cost recovery to be achieved through sufficient sales of water and sanitation services, new water and sewer connec-tions would be vital (FaDWaSP, 2000a: 28). The objectives of Phase IV were thus fully integrated with the Economic Management Plan that had been drawn up for FEGAWS during Phase III (section 3.4.2; see GOF, 2004: 16).
As noted in section 3.1, Phase IV, which was envisaged as the final phase of FaDWaSP, was repeatedly extended to allow for delays in the construction of the UASB Demonstration Project in Sanhour. From 2005 onwards, this was the main focus of Phase IV, which overlapped with the fifth (and final?) phase that had by then been agreed. All other activities of Phase IV were terminated in 2004.
3.5.2 ApproachandactivitiesThe approach of Phase IV remained broadly in line with that of earlier phases, and continued to be guided by the master plan that had been prepared during Phase I. The context had obviously changed in some important ways, however. One key issue was the need for FEGAWS to operate efficiently and cover its costs, in accordance with its Economic Management Plan (EMP), described as the articulation of the project’s strategy for the organisation. Cost reduction included better cost accounting, accoun-tability of managers, savings in energy and chemicals, and a reduction of unaccounted-for water (FaDWaSP, 2004: 2). Another important change was that the New El Azab Treatment Plant had greatly increased the organisation’s production of purified water. Supply now exceeded metered demand (see box below). At the organisational level, the two fundamental priorities were to keep on helping FEGAWS to reduce its costs and increase its revenues. At the technical level, since this was expected to be the last phase of FaDWaSP, no Dutch contribution to the construction of major water or sewer lines was planned, although investment in the Sanhour UASB facility was justified in terms of its demonstration effect.
FaDWaSP has been fully integrated into FEGAWS and many of its activities are jointly executed with FEGAWS or in support of specific FEGAWS activities. These project activities build on a number of management tools developed during the previous phases and aim at developing an efficient target-driven organisation. The Economic Management Plan (EMP) provid[es] detailed targets in the articulation of this strategy and will be the vehicle through which project activities will be channelled. FaDWaSP will support FEGAWS to develop the EMP into a full[y]-fledged Management Information System and to bring about the necessary organisational changes such as decentralisation and staff mobility (FaDWaSP 2004: 1).
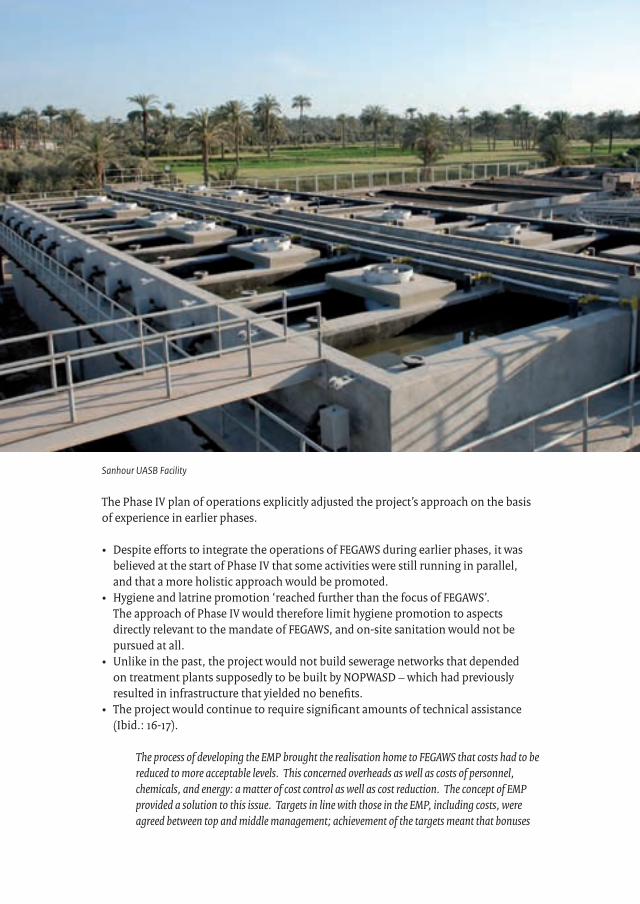
Drinking water supply and sanitation programme in Fayoum, Egypt, 1990-2009
| 67 |
The Phase IV plan of operations explicitly adjusted the project’s approach on the basis of experience in earlier phases.
• Despite efforts to integrate the operations of FEGAWS during earlier phases, it was believed at the start of Phase IV that some activities were still running in parallel, and that a more holistic approach would be promoted.
• Hygiene and latrine promotion ‘reached further than the focus of FEGAWS’. The approach of Phase IV would therefore limit hygiene promotion to aspects directly relevant to the mandate of FEGAWS, and on-site sanitation would not be pursued at all.
• Unlike in the past, the project would not build sewerage networks that depended on treatment plants supposedly to be built by NOPWASD – which had previously resulted in infrastructure that yielded no benefits.
• The project would continue to require significant amounts of technical assistance (Ibid.: 16-17).
The process of developing the EMP brought the realisation home to FEGAWS that costs had to be reduced to more acceptable levels. This concerned overheads as well as costs of personnel, chemicals, and energy: a matter of cost control as well as cost reduction. The concept of EMP provided a solution to this issue. Targets in line with those in the EMP, including costs, were agreed between top and middle management; achievement of the targets meant that bonuses
Sanhour UASB Facility
3 The Fayoum Drinking Water and Sanitation Project, 1990-2009
| 68 |
in the form of performance-related incentives were paid. Strategic reflections on cost reductions and efficiency increases are part and parcel of this approach… The operation of the New El Azab Treatment Plant (NEAT) has changed the rules of the games completely for FEGAWS. For the first time FEGAWS produced more water than it could supply to its clients and was forced to market its house connections and to improve the performance of the distribution network. It was also anticipated that the same process would repeat itself when the sanitation projects under construction would be put into operation (FaDWaSP, 2008).
Phase IV also attempted a stronger emphasis on environmental issues, noting that appropriate environmental standards were usually not met, especially with regard to sanitation. The project’s approach was to produce environmental management plans for all water and sewage treatment plants – although the plan of operations stated that the costs of implementing such plans would be prohibitively high and would not be budgeted by FaDWaSP.
Two aspects of the project’s approach were continued from earlier phases. First, the Project Advisory Committee went on with its periodic meetings, bringing together representatives of the governorate, the Netherlands Embassy and FEGAWS. Secondly, the external Monitoring Commission continued to visit the project each year.
Box5 Phase IV: inputs and cost
Inputs to Phase IV were broadly similar to those of earlier phases, again classified into technical assistance (by Dutch and Egyptian experts) and financial assistance. The latter now included substantial Dutch support for construction of the Sanhour UASB facility. A variety of materials and equipment were supplied for operation of the technical activities and for training programmes. It was envisaged that project expenditure would gradually be reduced over the period 2000 – 2004.
The DGIS database shows that expenditure on Phase IV technical assistance (January 2000 to April 2004) totalled EUR 3.0 million. An additional EUR 1.5 million is shown as spent on capital investments (GON, 2008a, b). However, the Phase IV final report (used in this report’s summaries) shows the technical assistance contribution as EUR 4.8 million, with additional capital funding of EUR 3.9 million, and an Egyptian contribution of LE 23.4 million (about EUR 4.2 million). In addition, the Netherlands contributed EUR 6.8 million to construction of the New El Azab treatment plant, with Egypt contributing LE 60m (about EUR 16.5m) (FaDWaSP, 2009b: 9).
As most of the Phase IV operations were winding down in April 2004, a presidential decree merged FEGAWS and 13 other water utilities around the country into the Holding Company for Drinking Water and Sanitation. FEGAWS thus became the Fayoum Drinking Water and Sanitation Company. This affected the institutional context for the later years of the Phase IV construction effort on the Sanhour UASB wastewater treatment plant, but its institutional effects were carried into Phase V.
Drinking water supply and sanitation programme in Fayoum, Egypt, 1990-2009
| 69 |
During Phase IV, much of the project’s effort continued to focus on support to the organisational development of FEGAWS in terms of its Economic Management Plan, which was reviewed and revised into a second edition for the 2003 – 2008 period. Further work was done to upgrade the organisation’s internal procedures, for example in billing systems, accounting and customer services (through the Branch Customer Offices). The new EMP gave priority to better metering of customers’ water consump-tion, and additional work was done to improve FEGAWS’ performance in this regard.
At the technical level, the project gradually withdrew its technical assistance to water purification activities, which were terminated in March 2003. By that time a number of Compact Units had been withdrawn from service, because of the greatly increased capacity at the New El Azab plant, and the remaining ones had been upgraded. Major efforts to reduce unaccounted-for water were continued across the governorate.
NOPWASD continued to make only slow progress with the construction of wastewater treatment plants, which meant that the governorate’s sanitation status continued to be held back. Construction of the Sanhour UASB, funded by FaDWaSP, was launched late in 2003, and was due for completion 15 months later in November 2004.
Although an Environmental Action Plan was completed in 2001, the project reported at the end of 2003 that no progress had been made with its implementation (FaDWaSP, 2004: 6).
As anticipated, the project’s work in the field of hygiene was limited. Arrangements were made to transfer the schools programme to the Ministry of Education in 2003.
There was greater innovation with regard to gender. FaDWaSP facilitated the establish-ment of a ‘Women Affairs Council’ in FEGAWS. This body, formally approved by the Ministry of Social Affairs in 2003, was the first of its kind in a public organisation in Egypt.
3.5.3 MainoutputsDuring Phase IV, the New El Azab Treatment Plant was commissioned. This greatly improved the availability of safe drinking water in the governorate, although the benefits were diluted by distribution problems. Unaccounted-for water was a key issue here, and the project achieved significant progress with its expanded UFW programme, which ‘evolved in[to] a full[y]-fledged distribution management exercise, supported by a state-of-the-art asset database in a Geographic Information System (GIS) environ-ment’ (GOF, 2004: 16).
Further progress was achieved during Phase IV with water and sewerage construction projects, such as the Gabel Saad transmission line, although these activities continued to be plagued by delays.
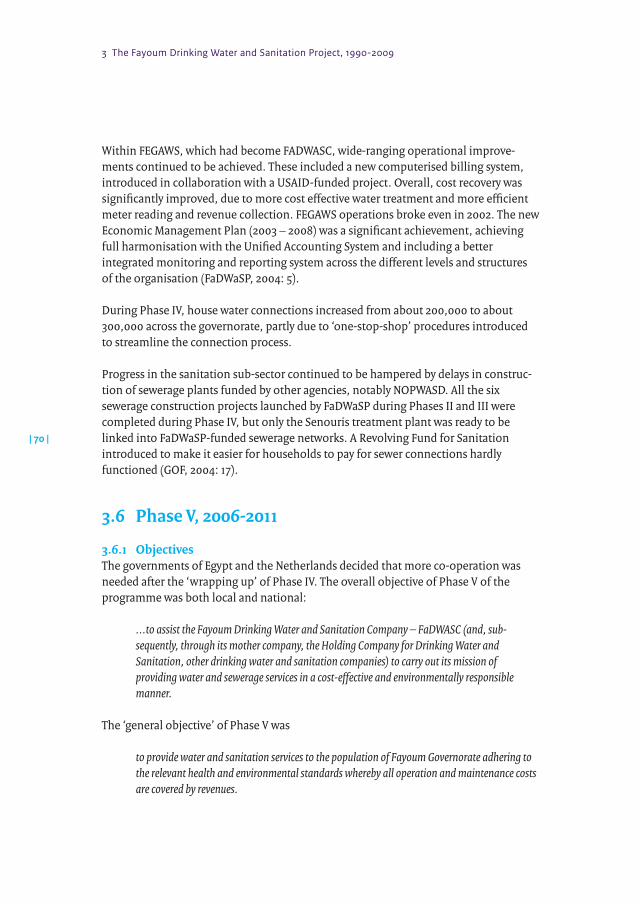
3 The Fayoum Drinking Water and Sanitation Project, 1990-2009
| 70 |
Within FEGAWS, which had become FADWASC, wide-ranging operational improve-ments continued to be achieved. These included a new computerised billing system, introduced in collaboration with a USAID-funded project. Overall, cost recovery was significantly improved, due to more cost effective water treatment and more efficient meter reading and revenue collection. FEGAWS operations broke even in 2002. The new Economic Management Plan (2003 – 2008) was a significant achievement, achieving full harmonisation with the Unified Accounting System and including a better integrated monitoring and reporting system across the different levels and structures of the organisation (FaDWaSP, 2004: 5).
During Phase IV, house water connections increased from about 200,000 to about 300,000 across the governorate, partly due to ‘one-stop-shop’ procedures introduced to streamline the connection process.
Progress in the sanitation sub-sector continued to be hampered by delays in construc-tion of sewerage plants funded by other agencies, notably NOPWASD. All the six sewerage construction projects launched by FaDWaSP during Phases II and III were completed during Phase IV, but only the Senouris treatment plant was ready to be linked into FaDWaSP-funded sewerage networks. A Revolving Fund for Sanitation introduced to make it easier for households to pay for sewer connections hardly functioned (GOF, 2004: 17).
3.6 PhaseV,2006-2011
3.6.1 ObjectivesThe governments of Egypt and the Netherlands decided that more co-operation was needed after the ‘wrapping up’ of Phase IV. The overall objective of Phase V of the programme was both local and national:
...to assist the Fayoum Drinking Water and Sanitation Company – FaDWASC (and, sub-sequently, through its mother company, the Holding Company for Drinking Water and Sanitation, other drinking water and sanitation companies) to carry out its mission of providing water and sewerage services in a cost-effective and environmentally responsible manner.
The ‘general objective’ of Phase V was
to provide water and sanitation services to the population of Fayoum Governorate adhering to the relevant health and environmental standards whereby all operation and maintenance costs are covered by revenues.
Drinking water supply and sanitation programme in Fayoum, Egypt, 1990-2009
| 71 |
‘Immediate objectives’ were formulated as follows.
• To provide reasonable water and sewerage services (in terms of coverage and quality);• To achieve cost recovery of O&M costs;• To empower/capacitate FaDWASC to carry its mission in a cost effective manner;• To serve as a (management) model to other water and sanitation companies which all face
[the] institutional as well as financial problems which FaDWASC faces. (GON, 2008c: 12 - 13).
The need to manage sewerage systems efficiently was identified as a key challenge for Phase V. While much progress had been made with water supplies during earlier phases, leading to complete cost recovery for this service by the end of Phase IV, the project’s installation of UASB technology and the anticipated commissioning of a number of Egyptian government-funded sewerage plants meant that FADWASC would face new management challenges and higher O&M costs. The intention for Phase V was therefore, as previously, to combine financial and technical assistance, with the latter focused on the institutional, systems and capacity development needed to operate the expanded services on a cost recovery basis.
The ‘immediate objectives’ were in turn translated by the plan of operations into ‘specific objectives’. With regard to water supplies, the aim is to increase house connections by 40% to 425,000. Sewer connections should be increased by 200% to 207,500. At least as important as the number of household water connections is the reliability of supply. Phase V aims to ensure that all household connections and public taps will enjoy continuous supply with a pressure of at least 5 mwc. As far as wastewater is concerned, the project’s aim is that 85% of all wastewater, including all the backwash water from NEAT, should be treated adequately. In the logical framework that was drawn up as part of the plan of operations, cost effective operations by FADWASC are assumed to mean that the company will achieve all its EMP targets.
3.6.2 ApproachandactivitiesAs noted above, the approach of Phase V was to continue the combination of financial assistance with technical assistance (TA), and to apply both Egyptian and Dutch funding to the water and sanitation challenges of Fayoum governorate in such a way that other water and sanitation companies in the country would also benefit from the lessons learned and strategies developed. In addition to the Dutch-funded TA contract, the Netherlands made three ‘contribution arrangements’ with the Governorate of Fayoum: to provide finance for a second phase of the New El Azab Water Treatment Plant (NEAT), to fund a variety of general infrastructure, and to install backwash sludge treatment systems to reduce the adverse environmental impact of water purification. These agreements complemented substantial continuing Egyptian funding for the sector in Fayoum, including Phase II of NEAT.
3 The Fayoum Drinking Water and Sanitation Project, 1990-2009
| 72 |
The heart of the Phase V approach continues to be the full integration of the FaDWaSP project into FADWASC. A team of full-time and part-time Egyptian and Dutch consul-tants work within the company applying
a number of management tools developed during the previous Phases and aim[ing] at developing an efficient target-driven organisation. The Economic Management Plan (EMP) providing detailed targets is the articulation of this strategy and will be the vehicle through which project activities will be channelled. FaDWaSP will support FADWASC to harmonise the EMP with the requirements of the Holding Company for Drinking Water and Wastewater (HCWW) and to develop into a full-fledged Management Information System, which will serve as a daily tool of management for middle managers (FaDWaSP, 2008b: 1).
According to the plan of operations, the EMP, which has been an effective tool in enhanced management of water supply operations, will be evaluated so that the lessons of experience to date can be incorporated in revision of the EMP to serve expanded sewerage operations too.
Full cost recovery by FADWASC remains a key part of the project’s operating philosophy, but it is important to note also the emphasis on balancing cost recovery goals with the need to provide ‘reasonable water and sewerage services to low-income groups’ (FaDWaSP, 2008b: 23).
Phase V aims to continue the enhanced use of information technology by FADWASC. Computerised geographic information and asset management systems, developed for management of water supplies, will be transferred and adapted to serve the company’s sanitation operations as well.
It is important to note that Phase V activities began after an effective gap of two and a half years in most project operations and contact with FADWASC. Between mid 2004 and mid 2006, Phase IV focused entirely on the Sanhour UASB construction and pilot operation (which meant that Phase IV actually overlapped with Phase V until 2008). As noted in section 3.5.2, the conversion of the economic general authority FEGAWS into the company FADWASC happened just as most Phase IV work was coming to an end. The new company had to find its feet over the following two years with very little input from FaDWaSP.
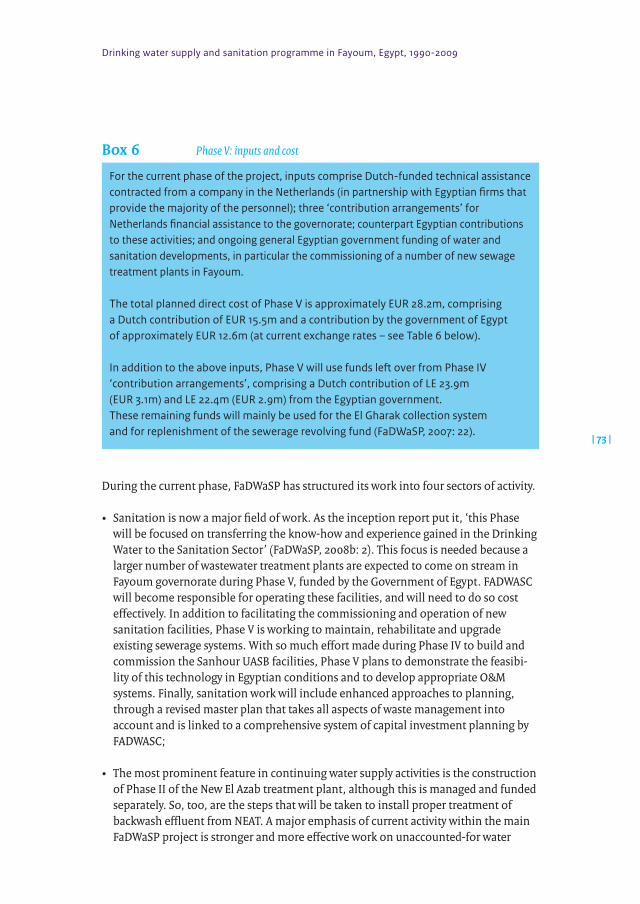
Drinking water supply and sanitation programme in Fayoum, Egypt, 1990-2009
| 73 |
Box6 Phase V: inputs and cost
For the current phase of the project, inputs comprise Dutch-funded technical assistance contracted from a company in the Netherlands (in partnership with Egyptian firms that provide the majority of the personnel); three ‘contribution arrangements’ for Netherlands financial assistance to the governorate; counterpart Egyptian contributions to these activities; and ongoing general Egyptian government funding of water and sanitation developments, in particular the commissioning of a number of new sewage treatment plants in Fayoum.
The total planned direct cost of Phase V is approximately EUR 28.2m, comprising a Dutch contribution of EUR 15.5m and a contribution by the government of Egypt of approximately EUR 12.6m (at current exchange rates – see Table 6 below).
In addition to the above inputs, Phase V will use funds left over from Phase IV ‘contribution arrangements’, comprising a Dutch contribution of LE 23.9m (EUR 3.1m) and LE 22.4m (EUR 2.9m) from the Egyptian government. These remaining funds will mainly be used for the El Gharak collection system and for replenishment of the sewerage revolving fund (FaDWaSP, 2007: 22).
During the current phase, FaDWaSP has structured its work into four sectors of activity. • Sanitation is now a major field of work. As the inception report put it, ‘this Phase
will be focused on transferring the know-how and experience gained in the Drinking Water to the Sanitation Sector’ (FaDWaSP, 2008b: 2). This focus is needed because a larger number of wastewater treatment plants are expected to come on stream in Fayoum governorate during Phase V, funded by the Government of Egypt. FADWASC will become responsible for operating these facilities, and will need to do so cost effectively. In addition to facilitating the commissioning and operation of new sanitation facilities, Phase V is working to maintain, rehabilitate and upgrade existing sewerage systems. With so much effort made during Phase IV to build and commission the Sanhour UASB facilities, Phase V plans to demonstrate the feasibi-lity of this technology in Egyptian conditions and to develop appropriate O&M systems. Finally, sanitation work will include enhanced approaches to planning, through a revised master plan that takes all aspects of waste management into account and is linked to a comprehensive system of capital investment planning by FADWASC;
• The most prominent feature in continuing water supply activities is the construction of Phase II of the New El Azab treatment plant, although this is managed and funded separately. So, too, are the steps that will be taken to install proper treatment of backwash effluent from NEAT. A major emphasis of current activity within the main FaDWaSP project is stronger and more effective work on unaccounted-for water
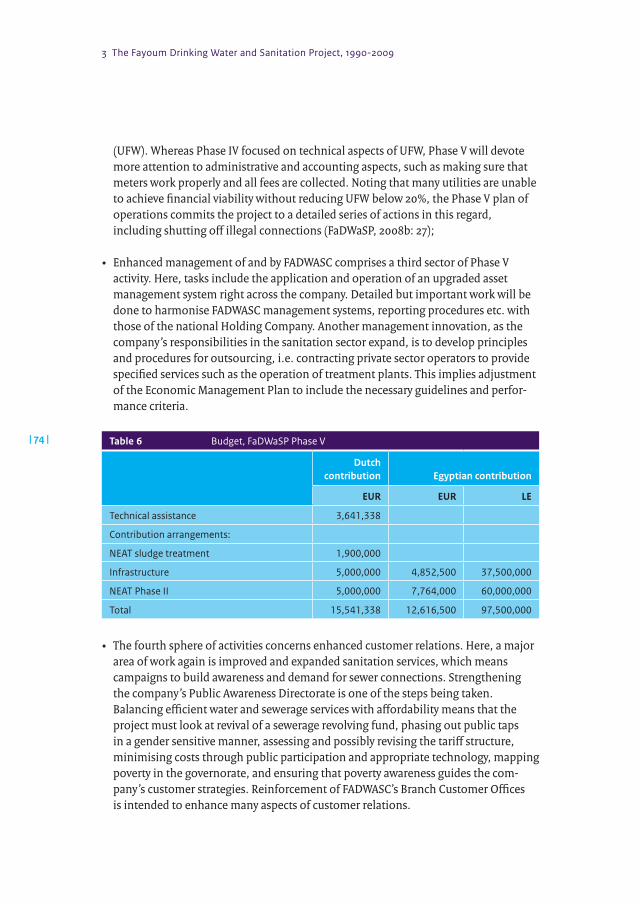
3 The Fayoum Drinking Water and Sanitation Project, 1990-2009
| 74 |
(UFW). Whereas Phase IV focused on technical aspects of UFW, Phase V will devote more attention to administrative and accounting aspects, such as making sure that meters work properly and all fees are collected. Noting that many utilities are unable to achieve financial viability without reducing UFW below 20%, the Phase V plan of operations commits the project to a detailed series of actions in this regard, including shutting off illegal connections (FaDWaSP, 2008b: 27);
• Enhanced management of and by FADWASC comprises a third sector of Phase V activity. Here, tasks include the application and operation of an upgraded asset management system right across the company. Detailed but important work will be done to harmonise FADWASC management systems, reporting procedures etc. with those of the national Holding Company. Another management innovation, as the company’s responsibilities in the sanitation sector expand, is to develop principles and procedures for outsourcing, i.e. contracting private sector operators to provide specified services such as the operation of treatment plants. This implies adjustment of the Economic Management Plan to include the necessary guidelines and perfor-mance criteria.
Table 6 Budget, FaDWaSP Phase V
Dutch contribution Egyptian contribution
EUR EUR LE
Technical assistance 3,641,338
Contribution arrangements:
NEAT sludge treatment 1,900,000
Infrastructure 5,000,000 4,852,500 37,500,000
NEAT Phase II 5,000,000 7,764,000 60,000,000
Total 15,541,338 12,616,500 97,500,000
• The fourth sphere of activities concerns enhanced customer relations. Here, a major area of work again is improved and expanded sanitation services, which means campaigns to build awareness and demand for sewer connections. Strengthening the company’s Public Awareness Directorate is one of the steps being taken. Balancing efficient water and sewerage services with affordability means that the project must look at revival of a sewerage revolving fund, phasing out public taps in a gender sensitive manner, assessing and possibly revising the tariff structure, minimising costs through public participation and appropriate technology, mapping poverty in the governorate, and ensuring that poverty awareness guides the com-pany’s customer strategies. Reinforcement of FADWASC’s Branch Customer Offices is intended to enhance many aspects of customer relations.
Drinking water supply and sanitation programme in Fayoum, Egypt, 1990-2009
| 75 |
3.6.3 MainoutputstodateAs noted in section 3.6.1 above, Phase V intends to expand household water connections by 40% to 425,000, and to increase sewer connections by 200% to 207,500. This represents 125,000 new water connections and 137,500 new sewer connections.
Ever since its conception in 1999, the Economic Management Plan (EMP) has been one of the driving forces behind this Project. The second EMP (2003-2008) has come to its end and the Company is very interested to further develop this tool of management. We shall consolidate the concept of EMP as a Business Plan but seek to harmonise the outcomes with the reporting requirements of the [Holding Company], integrate the existing information systems into a Management Information System (MIS), and promote more involvement of the middle management. The third EMP (2008-2013) shall serve as a vehicle to review on a monthly basis with the concerned managers progress realised and to implement corrective actions whenever required (FaDWaSP, 2009: 14; their emphasis).
During 2007, FaDWaSP devoted much effort to starting up new systems, and to developing overall systems and methods for smoother start-up procedures (set out in a Start Up Manual). This included strengthening the operations of Branch Customer Offices, the Contracting Branch and the Public Awareness Department, and ensuring that social marketing campaigns were effective. Responding to the strong emphasis in Phase V on expanded sanitation coverage, a Sanitation Database was developed in FADWASC. The Start Up Task Force continued its operations through 2008, co-ordinating and facilitating the company’s extension of new sewerage networks and connections.
Early work in Phase V also included assessment of the O&M challenges in sanitation, which are addressed in the Economic Management Plan for 2007-12. Work has since been undertaken to introduce the required improved O&M procedures for wastewater treatment plants. Computerised maintenance management systems were piloted. The project also worked to initiate rehabilitation of some existing systems. Meanwhile, it has been monitoring the early performance of the Sanhour UASB (commissioned in March 2007), which was generally good. During the first year of Phase V, work was also done on UFW, with investigations into how to enhance preventive maintenance.A significant achievement during 2007 was production of a draft third EMP for the company. The plan aimed for full cost recovery by FADWASC by 2012. It addressed, inter alia, energy conservation, reduction of UFW and tariff revisions. However, as explained in section 4.4.1 below, this third EMP has not been brought into full use, and is now being merged with the company’s management information system.
Community-level work to introduce new wastewater schemes and promote household sewer connections has been a major activity for Phase V to date. A number of difficulties arose in some communities, partly because some Local Units urged people not to sign up for the new connections since they would allegedly be provided free later. The company responded by suspending its social marketing approach and connecting all households in newly serviced areas. Its Sewer Revolving Fund was used by the vast
3 The Fayoum Drinking Water and Sanitation Project, 1990-2009
| 76 |
majority of customers, enabling them to spread out the connection payment. Studies were also undertaken to identify weaknesses in the operation of wastewater treatment plants and ways to remedy them. Further investigations involved appropriate sewerage strategies for small settlements, which remain a significant challenge (section 4.3). An ‘open planning’ and meso-financing approach was piloted in the Sanhour area.
The project also supported a review of the FADWASC water network, which identified a number of shortcomings. These included incomplete usage of installed production capacity, insufficient transmission capacity of the main network, and an excessive number of connections between main transmission lines and local distribution pipes. Enhanced hydraulic modelling, network monitoring and network maintenance (through stronger district offices) were among the recommended actions. Improved water network management arrangements were piloted successfully in Senouris district in 2008.
A number of training activities have been delivered during Phase V. A key part of this effort has been upgrading the company’s ability to assess personnel training needs and arrange the appropriate programmes for them. As the wastewater network and treatment plants are extended, the need for training in this subsector has grown. Much of the project’s training effort is aimed at supporting the company in this regard.
3.7 Beneficiaries
The beneficiaries of FaDWaSP’s 20 years of effort are spread across the governorate. The programme has always focused on enhanced services for the rural population, i.e. those living outside Fayoum City. However, since the establishment of FEGAWS in July 1996 (late in FaDWaSP Phase II) its focus on institutional development for the water and sanitation utility has meant indirect benefits for city residents too.
Partly because of its institution-building focus, the programme has done little detailed analysis of the socio-economic characteristics of its beneficiaries. It has tended, not unreasonably, to focus on the need among the Fayoum population for more house-hold drinking water and sewer connections. It has seen its main task as meeting that need, counting how many connections it makes. As this study shows, connections are not the end of the story: water must come out of the pipe, at adequate pressure and around the clock. People in households with piped water connections may therefore not be beneficiaries in the intended sense. The quantity, continuity and quality of their supply may still be inadequate. The water pressure map of the network across the governorate and its lab test results on water quality are as important for FADWASC, at this stage of its progress, as the number of connections or people ‘served’. Furthermore, the full benefits of a good water supply are only achieved when that service is matched by appropriate wastewater disposal. Improved water supply may jeopardise the health of ‘beneficiaries’ if it is not accompanied by improved sanitation,
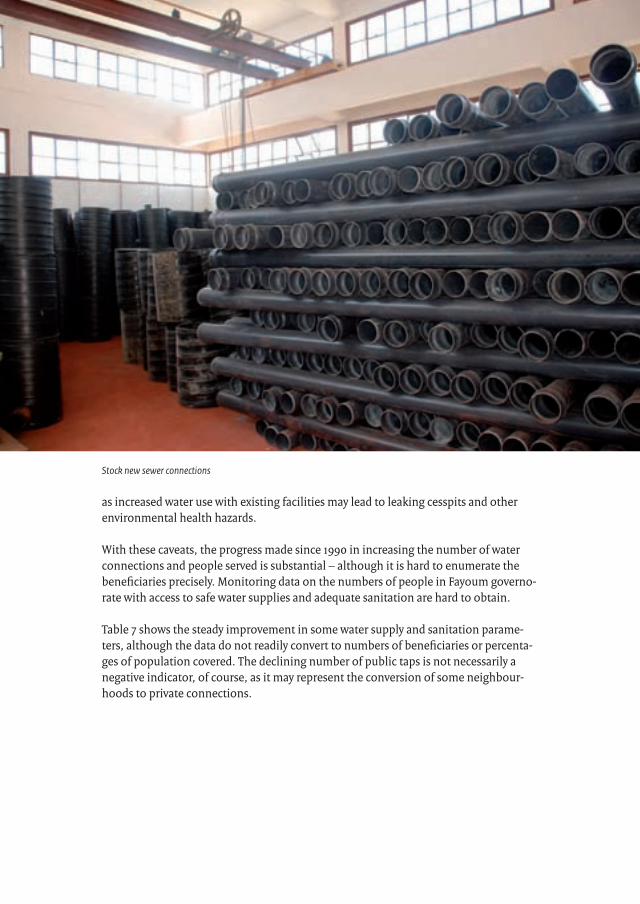
Drinking water supply and sanitation programme in Fayoum, Egypt, 1990-2009
| 77 |
as increased water use with existing facilities may lead to leaking cesspits and other environmental health hazards.
With these caveats, the progress made since 1990 in increasing the number of water connections and people served is substantial – although it is hard to enumerate the beneficiaries precisely. Monitoring data on the numbers of people in Fayoum governo-rate with access to safe water supplies and adequate sanitation are hard to obtain.
Table 7 shows the steady improvement in some water supply and sanitation parame-ters, although the data do not readily convert to numbers of beneficiaries or percenta-ges of population covered. The declining number of public taps is not necessarily a negative indicator, of course, as it may represent the conversion of some neighbour-hoods to private connections.
Stock new sewer connections
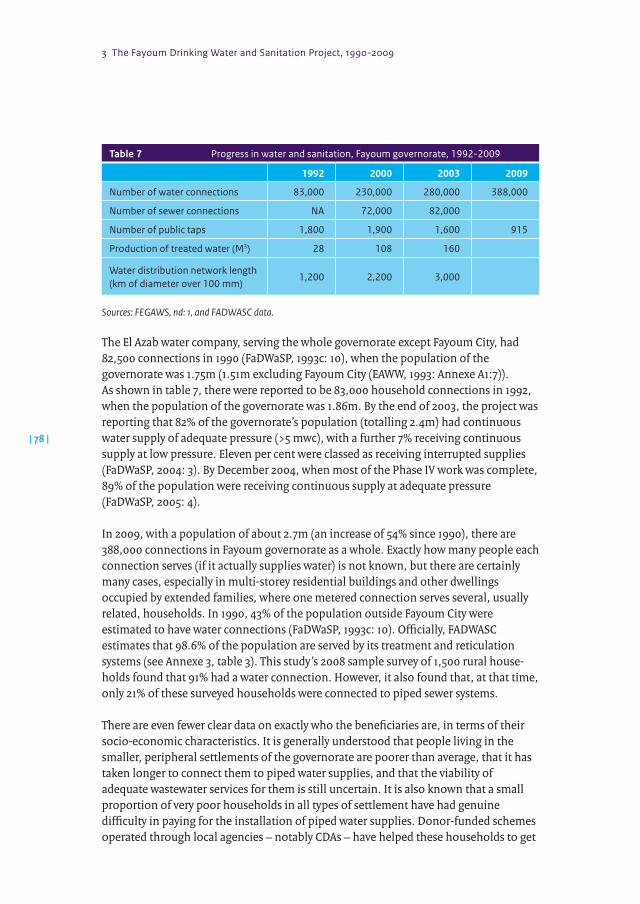
3 The Fayoum Drinking Water and Sanitation Project, 1990-2009
| 78 |
Table 7 Progress in water and sanitation, Fayoum governorate, 1992-2009
1992 2000 2003 2009
Number of water connections 83,000 230,000 280,000 388,000
Number of sewer connections NA 72,000 82,000
Number of public taps 1,800 1,900 1,600 915
Production of treated water (M3) 28 108 160
Water distribution network length (km of diameter over 100 mm)
1,200 2,200 3,000
Sources: FEGAWS, nd: 1, and FADWASC data.
The El Azab water company, serving the whole governorate except Fayoum City, had 82,500 connections in 1990 (FaDWaSP, 1993c: 10), when the population of the governorate was 1.75m (1.51m excluding Fayoum City (EAWW, 1993: Annexe A1:7)). As shown in table 7, there were reported to be 83,000 household connections in 1992, when the population of the governorate was 1.86m. By the end of 2003, the project was reporting that 82% of the governorate’s population (totalling 2.4m) had continuous water supply of adequate pressure (>5 mwc), with a further 7% receiving continuous supply at low pressure. Eleven per cent were classed as receiving interrupted supplies (FaDWaSP, 2004: 3). By December 2004, when most of the Phase IV work was complete, 89% of the population were receiving continuous supply at adequate pressure (FaDWaSP, 2005: 4).
In 2009, with a population of about 2.7m (an increase of 54% since 1990), there are 388,000 connections in Fayoum governorate as a whole. Exactly how many people each connection serves (if it actually supplies water) is not known, but there are certainly many cases, especially in multi-storey residential buildings and other dwellings occupied by extended families, where one metered connection serves several, usually related, households. In 1990, 43% of the population outside Fayoum City were estimated to have water connections (FaDWaSP, 1993c: 10). Officially, FADWASC estimates that 98.6% of the population are served by its treatment and reticulation systems (see Annexe 3, table 3). This study’s 2008 sample survey of 1,500 rural house-holds found that 91% had a water connection. However, it also found that, at that time, only 21% of these surveyed households were connected to piped sewer systems.
There are even fewer clear data on exactly who the beneficiaries are, in terms of their socio-economic characteristics. It is generally understood that people living in the smaller, peripheral settlements of the governorate are poorer than average, that it has taken longer to connect them to piped water supplies, and that the viability of adequate wastewater services for them is still uncertain. It is also known that a small proportion of very poor households in all types of settlement have had genuine difficulty in paying for the installation of piped water supplies. Donor-funded schemes operated through local agencies – notably CDAs – have helped these households to get
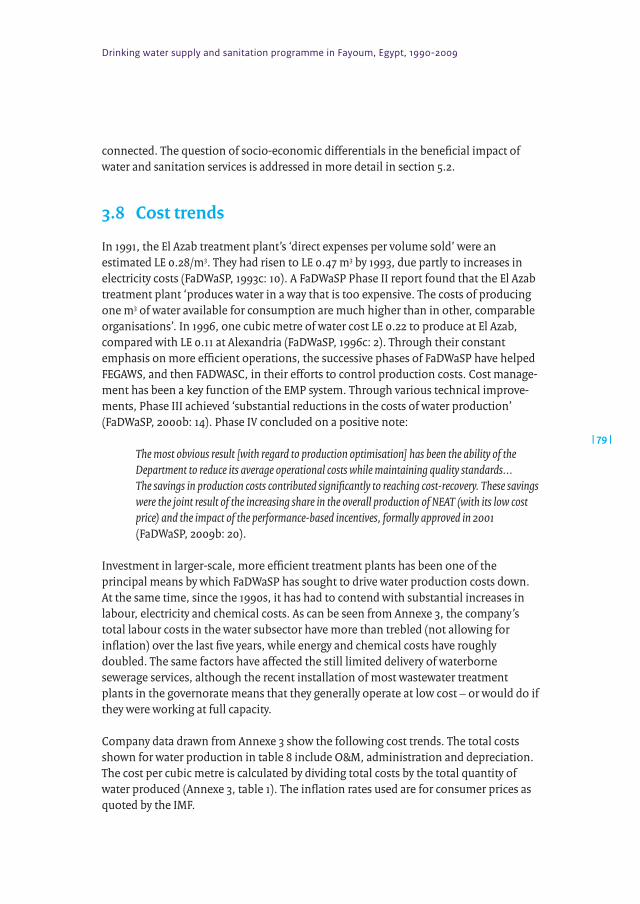
Drinking water supply and sanitation programme in Fayoum, Egypt, 1990-2009
| 79 |
connected. The question of socio-economic differentials in the beneficial impact of water and sanitation services is addressed in more detail in section 5.2.
3.8 Costtrends
In 1991, the El Azab treatment plant’s ‘direct expenses per volume sold’ were an estimated LE 0.28/m3. They had risen to LE 0.47 m3 by 1993, due partly to increases in electricity costs (FaDWaSP, 1993c: 10). A FaDWaSP Phase II report found that the El Azab treatment plant ‘produces water in a way that is too expensive. The costs of producing one m3 of water available for consumption are much higher than in other, comparable organisations’. In 1996, one cubic metre of water cost LE 0.22 to produce at El Azab, compared with LE 0.11 at Alexandria (FaDWaSP, 1996c: 2). Through their constant emphasis on more efficient operations, the successive phases of FaDWaSP have helped FEGAWS, and then FADWASC, in their efforts to control production costs. Cost manage-ment has been a key function of the EMP system. Through various technical improve-ments, Phase III achieved ‘substantial reductions in the costs of water production’ (FaDWaSP, 2000b: 14). Phase IV concluded on a positive note:
The most obvious result [with regard to production optimisation] has been the ability of the Department to reduce its average operational costs while maintaining quality standards... The savings in production costs contributed significantly to reaching cost-recovery. These savings were the joint result of the increasing share in the overall production of NEAT (with its low cost price) and the impact of the performance-based incentives, formally approved in 2001 (FaDWaSP, 2009b: 20).
Investment in larger-scale, more efficient treatment plants has been one of the principal means by which FaDWaSP has sought to drive water production costs down. At the same time, since the 1990s, it has had to contend with substantial increases in labour, electricity and chemical costs. As can be seen from Annexe 3, the company’s total labour costs in the water subsector have more than trebled (not allowing for inflation) over the last five years, while energy and chemical costs have roughly doubled. The same factors have affected the still limited delivery of waterborne sewerage services, although the recent installation of most wastewater treatment plants in the governorate means that they generally operate at low cost – or would do if they were working at full capacity.
Company data drawn from Annexe 3 show the following cost trends. The total costs shown for water production in table 8 include O&M, administration and depreciation. The cost per cubic metre is calculated by dividing total costs by the total quantity of water produced (Annexe 3, table 1). The inflation rates used are for consumer prices as quoted by the IMF.
3 The Fayoum Drinking Water and Sanitation Project, 1990-2009
| 80 |
Table 8 FADWASC water production cost trend
2004-05LE
2005-06LE
2006-07LE
2007-08LE
Total actual cost per cubic metre produced
0.26 0.35 0.35 0.38
2004-05 cost increased by annual inflation rates
0.28 0.31 0.34
Source: costs: FADWASC (see Annexe 3); inflation rates: IMF, 2009.
The most recently obtained data from the company are shown in table 9 below. The 2007-08 figures have been slightly revised.
Table 9 FADWASC recent water production costs
Cost of water to FADWASC2007-08
2008-09 (1st 9 months)
LE LE
Per m3 produced 0.297 0.390
Per m3 sold 0.439 0.563
Per m3 produced, including depreciation 0.367 0.470
Per m3 sold, including depreciation 0.543 0.679
Source: FADWASC.
As can be seen from Annexe 3, the company has not calculated a total cost per cubic metre treated for its wastewater subsector. But, as new treatment plants have been brought into operation, its O&M costs for wastewater have increased substantially (table 10). The challenge here is that the many new treatment plants are operating far below capacity. Annexe 3 shows that, in FADWASC’s wastewater operations, the proportion of labour costs in total O&M costs has fallen from 74% to 66% since 2004-05, while the proportion of electricity costs has risen from 12% to 15%.
Table 10 Recent FADWASC wastewater treatment cost trend
2004-05LE
2005-06LE
2006-07LE
2007-08LE
2008-09LE
Total costs (O&M + depreciation) x million
26.4 32.0 36.4 48.7 85.1
Total O&M costs per cubic metre treated
0.32 0.43 0.49 0.70 2.18
2004-05 cost increased by annual inflation rates
0.33 0.37 0.41 0.48
Source: costs: FADWASC (see Annexe 3); inflation rates: IMF, 2009.
Overall, cost recovery is vital for the sustainability of the infrastructure and services that FaDWaSP has helped to develop over its five phases. Further progress in cost control is
Drinking water supply and sanitation programme in Fayoum, Egypt, 1990-2009
| 81 |
therefore essential. However, the extent to which the company’s costs can be reflected in its consumer tariffs, and the affordability of current or adjusted tariffs for the people of Fayoum, are complex questions. They are addressed in sections 2.6 and 6.3.
3.9 Summary
Over five phases of the Fayoum Drinking Water and Sanitation Project, the Netherlands has been supporting the improvement of water and wastewater services in the governorate since 1990. This support has spanned the various institutions responsible for the sector in Fayoum over that period: the El Azab waterworks (to 1996), the Fayoum Economic General Authority for Water and Sanitation (1996-2004) and the Fayoum Drinking Water and Sanitation Company (2004 to date). Almost as soon as FADWASC took over from FEGAWS in April 2004, Phase IV of FaDWaSP came to an end (with the exception of support for construction of the Sanhour UASB sewage treatment plant, which continued until October 2008). While the first four phases of the project had been more or less consecutive (Phase IV was actually intended to be the last), there was a gap of two and a half years before Phase V began. This was a sensitive period for the new FADWASC, which had to start operations without the external support that FEGAWS had enjoyed.
The total Dutch contribution to FaDWaSP (including Phase V to 2011) has been EUR 44.3 million. In addition, the government of Egypt has contributed some EUR 48 million. In addition to technical assistance, the Netherlands’ contribution includes separate ‘contribution agreements’ for Dutch provision of capital funding for major new water and sanitation infrastructure in Fayoum.
There have been two notable trends over the five phases of FaDWaSP. First, the project has placed steadily greater emphasis on support to enhanced wastewater services in the governorate. (Dutch technical assistance to water treatment work was phased out in 2003.) Secondly, the successive phases have focused more and more on institution building. The emphasis has increasingly been on developing FEGAWS, and later FADWASC, into efficient water and wastewater utilities. The project’s approach has always been organic and process-oriented, seeking to work within the utility and help it to build its capacity in the right directions while helping it to respond to the daily demands of service delivery in a challenging environment.
One of the major achievements of Phase I of FaDWaSP was production of the master plan for water and sanitation in the governorate (to 2020). With revisions in 1999, this plan guided development in the sector until recently; preparation of a new plan (to 2037) is now almost complete.
From the outset, the institutional emphasis was on helping the water and sanitation utilities to achieve more efficient operations. The project’s work thus involved many
3 The Fayoum Drinking Water and Sanitation Project, 1990-2009
| 82 |
structural and procedural enhancements to El Azab and later to the Fayoum Sanitation Department, FEGAWS and FADWASC. From Phase III, many of these enhancements were set out in Economic Management Plans for the organisation. The focus on institutional development meant that training programmes and human resource development were prominent throughout the project. Phase III saw the establishment of FEGAWS Branch Customer Offices in each district of the governorate. From the launch of FEGAWS, increased cost recovery was a dominant concern. With the steadily increasing emphasis on sanitation that the master plan required, the project helped its counterparts develop appropriate low cost technologies. The UASB pilot was a leading example of this. Phases IV and V of the project have been dominated by detailed and intensive efforts to upgrade various commercial, financial, management and related information systems in FEGAWS and FADWASC.
The importance of hygiene and environmental health in maximising the benefits of improved water and sanitation services has been recognised throughout the project, although the implementation of these programmes through El Azab, FEGAWS and FADWASC has been uneven.
Phase III of the project saw a major achievement as the New El Azab water treatment plant was constructed. This transformed the water supply situation in the governorate from one of constant shortage to one in which supply exceeded demand, at least temporarily. However, very high discrepancies between water produced and water generating revenues through sales – ‘unaccounted-for water’ – have been an ongoing concern. In later phases of FaDWaSP, some progress has been made in reducing UFW.
Phase V of FaDWaSP was half way through its planned implementation period at the time of this study. It now comprises a small team of technical advisers fully embedded within FADWASC, supporting many aspects of the institutional and technical develop-ment of the organisation.
The project has never been formally evaluated, although an external monitoring committee of one Dutch and one Egyptian expert made periodic advisory visits during Phases I-IV.
Over the 19 years since FaDWaSP started, there has been a substantial increase in the extent of piped water services to households in Fayoum. There were 82,500 household connections in 1990, excluding Fayoum City. There are 388,000 connections across the governorate now, and 91% of the rural households sampled in this study’s 2008 survey had piped water connections. The company and the project are well aware that this achievement has not yet been matched by the delivery of an adequate quantity and quality of water through household taps. The current emphasis is on expanding coverage with waterborne sewerage connections. The 2008 survey found that 21% of rural households had these. There is some evidence that poorer people, often in smaller, peripheral settlements, have had to wait longer to get water connections, and
Drinking water supply and sanitation programme in Fayoum, Egypt, 1990-2009
| 83 |
in extreme cases have received assistance for this purpose. Ways of providing adequate wastewater services to small rural settlements are still being investigated.
FaDWaSP has constantly emphasised more efficient operations and cost control by FADWASC and its predecessors. There has been considerable success in achieving economies of scale and greater technical and administrative efficiency, but other cost elements – notably labour, electricity and chemicals – have made it difficult to achieve an overall reduction in production and treatment costs.
Rural water supply and sanitation in Fayoum, 2009
4
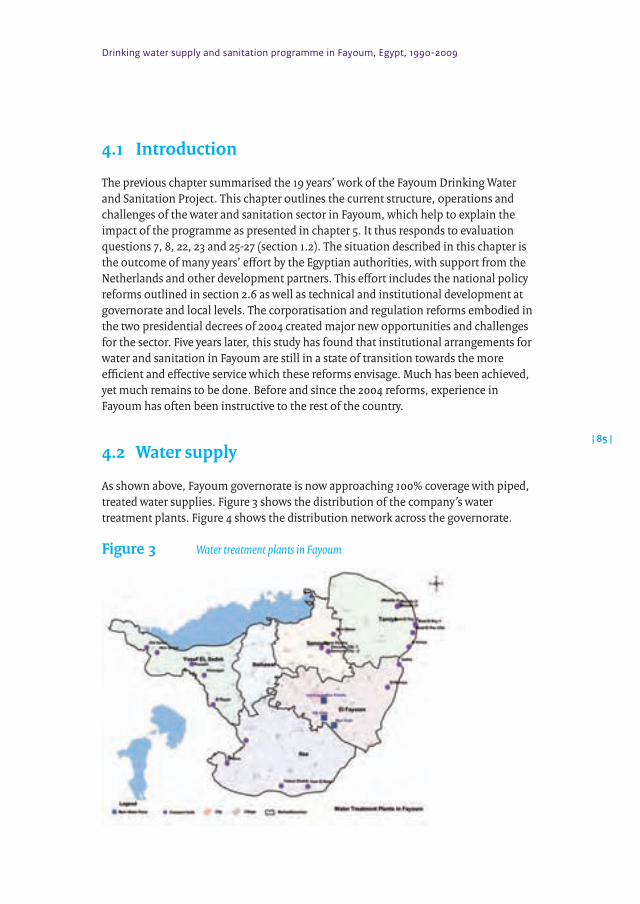
Drinking water supply and sanitation programme in Fayoum, Egypt, 1990-2009
| 85 |
4.1 Introduction
The previous chapter summarised the 19 years’ work of the Fayoum Drinking Water and Sanitation Project. This chapter outlines the current structure, operations and challenges of the water and sanitation sector in Fayoum, which help to explain the impact of the programme as presented in chapter 5. It thus responds to evaluation questions 7, 8, 22, 23 and 25-27 (section 1.2). The situation described in this chapter is the outcome of many years’ effort by the Egyptian authorities, with support from the Netherlands and other development partners. This effort includes the national policy reforms outlined in section 2.6 as well as technical and institutional development at governorate and local levels. The corporatisation and regulation reforms embodied in the two presidential decrees of 2004 created major new opportunities and challenges for the sector. Five years later, this study has found that institutional arrangements for water and sanitation in Fayoum are still in a state of transition towards the more efficient and effective service which these reforms envisage. Much has been achieved, yet much remains to be done. Before and since the 2004 reforms, experience in Fayoum has often been instructive to the rest of the country.
4.2 Watersupply
As shown above, Fayoum governorate is now approaching 100% coverage with piped, treated water supplies. Figure 3 shows the distribution of the company’s water treatment plants. Figure 4 shows the distribution network across the governorate.
Figure3 Water treatment plants in Fayoum
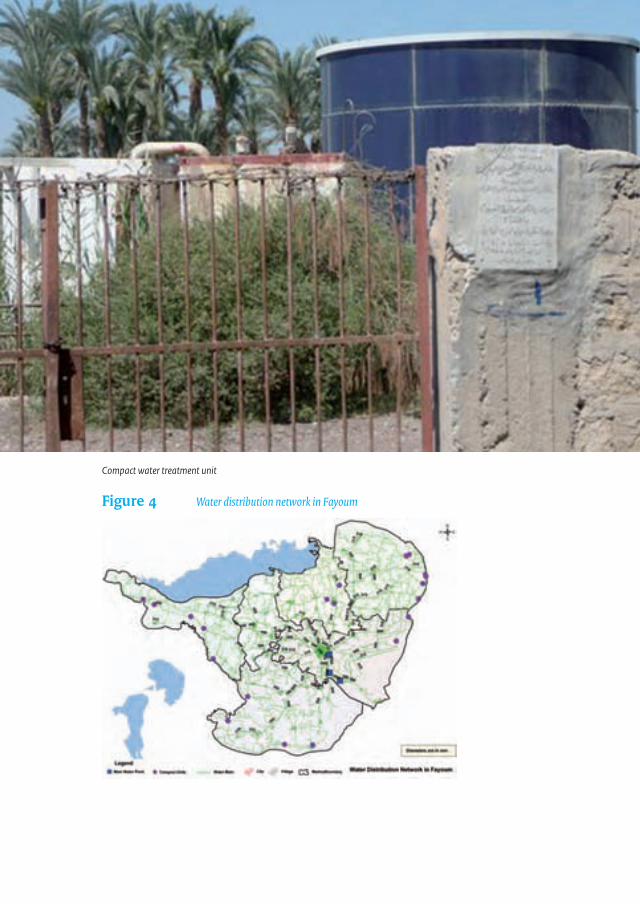
4 Rural water supply and sanitation in Fayoum, 2009
| 86 |
Figure4 Water distribution network in Fayoum
Compact water treatment unit
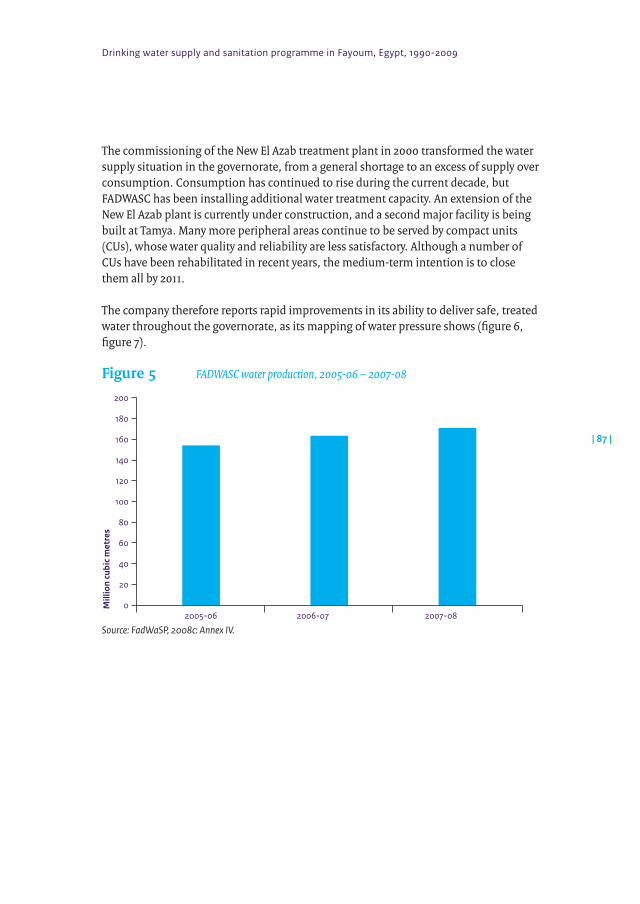
Drinking water supply and sanitation programme in Fayoum, Egypt, 1990-2009
| 87 |
The commissioning of the New El Azab treatment plant in 2000 transformed the water supply situation in the governorate, from a general shortage to an excess of supply over consumption. Consumption has continued to rise during the current decade, but FADWASC has been installing additional water treatment capacity. An extension of the New El Azab plant is currently under construction, and a second major facility is being built at Tamya. Many more peripheral areas continue to be served by compact units (CUs), whose water quality and reliability are less satisfactory. Although a number of CUs have been rehabilitated in recent years, the medium-term intention is to close them all by 2011.
The company therefore reports rapid improvements in its ability to deliver safe, treated water throughout the governorate, as its mapping of water pressure shows (figure 6, figure 7).
Figure5 FADWASC water production, 2005-06 – 2007-08
2005-06 2006-07 2007-08
Mill
ion
cubi
c m
etre
s
200
180
160
140
120
100
80
60
40
20
0
Source: FadWaSP, 2008c: Annex IV.
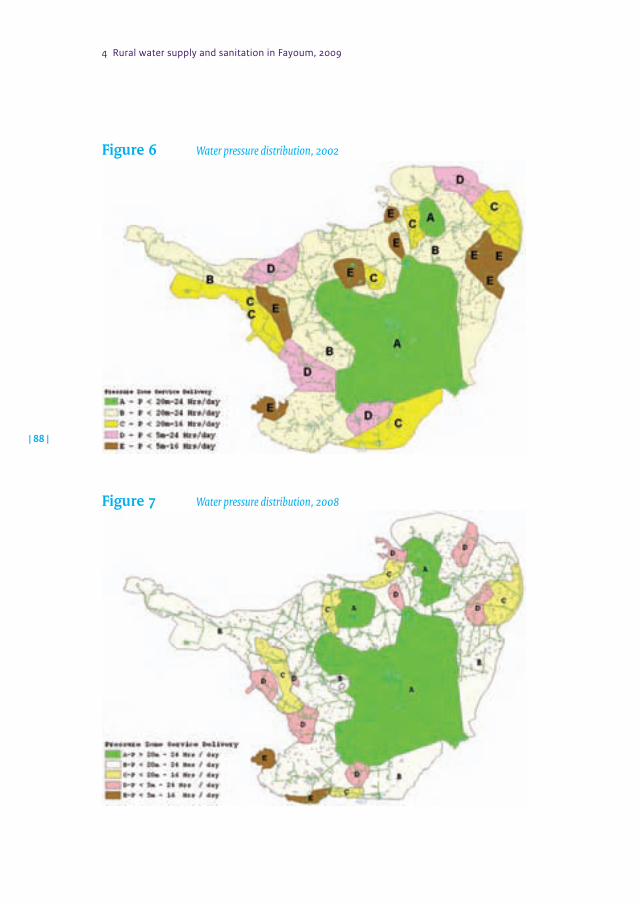
4 Rural water supply and sanitation in Fayoum, 2009
| 88 |
Figure6 Water pressure distribution, 2002
Figure7 Water pressure distribution, 2008
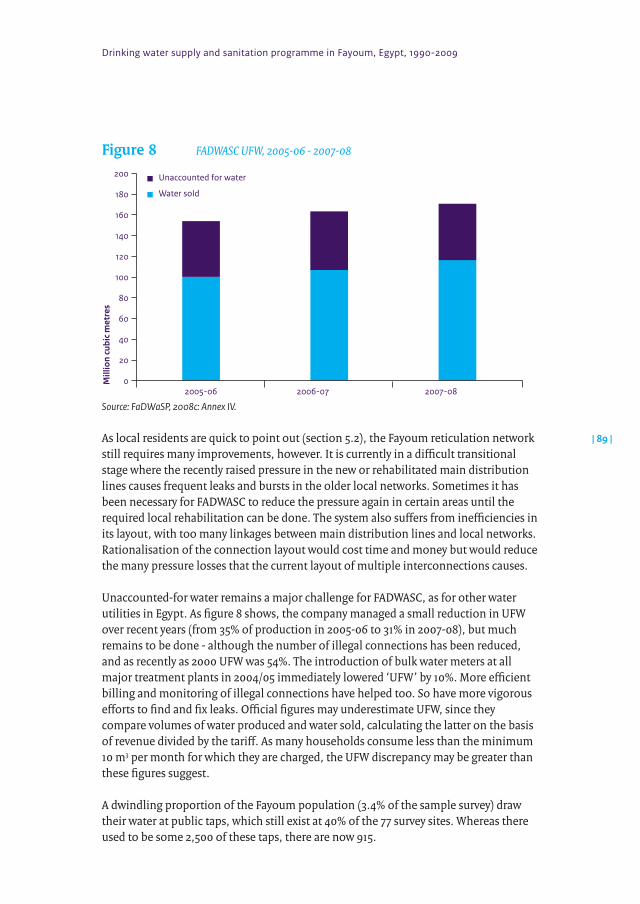
Drinking water supply and sanitation programme in Fayoum, Egypt, 1990-2009
| 89 |
Figure8 FADWASC UFW, 2005-06 - 2007-08
Source: FaDWaSP, 2008c: Annex IV.
As local residents are quick to point out (section 5.2), the Fayoum reticulation network still requires many improvements, however. It is currently in a difficult transitional stage where the recently raised pressure in the new or rehabilitated main distribution lines causes frequent leaks and bursts in the older local networks. Sometimes it has been necessary for FADWASC to reduce the pressure again in certain areas until the required local rehabilitation can be done. The system also suffers from inefficiencies in its layout, with too many linkages between main distribution lines and local networks. Rationalisation of the connection layout would cost time and money but would reduce the many pressure losses that the current layout of multiple interconnections causes.
Unaccounted-for water remains a major challenge for FADWASC, as for other water utilities in Egypt. As figure 8 shows, the company managed a small reduction in UFW over recent years (from 35% of production in 2005-06 to 31% in 2007-08), but much remains to be done - although the number of illegal connections has been reduced, and as recently as 2000 UFW was 54%. The introduction of bulk water meters at all major treatment plants in 2004/05 immediately lowered ‘UFW’ by 10%. More efficient billing and monitoring of illegal connections have helped too. So have more vigorous efforts to find and fix leaks. Official figures may underestimate UFW, since they compare volumes of water produced and water sold, calculating the latter on the basis of revenue divided by the tariff. As many households consume less than the minimum 10 m3 per month for which they are charged, the UFW discrepancy may be greater than these figures suggest.
A dwindling proportion of the Fayoum population (3.4% of the sample survey) draw their water at public taps, which still exist at 40% of the 77 survey sites. Whereas there used to be some 2,500 of these taps, there are now 915.
2005-06 2006-07 2007-08
Mill
ion
cubi
c m
etre
s
200
180
160
140
120
100
80
60
40
20
0
Unaccounted for water
Water sold
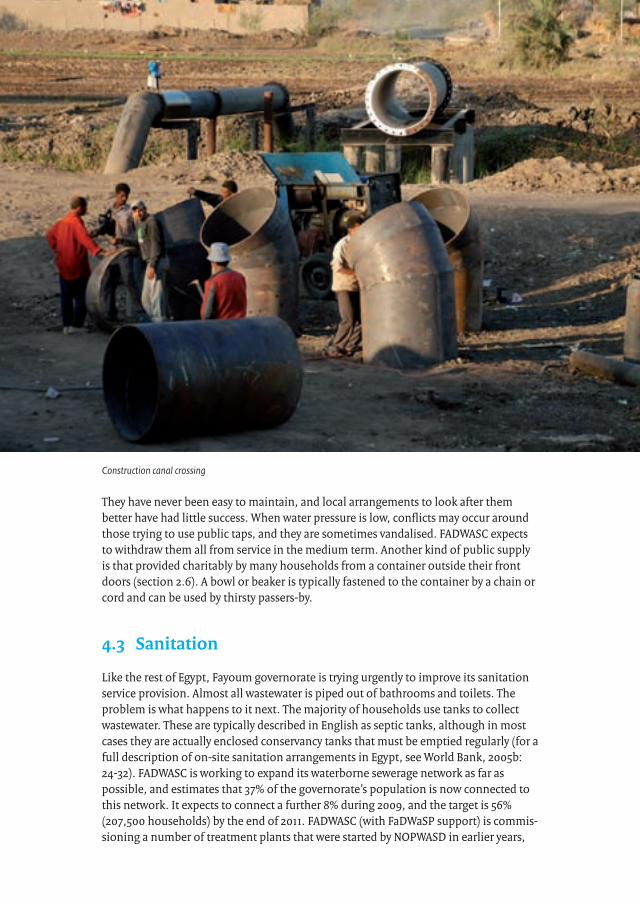
4 Rural water supply and sanitation in Fayoum, 2009
| 90 |
They have never been easy to maintain, and local arrangements to look after them better have had little success. When water pressure is low, conflicts may occur around those trying to use public taps, and they are sometimes vandalised. FADWASC expects to withdraw them all from service in the medium term. Another kind of public supply is that provided charitably by many households from a container outside their front doors (section 2.6). A bowl or beaker is typically fastened to the container by a chain or cord and can be used by thirsty passers-by.
4.3 Sanitation
Like the rest of Egypt, Fayoum governorate is trying urgently to improve its sanitation service provision. Almost all wastewater is piped out of bathrooms and toilets. The problem is what happens to it next. The majority of households use tanks to collect wastewater. These are typically described in English as septic tanks, although in most cases they are actually enclosed conservancy tanks that must be emptied regularly (for a full description of on-site sanitation arrangements in Egypt, see World Bank, 2005b: 24-32). FADWASC is working to expand its waterborne sewerage network as far as possible, and estimates that 37% of the governorate’s population is now connected to this network. It expects to connect a further 8% during 2009, and the target is 56% (207,500 households) by the end of 2011. FADWASC (with FaDWaSP support) is commis-sioning a number of treatment plants that were started by NOPWASD in earlier years,
Construction canal crossing
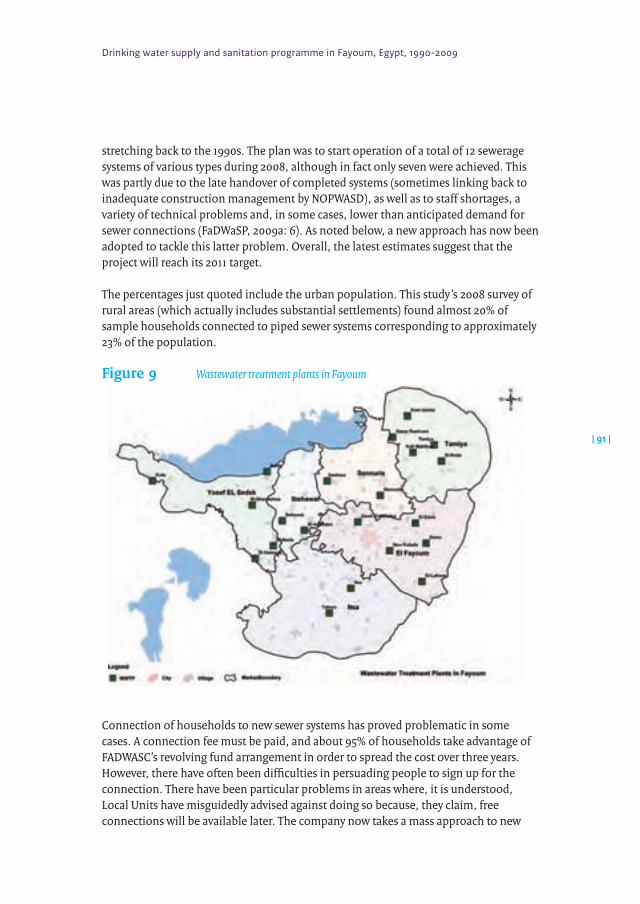
Drinking water supply and sanitation programme in Fayoum, Egypt, 1990-2009
| 91 |
stretching back to the 1990s. The plan was to start operation of a total of 12 sewerage systems of various types during 2008, although in fact only seven were achieved. This was partly due to the late handover of completed systems (sometimes linking back to inadequate construction management by NOPWASD), as well as to staff shortages, a variety of technical problems and, in some cases, lower than anticipated demand for sewer connections (FaDWaSP, 2009a: 6). As noted below, a new approach has now been adopted to tackle this latter problem. Overall, the latest estimates suggest that the project will reach its 2011 target.
The percentages just quoted include the urban population. This study’s 2008 survey of rural areas (which actually includes substantial settlements) found almost 20% of sample households connected to piped sewer systems corresponding to approximately 23% of the population.
Figure9 Wastewater treatment plants in Fayoum
Connection of households to new sewer systems has proved problematic in some cases. A connection fee must be paid, and about 95% of households take advantage of FADWASC’s revolving fund arrangement in order to spread the cost over three years. However, there have often been difficulties in persuading people to sign up for the connection. There have been particular problems in areas where, it is understood, Local Units have misguidedly advised against doing so because, they claim, free connections will be available later. The company now takes a mass approach to new
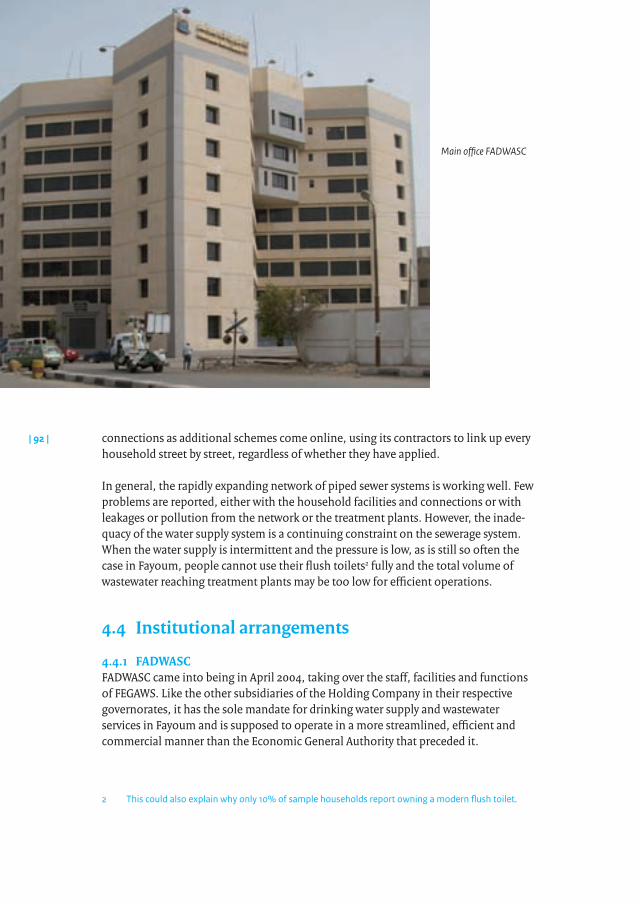
| 92 | connections as additional schemes come online, using its contractors to link up every household street by street, regardless of whether they have applied.
In general, the rapidly expanding network of piped sewer systems is working well. Few problems are reported, either with the household facilities and connections or with leakages or pollution from the network or the treatment plants. However, the inade-quacy of the water supply system is a continuing constraint on the sewerage system. When the water supply is intermittent and the pressure is low, as is still so often the case in Fayoum, people cannot use their flush toilets2 fully and the total volume of wastewater reaching treatment plants may be too low for efficient operations.
4.4 Institutionalarrangements
4.4.1 FADWASCFADWASC came into being in April 2004, taking over the staff, facilities and functions of FEGAWS. Like the other subsidiaries of the Holding Company in their respective governorates, it has the sole mandate for drinking water supply and wastewater services in Fayoum and is supposed to operate in a more streamlined, efficient and commercial manner than the Economic General Authority that preceded it.
2 This could also explain why only 10% of sample households report owning a modern flush toilet.
Main office FADWASC
Drinking water supply and sanitation programme in Fayoum, Egypt, 1990-2009
| 93 |
Whereas FEGAWS had been supported by successive phases of FaDWaSP since its establishment in 1995, the new company lost its Dutch support almost immediately as all but the Sanhour UASB activities of FaDWaSP Phase IV came to an end. It had to develop its operations independently (within the frameworks of the equally new Holding Company) for two and a half years until FaDWaSP Phase V began in December 2006.
As it marks its fifth anniversary, FADWASC can celebrate substantial progress on many fronts. It must also tackle many ongoing challenges in what must still be considered a transitional phase towards full technical competence and commercial viability. Like most public utilities in Egypt, FEGAWS was overstaffed. FADWASC inherited not only an unwieldy staff establishment, but also a moratorium on new professional recruitments that lasted from 1996 to 2006. During that period, staff numbers fell from roughly 3,200 to about 1,800. New hiring has been permitted since 2006 (about 800 new employees were hired between April 2008 and April 2009), but the distinction between permanent and temporary staff persists. In April 2009, the company had 1,642 staff on fixed contracts and 1,842 on temporary ones. Sometimes temporary staff are placed in supervisory positions over permanent ones.
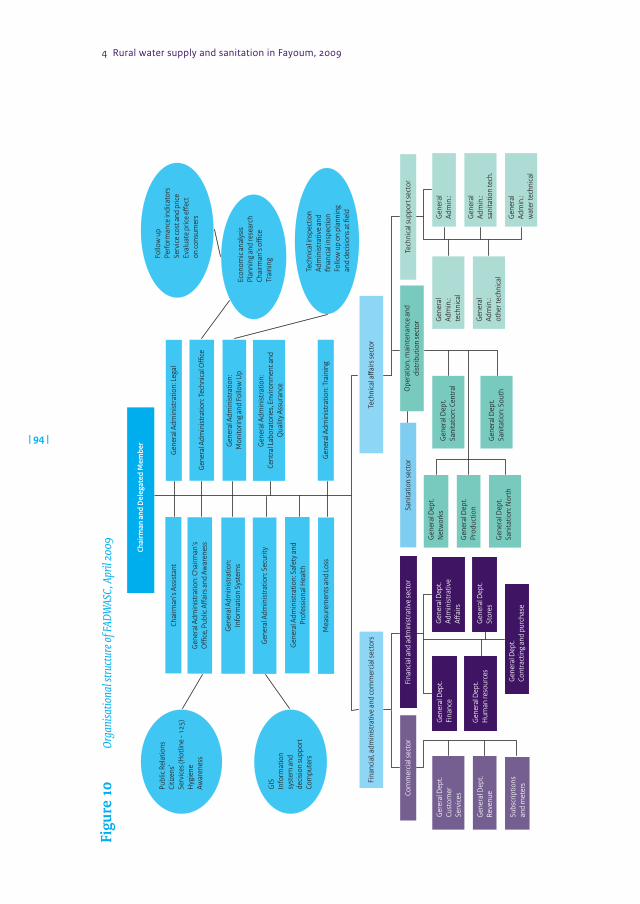
4 Rural water supply and sanitation in Fayoum, 2009
| 94 |
Chai
rman
and
Del
egat
ed M
embe
r
Mea
sure
men
ts a
nd L
oss
Chai
rman
’s As
sist
ant
Gen
eral
Adm
inis
trat
ion:
Cha
irman
’sO
ce
, Pub
lic A
�airs
and
Aw
aren
ess
Gen
eral
Adm
inis
trat
ion:
Info
rmat
ion
Syst
ems
Gen
eral
Adm
inis
trat
ion:
Sec
urity
Gen
eral
Adm
inis
trat
ion:
Saf
ety
and
Prof
essi
onal
Hea
lth
Publ
ic R
elat
ions
Citiz
ens’
Serv
ices
(Hot
line
- 125
)H
ygie
neAw
aren
ess
GIS
Info
rmat
ion
syst
em a
ndde
cisi
on su
ppor
tCo
mpu
ters
Fina
ncia
l, adm
inis
trat
ive
and
com
mer
cial
sect
ors
Tech
nica
l a�a
irs se
ctor
Follo
w u
pPe
rfor
man
ce in
dica
tors
Serv
ice
cost
and
pric
eEv
alua
te p
rice
e�ec
t on
cons
umer
s
Econ
omic
ana
lysi
sPl
anni
ng a
nd re
sear
chCh
airm
an’s
oce
Trai
ning
Tech
nica
l insp
ectio
nAd
min
istr
ativ
e an
d�n
anci
al in
spec
tion
Follo
w u
p on
pla
nnin
gan
d de
cisi
ons a
t �el
d
Gen
eral
Adm
inis
trat
ion:
Leg
al
Gen
eral
Adm
inis
trat
ion:
Tec
hnic
al O
ce
Gen
eral
Adm
inis
trat
ion:
M
onito
ring
and
Follo
w U
p
Gen
eral
Adm
inis
trat
ion:
Ce
ntra
l Lab
orat
orie
s, En
viro
nmen
t and
Qua
lity
Assu
ranc
e
Gen
eral
Adm
inis
trat
ion:
Tra
inin
g
Com
mer
cial
sect
orFi
nanc
ial a
nd a
dmin
istr
ativ
e se
ctor
Sani
tatio
n se
ctor
Ope
ratio
n, m
aint
enan
ce a
nddi
strib
utio
n se
ctor
Tech
nica
l sup
port
sect
or
Ger
eral
Dep
t.Cu
stom
erSe
rvic
es
Subs
crip
tions
and
met
ers
Gen
eral
Dep
t.Re
venu
e
Gen
eral
Dep
t.Fi
nanc
e
Gen
eral
Dep
t.H
uman
reso
urce
s
Gen
eral
Dep
t.Co
ntra
ctin
g an
d pu
rcha
se
Gen
eral
Dep
t.Ad
min
istr
ativ
e A�
airs
Gen
eral
Dep
t.St
ores
Gen
eral
Dep
t.N
etw
orks
Gen
eral
Dep
t.Pr
oduc
tion
Gen
eral
Dep
t.Sa
nita
tion:
Nor
th
Gen
eral
Dep
t.Sa
nita
tion:
Sou
th
Gen
eral
Dep
t.Sa
nita
tion:
Cen
tral
Gen
eral
Adm
in.:
tech
nica
l
Gen
eral
Adm
in.:
othe
r tec
hnic
al
Gen
eral
Adm
in.:
Gen
eral
Adm
in.:
sani
tatio
n te
ch.
Gen
eral
Adm
in.:
wat
er te
chni
cal
Figu
re1
0Or
gani
satio
nal s
tructu
re of
FADW
ASC,
Apr
il 20
09
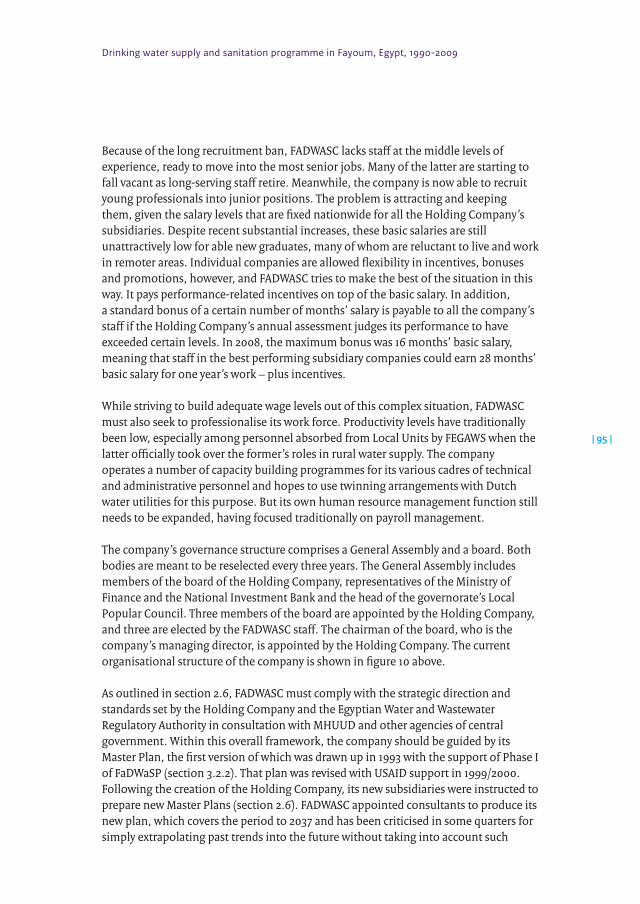
Drinking water supply and sanitation programme in Fayoum, Egypt, 1990-2009
| 95 |
Because of the long recruitment ban, FADWASC lacks staff at the middle levels of experience, ready to move into the most senior jobs. Many of the latter are starting to fall vacant as long-serving staff retire. Meanwhile, the company is now able to recruit young professionals into junior positions. The problem is attracting and keeping them, given the salary levels that are fixed nationwide for all the Holding Company’s subsidiaries. Despite recent substantial increases, these basic salaries are still unattractively low for able new graduates, many of whom are reluctant to live and work in remoter areas. Individual companies are allowed flexibility in incentives, bonuses and promotions, however, and FADWASC tries to make the best of the situation in this way. It pays performance-related incentives on top of the basic salary. In addition, a standard bonus of a certain number of months’ salary is payable to all the company’s staff if the Holding Company’s annual assessment judges its performance to have exceeded certain levels. In 2008, the maximum bonus was 16 months’ basic salary, meaning that staff in the best performing subsidiary companies could earn 28 months’ basic salary for one year’s work – plus incentives.
While striving to build adequate wage levels out of this complex situation, FADWASC must also seek to professionalise its work force. Productivity levels have traditionally been low, especially among personnel absorbed from Local Units by FEGAWS when the latter officially took over the former’s roles in rural water supply. The company operates a number of capacity building programmes for its various cadres of technical and administrative personnel and hopes to use twinning arrangements with Dutch water utilities for this purpose. But its own human resource management function still needs to be expanded, having focused traditionally on payroll management.
The company’s governance structure comprises a General Assembly and a board. Both bodies are meant to be reselected every three years. The General Assembly includes members of the board of the Holding Company, representatives of the Ministry of Finance and the National Investment Bank and the head of the governorate’s Local Popular Council. Three members of the board are appointed by the Holding Company, and three are elected by the FADWASC staff. The chairman of the board, who is the company’s managing director, is appointed by the Holding Company. The current organisational structure of the company is shown in figure 10 above.
As outlined in section 2.6, FADWASC must comply with the strategic direction and standards set by the Holding Company and the Egyptian Water and Wastewater Regulatory Authority in consultation with MHUUD and other agencies of central government. Within this overall framework, the company should be guided by its Master Plan, the first version of which was drawn up in 1993 with the support of Phase I of FaDWaSP (section 3.2.2). That plan was revised with USAID support in 1999/2000. Following the creation of the Holding Company, its new subsidiaries were instructed to prepare new Master Plans (section 2.6). FADWASC appointed consultants to produce its new plan, which covers the period to 2037 and has been criticised in some quarters for simply extrapolating past trends into the future without taking into account such
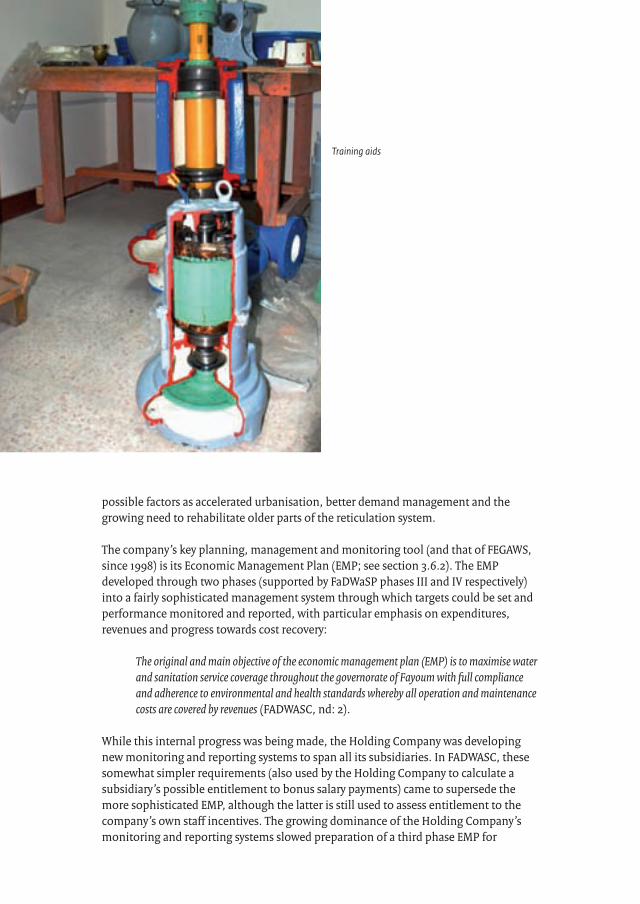
| 96 |
possible factors as accelerated urbanisation, better demand management and the growing need to rehabilitate older parts of the reticulation system.
The company’s key planning, management and monitoring tool (and that of FEGAWS, since 1998) is its Economic Management Plan (EMP; see section 3.6.2). The EMP developed through two phases (supported by FaDWaSP phases III and IV respectively) into a fairly sophisticated management system through which targets could be set and performance monitored and reported, with particular emphasis on expenditures, revenues and progress towards cost recovery:
The original and main objective of the economic management plan (EMP) is to maximise water and sanitation service coverage throughout the governorate of Fayoum with full compliance and adherence to environmental and health standards whereby all operation and maintenance costs are covered by revenues (FADWASC, nd: 2).
While this internal progress was being made, the Holding Company was developing new monitoring and reporting systems to span all its subsidiaries. In FADWASC, these somewhat simpler requirements (also used by the Holding Company to calculate a subsidiary’s possible entitlement to bonus salary payments) came to supersede the more sophisticated EMP, although the latter is still used to assess entitlement to the company’s own staff incentives. The growing dominance of the Holding Company’s monitoring and reporting systems slowed preparation of a third phase EMP for
Training aids
Drinking water supply and sanitation programme in Fayoum, Egypt, 1990-2009
| 97 |
FADWASC, although this process has been launched with FaDWaSP support. The new system comprises a basic planning model for the company’s operations, permitting modelling of scenarios and decision making about, for example, setting tariffs or installing additional capacity. Further revisions will convert the EMP into an overall management information system (MIS) for the company.
Enhanced management information systems are just one aspect of multiple operational improvements that FADWASC is steadily achieving. The company has probably the best geographical information system of any water and sanitation utility in Egypt (some of its maps are reproduced in this study). It has achieved significantly higher efficiency in its commercial and financial systems, for example in its customer billing and related database management. It is making steady progress in the enhanced technical opera-tion of its water and wastewater treatment and reticulation systems, for example with the introduction of automatic supervisory control and data acquisition (SCADA) procedures. Several aspects of these improvements have helped it to get to grips with the major issue of unaccounted-for water (section 4.2). However, as noted above, much remains to be done.
FADWASC’s role requires an extensive presence across the whole governorate. The two key recurrent functions are commercial (meter reading, billing, arranging new accounts and connections etc.) and maintenance. Branch Customer Offices (BCOs) in each of the six districts of Fayoum provide the first set of services. (There is no BCO in Youssef El Seddik, the seventh and newest district, which is still served from Ibshway.) Each of the six original districts also has a technical centre from which installation and maintenance services are provided. Improvements are steadily being made in communications between these district offices and headquarters in Fayoum City, although again this is work in progress: commercial information does not always flow smoothly and all bills are printed centrally, leading to delays. Similarly, main-tenance staff must often order materials from New El Azab, since local stores are limited. This causes delays too.
These are all indicators of an organisation that is still strongly centralised. A related challenge concerns communication: again, at all levels, different parts of the organisa-tion are insufficiently aware of each other’s activities and challenges, and data flows within the company are not yet optimised. The company’s functions are vertically structured from the field through to headquarters. There is no integrated management structure at district level, and staff of one section in a district office refer more to their superiors at headquarters than to their local colleagues in other sections. Of course, stronger integration of district level functions under a district manager would require competent personnel to be available for such posts – which is not easy given the current senior staffing gap in the company that was referred to above. A silo structure is also found at headquarters, although measures like the introduction of task forces represent an effort to introduce more horizontal structure and interdepartmental integration into the company.
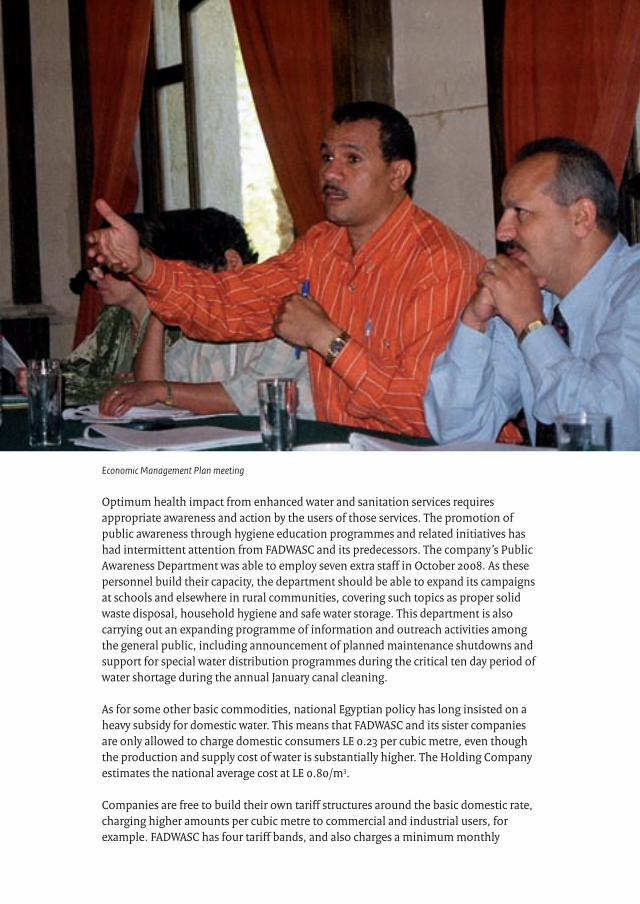
4 Rural water supply and sanitation in Fayoum, 2009
| 98 |
Optimum health impact from enhanced water and sanitation services requires appropriate awareness and action by the users of those services. The promotion of public awareness through hygiene education programmes and related initiatives has had intermittent attention from FADWASC and its predecessors. The company’s Public Awareness Department was able to employ seven extra staff in October 2008. As these personnel build their capacity, the department should be able to expand its campaigns at schools and elsewhere in rural communities, covering such topics as proper solid waste disposal, household hygiene and safe water storage. This department is also carrying out an expanding programme of information and outreach activities among the general public, including announcement of planned maintenance shutdowns and support for special water distribution programmes during the critical ten day period of water shortage during the annual January canal cleaning.
As for some other basic commodities, national Egyptian policy has long insisted on a heavy subsidy for domestic water. This means that FADWASC and its sister companies are only allowed to charge domestic consumers LE 0.23 per cubic metre, even though the production and supply cost of water is substantially higher. The Holding Company estimates the national average cost at LE 0.80/m3.
Companies are free to build their own tariff structures around the basic domestic rate, charging higher amounts per cubic metre to commercial and industrial users, for example. FADWASC has four tariff bands, and also charges a minimum monthly
Economic Management Plan meeting
Drinking water supply and sanitation programme in Fayoum, Egypt, 1990-2009
| 99 |
amount on the basis of an assumed 10 m3 of consumption – even if actual consump-tion was less. In fact, an estimated 60% of the company’s customers are paying for 10 m3 per month but consuming less. There are social, technical and economic reasons for this minimum charge. One is that, without it, the very poor would be tempted to cut their water consumption below safe levels. Another is that many of the water meters in Fayoum are not accurate enough to read very low levels of consumption. A further reason is that the minimum charge may encourage absent house owners to close their accounts. Finally, the company has significant fixed costs regardless of the volume of water sold, and this minimum charge helps it to meet them.
4.4.2 OtherinstitutionsAlthough FADWASC has the sole mandate for water and wastewater services in Fayoum, it must collaborate with a range of other institutions, for two reasons. First, of course, it does not work in an institutional vacuum, and must interact with other state and local government agencies and community-based organisations as it plays its role in society. Secondly, and more significantly, various institutions still have significant formal or informal roles in water and sanitation, despite FADWASC’s mandate. The efficiency, effectiveness and sustainability of the company’s operations depend on how those other roles are performed and how it interacts with them.
As explained in section 2.6, the governor plays a key central role in administration and service delivery. As personal representative of the President, he wields political power and budgetary resources. In Egypt’s political tradition, he can directly receive and directly act upon the people’s grievances. For a utility like FADWASC, he can therefore be a powerful ally or a fearsome critic. The current governor is described as playing the former role. The company chairman is in frequent contact with him, and he acts as a strong advocate and supporter of FADWASC’s efforts.
At community level, Local Units are the key institution with which the company must engage. Their present status with regard to water and sanitation typifies the nature of institutional change in Egypt. Official policy may change; actual practice adjusts only slowly. What is announced in Cairo or Fayoum City only gradually takes effect at local level. From the 1980s, the Shorouk national programme for integrated rural develop-ment had given Local Units a prominent role in improvements to primary services. Before the establishment of FEGAWS in 1996, Local Units thus played an active and official role in water supply, particularly in the installation and maintenance of local reticulation networks and in the evacuation of sewage tanks. FEGAWS was meant to take these roles over, and many technical staff were indeed transferred from Local Units to the General Authority, contributing to its overstaffing and human resource transformation challenges (section 3.3.3). According to FADWASC and FaDWaSP personnel, Local Units have no role in water system maintenance today, although they still play a vital community liaison function in the planning and installation of new services. The Holding Company states that, during this transitional period, it is willing to collaborate with any local structures that are willing to help. Until very
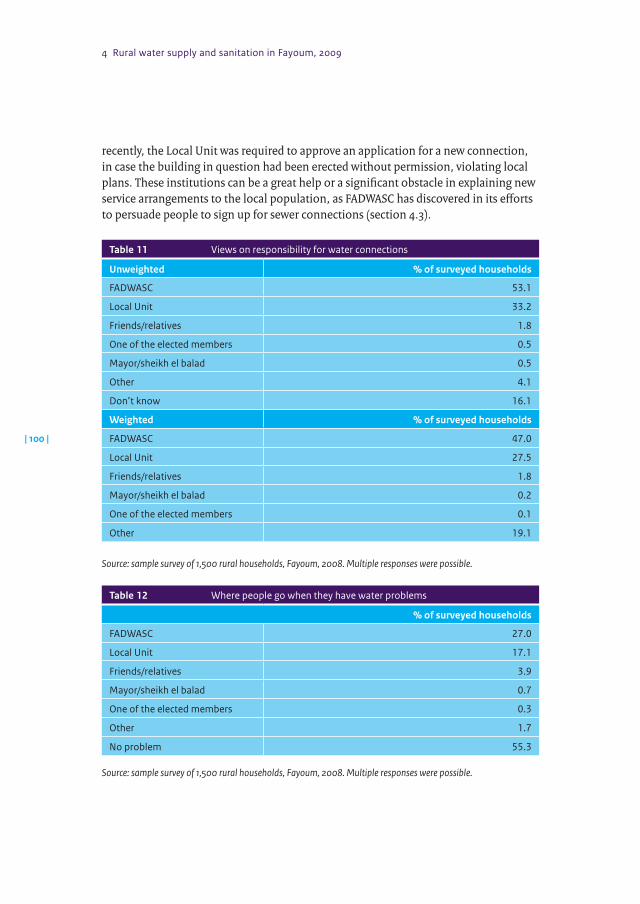
4 Rural water supply and sanitation in Fayoum, 2009
| 100 |
recently, the Local Unit was required to approve an application for a new connection, in case the building in question had been erected without permission, violating local plans. These institutions can be a great help or a significant obstacle in explaining new service arrangements to the local population, as FADWASC has discovered in its efforts to persuade people to sign up for sewer connections (section 4.3).
Table 11 Views on responsibility for water connections
Unweighted % of surveyed households
FADWASC 53.1
Local Unit 33.2
Friends/relatives 1.8
One of the elected members 0.5
Mayor/sheikh el balad 0.5
Other 4.1
Don’t know 16.1
Weighted % of surveyed households
FADWASC 47.0
Local Unit 27.5
Friends/relatives 1.8
Mayor/sheikh el balad 0.2
One of the elected members 0.1
Other 19.1
Source: sample survey of 1,500 rural households, Fayoum, 2008. Multiple responses were possible.
Table 12 Where people go when they have water problems
% of surveyed households
FADWASC 27.0
Local Unit 17.1
Friends/relatives 3.9
Mayor/sheikh el balad 0.7
One of the elected members 0.3
Other 1.7
No problem 55.3
Source: sample survey of 1,500 rural households, Fayoum, 2008. Multiple responses were possible.
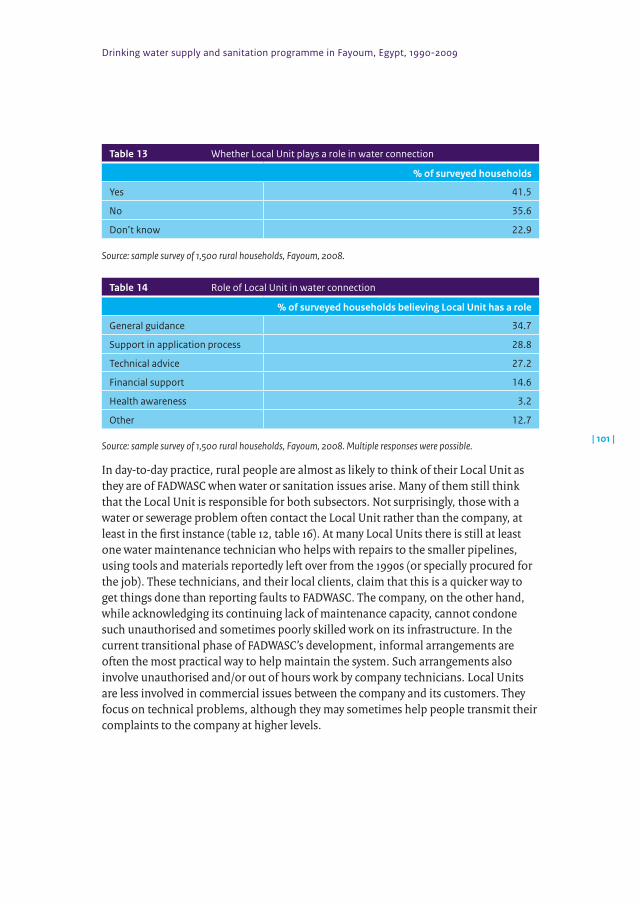
Drinking water supply and sanitation programme in Fayoum, Egypt, 1990-2009
| 101 |
Table 13 Whether Local Unit plays a role in water connection
% of surveyed households
Yes 41.5
No 35.6
Don’t know 22.9
Source: sample survey of 1,500 rural households, Fayoum, 2008.
Table 14 Role of Local Unit in water connection
% of surveyed households believing Local Unit has a role
General guidance 34.7
Support in application process 28.8
Technical advice 27.2
Financial support 14.6
Health awareness 3.2
Other 12.7
Source: sample survey of 1,500 rural households, Fayoum, 2008. Multiple responses were possible.
In day-to-day practice, rural people are almost as likely to think of their Local Unit as they are of FADWASC when water or sanitation issues arise. Many of them still think that the Local Unit is responsible for both subsectors. Not surprisingly, those with a water or sewerage problem often contact the Local Unit rather than the company, at least in the first instance (table 12, table 16). At many Local Units there is still at least one water maintenance technician who helps with repairs to the smaller pipelines, using tools and materials reportedly left over from the 1990s (or specially procured for the job). These technicians, and their local clients, claim that this is a quicker way to get things done than reporting faults to FADWASC. The company, on the other hand, while acknowledging its continuing lack of maintenance capacity, cannot condone such unauthorised and sometimes poorly skilled work on its infrastructure. In the current transitional phase of FADWASC’s development, informal arrangements are often the most practical way to help maintain the system. Such arrangements also involve unauthorised and/or out of hours work by company technicians. Local Units are less involved in commercial issues between the company and its customers. They focus on technical problems, although they may sometimes help people transmit their complaints to the company at higher levels.
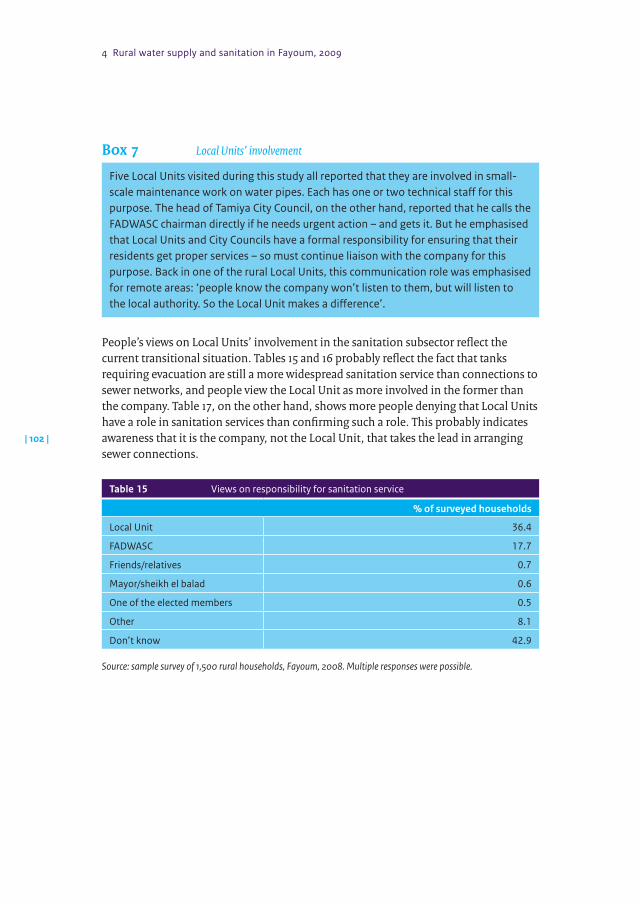
4 Rural water supply and sanitation in Fayoum, 2009
| 102 |
Box7 Local Units’ involvement
Five Local Units visited during this study all reported that they are involved in small-scale maintenance work on water pipes. Each has one or two technical staff for this purpose. The head of Tamiya City Council, on the other hand, reported that he calls the FADWASC chairman directly if he needs urgent action – and gets it. But he emphasised that Local Units and City Councils have a formal responsibility for ensuring that their residents get proper services – so must continue liaison with the company for this purpose. Back in one of the rural Local Units, this communication role was emphasised for remote areas: ‘people know the company won’t listen to them, but will listen to the local authority. So the Local Unit makes a difference’.
People’s views on Local Units’ involvement in the sanitation subsector reflect the current transitional situation. Tables 15 and 16 probably reflect the fact that tanks requiring evacuation are still a more widespread sanitation service than connections to sewer networks, and people view the Local Unit as more involved in the former than the company. Table 17, on the other hand, shows more people denying that Local Units have a role in sanitation services than confirming such a role. This probably indicates awareness that it is the company, not the Local Unit, that takes the lead in arranging sewer connections.
Table 15 Views on responsibility for sanitation service
% of surveyed households
Local Unit 36.4
FADWASC 17.7
Friends/relatives 0.7
Mayor/sheikh el balad 0.6
One of the elected members 0.5
Other 8.1
Don’t know 42.9
Source: sample survey of 1,500 rural households, Fayoum, 2008. Multiple responses were possible.
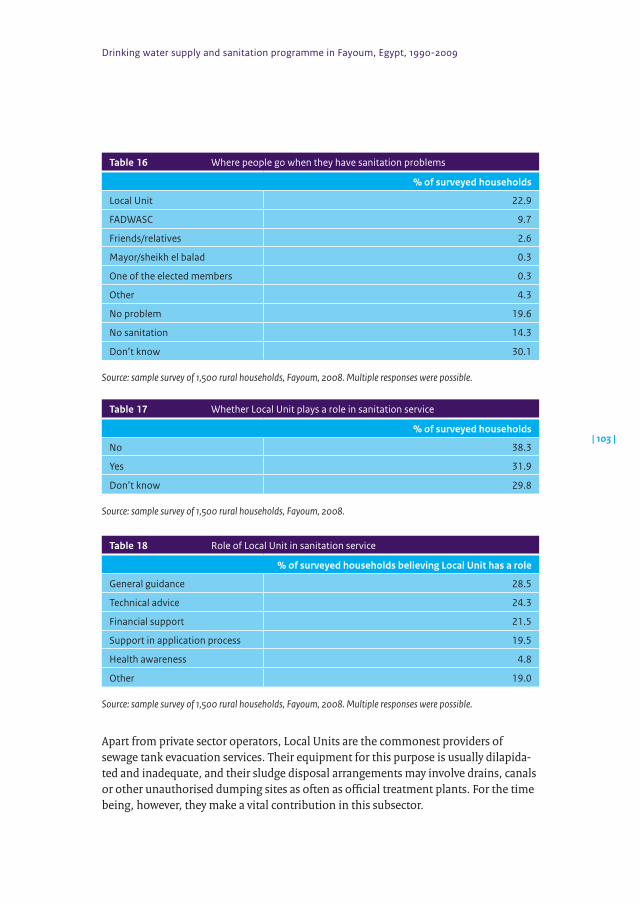
Drinking water supply and sanitation programme in Fayoum, Egypt, 1990-2009
| 103 |
Table 16 Where people go when they have sanitation problems
% of surveyed households
Local Unit 22.9
FADWASC 9.7
Friends/relatives 2.6
Mayor/sheikh el balad 0.3
One of the elected members 0.3
Other 4.3
No problem 19.6
No sanitation 14.3
Don’t know 30.1
Source: sample survey of 1,500 rural households, Fayoum, 2008. Multiple responses were possible.
Table 17 Whether Local Unit plays a role in sanitation service
% of surveyed households
No 38.3
Yes 31.9
Don’t know 29.8
Source: sample survey of 1,500 rural households, Fayoum, 2008.
Table 18 Role of Local Unit in sanitation service
% of surveyed households believing Local Unit has a role
General guidance 28.5
Technical advice 24.3
Financial support 21.5
Support in application process 19.5
Health awareness 4.8
Other 19.0
Source: sample survey of 1,500 rural households, Fayoum, 2008. Multiple responses were possible.
Apart from private sector operators, Local Units are the commonest providers of sewage tank evacuation services. Their equipment for this purpose is usually dilapida-ted and inadequate, and their sludge disposal arrangements may involve drains, canals or other unauthorised dumping sites as often as official treatment plants. For the time being, however, they make a vital contribution in this subsector.
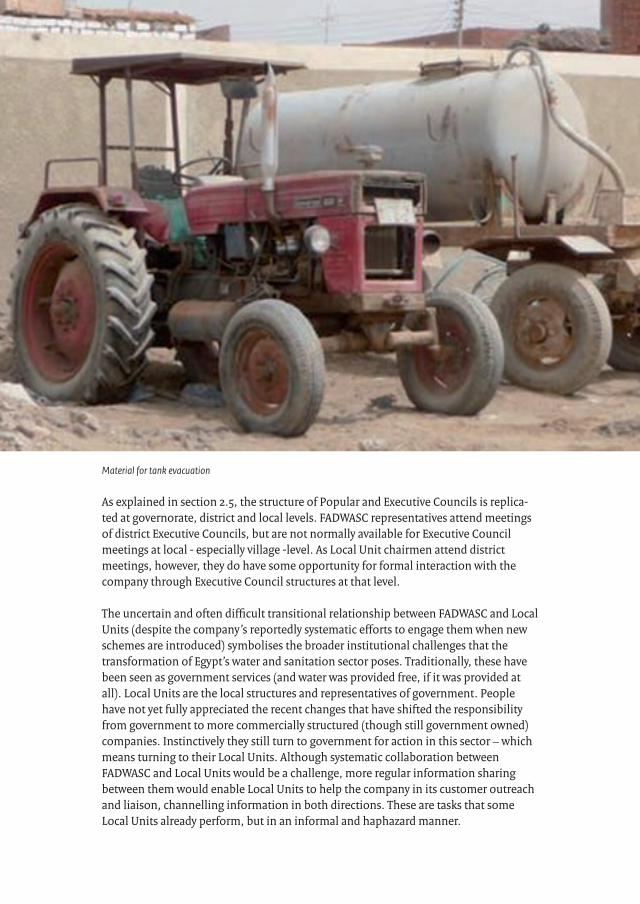
4 Rural water supply and sanitation in Fayoum, 2009
| 104 |
As explained in section 2.5, the structure of Popular and Executive Councils is replica-ted at governorate, district and local levels. FADWASC representatives attend meetings of district Executive Councils, but are not normally available for Executive Council meetings at local - especially village -level. As Local Unit chairmen attend district meetings, however, they do have some opportunity for formal interaction with the company through Executive Council structures at that level.
The uncertain and often difficult transitional relationship between FADWASC and Local Units (despite the company’s reportedly systematic efforts to engage them when new schemes are introduced) symbolises the broader institutional challenges that the transformation of Egypt’s water and sanitation sector poses. Traditionally, these have been seen as government services (and water was provided free, if it was provided at all). Local Units are the local structures and representatives of government. People have not yet fully appreciated the recent changes that have shifted the responsibility from government to more commercially structured (though still government owned) companies. Instinctively they still turn to government for action in this sector – which means turning to their Local Units. Although systematic collaboration between FADWASC and Local Units would be a challenge, more regular information sharing between them would enable Local Units to help the company in its customer outreach and liaison, channelling information in both directions. These are tasks that some Local Units already perform, but in an informal and haphazard manner.
Material for tank evacuation
Drinking water supply and sanitation programme in Fayoum, Egypt, 1990-2009
| 105 |
There are many Community Development Associations in Fayoum, as throughout Egypt. They currently play little direct role in the water and wastewater subsectors, although some do have tractors and trailers with which they evacuate sewage tanks for a fee. Many CDAs have or had links to external development agencies and projects (notably CARE) and have been able to attract funding for local water, sanitation and environmental health initiatives. These sometimes involve assistance to the poorest households in arranging water and sewer connections or in the construction of sewage tanks. There is a general consensus at community level that Local Units and CDAs should work together to serve the people: the former with their mandate as a govern-ment agency and the latter with their volunteer commitment to help the disadvantaged.
Box8 The Seila Community Development Association
Established in 1981, this CDA has 480 members and a board of 11 professional or prominent people. It participated in a CARE project across seven governorates to help the very poor get water connections. It supported 90 households in this way. With support from the Social Fund for Development it acquired three tractors, three trailers and one loader for a garbage collection service that visits households every 25 days and charges LE 1 per month. The CDA receives many complaints from the public about water and sanitation, and transmits these to the Local Unit. It would like to get involved in sewage evacuation, but has not yet been able to do so. It also believes that it could manage public taps if FADWASC were to reopen them.
As reported above, CDAs’ work in garbage collection is now more significant for the overall environmental health of rural communities. By default they are often the leading agency for this important function, although their aggregate capacity is far less than the demand for the service and disposal arrangements at dumps and landfill sites are typically inadequate.
Because of its dependence on irrigation, Egypt has experienced intensive institutional development for local water resource management. Branch Canal Water User Associations have been established in many areas. Fayoum was a pioneer in this process, having established its first such body, a Local Water Board, with support from the Dutch-funded Fayoum Water Management Project in 1995. Although formally recognised by ministerial decree, these associations do not have official legal status and are therefore not authorised to collect or hold funds. Locally elected to cover the command area of a secondary canal, they represent irrigated water users and village residents. They are meant to facilitate and enhance local water management, for example by resolving disputes between users and promoting proper technical control of the infrastructure. Another of their roles is liaison with the Ministry of Water Resources and Irrigation.
4 Rural water supply and sanitation in Fayoum, 2009
| 106 |
WUAs have been launched over the last few years in all irrigation districts of Fayoum to co-ordinate and represent the users of irrigation water. They are concerned with wastewater disposal and treatment too, because improper disposal of sewage or on-site sanitation tank overflows into canals and drains is so common. Furthermore, properly treated effluent from wastewater plants becomes an irrigation resource. In some communities WUAs take direct action to tackle the pollution of canals and drains, approaching offenders and urging them to make alternative arrangements. One WUA visited during this study had gone further and facilitated community action to provide land for a new wastewater treatment plant. Again because of concern about pollution or blockage of the irrigation system, WUAs may also help to tackle garbage disposal problems, sometimes in association with CDAs.
WUAs, CDAs and to some extent Local Units may thus form an institutional nexus around environmental health issues that affect the impact of improved water and wastewater services. WUAs and CDAs may be particularly important in the management of small local wastewater treatment schemes for communities that cannot easily be connected to the main sewer networks. In Fayoum, the Ministry of Water Resources and Irrigation piloted one such scheme at Abdel Karim Issa. There were a number of initial technical and institutional problems, compounded by poor liaison with FADWASC. Most of these problems have since been ironed out, although clarity has yet to emerge on a local institutional structure to operate the facility. In November 2008 it was transferred to the Senouris Local Unit (FaDWaSP, 2009a: 10). Overall, many institutional challenges still have to be tackled with regard to the management of small sewage treatment schemes. The recent FaDWaSP study of small communities in the Sanhour area found that ‘there is generally very little experience with community organisations in the 11 villages’ and that only one had a registered CDA ‘that would be able to manage a local sewerage system’ (El Shorbagi, 2008: 65).
A key question for this impact evaluation is whether institutional structures and roles with regard to domestic water and sanitation are clearly defined, understood and fulfilled in Fayoum. The answer is that the people and their institutions are still in a state of transition towards that clarity. The official position is clear, at least to that minority of the Fayoum (or any) population who know what laws and policies say. It is not yet completely understood or fulfilled. In this transitional phase there is much local ambiguity. There are many ad hoc arrangements in order to make the best use of available capacity for the operation and maintenance of water and sanitation systems. As FADWASC grows stronger, the ambiguity and ad hoc measures will fall away – although for some years a majority of the rural population will still need the services of various local agencies and private operators to evacuate sewage tanks. The greatest uncertainty now, as outlined above, concerns institutional arrangements for small, isolated wastewater treatment facilities.
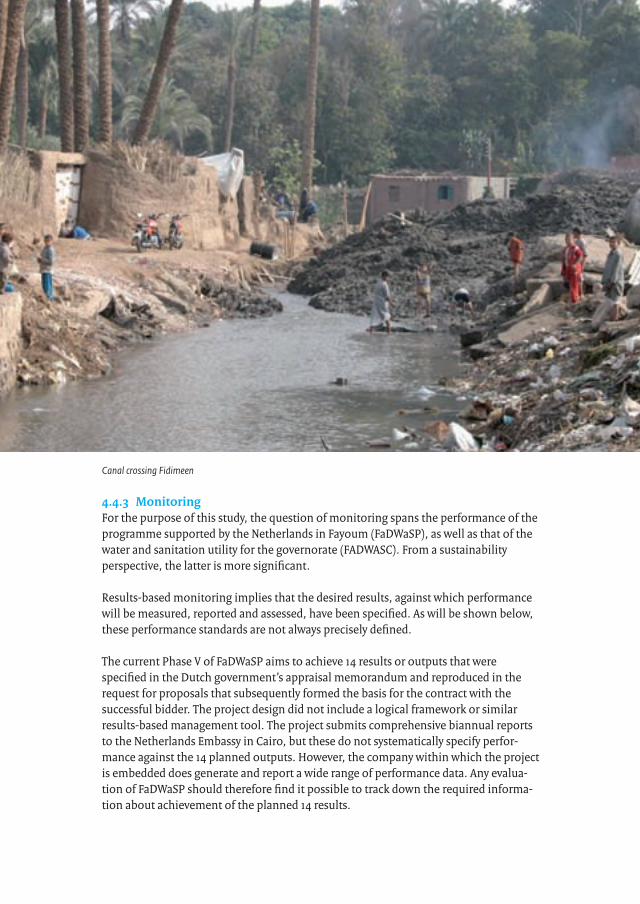
Drinking water supply and sanitation programme in Fayoum, Egypt, 1990-2009
| 107 |
4.4.3 MonitoringFor the purpose of this study, the question of monitoring spans the performance of the programme supported by the Netherlands in Fayoum (FaDWaSP), as well as that of the water and sanitation utility for the governorate (FADWASC). From a sustainability perspective, the latter is more significant.
Results-based monitoring implies that the desired results, against which performance will be measured, reported and assessed, have been specified. As will be shown below, these performance standards are not always precisely defined.
The current Phase V of FaDWaSP aims to achieve 14 results or outputs that were specified in the Dutch government’s appraisal memorandum and reproduced in the request for proposals that subsequently formed the basis for the contract with the successful bidder. The project design did not include a logical framework or similar results-based management tool. The project submits comprehensive biannual reports to the Netherlands Embassy in Cairo, but these do not systematically specify perfor-mance against the 14 planned outputs. However, the company within which the project is embedded does generate and report a wide range of performance data. Any evalua-tion of FaDWaSP should therefore find it possible to track down the required informa-tion about achievement of the planned 14 results.
Canal crossing Fidimeen
4 Rural water supply and sanitation in Fayoum, 2009
| 108 |
FaDWaSP effectively focuses more on the company’s results-based management than on its own. From the company’s perspective, the desired results and performance have three dimensions. The first is coverage: delivering the required water and wastewater services, ideally, to the whole population of the governorate. This means not only providing the required connections to every household, but achieving three related targets: adequate water pressure at all times, adequate water quality in terms of prescribed standards, and technically efficient operations with minimal breakdowns. The second dimension of performance is cost recovery: revenues received from service users should first exceed the utility’s operation and maintenance costs, and should then rise to cover depreciation, too. Thirdly, the company’s desired performance should be reflected in customer satisfaction, measured primarily in terms of declining numbers of complaints registered by a system that gives people full scope to report their concerns – as well as accelerated resolution of these complaints.
As explained in section 4.4.1, most of the results towards which FADWASC strives are specified in two overlapping performance frameworks. The company’s Economic Management Plan is linked to its annual planning and performance targets and is now being subsumed into a comprehensive management information system. A second, simpler set of performance indicators is specified by the Holding Company and forms the basis of FADWASC’s monthly and quarterly reporting to the company. FADWASC’s MIS is now directly linked to the Holding Company, so that staff of the latter can obtain current data from Fayoum in real time. The overall performance targets and monito-ring indicators for the company are therefore clear and well known (see Annex 3, tables 3, 4 and 5). It is in staff’s interest to know these targets, since achieving them has a direct impact on how much money they earn through bonus payments. But the company does not yet have a fully integrated annual budget. Each department and section draws up its budget and targets, based on its plans but primarily referring to performance in the previous year and often setting the budget high so that it can later seem prudent when it is found not to have spent it all. The EMP provides a framework for this planning, but not a detailed annual guide.
Section 4.4.1 also outlined upgrades to FADWASC’s technical monitoring of its performance. Linked to the company’s well developed GIS, this means that the company can measure and map the extent and quality of its service coverage on at least a monthly basis. Detailed local monitoring of supply and interruptions cannot be fully automated, however. Reports on local bursts and breakdowns will still have to be made verbally. Furthermore, although the MIS is linked to Cairo, it is not linked to the company’s district offices, which must report to Fayoum City in writing. A company intranet that includes these district offices would significantly enhance information management.
Overall, the company’s monitoring of results and management are focused and effective. Particularly in terms of service delivery and cost recovery, it clearly knows what its targets are and how far it has managed to reach them. It can be seen from
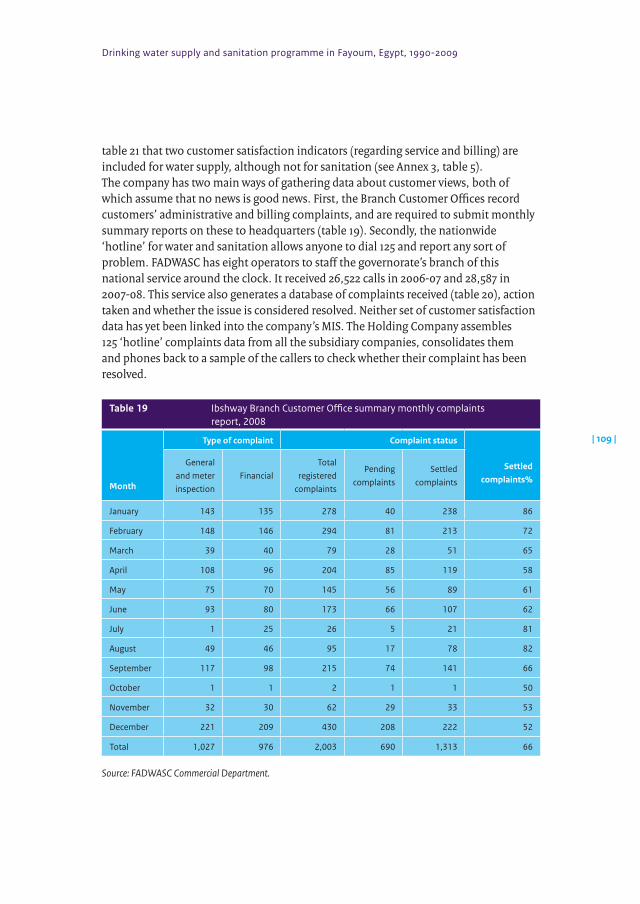
Drinking water supply and sanitation programme in Fayoum, Egypt, 1990-2009
| 109 |
table 21 that two customer satisfaction indicators (regarding service and billing) are included for water supply, although not for sanitation (see Annex 3, table 5). The company has two main ways of gathering data about customer views, both of which assume that no news is good news. First, the Branch Customer Offices record customers’ administrative and billing complaints, and are required to submit monthly summary reports on these to headquarters (table 19). Secondly, the nationwide ‘hotline’ for water and sanitation allows anyone to dial 125 and report any sort of problem. FADWASC has eight operators to staff the governorate’s branch of this national service around the clock. It received 26,522 calls in 2006-07 and 28,587 in 2007-08. This service also generates a database of complaints received (table 20), action taken and whether the issue is considered resolved. Neither set of customer satisfaction data has yet been linked into the company’s MIS. The Holding Company assembles 125 ‘hotline’ complaints data from all the subsidiary companies, consolidates them and phones back to a sample of the callers to check whether their complaint has been resolved.
Table 19 Ibshway Branch Customer Office summary monthly complaints report, 2008
Month
Type of complaint Complaint status
Settled complaints%
General and meter inspection
FinancialTotal
registered complaints
Pending complaints
Settled complaints
January 143 135 278 40 238 86
February 148 146 294 81 213 72
March 39 40 79 28 51 65
April 108 96 204 85 119 58
May 75 70 145 56 89 61
June 93 80 173 66 107 62
July 1 25 26 5 21 81
August 49 46 95 17 78 82
September 117 98 215 74 141 66
October 1 1 2 1 1 50
November 32 30 62 29 33 53
December 221 209 430 208 222 52
Total 1,027 976 2,003 690 1,313 66
Source: FADWASC Commercial Department.
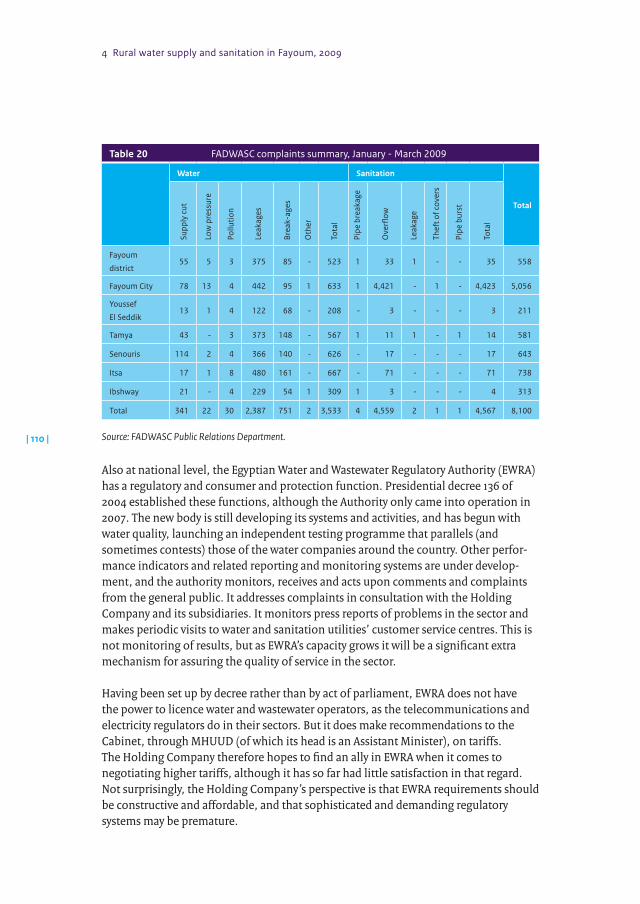
4 Rural water supply and sanitation in Fayoum, 2009
| 110 |
Table 20 FADWASC complaints summary, January - March 2009
Water Sanitation
Total
Supp
ly c
ut
Low
pre
ssur
e
Pollu
tion
Leak
ages
Brea
k-ag
es
Oth
er
Tota
l
Pipe
bre
akag
e
Ove
rflow
Leak
age
Theft
of c
over
s
Pipe
bur
st
Tota
l
Fayoum
district55 5 3 375 85 - 523 1 33 1 - - 35 558
Fayoum City 78 13 4 442 95 1 633 1 4,421 - 1 - 4,423 5,056
Youssef
El Seddik13 1 4 122 68 - 208 - 3 - - - 3 211
Tamya 43 - 3 373 148 - 567 1 11 1 - 1 14 581
Senouris 114 2 4 366 140 - 626 - 17 - - - 17 643
Itsa 17 1 8 480 161 - 667 - 71 - - - 71 738
Ibshway 21 - 4 229 54 1 309 1 3 - - - 4 313
Total 341 22 30 2,387 751 2 3,533 4 4,559 2 1 1 4,567 8,100
Source: FADWASC Public Relations Department.
Also at national level, the Egyptian Water and Wastewater Regulatory Authority (EWRA) has a regulatory and consumer and protection function. Presidential decree 136 of 2004 established these functions, although the Authority only came into operation in 2007. The new body is still developing its systems and activities, and has begun with water quality, launching an independent testing programme that parallels (and sometimes contests) those of the water companies around the country. Other perfor-mance indicators and related reporting and monitoring systems are under develop-ment, and the authority monitors, receives and acts upon comments and complaints from the general public. It addresses complaints in consultation with the Holding Company and its subsidiaries. It monitors press reports of problems in the sector and makes periodic visits to water and sanitation utilities’ customer service centres. This is not monitoring of results, but as EWRA’s capacity grows it will be a significant extra mechanism for assuring the quality of service in the sector.
Having been set up by decree rather than by act of parliament, EWRA does not have the power to licence water and wastewater operators, as the telecommunications and electricity regulators do in their sectors. But it does make recommendations to the Cabinet, through MHUUD (of which its head is an Assistant Minister), on tariffs. The Holding Company therefore hopes to find an ally in EWRA when it comes to negotiating higher tariffs, although it has so far had little satisfaction in that regard. Not surprisingly, the Holding Company’s perspective is that EWRA requirements should be constructive and affordable, and that sophisticated and demanding regulatory systems may be premature.
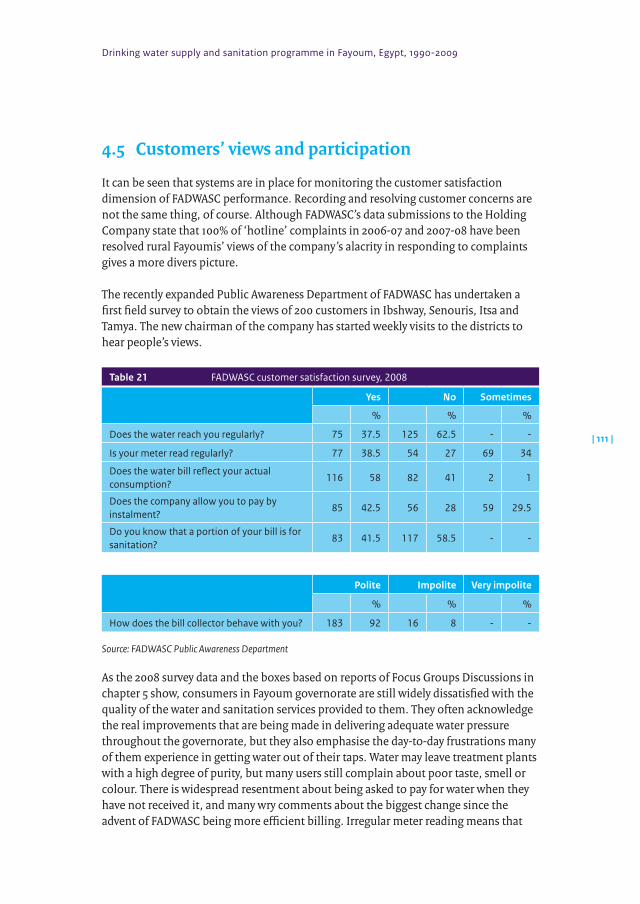
Drinking water supply and sanitation programme in Fayoum, Egypt, 1990-2009
| 111 |
4.5 Customers’viewsandparticipation
It can be seen that systems are in place for monitoring the customer satisfaction dimension of FADWASC performance. Recording and resolving customer concerns are not the same thing, of course. Although FADWASC’s data submissions to the Holding Company state that 100% of ‘hotline’ complaints in 2006-07 and 2007-08 have been resolved rural Fayoumis’ views of the company’s alacrity in responding to complaints gives a more divers picture.
The recently expanded Public Awareness Department of FADWASC has undertaken a first field survey to obtain the views of 200 customers in Ibshway, Senouris, Itsa and Tamya. The new chairman of the company has started weekly visits to the districts to hear people’s views.
Table 21 FADWASC customer satisfaction survey, 2008
Yes No Sometimes
% % %
Does the water reach you regularly? 75 37.5 125 62.5 - -
Is your meter read regularly? 77 38.5 54 27 69 34
Does the water bill reflect your actual consumption?
116 58 82 41 2 1
Does the company allow you to pay by instalment?
85 42.5 56 28 59 29.5
Do you know that a portion of your bill is for sanitation?
83 41.5 117 58.5 - -
Polite Impolite Very impolite
% % %
How does the bill collector behave with you? 183 92 16 8 - -
Source: FADWASC Public Awareness Department
As the 2008 survey data and the boxes based on reports of Focus Groups Discussions in chapter 5 show, consumers in Fayoum governorate are still widely dissatisfied with the quality of the water and sanitation services provided to them. They often acknowledge the real improvements that are being made in delivering adequate water pressure throughout the governorate, but they also emphasise the day-to-day frustrations many of them experience in getting water out of their taps. Water may leave treatment plants with a high degree of purity, but many users still complain about poor taste, smell or colour. There is widespread resentment about being asked to pay for water when they have not received it, and many wry comments about the biggest change since the advent of FADWASC being more efficient billing. Irregular meter reading means that
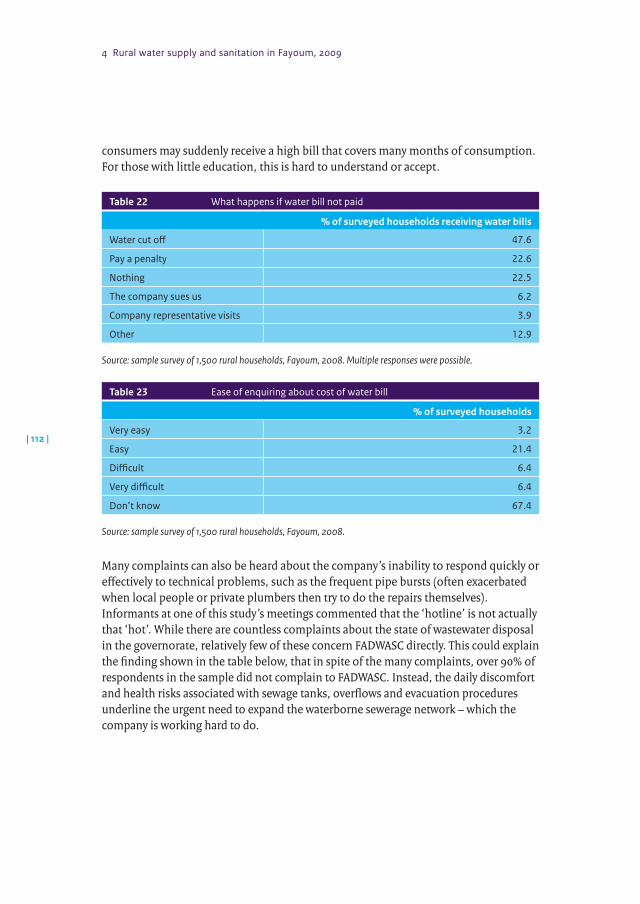
4 Rural water supply and sanitation in Fayoum, 2009
| 112 |
consumers may suddenly receive a high bill that covers many months of consumption. For those with little education, this is hard to understand or accept.
Table 22 What happens if water bill not paid
% of surveyed households receiving water bills
Water cut off 47.6
Pay a penalty 22.6
Nothing 22.5
The company sues us 6.2
Company representative visits 3.9
Other 12.9
Source: sample survey of 1,500 rural households, Fayoum, 2008. Multiple responses were possible.
Table 23 Ease of enquiring about cost of water bill
% of surveyed households
Very easy 3.2
Easy 21.4
Difficult 6.4
Very difficult 6.4
Don’t know 67.4
Source: sample survey of 1,500 rural households, Fayoum, 2008.
Many complaints can also be heard about the company’s inability to respond quickly or effectively to technical problems, such as the frequent pipe bursts (often exacerbated when local people or private plumbers then try to do the repairs themselves). Informants at one of this study’s meetings commented that the ‘hotline’ is not actually that ‘hot’. While there are countless complaints about the state of wastewater disposal in the governorate, relatively few of these concern FADWASC directly. This could explain the finding shown in the table below, that in spite of the many complaints, over 90% of respondents in the sample did not complain to FADWASC. Instead, the daily discomfort and health risks associated with sewage tanks, overflows and evacuation procedures underline the urgent need to expand the waterborne sewerage network – which the company is working hard to do.
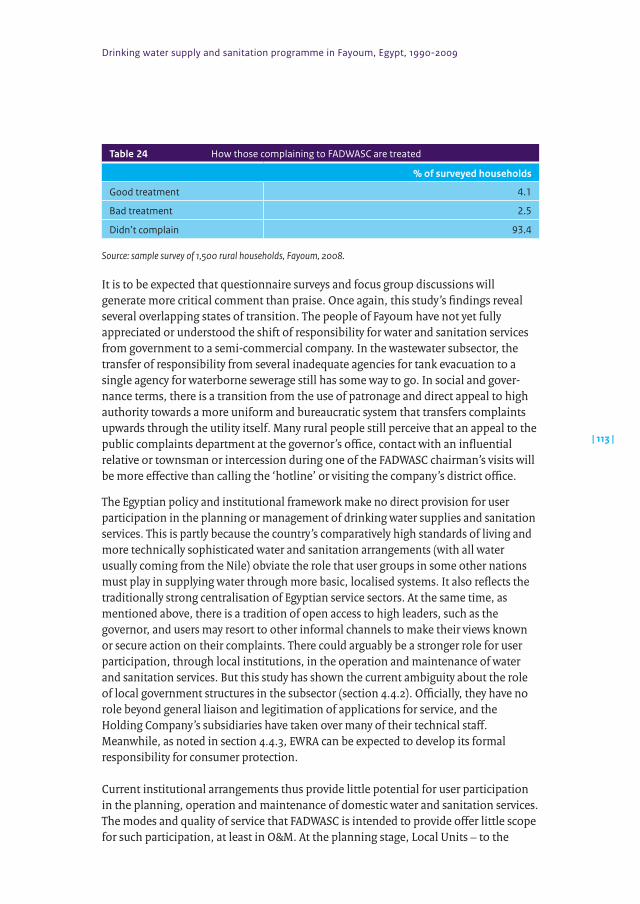
Drinking water supply and sanitation programme in Fayoum, Egypt, 1990-2009
| 113 |
Table 24 How those complaining to FADWASC are treated
% of surveyed households
Good treatment 4.1
Bad treatment 2.5
Didn’t complain 93.4
Source: sample survey of 1,500 rural households, Fayoum, 2008.
It is to be expected that questionnaire surveys and focus group discussions will generate more critical comment than praise. Once again, this study’s findings reveal several overlapping states of transition. The people of Fayoum have not yet fully appreciated or understood the shift of responsibility for water and sanitation services from government to a semi-commercial company. In the wastewater subsector, the transfer of responsibility from several inadequate agencies for tank evacuation to a single agency for waterborne sewerage still has some way to go. In social and gover-nance terms, there is a transition from the use of patronage and direct appeal to high authority towards a more uniform and bureaucratic system that transfers complaints upwards through the utility itself. Many rural people still perceive that an appeal to the public complaints department at the governor’s office, contact with an influential relative or townsman or intercession during one of the FADWASC chairman’s visits will be more effective than calling the ‘hotline’ or visiting the company’s district office.
The Egyptian policy and institutional framework make no direct provision for user participation in the planning or management of drinking water supplies and sanitation services. This is partly because the country’s comparatively high standards of living and more technically sophisticated water and sanitation arrangements (with all water usually coming from the Nile) obviate the role that user groups in some other nations must play in supplying water through more basic, localised systems. It also reflects the traditionally strong centralisation of Egyptian service sectors. At the same time, as mentioned above, there is a tradition of open access to high leaders, such as the governor, and users may resort to other informal channels to make their views known or secure action on their complaints. There could arguably be a stronger role for user participation, through local institutions, in the operation and maintenance of water and sanitation services. But this study has shown the current ambiguity about the role of local government structures in the subsector (section 4.4.2). Officially, they have no role beyond general liaison and legitimation of applications for service, and the Holding Company’s subsidiaries have taken over many of their technical staff. Meanwhile, as noted in section 4.4.3, EWRA can be expected to develop its formal responsibility for consumer protection.
Current institutional arrangements thus provide little potential for user participation in the planning, operation and maintenance of domestic water and sanitation services. The modes and quality of service that FADWASC is intended to provide offer little scope for such participation, at least in O&M. At the planning stage, Local Units – to the
4 Rural water supply and sanitation in Fayoum, 2009
| 114 |
extent that these can be considered representative bodies – do have a role to play. This role extends to liaison in the construction and connection of new services. Depending on local politics and attitudes, the current relationship between Local Units and the company ranges from collaboration to confrontation. Returning to our theme of transition, there could be a tendency to assume that FADWASC’s sole mandate and constantly growing technical expertise mean that it can do it alone in its field operati-ons. For some years to come, this will be far from true. Even when the company has all the resources it needs to operate and maintain a full water and wastewater service throughout the governorate, liaison with other local institutions will remain neces-sary. For the transitional phase and for the longer term, more structured relations would help to optimise this liaison. Making the company’s participation in Local Executive Council meetings at district level more effective, and ultimately extending it to Executive Council meetings at Local Unit level, would be one such step. Developing consultative structures for regular consumer liaison would be another.
4.6 Summary
The water supply network now covers more than 90% of households in Fayoum governorate. A major turning point was the commissioning of the New El Azab treatment plant in 2000, which turned a deficit into a surplus. Increasing demand since then is being met with the construction of additional treatment facilities. However, much remains to be done to ensure that all consumers enjoy adequate water pressure at all times and that their water is of adequate quality. A continuing challenge is the still high proportion of unaccounted-for water – the difference between the volume produced and the volume on which revenue is generated.
The emphasis of Dutch support has now shifted to the urgent expansion of the waterborne sewerage network: FADWASC’s target is 56% coverage by 2011. The new waterborne sewer connections are generally working well. But so far, most Fayoumis must still depend on conservancy tanks. It remains uncertain how sewerage services should be provided to people in the smallest settlements. Various technical, financing and O&M options are currently being investigated.
The Fayoum Drinking Water and Sanitation Company has just passed its fifth anniversary. It can celebrate substantial progress on many fronts. But it must also tackle many ongoing challenges in what must still be considered a transitional phase towards full technical competence and commercial viability. One of these is human resource development: professionalising and restructuring the work force, which was unable to grow at senior levels during a long moratorium on hiring such staff. Another major area of development concerns planning, budgeting and management information systems, now increasingly linked to the Holding Company’s monitoring programme. Good progress has been made in the administration of customer accounts, although the company’s ability to cover its costs and depreciation is greatly constrained by
Drinking water supply and sanitation programme in Fayoum, Egypt, 1990-2009
| 115 |
national policy on basic tariffs and the increasing burden of the rapidly expanding wastewater systems. Although the company has customer service offices and main-tenance depots in all districts of the governorate, it remains strongly centralised. Communications between departments at headquarters and district levels, as well as with the public, all need to be strengthened. Recent reinforcement of the FADWASC Public Awareness Department should help achieve the latter goal.
Efficient and effective performance by FADWASC depends on successful interaction with a number of local institutions. The governor plays a central role in liaison with all government authorities, as well as the public. At community level, Local Units are the key institution with which the company must engage. At the current transitional stage of local institutional development for the sector, they have more of a role in practice than official policy allows, and are still seen by many consumers as playing an impor-tant part in the installation and operation of water and sanitation connections and networks. Part of the current necessary transition in consumer perception concerns the shift from water as a free service provided by the government to a commodity that users must buy from a more commercially oriented organisation. The widespread Community Development Associations and the growing number of irrigated water user associations play important complementary roles affecting environmental health factors – such as garbage disposal and canal pollution - that in turn influence how far improved water and wastewater services can achieve their intended beneficial impacts.
People and local institutions in Fayoum are thus still in a state of transition towards clear definition, understanding and fulfilment of institutional structures and roles with regard to water supply and sanitation. Research during this evaluation revealed widespread dissatisfaction with the current standards of water supply. People acknow-ledge the real improvements that are being made in delivering adequate water pressure throughout the governorate, but they also emphasise the day-to-day frustrations many of them experience in getting water out of their taps. Water may leave treatment plants with a high degree of purity, but many users still complain about poor taste, smell or colour. There are many complaints about being asked to pay for water when it has not been received, and about the way in which the company’s billing efficiency has apparently outpaced its delivery efficiency.
The minority of the rural population with connections to waterborne sewerage networks are generally well satisfied with these services. The majority who lack them are regularly confronted with the inadequacy of the older systems that they still have to use. Arrangements to empty sewage tanks are generally inadequate, and many health and environmental problems arise from leaks, overflows and insanitary evacuation and disposal arrangements.
FADWASC is steadily enhancing its monitoring of results. Monitoring focuses on coverage, cost recovery and customer satisfaction. Monitoring data are fed into the company’s internal management processes, guided by its Economic Management Plan
4 Rural water supply and sanitation in Fayoum, 2009
| 116 |
and its emerging management information system, and into those of the Holding Company in Cairo. Systems are in place to register customer complaints made at district offices or on the telephone ‘hotline’, and to record and check on the resolution of the issues raised. FADWASC has a less structured approach with regard to obtaining the general views of the public, although its recently expanded Public Awareness Department has done a first customer satisfaction survey.
Current institutional arrangements provide little potential for user participation in the planning, operation and maintenance of domestic water and sanitation services. The nature of the technology means that direct consumer responsibility for O&M will never be appropriate. But better structured and more intensive relations between the company and Local Units would be beneficial, as would the development of consulta-tive structures for regular consumer liaison.

Drinking water supply and sanitation programme in Fayoum, Egypt, 1990-2009
| 117 |
5
Impact analysis
Drinking water supply and sanitation programme in Fayoum, Egypt, 1990-2009
| 119 |
5.1 Introduction
This chapter analyses the impact of the water and sanitation programme in Fayoum Governorate. It addresses the evaluation questions 12-21 listed in section 1.2 under ‘Outcomes and Impact’. The chapter is organised as follows. First the data sources and the sample properties of the surveys are described. Then, in section 5.2 the survey evidence on access to a household connection for water supply, water quality and quantity of water consumed is presented. Section 5.3 presents survey evidence on access to sanitary facilities, whereas section 5.4 addresses the distribution of facilities over socio-economic groups. Section 5.5 presents evidence on hygiene practices and section 5.6 on time use for collecting water and use of time savings. Section 5.7 uses statistical impact evaluation to analyse the impact on health. Section 5.8 summarises the results and presents conclusions. It also discusses any unintended effects. Here the question which interventions work ‘best’ is addressed.
Data from several sources have been used in the analysis.
1) Household survey. A survey was conducted in October-December 2008 among a total of 1500 households from 150 locations (hamlets and village blocks) in 77 Fayoum villages: 45 locations from the district of Ibshway, 10 from Fayoum district, 80 from Itsa, 7 from Tamya, and 8 from Sennuris. The locations, comprising approximately 200 households, were selected randomly. The sample is representative for the rural population of the governorate. The households were interviewed individually by enumerators using a structured questionnaire. Apart from household characteristics (roster, housing quality, assets), the questionnaire addresses their recent health situation, water-related questions (source, use, storage), sanitation and garbage disposal, hygiene practices and awareness, and their opinions about the water, sanitation and hygiene (WASH) services they experience.
2) Community and school survey. The community survey (administered in each of the 77 villages) established the availability of schools, health services, transport and other services. The survey contained extensive questions about the water supply and sanitation facilities in the community. These covered the functioning of the water system (water pressure, system failures, maintenance), the perceived water quality (taste and smell), coverage of the sanitation system, overflow problems, signs of high groundwater as well as information on local schools. The school information covers the water supply and sanitation at the school as well as the position in the curriculum of lessons on hygiene (e.g. hand-washing).
3) Focus group discussions. In each village additional qualitative information was collected in focus group discussions. There were between 5 and 10 participants, either all men or all women. The discussions covered: water sources, water disposal, sanitation, hygiene training and medical services.
5 Impact analysis
| 120 |
4) Data collection at health units. There were 43 health units in the 77 villages. Each of these units was visited. The units’ records were checked for cases of bilharzia or diarrhoea in the past year and these were recorded if the patient came from one of the sample locations. This provides a base year prevalence measure which, it should be noted, is not specific to the sample households but to their locations.
5) School bilharzia prevalence. Bilharzia tests are supposed to be administered at the beginning of the school year. Positive test results were recorded, together with the location of the pupils involved.
6) Water samples: quality, quantity and location. In each cluster tap water was tested. In addition, for all 1500 sample households, samples were taken from their ‘main water source’. In most cases this was tap water stored in a container. Water was tested on total dissolved solids, turbidity, acidity (pH), chlorine and the presence of coliform bacteria (spot counts).
Sample propertiesThe samples cover the entire governorate Fayoum, excluding the city of Fayoum. Hence the sample population is largely ‘rural’, but district towns are included. For the sampling the governorate was subdivided into ‘locations’ of approximately 100 house-holds. The sampling took place in two stages: first locations were sampled randomly and in the second stage 10 households were randomly selected from the sampled location. Fifty locations were selected randomly to answer questions on programme outcomes. Another 100 locations from the districts Itsa and Ibshway were sampled to assess programme outcomes up to 2008 as well as health outcomes in 2009. (50 locations were expected to be affected and another 50 not affected by programme sewerage connection and improvement of water pressure interventions in 2008/2009.) Households in areas to be affected by these project interventions in 2008/2009 were to be interviewed twice. A first questionnaire was administered in 2008 and a second survey was to take place at the end of 2009. Following delays in implementation of the planned interventions the second round of surveys could not take place in 2009. This has limited the data for impact analysis. In total 150 locations were sampled. Most respondents were either household head (37%) or husband/wife of the household head (47%); two-thirds of the respondents were female. The average age of the respondents was 41. Household sizes ranged between 1 and 25 with an average of 6 persons per household. Last education level attended was reported for 63% of the members of interviewed households aged 13 or higher; highest level attended was primary education in 14% of the cases and secondary in 43%.
The main statistical tool used in this chapter is regression (see also the methodology section in the Terms of Reference). Regression is used in two different ways. First to demonstrate correlation; a significant ‘coefficient’ in a regression using data from a representative sample indicates that there is correlation in the population between variables of interest. However, regression analysis is more powerful than the calculation
Drinking water supply and sanitation programme in Fayoum, Egypt, 1990-2009
| 121 |
of correlation coefficients; in particular, by including possibly confounding variables in the regression, the relationship between variables of interest can be studied much more convincingly. For instance, it is possible to control for location variables, observed or unobserved, by means of ‘fixed effects’ regression. Thus a relationship found is not driven by accidental location differences. The second way to use regression is to argue that a causal relationship exists, e.g., that safe water provision improves health out-comes. This approach is followed in section 5.7. However, causality is much harder to establish than correlation. Therefore the results of section 5.7 should be interpreted with caution.
5.2 Accesstoahouseholdconnectionandqualityandquantityofwaterconsumed
Evaluation question 12: What has been the change in the proportion of the rural population of Fayoum with access to an improved water source/ household connection since 1990?The percentage of households with a house connection has increased from around 30% in 1990 to 93% in 2008. Water from the network is now virtually the only source of drinking water.
At the time of the survey 93.5% of the population had a piped connection to the water network into their home or yard. The figure below shows that around two thirds of the population in Fayoum obtained their connection after 1990. This amounts to approxi-mately 300,000 households. Most have connections to their homes, whereas some have a pipe into their yard or plot. Those without a connection obtain their water mostly from a public tap. Moreover, household connections were present in virtually all the sampled locations. Therefore, access to the water network is now almost universal.
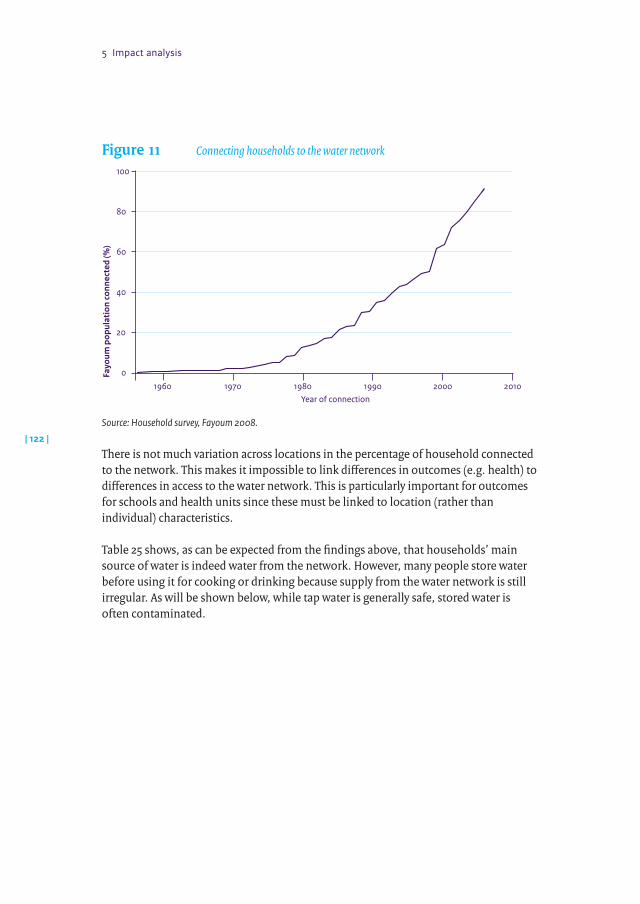
5 Impact analysis
| 122 |
Figure11 Connecting households to the water network
1960 1970 1980 1990 2000 2010
Fayo
um p
opul
atio
n co
nnec
ted
(%)
100
80
60
40
20
0
Year of connection
Source: Household survey, Fayoum 2008.
There is not much variation across locations in the percentage of household connected to the network. This makes it impossible to link differences in outcomes (e.g. health) to differences in access to the water network. This is particularly important for outcomes for schools and health units since these must be linked to location (rather than individual) characteristics.
Table 25 shows, as can be expected from the findings above, that households’ main source of water is indeed water from the network. However, many people store water before using it for cooking or drinking because supply from the water network is still irregular. As will be shown below, while tap water is generally safe, stored water is often contaminated.
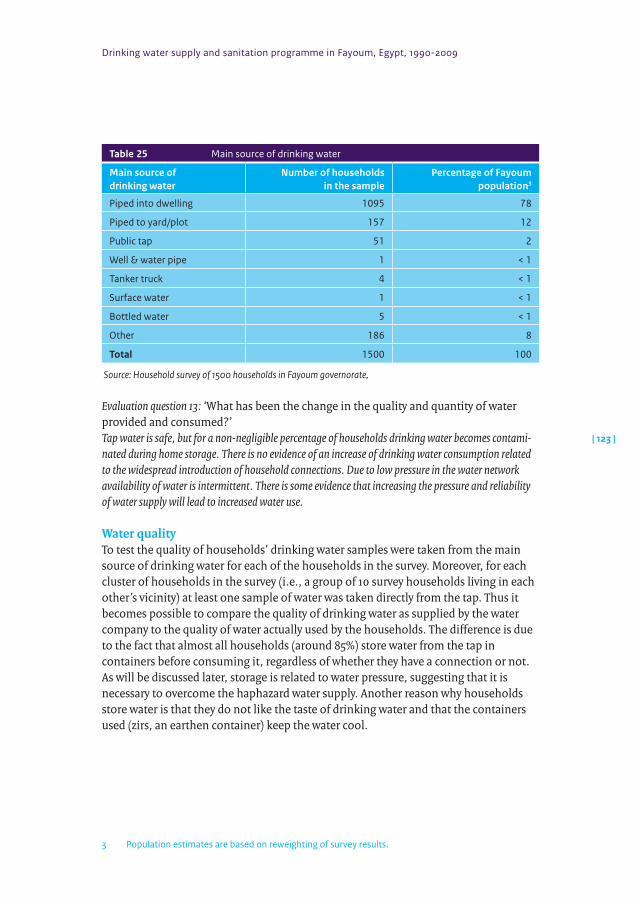
Drinking water supply and sanitation programme in Fayoum, Egypt, 1990-2009
| 123 |
Table 25 Main source of drinking water
Main source of drinking water
Number of households in the sample
Percentage of Fayoum population3
Piped into dwelling 1095 78
Piped to yard/plot 157 12
Public tap 51 2
Well & water pipe 1 < 1
Tanker truck 4 < 1
Surface water 1 < 1
Bottled water 5 < 1
Other 186 8
Total 1500 100
Source: Household survey of 1500 households in Fayoum governorate, 3
Evaluation question 13: ‘What has been the change in the quality and quantity of water provided and consumed?’Tap water is safe, but for a non-negligible percentage of households drinking water becomes contami-nated during home storage. There is no evidence of an increase of drinking water consumption related to the widespread introduction of household connections. Due to low pressure in the water network availability of water is intermittent. There is some evidence that increasing the pressure and reliability of water supply will lead to increased water use.
WaterqualityTo test the quality of households’ drinking water samples were taken from the main source of drinking water for each of the households in the survey. Moreover, for each cluster of households in the survey (i.e., a group of 10 survey households living in each other’s vicinity) at least one sample of water was taken directly from the tap. Thus it becomes possible to compare the quality of drinking water as supplied by the water company to the quality of water actually used by the households. The difference is due to the fact that almost all households (around 85%) store water from the tap in containers before consuming it, regardless of whether they have a connection or not. As will be discussed later, storage is related to water pressure, suggesting that it is necessary to overcome the haphazard water supply. Another reason why households store water is that they do not like the taste of drinking water and that the containers used (zirs, an earthen container) keep the water cool.
3 Population estimates are based on reweighting of survey results.
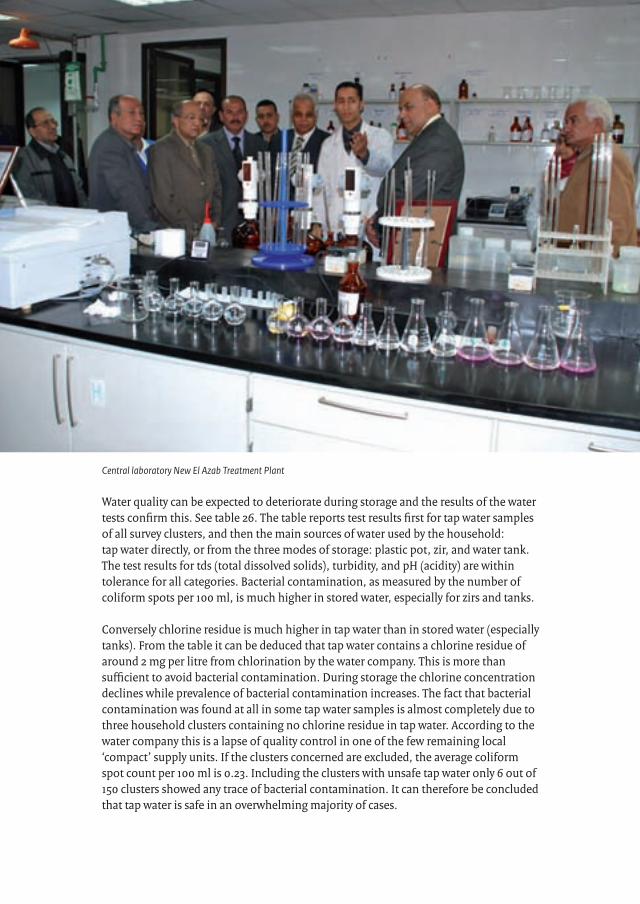
5 Impact analysis
| 124 |
Water quality can be expected to deteriorate during storage and the results of the water tests confirm this. See table 26. The table reports test results first for tap water samples of all survey clusters, and then the main sources of water used by the household: tap water directly, or from the three modes of storage: plastic pot, zir, and water tank. The test results for tds (total dissolved solids), turbidity, and pH (acidity) are within tolerance for all categories. Bacterial contamination, as measured by the number of coliform spots per 100 ml, is much higher in stored water, especially for zirs and tanks.
Conversely chlorine residue is much higher in tap water than in stored water (especially tanks). From the table it can be deduced that tap water contains a chlorine residue of around 2 mg per litre from chlorination by the water company. This is more than sufficient to avoid bacterial contamination. During storage the chlorine concentration declines while prevalence of bacterial contamination increases. The fact that bacterial contamination was found at all in some tap water samples is almost completely due to three household clusters containing no chlorine residue in tap water. According to the water company this is a lapse of quality control in one of the few remaining local ‘compact’ supply units. If the clusters concerned are excluded, the average coliform spot count per 100 ml is 0.23. Including the clusters with unsafe tap water only 6 out of 150 clusters showed any trace of bacterial contamination. It can therefore be concluded that tap water is safe in an overwhelming majority of cases.
Central laboratory New El Azab Treatment Plant
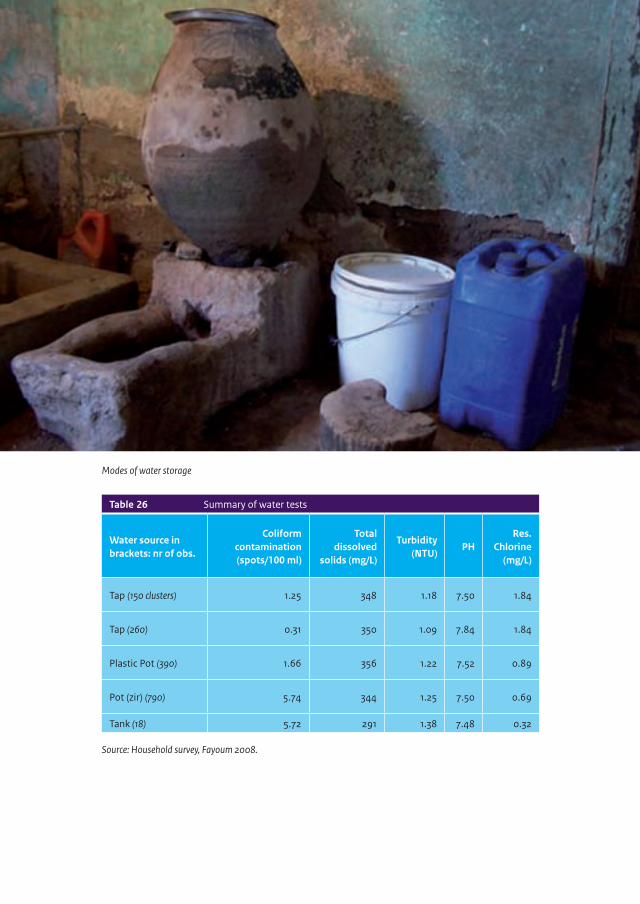
Drinking water supply and sanitation programme in Fayoum, Egypt, 1990-2009
| 125 |
Table 26 Summary of water tests
Water source in brackets: nr of obs.
Coliform contamination (spots/100 ml)
Total dissolved
solids (mg/L)
Turbidity (NTU)
PHRes.
Chlorine (mg/L)
Tap (150 clusters) 1.25 348 1.18 7.50 1.84
Tap (260) 0.31 350 1.09 7.84 1.84
Plastic Pot (390) 1.66 356 1.22 7.52 0.89
Pot (zir) (790) 5.74 344 1.25 7.50 0.69
Tank (18) 5.72 291 1.38 7.48 0.32
Source: Household survey, Fayoum 2008.
Modes of water storage
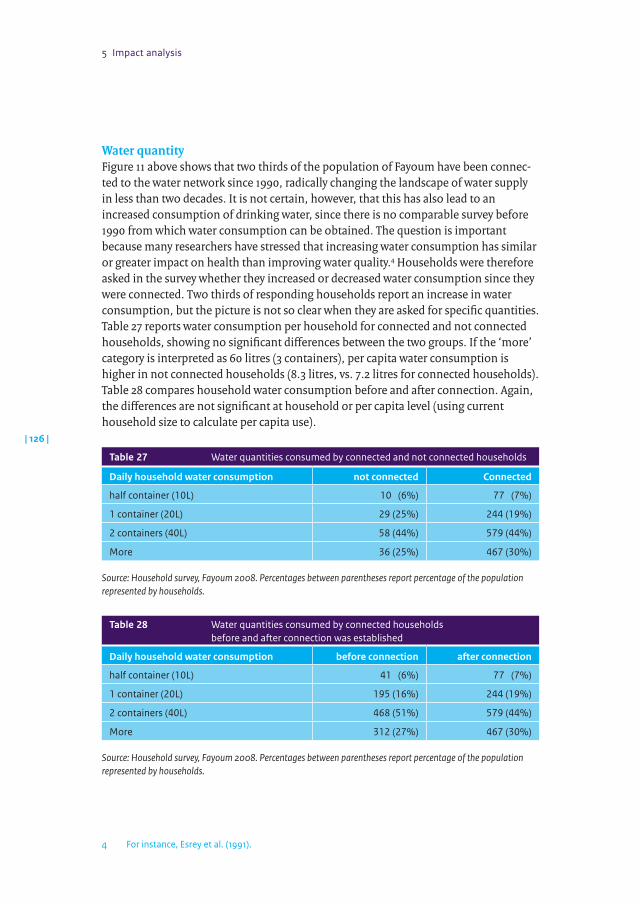
5 Impact analysis
| 126 |
WaterquantityFigure 11 above shows that two thirds of the population of Fayoum have been connec-ted to the water network since 1990, radically changing the landscape of water supply in less than two decades. It is not certain, however, that this has also lead to an increased consumption of drinking water, since there is no comparable survey before 1990 from which water consumption can be obtained. The question is important because many researchers have stressed that increasing water consumption has similar or greater impact on health than improving water quality.4 Households were therefore asked in the survey whether they increased or decreased water consumption since they were connected. Two thirds of responding households report an increase in water consumption, but the picture is not so clear when they are asked for specific quantities. Table 27 reports water consumption per household for connected and not connected households, showing no significant differences between the two groups. If the ‘more’ category is interpreted as 60 litres (3 containers), per capita water consumption is higher in not connected households (8.3 litres, vs. 7.2 litres for connected households). Table 28 compares household water consumption before and after connection. Again, the differences are not significant at household or per capita level (using current household size to calculate per capita use).
Table 27 Water quantities consumed by connected and not connected households
Daily household water consumption not connected Connected
half container (10L) 10 (6%) 77 (7%)
1 container (20L) 29 (25%) 244 (19%)
2 containers (40L) 58 (44%) 579 (44%)
More 36 (25%) 467 (30%)
Source: Household survey, Fayoum 2008. Percentages between parentheses report percentage of the population represented by households.
Table 28 Water quantities consumed by connected households before and after connection was established
Daily household water consumption before connection after connection
half container (10L) 41 (6%) 77 (7%)
1 container (20L) 195 (16%) 244 (19%)
2 containers (40L) 468 (51%) 579 (44%)
More 312 (27%) 467 (30%)
Source: Household survey, Fayoum 2008. Percentages between parentheses report percentage of the population represented by households.
4 For instance, Esrey et al. (1991).
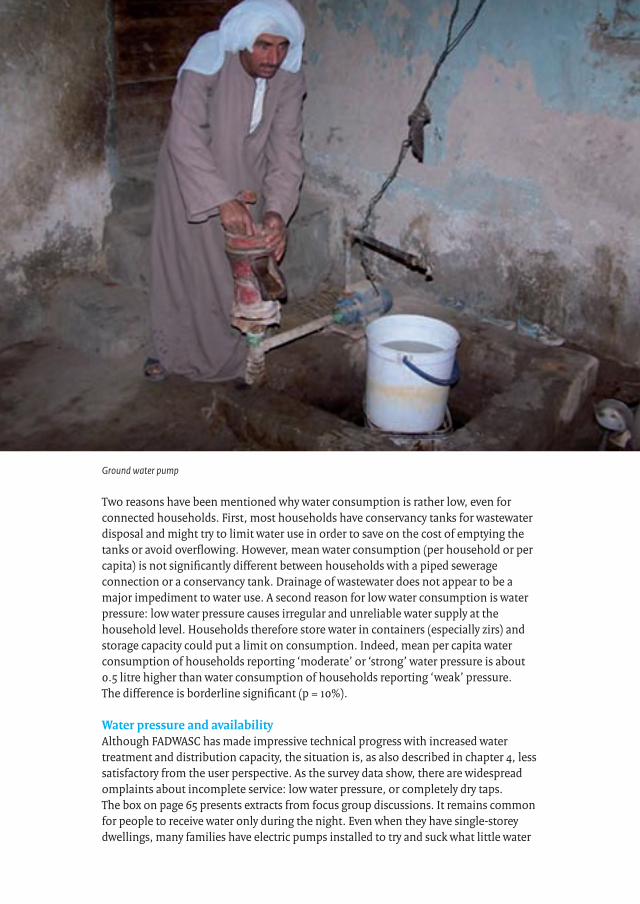
Drinking water supply and sanitation programme in Fayoum, Egypt, 1990-2009
| 127 |
Two reasons have been mentioned why water consumption is rather low, even for connected households. First, most households have conservancy tanks for wastewater disposal and might try to limit water use in order to save on the cost of emptying the tanks or avoid overflowing. However, mean water consumption (per household or per capita) is not significantly different between households with a piped sewerage connection or a conservancy tank. Drainage of wastewater does not appear to be a major impediment to water use. A second reason for low water consumption is water pressure: low water pressure causes irregular and unreliable water supply at the household level. Households therefore store water in containers (especially zirs) and storage capacity could put a limit on consumption. Indeed, mean per capita water consumption of households reporting ‘moderate’ or ‘strong’ water pressure is about 0.5 litre higher than water consumption of households reporting ‘weak’ pressure. The difference is borderline significant (p = 10%).
WaterpressureandavailabilityAlthough FADWASC has made impressive technical progress with increased water treatment and distribution capacity, the situation is, as also described in chapter 4, less satisfactory from the user perspective. As the survey data show, there are widespread omplaints about incomplete service: low water pressure, or completely dry taps. The box on page 65 presents extracts from focus group discussions. It remains common for people to receive water only during the night. Even when they have single-storey dwellings, many families have electric pumps installed to try and suck what little water
Ground water pump
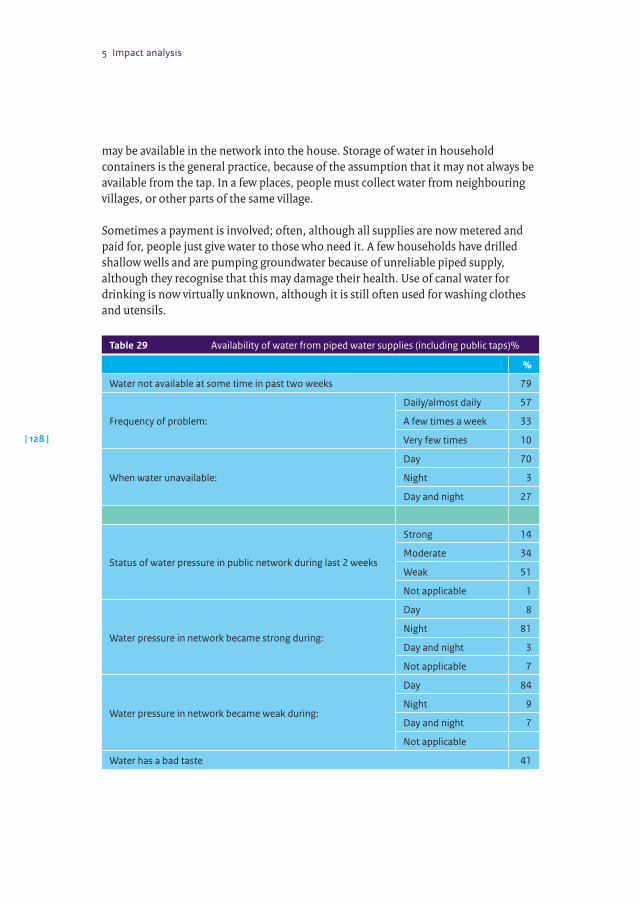
5 Impact analysis
| 128 |
may be available in the network into the house. Storage of water in household containers is the general practice, because of the assumption that it may not always be available from the tap. In a few places, people must collect water from neighbouring villages, or other parts of the same village.
Sometimes a payment is involved; often, although all supplies are now metered and paid for, people just give water to those who need it. A few households have drilled shallow wells and are pumping groundwater because of unreliable piped supply, although they recognise that this may damage their health. Use of canal water for drinking is now virtually unknown, although it is still often used for washing clothes and utensils.
Table 29 Availability of water from piped water supplies (including public taps)%
%
Water not available at some time in past two weeks 79
Frequency of problem:
Daily/almost daily 57
A few times a week 33
Very few times 10
When water unavailable:
Day 70
Night 3
Day and night 27
Status of water pressure in public network during last 2 weeks
Strong 14
Moderate 34
Weak 51
Not applicable 1
Water pressure in network became strong during:
Day 8
Night 81
Day and night 3
Not applicable 7
Water pressure in network became weak during:
Day 84
Night 9
Day and night 7
Not applicable
Water has a bad taste 41
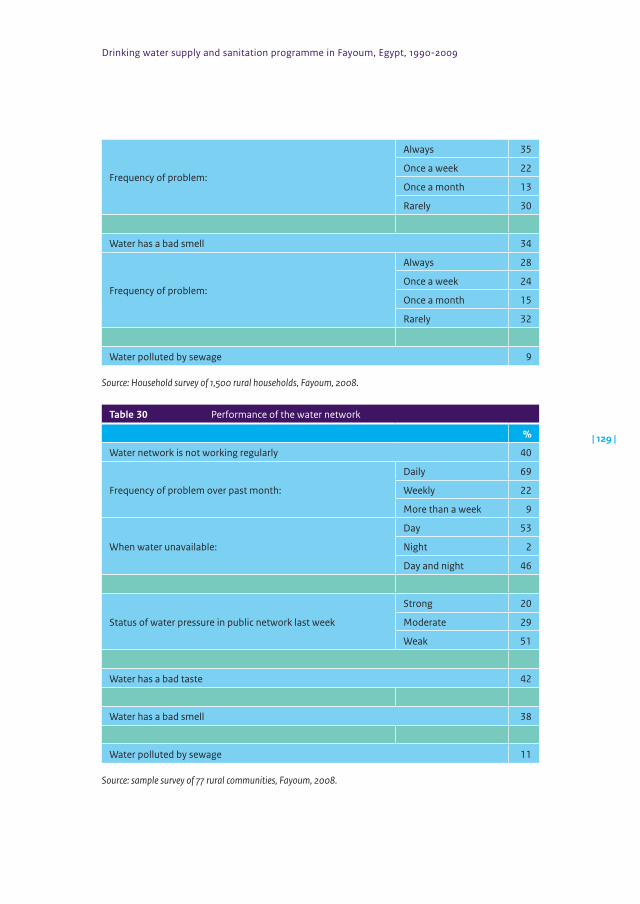
Drinking water supply and sanitation programme in Fayoum, Egypt, 1990-2009
| 129 |
Frequency of problem:
Always 35
Once a week 22
Once a month 13
Rarely 30
Water has a bad smell 34
Frequency of problem:
Always 28
Once a week 24
Once a month 15
Rarely 32
Water polluted by sewage 9
Source: Household survey of 1,500 rural households, Fayoum, 2008.
Table 30 Performance of the water network
%
Water network is not working regularly 40
Frequency of problem over past month:
Daily 69
Weekly 22
More than a week 9
When water unavailable:
Day 53
Night 2
Day and night 46
Status of water pressure in public network last week
Strong 20
Moderate 29
Weak 51
Water has a bad taste 42
Water has a bad smell 38
Water polluted by sewage 11
Source: sample survey of 77 rural communities, Fayoum, 2008.
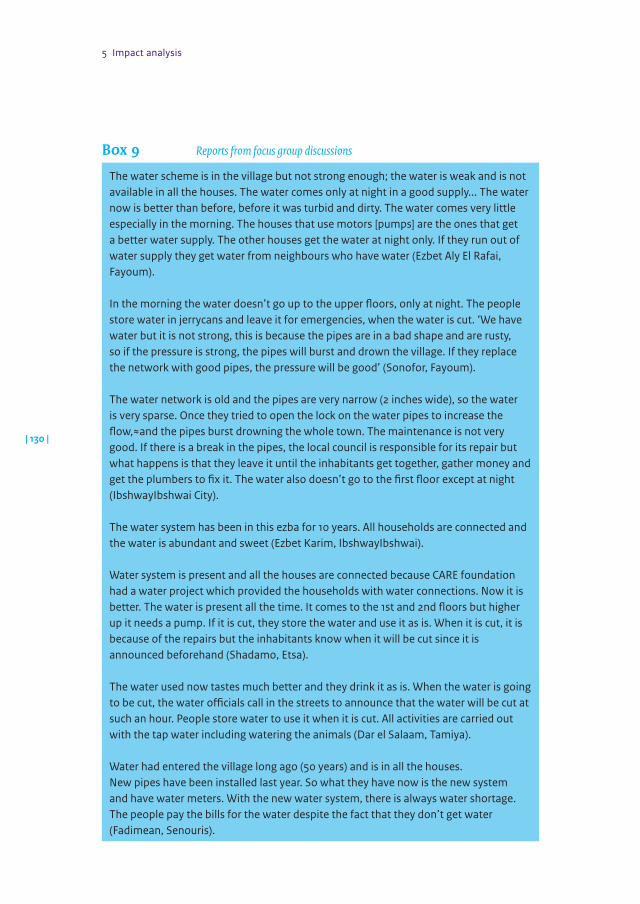
5 Impact analysis
| 130 |
Box9 Reports from focus group discussions
The water scheme is in the village but not strong enough; the water is weak and is not available in all the houses. The water comes only at night in a good supply... The water now is better than before, before it was turbid and dirty. The water comes very little especially in the morning. The houses that use motors [pumps] are the ones that get a better water supply. The other houses get the water at night only. If they run out of water supply they get water from neighbours who have water (Ezbet Aly El Rafai, Fayoum).
In the morning the water doesn’t go up to the upper floors, only at night. The people store water in jerrycans and leave it for emergencies, when the water is cut. ‘We have water but it is not strong, this is because the pipes are in a bad shape and are rusty, so if the pressure is strong, the pipes will burst and drown the village. If they replace the network with good pipes, the pressure will be good’ (Sonofor, Fayoum).
The water network is old and the pipes are very narrow (2 inches wide), so the water is very sparse. Once they tried to open the lock on the water pipes to increase the flow,≈and the pipes burst drowning the whole town. The maintenance is not very good. If there is a break in the pipes, the local council is responsible for its repair but what happens is that they leave it until the inhabitants get together, gather money and get the plumbers to fix it. The water also doesn’t go to the first floor except at night (IbshwayIbshwai City).
The water system has been in this ezba for 10 years. All households are connected and the water is abundant and sweet (Ezbet Karim, IbshwayIbshwai).
Water system is present and all the houses are connected because CARE foundation had a water project which provided the households with water connections. Now it is better. The water is present all the time. It comes to the 1st and 2nd floors but higher up it needs a pump. If it is cut, they store the water and use it as is. When it is cut, it is because of the repairs but the inhabitants know when it will be cut since it is announced beforehand (Shadamo, Etsa).
The water used now tastes much better and they drink it as is. When the water is going to be cut, the water officials call in the streets to announce that the water will be cut at such an hour. People store water to use it when it is cut. All activities are carried out with the tap water including watering the animals (Dar el Salaam, Tamiya).
Water had entered the village long ago (50 years) and is in all the houses. New pipes have been installed last year. So what they have now is the new system and have water meters. With the new water system, there is always water shortage. The people pay the bills for the water despite the fact that they don’t get water (Fadimean, Senouris).
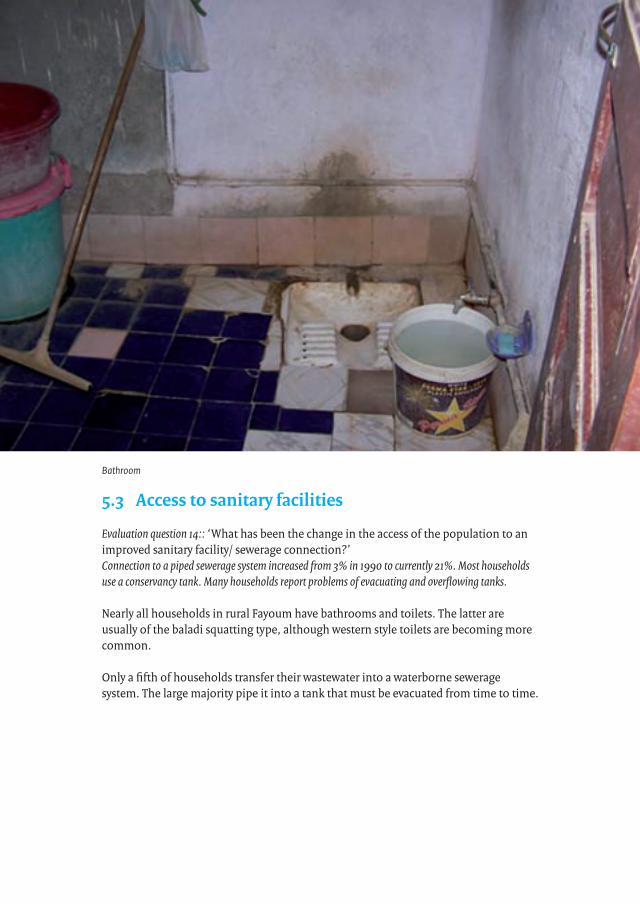
Drinking water supply and sanitation programme in Fayoum, Egypt, 1990-2009
| 131 |
5.3 Accesstosanitaryfacilities
Evaluation question 14:: ‘What has been the change in the access of the population to an improved sanitary facility/ sewerage connection?’Connection to a piped sewerage system increased from 3% in 1990 to currently 21%. Most households use a conservancy tank. Many households report problems of evacuating and overflowing tanks.
Nearly all households in rural Fayoum have bathrooms and toilets. The latter are usually of the baladi squatting type, although western style toilets are becoming more common.
Only a fifth of households transfer their wastewater into a waterborne sewerage system. The large majority pipe it into a tank that must be evacuated from time to time.
Bathroom
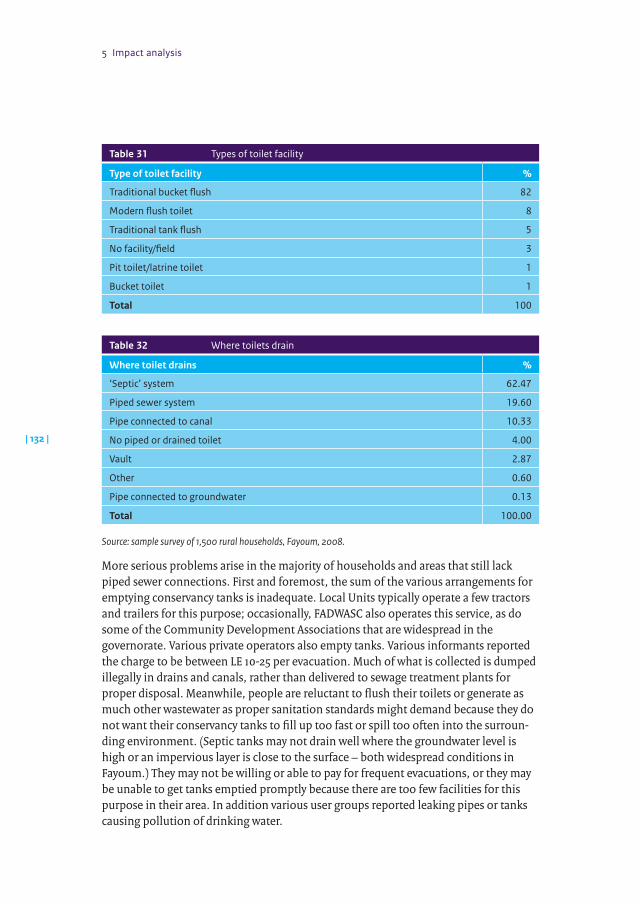
5 Impact analysis
| 132 |
Table 31 Types of toilet facility
Type of toilet facility %
Traditional bucket flush 82
Modern flush toilet 8
Traditional tank flush 5
No facility/field 3
Pit toilet/latrine toilet 1
Bucket toilet 1
Total 100
Table 32 Where toilets drain
Where toilet drains %
‘Septic’ system 62.47
Piped sewer system 19.60
Pipe connected to canal 10.33
No piped or drained toilet 4.00
Vault 2.87
Other 0.60
Pipe connected to groundwater 0.13
Total 100.00
Source: sample survey of 1,500 rural households, Fayoum, 2008.
More serious problems arise in the majority of households and areas that still lack piped sewer connections. First and foremost, the sum of the various arrangements for emptying conservancy tanks is inadequate. Local Units typically operate a few tractors and trailers for this purpose; occasionally, FADWASC also operates this service, as do some of the Community Development Associations that are widespread in the governorate. Various private operators also empty tanks. Various informants reported the charge to be between LE 10-25 per evacuation. Much of what is collected is dumped illegally in drains and canals, rather than delivered to sewage treatment plants for proper disposal. Meanwhile, people are reluctant to flush their toilets or generate as much other wastewater as proper sanitation standards might demand because they do not want their conservancy tanks to fill up too fast or spill too often into the surroun-ding environment. (Septic tanks may not drain well where the groundwater level is high or an impervious layer is close to the surface – both widespread conditions in Fayoum.) They may not be willing or able to pay for frequent evacuations, or they may be unable to get tanks emptied promptly because there are too few facilities for this purpose in their area. In addition various user groups reported leaking pipes or tanks causing pollution of drinking water.
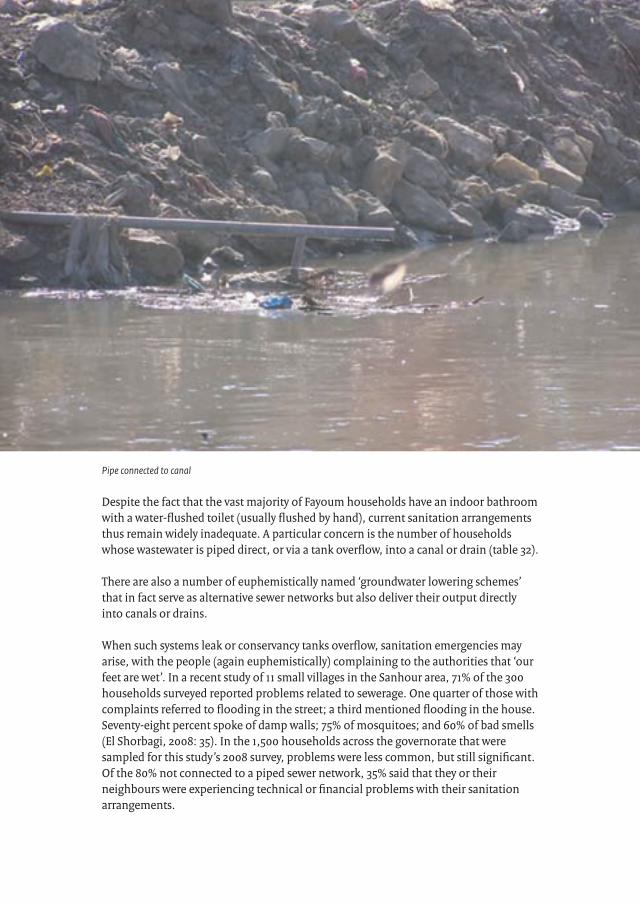
Drinking water supply and sanitation programme in Fayoum, Egypt, 1990-2009
| 133 |
Despite the fact that the vast majority of Fayoum households have an indoor bathroom with a water-flushed toilet (usually flushed by hand), current sanitation arrangements thus remain widely inadequate. A particular concern is the number of households whose wastewater is piped direct, or via a tank overflow, into a canal or drain (table 32).
There are also a number of euphemistically named ‘groundwater lowering schemes’ that in fact serve as alternative sewer networks but also deliver their output directly into canals or drains.
When such systems leak or conservancy tanks overflow, sanitation emergencies may arise, with the people (again euphemistically) complaining to the authorities that ‘our feet are wet’. In a recent study of 11 small villages in the Sanhour area, 71% of the 300 households surveyed reported problems related to sewerage. One quarter of those with complaints referred to flooding in the street; a third mentioned flooding in the house. Seventy-eight percent spoke of damp walls; 75% of mosquitoes; and 60% of bad smells (El Shorbagi, 2008: 35). In the 1,500 households across the governorate that were sampled for this study’s 2008 survey, problems were less common, but still significant. Of the 80% not connected to a piped sewer network, 35% said that they or their neighbours were experiencing technical or financial problems with their sanitation arrangements.
Pipe connected to canal
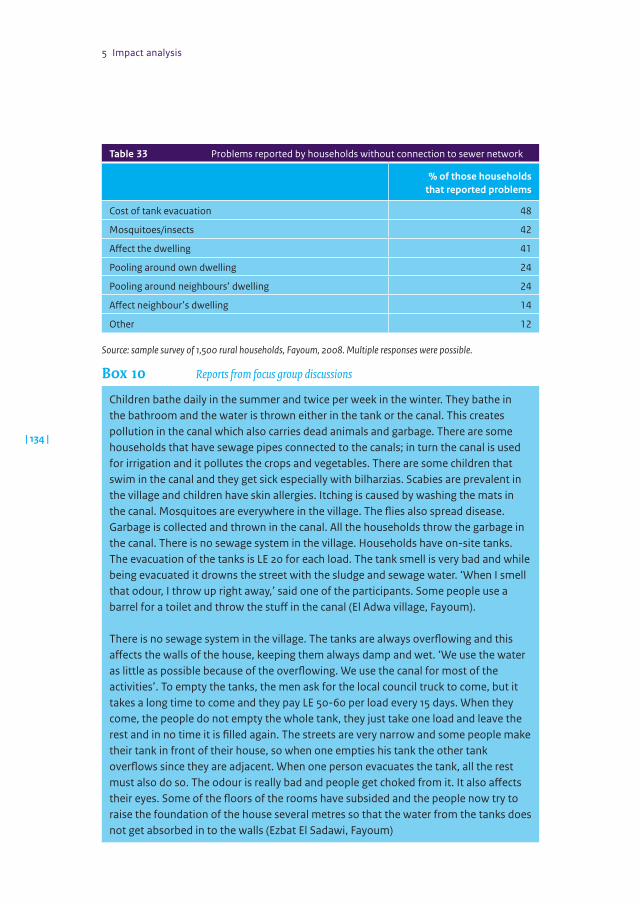
5 Impact analysis
| 134 |
Table 33 Problems reported by households without connection to sewer network
% of those households that reported problems
Cost of tank evacuation 48
Mosquitoes/insects 42
Affect the dwelling 41
Pooling around own dwelling 24
Pooling around neighbours’ dwelling 24
Affect neighbour’s dwelling 14
Other 12
Source: sample survey of 1,500 rural households, Fayoum, 2008. Multiple responses were possible.
Box10 Reports from focus group discussions
Children bathe daily in the summer and twice per week in the winter. They bathe in the bathroom and the water is thrown either in the tank or the canal. This creates pollution in the canal which also carries dead animals and garbage. There are some households that have sewage pipes connected to the canals; in turn the canal is used for irrigation and it pollutes the crops and vegetables. There are some children that swim in the canal and they get sick especially with bilharzias. Scabies are prevalent in the village and children have skin allergies. Itching is caused by washing the mats in the canal. Mosquitoes are everywhere in the village. The flies also spread disease. Garbage is collected and thrown in the canal. All the households throw the garbage in the canal. There is no sewage system in the village. Households have on-site tanks. The evacuation of the tanks is LE 20 for each load. The tank smell is very bad and while being evacuated it drowns the street with the sludge and sewage water. ‘When I smell that odour, I throw up right away,’ said one of the participants. Some people use a barrel for a toilet and throw the stuff in the canal (El Adwa village, Fayoum).
There is no sewage system in the village. The tanks are always overflowing and this affects the walls of the house, keeping them always damp and wet. ‘We use the water as little as possible because of the overflowing. We use the canal for most of the activities’. To empty the tanks, the men ask for the local council truck to come, but it takes a long time to come and they pay LE 50-60 per load every 15 days. When they come, the people do not empty the whole tank, they just take one load and leave the rest and in no time it is filled again. The streets are very narrow and some people make their tank in front of their house, so when one empties his tank the other tank overflows since they are adjacent. When one person evacuates the tank, all the rest must also do so. The odour is really bad and people get choked from it. It also affects their eyes. Some of the floors of the rooms have subsided and the people now try to raise the foundation of the house several metres so that the water from the tanks does not get absorbed in to the walls (Ezbat El Sadawi, Fayoum)
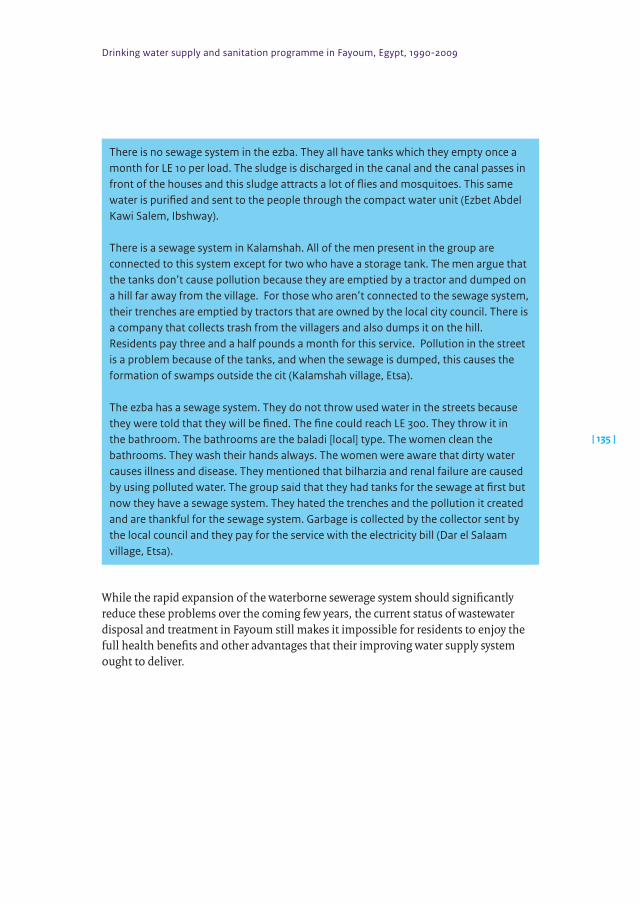
Drinking water supply and sanitation programme in Fayoum, Egypt, 1990-2009
| 135 |
There is no sewage system in the ezba. They all have tanks which they empty once a month for LE 10 per load. The sludge is discharged in the canal and the canal passes in front of the houses and this sludge attracts a lot of flies and mosquitoes. This same water is purified and sent to the people through the compact water unit (Ezbet Abdel Kawi Salem, Ibshway).
There is a sewage system in Kalamshah. All of the men present in the group are connected to this system except for two who have a storage tank. The men argue that the tanks don’t cause pollution because they are emptied by a tractor and dumped on a hill far away from the village. For those who aren’t connected to the sewage system, their trenches are emptied by tractors that are owned by the local city council. There is a company that collects trash from the villagers and also dumps it on the hill. Residents pay three and a half pounds a month for this service. Pollution in the street is a problem because of the tanks, and when the sewage is dumped, this causes the formation of swamps outside the cit (Kalamshah village, Etsa).
The ezba has a sewage system. They do not throw used water in the streets because they were told that they will be fined. The fine could reach LE 300. They throw it in the bathroom. The bathrooms are the baladi [local] type. The women clean the bathrooms. They wash their hands always. The women were aware that dirty water causes illness and disease. They mentioned that bilharzia and renal failure are caused by using polluted water. The group said that they had tanks for the sewage at first but now they have a sewage system. They hated the trenches and the pollution it created and are thankful for the sewage system. Garbage is collected by the collector sent by the local council and they pay for the service with the electricity bill (Dar el Salaam village, Etsa).
While the rapid expansion of the waterborne sewerage system should significantly reduce these problems over the coming few years, the current status of wastewater disposal and treatment in Fayoum still makes it impossible for residents to enjoy the full health benefits and other advantages that their improving water supply system ought to deliver.
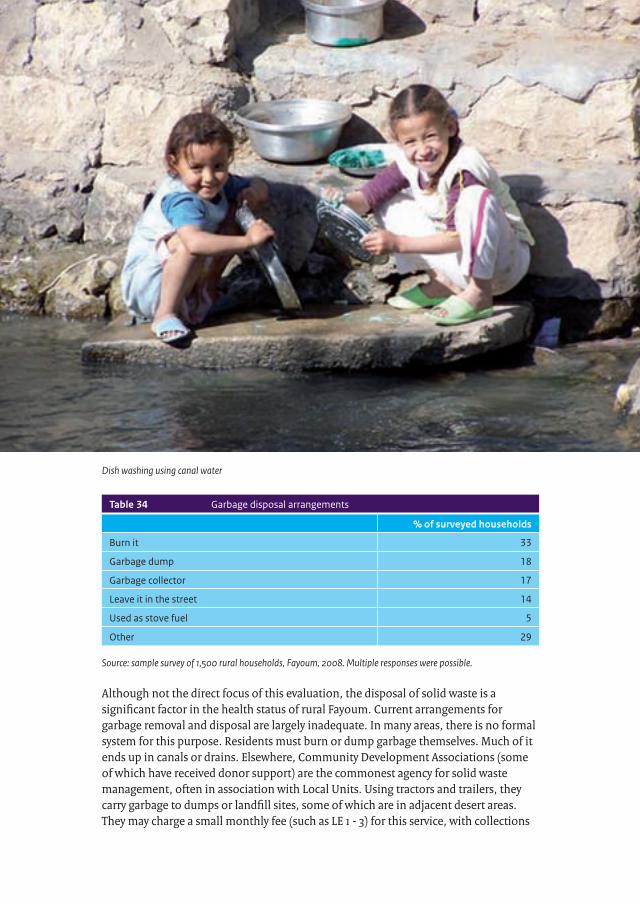
5 Impact analysis
| 136 |
Table 34 Garbage disposal arrangements
% of surveyed households
Burn it 33
Garbage dump 18
Garbage collector 17
Leave it in the street 14
Used as stove fuel 5
Other 29
Source: sample survey of 1,500 rural households, Fayoum, 2008. Multiple responses were possible.
Although not the direct focus of this evaluation, the disposal of solid waste is a significant factor in the health status of rural Fayoum. Current arrangements for garbage removal and disposal are largely inadequate. In many areas, there is no formal system for this purpose. Residents must burn or dump garbage themselves. Much of it ends up in canals or drains. Elsewhere, Community Development Associations (some of which have received donor support) are the commonest agency for solid waste management, often in association with Local Units. Using tractors and trailers, they carry garbage to dumps or landfill sites, some of which are in adjacent desert areas. They may charge a small monthly fee (such as LE 1 - 3) for this service, with collections
Dish washing using canal water
Drinking water supply and sanitation programme in Fayoum, Egypt, 1990-2009
| 137 |
once or twice a month. Often, a main or ‘mother’ village has garbage removal arrange-ments, but these do not extend to surrounding hamlets.
5.4 Distributionoffacilities
Evaluation question 15: How are facilities divided over households in different socio-economic groups? Presence of a household connection to the water network is not related to household wealth. Water pressure is somewhat better in relatively richer locations, but the differences are very small. Piped sewerage connections appear to be introduced in relatively wealthier locations first.
AccesstothewaterandsanitationnetworksAs noted above, piped water connections exist in all sample locations and more than 90% of the households do have such a connection. Thus one would not expect cer-tain groups of households to be excluded from water connections. An asset index5 was constructed to approximate for household wealth and as expected there is no correlation6 between connection status and wealth as measured by the asset index. Since most of the variation in wealth appears to be within locations, while piped connections can be found in all sample locations, the correlation between wealth and connection status within location was also calculated; this gave the same results. It can therefore be safely concluded that wealth differences, either at the location or at the household level, are unrelated to current connection status.7
A different picture emerges for piped sewerage connections. Around 20% of house-holds have such a connection. Within locations there is again no (or actually a small negative) correlation between household wealth and sewerage connection status. This is shown in table 35. which reports a regression relating sewerage connection status to household wealth and water connection status.8,9
5 The index is based on principal components analysis, using the number of consumer durables per capita, the material used for floors and the number of rooms per capita in the house. It has been standard ised at mean zero and unit variance.
6 Or rather a (small but significant) negative correlation.7 It is possible however, that the order in which households got their connection was related to wealth.8 The regression coefficients are a measure of the correlation between the dependent variable
(‘sewerage connection status’) and the respective explanatory variables (‘Household wealth’ and ‘Water connection status’). The coefficients must be multiplied by 100 to express the correlation as percentage changes. The other tables with regression results must be interpreted similarly.
9 Leaving out the water connection status from the regression does not change the result on wealth since almost all households have a water connection. The coefficient of 0.07 on water connection status results from the fact that a few households report a piped sewerage connection but no water connection. Repeating the regression only for households with water connections does not alter the result on household wealth.
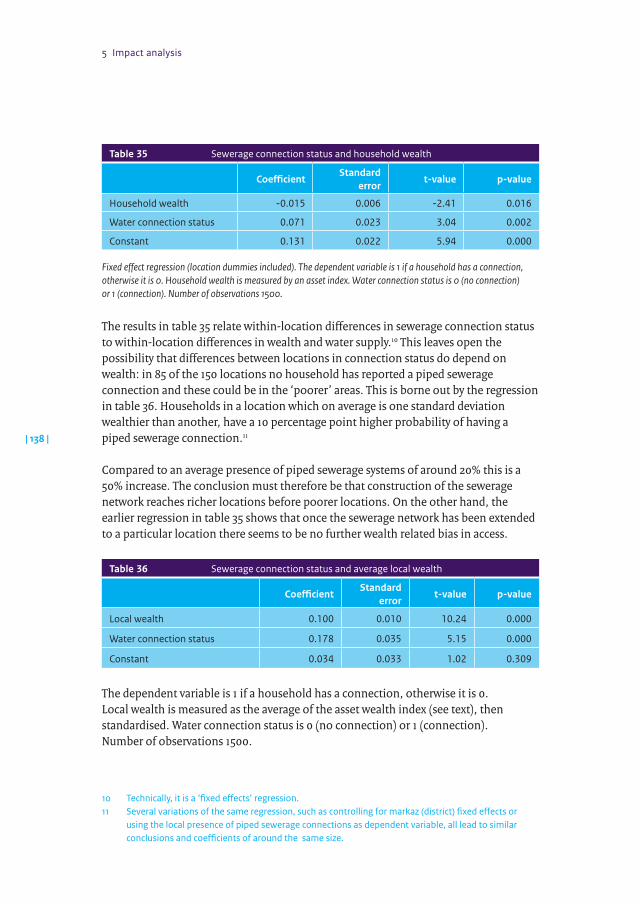
5 Impact analysis
| 138 |
Table 35 Sewerage connection status and household wealth
CoefficientStandard
errort-value p-value
Household wealth -0.015 0.006 -2.41 0.016
Water connection status 0.071 0.023 3.04 0.002
Constant 0.131 0.022 5.94 0.000
Fixed effect regression (location dummies included). The dependent variable is 1 if a household has a connection, otherwise it is 0. Household wealth is measured by an asset index. Water connection status is 0 (no connection) or 1 (connection). Number of observations 1500.
The results in table 35 relate within-location differences in sewerage connection status to within-location differences in wealth and water supply.10 This leaves open the possibility that differences between locations in connection status do depend on wealth: in 85 of the 150 locations no household has reported a piped sewerage connection and these could be in the ‘poorer’ areas. This is borne out by the regression in table 36. Households in a location which on average is one standard deviation wealthier than another, have a 10 percentage point higher probability of having a piped sewerage connection.11
Compared to an average presence of piped sewerage systems of around 20% this is a 50% increase. The conclusion must therefore be that construction of the sewerage network reaches richer locations before poorer locations. On the other hand, the earlier regression in table 35 shows that once the sewerage network has been extended to a particular location there seems to be no further wealth related bias in access.
Table 36 Sewerage connection status and average local wealth
CoefficientStandard
errort-value p-value
Local wealth 0.100 0.010 10.24 0.000
Water connection status 0.178 0.035 5.15 0.000
Constant 0.034 0.033 1.02 0.309
The dependent variable is 1 if a household has a connection, otherwise it is 0. Local wealth is measured as the average of the asset wealth index (see text), then standardised. Water connection status is 0 (no connection) or 1 (connection). Number of observations 1500.
10 Technically, it is a ‘fixed effects’ regression.11 Several variations of the same regression, such as controlling for markaz (district) fixed effects or
using the local presence of piped sewerage connections as dependent variable, all lead to similar conclusions and coefficients of around the same size.
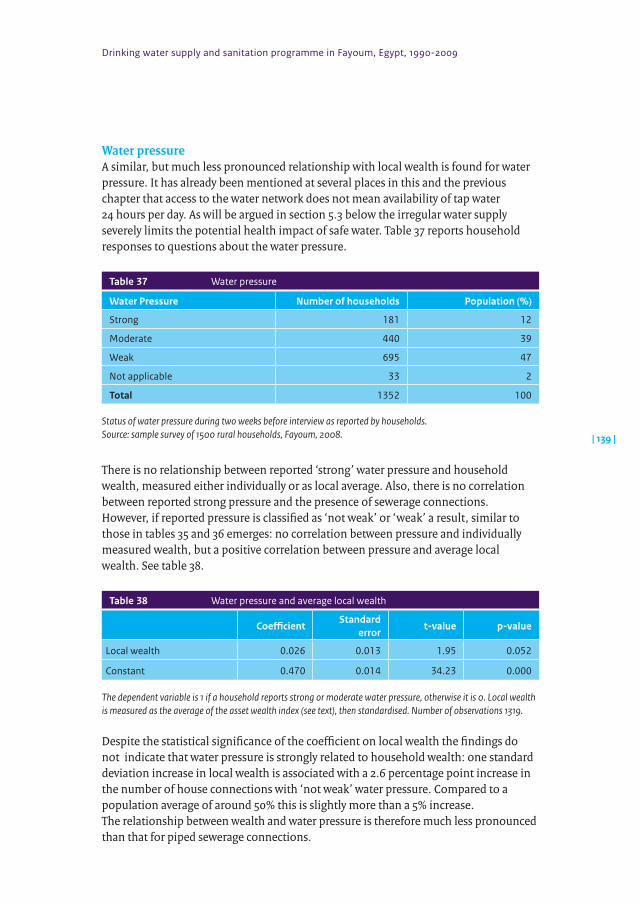
Drinking water supply and sanitation programme in Fayoum, Egypt, 1990-2009
| 139 |
WaterpressureA similar, but much less pronounced relationship with local wealth is found for water pressure. It has already been mentioned at several places in this and the previous chapter that access to the water network does not mean availability of tap water 24 hours per day. As will be argued in section 5.3 below the irregular water supply severely limits the potential health impact of safe water. Table 37 reports household responses to questions about the water pressure.
Table 37 Water pressure
Water Pressure Number of households Population (%)
Strong 181 12
Moderate 440 39
Weak 695 47
Not applicable 33 2
Total 1352 100
Status of water pressure during two weeks before interview as reported by households. Source: sample survey of 1500 rural households, Fayoum, 2008.
There is no relationship between reported ‘strong’ water pressure and household wealth, measured either individually or as local average. Also, there is no correlation between reported strong pressure and the presence of sewerage connections. However, if reported pressure is classified as ‘not weak’ or ‘weak’ a result, similar to those in tables 35 and 36 emerges: no correlation between pressure and individually measured wealth, but a positive correlation between pressure and average local wealth. See table 38.
Table 38 Water pressure and average local wealth
CoefficientStandard
errort-value p-value
Local wealth 0.026 0.013 1.95 0.052
Constant 0.470 0.014 34.23 0.000
The dependent variable is 1 if a household reports strong or moderate water pressure, otherwise it is 0. Local wealth is measured as the average of the asset wealth index (see text), then standardised. Number of observations 1319.
Despite the statistical significance of the coefficient on local wealth the findings do not indicate that water pressure is strongly related to household wealth: one standard deviation increase in local wealth is associated with a 2.6 percentage point increase in the number of house connections with ‘not weak’ water pressure. Compared to a population average of around 50% this is slightly more than a 5% increase. The relationship between wealth and water pressure is therefore much less pronounced than that for piped sewerage connections.
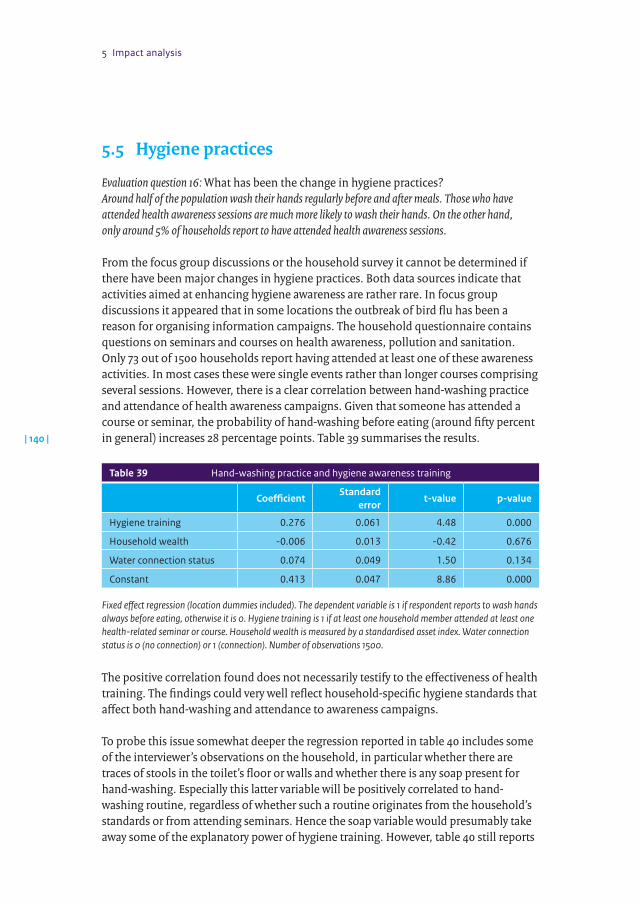
5 Impact analysis
| 140 |
5.5 Hygienepractices
Evaluation question 16: What has been the change in hygiene practices?Around half of the population wash their hands regularly before and after meals. Those who have attended health awareness sessions are much more likely to wash their hands. On the other hand, only around 5% of households report to have attended health awareness sessions.
From the focus group discussions or the household survey it cannot be determined if there have been major changes in hygiene practices. Both data sources indicate that activities aimed at enhancing hygiene awareness are rather rare. In focus group discussions it appeared that in some locations the outbreak of bird flu has been a reason for organising information campaigns. The household questionnaire contains questions on seminars and courses on health awareness, pollution and sanitation. Only 73 out of 1500 households report having attended at least one of these awareness activities. In most cases these were single events rather than longer courses comprising several sessions. However, there is a clear correlation between hand-washing practice and attendance of health awareness campaigns. Given that someone has attended a course or seminar, the probability of hand-washing before eating (around fifty percent in general) increases 28 percentage points. Table 39 summarises the results.
Table 39 Hand-washing practice and hygiene awareness training
CoefficientStandard
errort-value p-value
Hygiene training 0.276 0.061 4.48 0.000
Household wealth -0.006 0.013 -0.42 0.676
Water connection status 0.074 0.049 1.50 0.134
Constant 0.413 0.047 8.86 0.000
Fixed effect regression (location dummies included). The dependent variable is 1 if respondent reports to wash hands always before eating, otherwise it is 0. Hygiene training is 1 if at least one household member attended at least one health-related seminar or course. Household wealth is measured by a standardised asset index. Water connection status is 0 (no connection) or 1 (connection). Number of observations 1500.
The positive correlation found does not necessarily testify to the effectiveness of health training. The findings could very well reflect household-specific hygiene standards that affect both hand-washing and attendance to awareness campaigns.
To probe this issue somewhat deeper the regression reported in table 40 includes some of the interviewer’s observations on the household, in particular whether there are traces of stools in the toilet’s floor or walls and whether there is any soap present for hand-washing. Especially this latter variable will be positively correlated to hand-washing routine, regardless of whether such a routine originates from the household’s standards or from attending seminars. Hence the soap variable would presumably take away some of the explanatory power of hygiene training. However, table 40 still reports
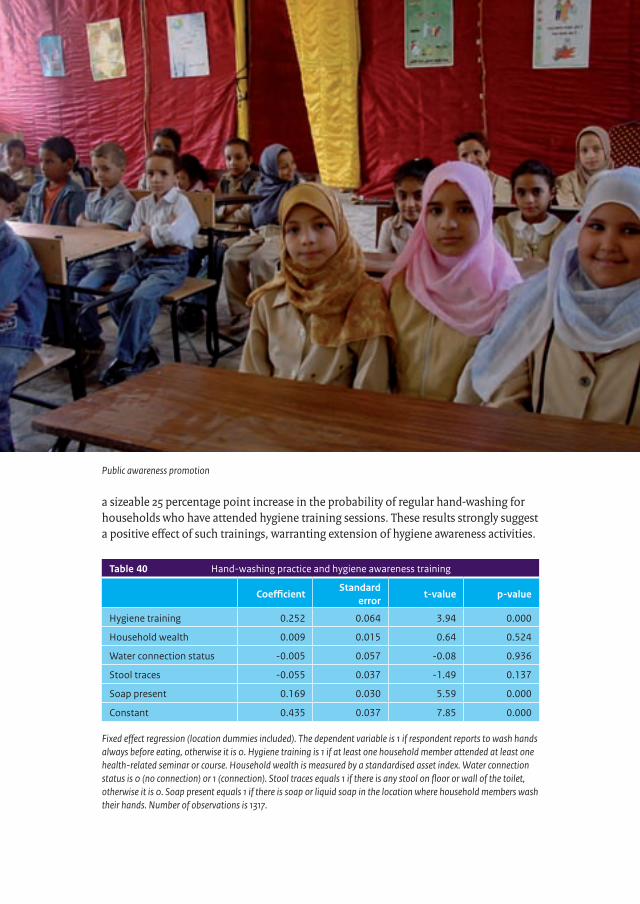
Drinking water supply and sanitation programme in Fayoum, Egypt, 1990-2009
| 141 |
a sizeable 25 percentage point increase in the probability of regular hand-washing for households who have attended hygiene training sessions. These results strongly suggest a positive effect of such trainings, warranting extension of hygiene awareness activities.
Table 40 Hand-washing practice and hygiene awareness training
CoefficientStandard
errort-value p-value
Hygiene training 0.252 0.064 3.94 0.000
Household wealth 0.009 0.015 0.64 0.524
Water connection status -0.005 0.057 -0.08 0.936
Stool traces -0.055 0.037 -1.49 0.137
Soap present 0.169 0.030 5.59 0.000
Constant 0.435 0.037 7.85 0.000
Fixed effect regression (location dummies included). The dependent variable is 1 if respondent reports to wash hands always before eating, otherwise it is 0. Hygiene training is 1 if at least one household member attended at least one health-related seminar or course. Household wealth is measured by a standardised asset index. Water connection status is 0 (no connection) or 1 (connection). Stool traces equals 1 if there is any stool on floor or wall of the toilet, otherwise it is 0. Soap present equals 1 if there is soap or liquid soap in the location where household members wash their hands. Number of observations is 1317.
Public awareness promotion
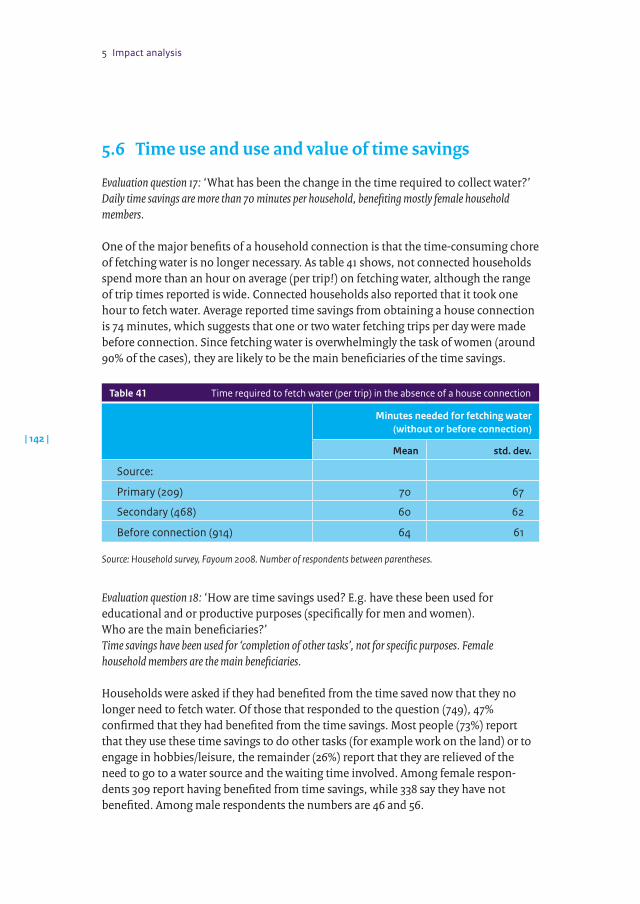
5 Impact analysis
| 142 |
5.6 Timeuseanduseandvalueoftimesavings
Evaluation question 17: ‘What has been the change in the time required to collect water?’Daily time savings are more than 70 minutes per household, benefiting mostly female household members.
One of the major benefits of a household connection is that the time-consuming chore of fetching water is no longer necessary. As table 41 shows, not connected households spend more than an hour on average (per trip!) on fetching water, although the range of trip times reported is wide. Connected households also reported that it took one hour to fetch water. Average reported time savings from obtaining a house connection is 74 minutes, which suggests that one or two water fetching trips per day were made before connection. Since fetching water is overwhelmingly the task of women (around 90% of the cases), they are likely to be the main beneficiaries of the time savings.
Table 41 Time required to fetch water (per trip) in the absence of a house connection
Minutes needed for fetching water (without or before connection)
Mean std. dev.
Source:
Primary (209) 70 67
Secondary (468) 60 62
Before connection (914) 64 61
Source: Household survey, Fayoum 2008. Number of respondents between parentheses.
Evaluation question 18: ‘How are time savings used? E.g. have these been used for educational and or productive purposes (specifically for men and women). Who are the main beneficiaries?’Time savings have been used for ‘completion of other tasks’, not for specific purposes. Female household members are the main beneficiaries.
Households were asked if they had benefited from the time saved now that they no longer need to fetch water. Of those that responded to the question (749), 47% confirmed that they had benefited from the time savings. Most people (73%) report that they use these time savings to do other tasks (for example work on the land) or to engage in hobbies/leisure, the remainder (26%) report that they are relieved of the need to go to a water source and the waiting time involved. Among female respon-dents 309 report having benefited from time savings, while 338 say they have not benefited. Among male respondents the numbers are 46 and 56.
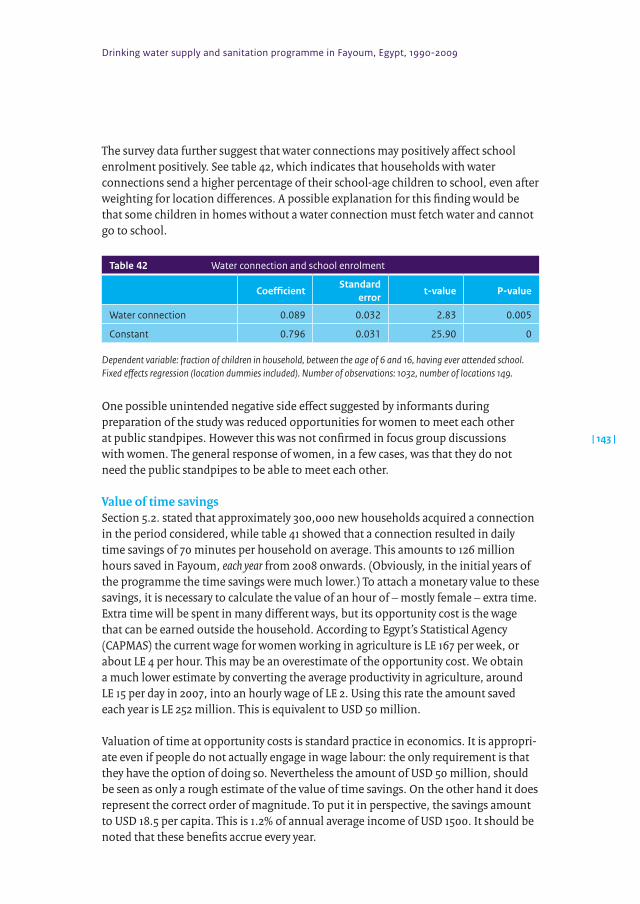
Drinking water supply and sanitation programme in Fayoum, Egypt, 1990-2009
| 143 |
The survey data further suggest that water connections may positively affect school enrolment positively. See table 42, which indicates that households with water connections send a higher percentage of their school-age children to school, even after weighting for location differences. A possible explanation for this finding would be that some children in homes without a water connection must fetch water and cannot go to school.
Table 42 Water connection and school enrolment
CoefficientStandard
errort-value P-value
Water connection 0.089 0.032 2.83 0.005
Constant 0.796 0.031 25.90 0
Dependent variable: fraction of children in household, between the age of 6 and 16, having ever attended school. Fixed effects regression (location dummies included). Number of observations: 1032, number of locations 149.
One possible unintended negative side effect suggested by informants during preparation of the study was reduced opportunities for women to meet each other at public standpipes. However this was not confirmed in focus group discussions with women. The general response of women, in a few cases, was that they do not need the public standpipes to be able to meet each other.
ValueoftimesavingsSection 5.2. stated that approximately 300,000 new households acquired a connection in the period considered, while table 41 showed that a connection resulted in daily time savings of 70 minutes per household on average. This amounts to 126 million hours saved in Fayoum, each year from 2008 onwards. (Obviously, in the initial years of the programme the time savings were much lower.) To attach a monetary value to these savings, it is necessary to calculate the value of an hour of – mostly female – extra time. Extra time will be spent in many different ways, but its opportunity cost is the wage that can be earned outside the household. According to Egypt’s Statistical Agency (CAPMAS) the current wage for women working in agriculture is LE 167 per week, or about LE 4 per hour. This may be an overestimate of the opportunity cost. We obtain a much lower estimate by converting the average productivity in agriculture, around LE 15 per day in 2007, into an hourly wage of LE 2. Using this rate the amount saved each year is LE 252 million. This is equivalent to USD 50 million.
Valuation of time at opportunity costs is standard practice in economics. It is appropri-ate even if people do not actually engage in wage labour: the only requirement is that they have the option of doing so. Nevertheless the amount of USD 50 million, should be seen as only a rough estimate of the value of time savings. On the other hand it does represent the correct order of magnitude. To put it in perspective, the savings amount to USD 18.5 per capita. This is 1.2% of annual average income of USD 1500. It should be noted that these benefits accrue every year.
5 Impact analysis
| 144 |
5.7 Impactonhealthandvalueofhealthbenefits
Evaluation question 19: What have been the effects on the health of the population?Thirty percent of households reported recent cases of diarrhoea. Statistical analysis suggests that this would have been 32.9% in the absence of the programme, amounting to an 8.7% decline in diarrhoea prevalence. The three main interventions of the water company: controlling water quality, increasing water pressure, and installing piped sewerage systems, all contribute to this reduction in diarrhoea prevalence. Prevalence is particularly lower in the small group of households who have both reasonable water pressure and a sewerage connection.
This section considers the impact of water supply and sanitation interventions on health in Fayoum. The aim is to assess the impact directly by statistical inference from the data collected in the survey among 1500 households. Ideally the impact is investi-gated by using data for at least two points in time.12 As only the 2009 data are available the analysis is limited to cross-section analysis, i.e. comparing households and locations at a single point in time. Since the effect of unobserved confounding factors in a cross-section study cannot be eliminated the results of this section may be misleading. This is addressed to some extent by including observed location characteris-tics in the analysis at the end of the section. While useful this approach is not perfect since inevitably some location characteristics are unobserved or even unobservable.
The focus is on diarrhoea prevalence as the key health indicator. This is in line with the literature on the health impact of clean drinking water and sanitation. Self-reported prevalence for the two-week period preceding the data of interview is used as indica-tor.13 The indicator is a ‘dummy’ variable taking the value 1 if any member of the household suffered from diarrhoea in the reference period and a value of 0 otherwise. In spite of the increase of household connections for water supply 30% of households still reported recent cases of diarrhoea.14
Figure 12 summarises the theory which is tested in the statistical analysis. Three main activities of the water company are considered: (i) control of tap water quality, mainly achieved by centrally chlorinating the water; (ii) upgrading the service level of drinking water provision by increasing the water pressure; and (iii) constructing piped sewerage systems. In addition hygiene practices such as hand-washing are influenced through training and awareness programmes. The figure shows that prevalence of diarrhoea is
12 With multiple observations the statistical technique of double differencing can be employed to eliminate the confounding effect of unaccounted-for location characteristics affecting health but unrelated to the company’s activities.
13 Households were interviewed in a short period so that the analysis is not confounded by seasonal effects.
14 This finding is similar to a finding for 1992 in Lower Egypt of 3.6 cases per child per year. (Jousilahti et al., 1997).
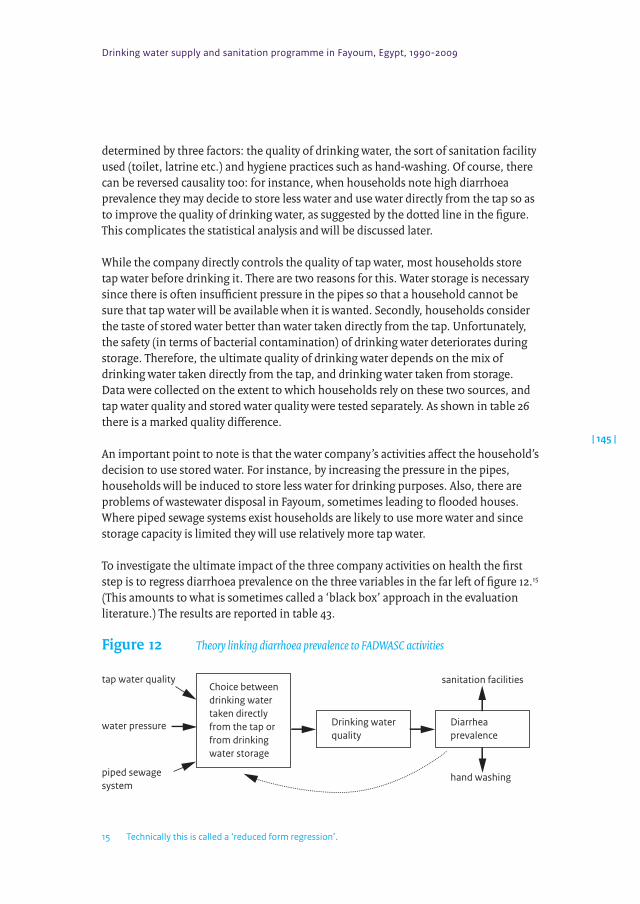
Drinking water supply and sanitation programme in Fayoum, Egypt, 1990-2009
| 145 |
determined by three factors: the quality of drinking water, the sort of sanitation facility used (toilet, latrine etc.) and hygiene practices such as hand-washing. Of course, there can be reversed causality too: for instance, when households note high diarrhoea prevalence they may decide to store less water and use water directly from the tap so as to improve the quality of drinking water, as suggested by the dotted line in the figure. This complicates the statistical analysis and will be discussed later.
While the company directly controls the quality of tap water, most households store tap water before drinking it. There are two reasons for this. Water storage is necessary since there is often insufficient pressure in the pipes so that a household cannot be sure that tap water will be available when it is wanted. Secondly, households consider the taste of stored water better than water taken directly from the tap. Unfortunately, the safety (in terms of bacterial contamination) of drinking water deteriorates during storage. Therefore, the ultimate quality of drinking water depends on the mix of drinking water taken directly from the tap, and drinking water taken from storage. Data were collected on the extent to which households rely on these two sources, and tap water quality and stored water quality were tested separately. As shown in table 26 there is a marked quality difference.
An important point to note is that the water company’s activities affect the household’s decision to use stored water. For instance, by increasing the pressure in the pipes, households will be induced to store less water for drinking purposes. Also, there are problems of wastewater disposal in Fayoum, sometimes leading to flooded houses. Where piped sewage systems exist households are likely to use more water and since storage capacity is limited they will use relatively more tap water.
To investigate the ultimate impact of the three company activities on health the first step is to regress diarrhoea prevalence on the three variables in the far left of figure 12.15 (This amounts to what is sometimes called a ‘black box’ approach in the evaluation literature.) The results are reported in table 43.
Figure12 Theory linking diarrhoea prevalence to FADWASC activities
tap water quality
water pressure
piped sewagesystem
sanitation facilities
hand washing
Choice betweendrinking watertaken directlyfrom the tap orfrom drinkingwater storage
Drinking waterquality
Diarrheaprevalence
15 Technically this is called a ‘reduced form regression’.
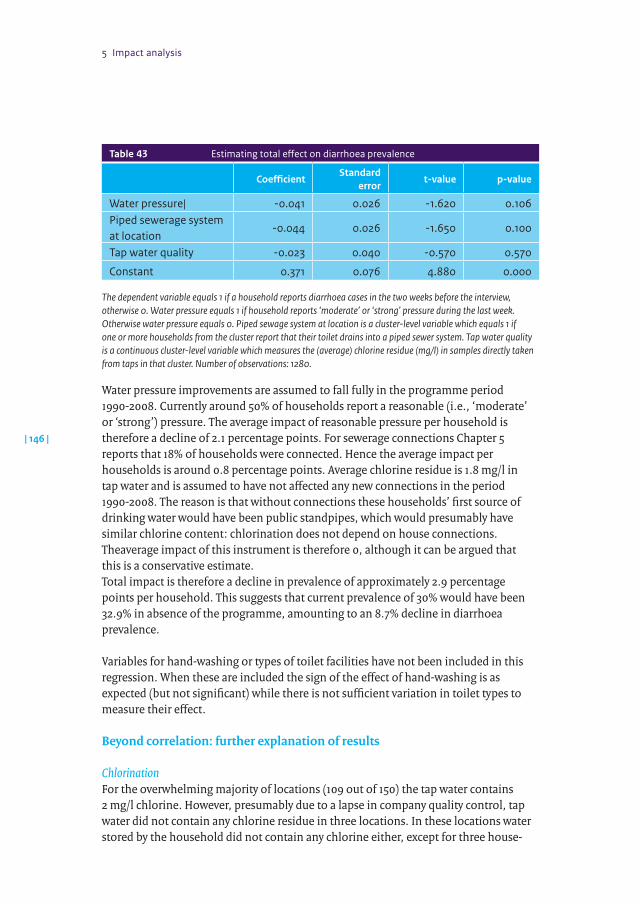
5 Impact analysis
| 146 |
Table 43 Estimating total effect on diarrhoea prevalence
CoefficientStandard
errort-value p-value
Water pressure| -0.041 0.026 -1.620 0.106Piped sewerage system at location
-0.044 0.026 -1.650 0.100
Tap water quality -0.023 0.040 -0.570 0.570
Constant 0.371 0.076 4.880 0.000
The dependent variable equals 1 if a household reports diarrhoea cases in the two weeks before the interview, otherwise 0. Water pressure equals 1 if household reports ‘moderate’ or ‘strong’ pressure during the last week. Otherwise water pressure equals 0. Piped sewage system at location is a cluster-level variable which equals 1 if one or more households from the cluster report that their toilet drains into a piped sewer system. Tap water quality is a continuous cluster-level variable which measures the (average) chlorine residue (mg/l) in samples directly taken from taps in that cluster. Number of observations: 1280.
Water pressure improvements are assumed to fall fully in the programme period 1990-2008. Currently around 50% of households report a reasonable (i.e., ‘moderate’ or ‘strong’) pressure. The average impact of reasonable pressure per household is therefore a decline of 2.1 percentage points. For sewerage connections Chapter 5 reports that 18% of households were connected. Hence the average impact per households is around 0.8 percentage points. Average chlorine residue is 1.8 mg/l in tap water and is assumed to have not affected any new connections in the period 1990-2008. The reason is that without connections these households’ first source of drinking water would have been public standpipes, which would presumably have similar chlorine content: chlorination does not depend on house connections. Theaverage impact of this instrument is therefore 0, although it can be argued that this is a conservative estimate. Total impact is therefore a decline in prevalence of approximately 2.9 percentage points per household. This suggests that current prevalence of 30% would have been 32.9% in absence of the programme, amounting to an 8.7% decline in diarrhoea prevalence.
Variables for hand-washing or types of toilet facilities have not been included in this regression. When these are included the sign of the effect of hand-washing is as expected (but not significant) while there is not sufficient variation in toilet types to measure their effect.
Beyondcorrelation:furtherexplanationofresults
ChlorinationFor the overwhelming majority of locations (109 out of 150) the tap water contains 2 mg/l chlorine. However, presumably due to a lapse in company quality control, tap water did not contain any chlorine residue in three locations. In these locations water stored by the household did not contain any chlorine either, except for three house-
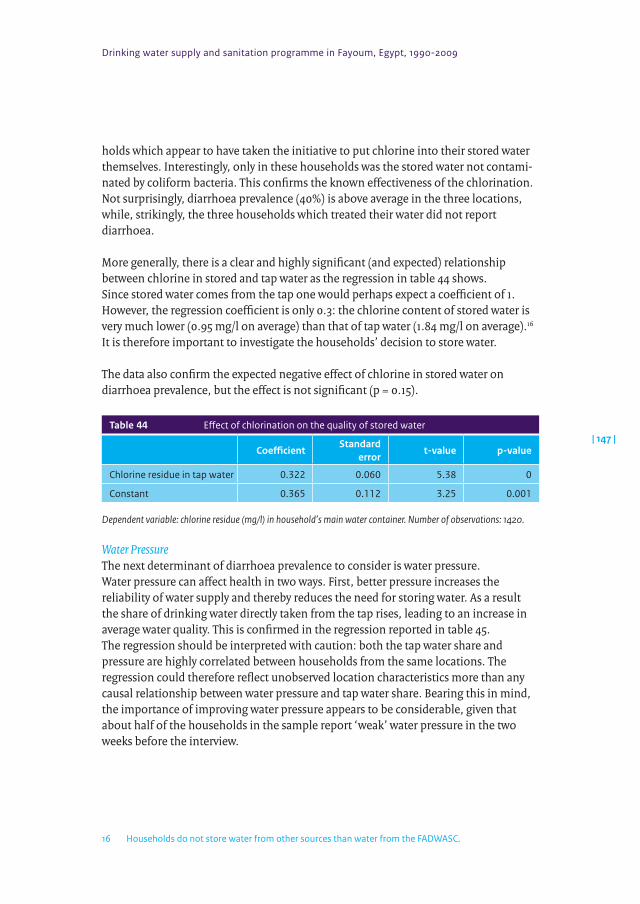
Drinking water supply and sanitation programme in Fayoum, Egypt, 1990-2009
| 147 |
holds which appear to have taken the initiative to put chlorine into their stored water themselves. Interestingly, only in these households was the stored water not contami-nated by coliform bacteria. This confirms the known effectiveness of the chlorination. Not surprisingly, diarrhoea prevalence (40%) is above average in the three locations, while, strikingly, the three households which treated their water did not report diarrhoea.
More generally, there is a clear and highly significant (and expected) relationship between chlorine in stored and tap water as the regression in table 44 shows. Since stored water comes from the tap one would perhaps expect a coefficient of 1. However, the regression coefficient is only 0.3: the chlorine content of stored water is very much lower (0.95 mg/l on average) than that of tap water (1.84 mg/l on average).16 It is therefore important to investigate the households’ decision to store water.
The data also confirm the expected negative effect of chlorine in stored water on diarrhoea prevalence, but the effect is not significant (p = 0.15).
Table 44 Effect of chlorination on the quality of stored water
CoefficientStandard
errort-value p-value
Chlorine residue in tap water 0.322 0.060 5.38 0
Constant 0.365 0.112 3.25 0.001
Dependent variable: chlorine residue (mg/l) in household’s main water container. Number of observations: 1420.
Water PressureThe next determinant of diarrhoea prevalence to consider is water pressure. Water pressure can affect health in two ways. First, better pressure increases the reliability of water supply and thereby reduces the need for storing water. As a result the share of drinking water directly taken from the tap rises, leading to an increase in average water quality. This is confirmed in the regression reported in table 45. The regression should be interpreted with caution: both the tap water share and pressure are highly correlated between households from the same locations. The regression could therefore reflect unobserved location characteristics more than any causal relationship between water pressure and tap water share. Bearing this in mind, the importance of improving water pressure appears to be considerable, given that about half of the households in the sample report ‘weak’ water pressure in the two weeks before the interview.
16 Households do not store water from other sources than water from the FADWASC.
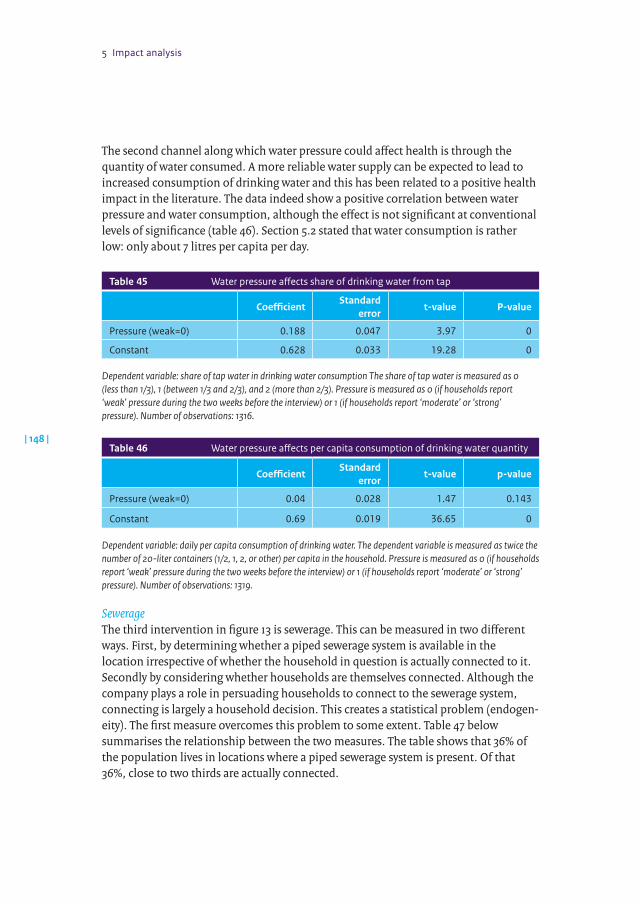
5 Impact analysis
| 148 |
The second channel along which water pressure could affect health is through the quantity of water consumed. A more reliable water supply can be expected to lead to increased consumption of drinking water and this has been related to a positive health impact in the literature. The data indeed show a positive correlation between water pressure and water consumption, although the effect is not significant at conventional levels of significance (table 46). Section 5.2 stated that water consumption is rather low: only about 7 litres per capita per day.
Table 45 Water pressure affects share of drinking water from tap
CoefficientStandard
errort-value P-value
Pressure (weak=0) 0.188 0.047 3.97 0
Constant 0.628 0.033 19.28 0
Dependent variable: share of tap water in drinking water consumption The share of tap water is measured as 0 (less than 1/3), 1 (between 1/3 and 2/3), and 2 (more than 2/3). Pressure is measured as 0 (if households report ‘weak’ pressure during the two weeks before the interview) or 1 (if households report ‘moderate’ or ‘strong’ pressure). Number of observations: 1316.
Table 46 Water pressure affects per capita consumption of drinking water quantity
CoefficientStandard
errort-value p-value
Pressure (weak=0) 0.04 0.028 1.47 0.143
Constant 0.69 0.019 36.65 0
Dependent variable: daily per capita consumption of drinking water. The dependent variable is measured as twice the number of 20-liter containers (1/2, 1, 2, or other) per capita in the household. Pressure is measured as 0 (if households report ‘weak’ pressure during the two weeks before the interview) or 1 (if households report ‘moderate’ or ‘strong’ pressure). Number of observations: 1319.
SewerageThe third intervention in figure 13 is sewerage. This can be measured in two different ways. First, by determining whether a piped sewerage system is available in the location irrespective of whether the household in question is actually connected to it. Secondly by considering whether households are themselves connected. Although the company plays a role in persuading households to connect to the sewerage system, connecting is largely a household decision. This creates a statistical problem (endogen-eity). The first measure overcomes this problem to some extent. Table 47 below summarises the relationship between the two measures. The table shows that 36% of the population lives in locations where a piped sewerage system is present. Of that 36%, close to two thirds are actually connected.
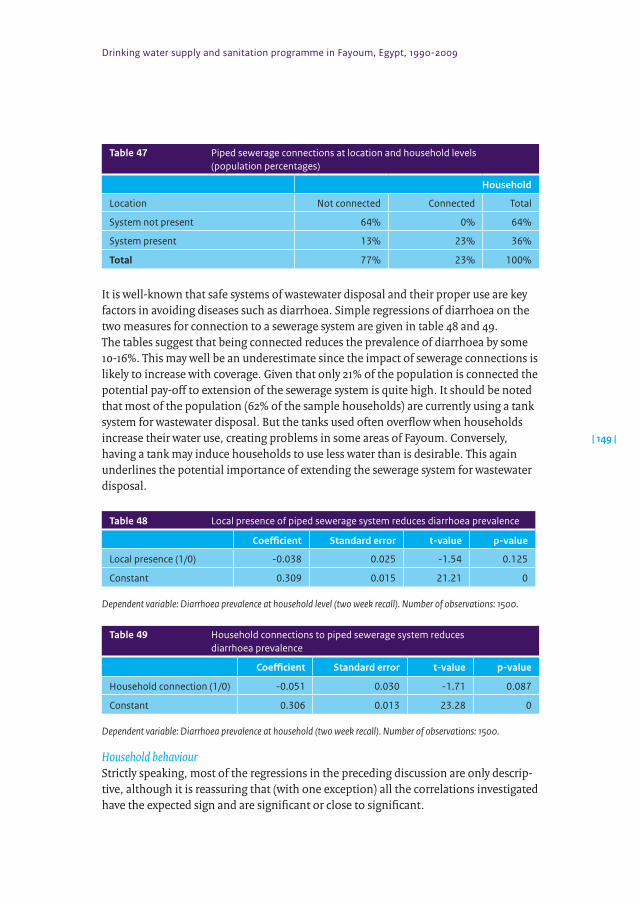
Drinking water supply and sanitation programme in Fayoum, Egypt, 1990-2009
| 149 |
Table 47 Piped sewerage connections at location and household levels (population percentages)
Household
Location Not connected Connected Total
System not present 64% 0% 64%
System present 13% 23% 36%
Total 77% 23% 100%
It is well-known that safe systems of wastewater disposal and their proper use are key factors in avoiding diseases such as diarrhoea. Simple regressions of diarrhoea on the two measures for connection to a sewerage system are given in table 48 and 49. The tables suggest that being connected reduces the prevalence of diarrhoea by some 10-16%. This may well be an underestimate since the impact of sewerage connections is likely to increase with coverage. Given that only 21% of the population is connected the potential pay-off to extension of the sewerage system is quite high. It should be noted that most of the population (62% of the sample households) are currently using a tank system for wastewater disposal. But the tanks used often overflow when households increase their water use, creating problems in some areas of Fayoum. Conversely, having a tank may induce households to use less water than is desirable. This again underlines the potential importance of extending the sewerage system for wastewater disposal.
Table 48 Local presence of piped sewerage system reduces diarrhoea prevalence
Coefficient Standard error t-value p-value
Local presence (1/0) -0.038 0.025 -1.54 0.125
Constant 0.309 0.015 21.21 0
Dependent variable: Diarrhoea prevalence at household level (two week recall). Number of observations: 1500.
Table 49 Household connections to piped sewerage system reduces diarrhoea prevalence
Coefficient Standard error t-value p-value
Household connection (1/0) -0.051 0.030 -1.71 0.087
Constant 0.306 0.013 23.28 0
Dependent variable: Diarrhoea prevalence at household (two week recall). Number of observations: 1500.
Household behaviourStrictly speaking, most of the regressions in the preceding discussion are only descrip-tive, although it is reassuring that (with one exception) all the correlations investigated have the expected sign and are significant or close to significant.
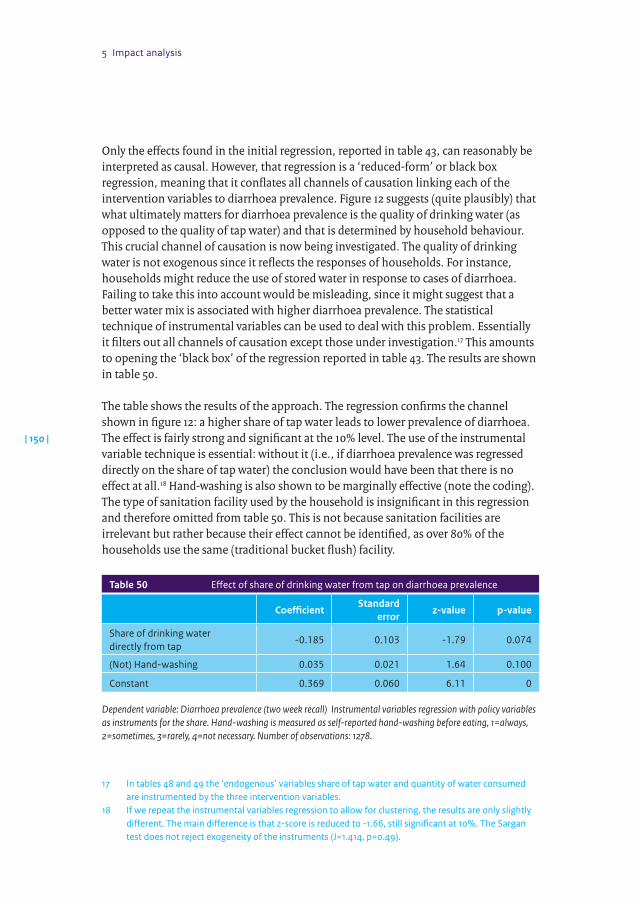
5 Impact analysis
| 150 |
Only the effects found in the initial regression, reported in table 43, can reasonably be interpreted as causal. However, that regression is a ‘reduced-form’ or black box regression, meaning that it conflates all channels of causation linking each of the intervention variables to diarrhoea prevalence. Figure 12 suggests (quite plausibly) that what ultimately matters for diarrhoea prevalence is the quality of drinking water (as opposed to the quality of tap water) and that is determined by household behaviour. This crucial channel of causation is now being investigated. The quality of drinking water is not exogenous since it reflects the responses of households. For instance, households might reduce the use of stored water in response to cases of diarrhoea. Failing to take this into account would be misleading, since it might suggest that a better water mix is associated with higher diarrhoea prevalence. The statistical technique of instrumental variables can be used to deal with this problem. Essentially it filters out all channels of causation except those under investigation.17 This amounts to opening the ‘black box’ of the regression reported in table 43. The results are shown in table 50.
The table shows the results of the approach. The regression confirms the channel shown in figure 12: a higher share of tap water leads to lower prevalence of diarrhoea. The effect is fairly strong and significant at the 10% level. The use of the instrumental variable technique is essential: without it (i.e., if diarrhoea prevalence was regressed directly on the share of tap water) the conclusion would have been that there is no effect at all.18 Hand-washing is also shown to be marginally effective (note the coding). The type of sanitation facility used by the household is insignificant in this regression and therefore omitted from table 50. This is not because sanitation facilities are irrelevant but rather because their effect cannot be identified, as over 80% of the households use the same (traditional bucket flush) facility.
Table 50 Effect of share of drinking water from tap on diarrhoea prevalence
CoefficientStandard
errorz-value p-value
Share of drinking water directly from tap
-0.185 0.103 -1.79 0.074
(Not) Hand-washing 0.035 0.021 1.64 0.100
Constant 0.369 0.060 6.11 0
Dependent variable: Diarrhoea prevalence (two week recall) Instrumental variables regression with policy variables as instruments for the share. Hand-washing is measured as self-reported hand-washing before eating, 1=always, 2=sometimes, 3=rarely, 4=not necessary. Number of observations: 1278.
17 In tables 48 and 49 the ‘endogenous’ variables share of tap water and quantity of water consumed are instrumented by the three intervention variables.
18 If we repeat the instrumental variables regression to allow for clustering, the results are only slightly different. The main difference is that z-score is reduced to -1.66, still significant at 10%. The Sargan test does not reject exogeneity of the instruments (J=1.414, p=0.49).
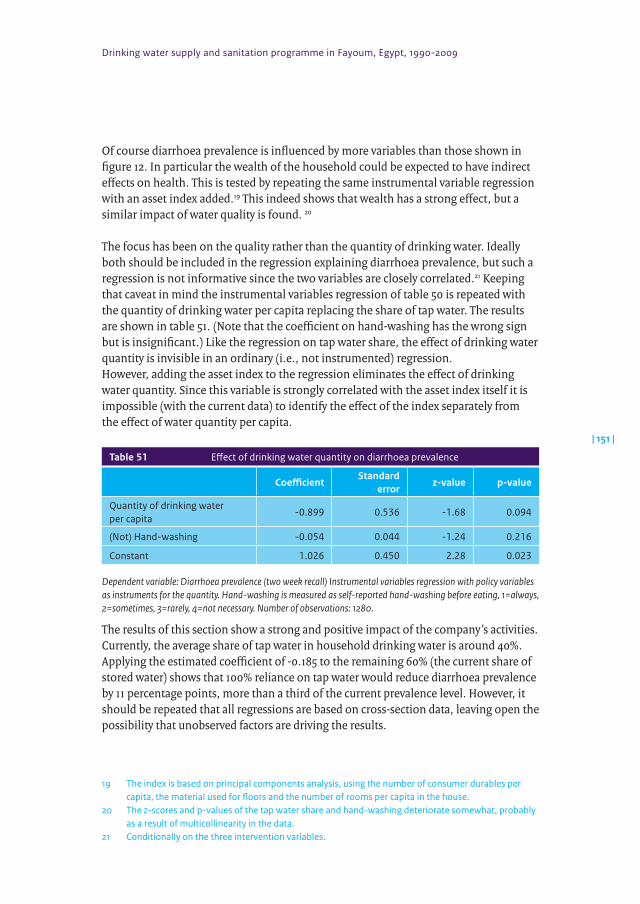
Drinking water supply and sanitation programme in Fayoum, Egypt, 1990-2009
| 151 |
Of course diarrhoea prevalence is influenced by more variables than those shown in figure 12. In particular the wealth of the household could be expected to have indirect effects on health. This is tested by repeating the same instrumental variable regression with an asset index added.19 This indeed shows that wealth has a strong effect, but a similar impact of water quality is found. 20
The focus has been on the quality rather than the quantity of drinking water. Ideally both should be included in the regression explaining diarrhoea prevalence, but such a regression is not informative since the two variables are closely correlated.21 Keeping that caveat in mind the instrumental variables regression of table 50 is repeated with the quantity of drinking water per capita replacing the share of tap water. The results are shown in table 51. (Note that the coefficient on hand-washing has the wrong sign but is insignificant.) Like the regression on tap water share, the effect of drinking water quantity is invisible in an ordinary (i.e., not instrumented) regression. However, adding the asset index to the regression eliminates the effect of drinking water quantity. Since this variable is strongly correlated with the asset index itself it is impossible (with the current data) to identify the effect of the index separately from the effect of water quantity per capita.
Table 51 Effect of drinking water quantity on diarrhoea prevalence
CoefficientStandard
errorz-value p-value
Quantity of drinking water per capita
-0.899 0.536 -1.68 0.094
(Not) Hand-washing -0.054 0.044 -1.24 0.216
Constant 1.026 0.450 2.28 0.023
Dependent variable: Diarrhoea prevalence (two week recall) Instrumental variables regression with policy variables as instruments for the quantity. Hand-washing is measured as self-reported hand-washing before eating, 1=always, 2=sometimes, 3=rarely, 4=not necessary. Number of observations: 1280.
The results of this section show a strong and positive impact of the company’s activities. Currently, the average share of tap water in household drinking water is around 40%. Applying the estimated coefficient of -0.185 to the remaining 60% (the current share of stored water) shows that 100% reliance on tap water would reduce diarrhoea prevalence by 11 percentage points, more than a third of the current prevalence level. However, it should be repeated that all regressions are based on cross-section data, leaving open the possibility that unobserved factors are driving the results.
19 The index is based on principal components analysis, using the number of consumer durables per capita, the material used for floors and the number of rooms per capita in the house.
20 The z-scores and p-values of the tap water share and hand-washing deteriorate somewhat, probably as a result of multicollinearity in the data.
21 Conditionally on the three intervention variables.
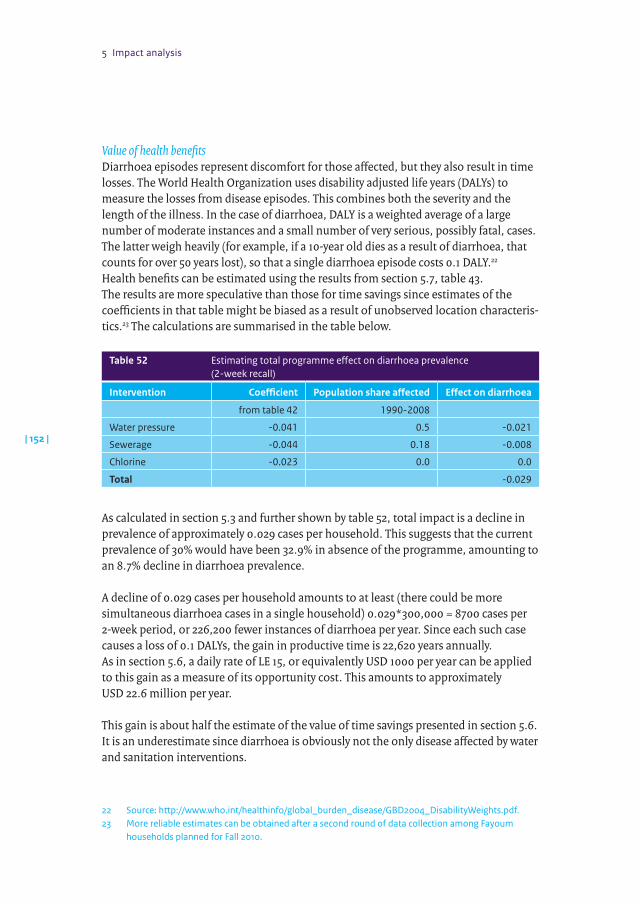
5 Impact analysis
| 152 |
Value of health benefitsDiarrhoea episodes represent discomfort for those affected, but they also result in time losses. The World Health Organization uses disability adjusted life years (DALYs) to measure the losses from disease episodes. This combines both the severity and the length of the illness. In the case of diarrhoea, DALY is a weighted average of a large number of moderate instances and a small number of very serious, possibly fatal, cases. The latter weigh heavily (for example, if a 10-year old dies as a result of diarrhoea, that counts for over 50 years lost), so that a single diarrhoea episode costs 0.1 DALY.22
Health benefits can be estimated using the results from section 5.7, table 43. The results are more speculative than those for time savings since estimates of the coefficients in that table might be biased as a result of unobserved location characteris-tics.23 The calculations are summarised in the table below.
Table 52 Estimating total programme effect on diarrhoea prevalence (2-week recall)
Intervention Coefficient Population share affected Effect on diarrhoea
from table 42 1990-2008
Water pressure -0.041 0.5 -0.021
Sewerage -0.044 0.18 -0.008
Chlorine -0.023 0.0 0.0
Total -0.029
As calculated in section 5.3 and further shown by table 52, total impact is a decline in prevalence of approximately 0.029 cases per household. This suggests that the current prevalence of 30% would have been 32.9% in absence of the programme, amounting to an 8.7% decline in diarrhoea prevalence.
A decline of 0.029 cases per household amounts to at least (there could be more simultaneous diarrhoea cases in a single household) 0.029*300,000 = 8700 cases per 2-week period, or 226,200 fewer instances of diarrhoea per year. Since each such case causes a loss of 0.1 DALYs, the gain in productive time is 22,620 years annually. As in section 5.6, a daily rate of LE 15, or equivalently USD 1000 per year can be applied to this gain as a measure of its opportunity cost. This amounts to approximately USD 22.6 million per year.
This gain is about half the estimate of the value of time savings presented in section 5.6. It is an underestimate since diarrhoea is obviously not the only disease affected by water and sanitation interventions.
22 Source: http://www.who.int/healthinfo/global_burden_disease/GBD2004_DisabilityWeights.pdf.23 More reliable estimates can be obtained after a second round of data collection among Fayoum
households planned for Fall 2010.
Drinking water supply and sanitation programme in Fayoum, Egypt, 1990-2009
| 153 |
5.8 Summaryandconclusion
The survey evidence supports the account in chapter 4, which is one of massive investments in water connections. Investment in sewerage connections and hygiene promotion has lagged behind. The evidence suggests that there is no relation between having a household connection and wealth. There is some evidence that water pressure is somewhat better in relatively richer locations, but differences are very small. Sewerage connections appear to be introduced in relatively wealthier locations first. An important benefit of household connections for water supply are time savings. Household connections have led to daily time savings of more than 70 minutes per household, benefiting mostly female members.
The statistical analysis considered three main policy interventions controlled by the water company: safety of the drinking water (achieved through chlorination), water pressure, and local presence of piped sewerage. First, three factors in a ‘black box’ analysis were considered linking them to diarrhoea prevalence and established a beneficial, strong and significant effect (at about 10% level) for the last two variables. For water quality (as measured by chlorination) this could not be established. Water quality is obviously important, but since there is almost no variation in tap water chloride levels its effects cannot be measured. The various causal relations in the black box were then considered. The analysis showed that diarrhoea prevalence is deter-mined by the quality of water consumed by households (as opposed to the quality of the water from the tap). To the extent the water company or other parties involved can, through the channels under their control, induce households to take drinking water directly from the tap rather than store it, a very substantial decline in diarrhoea prevalence can be achieved. The same applies to the quantity of water consumed. While these results are encouraging, the present cross-section analysis may be confounded by unobserved location characteristics.
To put the findings on benefits into perspective they were converted into monetary values. This results in a gain of almost 2% of per capita income annually: 1.2% from time savings and 0.6% from health benefits. Whether this is significant obviously depends on the total costs of connecting households to the water and sanitation networks. Unfortunately, the total cost is unknown. However, it is easy to see that the benefits are likely to exceed the costs. A conventional required rate of return on development programmes is 10%. Hence the cost per capita should not have exceeded 20% of per capita income in Fayoum. This maximum amounts to USD 810 million.24 The known costs of FaDWaSP Phases I-V are EUR 92.3 million, or about USD 120 million. If the total unaccounted costs of investments and other contributions did not exceed USD 690 million, the benefit/cost ratio would be favourable, i.e. exceeding unity.
24 2.7 million persons times USD 1500 per capita times 20% = USD 810 million.
5 Impact analysis
| 154 |
There is no easy answer to the question which intervention works best (evaluation question 21). The company’s policy of virtual universal chlorination has obviously been highly successful, but without a simultaneous achievement of permanently high water pressure there is a major problem of the quality of drinking water actually consumed by households: water (which is initially safe) becomes contaminated when households resort to storage because they realise that they cannot count on water being available at all times. This suggests a very high payoff to improvements in water pressure, the major intervention presently underway. The impact of sanitation is substantial, although not as strong as in some other countries, probably because the default mode of sanitation (use of a conservancy tank) is already effective despite problems of overflowing. Its importance may increase if coverage of sewerage connections increases. Moreover, as households start using more water it becomes increasingly important to have effective means of wastewater disposal.
The one unintended effect (evaluation question 20) encountered is evidence that improved water availability has in some locations exceeded the capacity of conservancy tanks leading to overflowing and possible health dangers. In focus group discussions people reported that this induced them to use less water.

Drinking water supply and sanitation programme in Fayoum, Egypt, 1990-2009
| 155 |
Sustainability assessment
6
Drinking water supply and sanitation programme in Fayoum, Egypt, 1990-2009
| 157 |
6.1 Introduction
To be meaningful, the beneficial impacts of water and sanitation programmes in Fayoum must obviously be sustainable. There is no doubt that the water and sanitation technologies and infrastructure that the programme has helped to introduce in Fayoum can continue to deliver their benefits in the long term, if two sets of conditions are met. Firstly, there are environmental conditions. The required quantities of raw water must be available in the governorate. Health hazards arising from a range of environmental pollution factors must be minimised. The second set of conditions concerns institutional factors. Responding to evaluation questions 23-27 (section 1.2), this chapter mainly addresses these institutional factors. It assesses the extent to which the relevant institutions in Fayoum have achieved the capacity they need to operate sustainably, and whether the organisational and institutional conditions for such sustainable operation are in place. It devotes particular attention to the challenges of achieving the financial and economic sustainability of Fayoum water and wastewater services. These concern not only FADWASC’s financial viability, but also broader national arrangements for investing in and subsidising the sector.
6.2 Institutionalsustainability
FADWASC needs many kinds of capacity to be able to perform its required functions in the long term. This is still a time of transition: the company is only five years old, and has had to overcome a substantial institutional backlog and inertia in its efforts to build an appropriate workforce, systems and procedures for this purpose. As explained in section 4.4.1, good progress is being made to this end. But it will need to continue for perhaps another five years before the company’s capacity for the future is assured.
Meanwhile, as shown in section 2.6, the institutional context for FADWASC’s growth has itself been evolving fast, posing new opportunities and challenges. The prospects of institutional sustainability for FADWASC do not depend only on the company’s own progress. They depend also on the clarity, purpose and direction of policy and institutional development at national level. National policy, legislation and planning must continue to address the discontinuities and constraints that currently impede co-ordinated implementation of coherent strategies for water supply and wastewater treatment. New national institutions, notably the Holding Company, EWRA and the National Water Council, must grow to maturity. Revised and more efficient structures and systems for capital finance must be put into operation. Incomplete policy and planning processes, notably the development of national water and sanitation policy and master plans for the sector, must be completed and taken forward to implemen-tation. Performance monitoring and consumer protection systems must be streng-thened. Finally, as will be explained below, national policy on tariffs and subsidy must create the opportunity for companies like FADWASC to operate sustainably.
6 Sustainability assessment
| 158 |
For FADWASC to develop the capacity needed for the institutional sustainability of water and sanitation services in Fayoum, a combination of stability and dynamism is needed. FEGAWS can arguably be seen as a transitional institution. It lasted only eight years, and made good progress on many fronts with the support of FaDWaSP. But then there was another institutional upheaval as the General Authority was replaced by the company. Again, this transformation was a sound step forward. But stability is needed now for much more than eight years in order for the company to complete the multiple development processes on which it has embarked. At the same time, of course, these processes mean dynamism, at the national and company levels. Vigorous efforts must continue to complete and clarify the relevant policy frameworks, and to strengthen the necessary procedures and relationships between national institutions and FADWASC. Further years of challenge and change are inevitable if sustainable water and sanitation institutions are to be achieved. The duration and stress of the process can be reduced if it takes place in a framework of overall institutional stability.
For most of the last 20 years, FADWASC and its predecessors have benefited from the technical assistance provided through the five phases of FaDWaSP. Does institutional sustainability mean that the company no longer needs such assistance, and has such sustainability been reached? These are nuanced questions. There is already no doubt that the company is viable without technical assistance. This was proved during the first two years of its existence, during the gap (apart from Sanhour UASB inputs) between FaDWaSP Phases IV and V. But FADWASC faces major challenges for years to come. Its institutional sustainability depends on the domestic factors outlined above, not on external support. But continuing such support would make its task easier.
It is at the local level that least progress has been made towards institutional arrange-ments to provide support for sustainable domestic water and sanitation services of appropriate quality. This is understandable, given how many issues have had to be resolved at national level and within FADWASC itself. As this study has shown, there is still ambiguity in user perceptions about the respective roles of the company, of Local Units and of other community-level structures, with frustrated consumers sometimes taking matters into their own hands and making their own repairs or hiring private sector operators for this purpose. While the coverage and quality of the company’s water and wastewater services have improved from the perspective of the local consumer, they are still far from adequate. The same is true of its institutional capacity, especially for consumer liaison and for maintenance work. The intended local institutional scenario for water supply is clear: the company will operate and maintain the service. Local Units’ only role will be liaison and facilitation, but this will diminish as the planning and construction phases are completed. Nevertheless, a clear and stable relationship between the company and these local institutions will remain vital for the sustainability of drinking water services. Faster progress towards a stable relationship could be made if more intensive efforts are made now to structure the company’s communication and liaison with Local Units.
Drinking water supply and sanitation programme in Fayoum, Egypt, 1990-2009
| 159 |
For sanitation and wastewater, the scenario is less clear. Most of the governorate will be served by extensive sewer networks linking each household to a bulk treatment facility, with the whole system operated by the company. How small settlements will be served, and what role other structures such as CDAs might play, has yet to be decided. The institutional sustainability of this component of the sanitation service is therefore not yet assured. Some reasonably stable building blocks are available in the form of Local Units and CDAs – both structures with clear legal status, well established in the minds of the people – but how exactly these institutional elements will be combined with the company still has to be decided.
6.3 Financialandeconomicsustainability
Besides institutional capacity, FADWASC also needs the financial capacity to operate sustainably. Ultimately, as will be shown below, the Holding Company’s subsidiaries may have the capacity and competence to raise investment finance themselves – although support from central government for capital development to meet this basic human need would always be justifiable. For the short to medium term, the challenge is to be able to cover operation and maintenance costs from revenue, and then to be able to meet depreciation costs in the same way. With the more efficient implementation of upgraded commercial procedures, FADWASC has made good progress in this regard, although many difficulties remain.
As in all countries, the environmental, financial and economic dimensions of sustainability are closely linked. Linking environmental and fiscal concerns across all subsectors of Egyptian water management is the growing emphasis on managing demand rather than simply striving to meet it. Given the finite nature of the resource, as noted above, and the rapidly rising demand for water as the population grows and achieves or aspires to a higher standard of living, there is a clear need now to use water more conservatively. At the same time, policy must accept the legitimate need of a large part of the population for the safe and sanitary wastewater treatment that they currently lack. This is likely to increase water consumption per capita. There is therefore a strong policy focus on reducing unaccounted-for water (UFW), which is both environmentally and financially wasteful. It currently comprises about 30% of national drinking water production, or 8 m3 per day.
Despite its high volume of UFW, FADWASC has been moving towards 100% cost recovery on its O&M for water supplies, including depreciation (99.2% in 2008-09: see Annex 2, table 3). A recent tariff increase improves the prospects of covering O&M costs. However, the rapidly expanding provision of sewerage services adds a further complication. National policy allows the company to charge only 35% of the water bill for sewer connections. As these connections increase, the company’s cost recovery declines again. O&M costs for wastewater treatment are substantially higher than those for drinking water supply. Despite improved efficiency at treatment plants, both
6 Sustainability assessment
| 160 |
subsectors have been affected by rapid rises in the cost of electricity and chemicals. While FADWASC is now breaking even on its water supply operation, it is covering only 29% of the O&M and depreciation costs of its sewerage services from sewerage revenues (Annex 2, table 4). Overall, it is covering 70% of all its costs, including depreciation, and 85% if depreciation (which is legally its liability) is excluded from the balance sheet. The company is now in a position to cross-subsidise part of its sewerage costs from the water supply subsector, but there is still a substantial shortfall, which is met each year by the Holding Company with funds provided by the Ministry of Finance through MHUUD. FADWASC remains confident that it could cover all O&M and depreciation costs for its water and wastewater operations, if it were allowed to index the basic water tariff to inflation and if it could close the current UFW gap. It could meet the higher costs of expanded sewerage services through the profit it could make on the increased water consumption that greater use of waterborne sanitation should generate. Affordability studies suggest that the large majority of rural Egyptians could afford water and sanitation tariffs that would permit cost recovery by the companies.
The long standing insistence of national policy on a heavy subsidy for basic domestic water supply is a continuing constraint on FADWASC’s efforts to develop the financial capacity for sustainable operations. A common scenario has emerged: failure to increase subsidised tariffs for many years means that the jump to an economic tariff would now be substantial and controversial. The Holding Company commissioned an affordability study that concluded that only 2.6% of the rural population would be unable to pay a ‘fair’ tariff of LE 0.75/m3 for water, covering supply, O&M and part of the investment cost (Chemonics Egypt, 2009: 5). It argues that alternative means should be found for a targeted subsidy that would help this needy minority to pay their water bills.
From a financial perspective, the water and wastewater systems to which the Netherlands has contributed in Fayoum could not be judged sustainable in 2009. The 25% tariff increase approved at the end of that year brings such sustainability significantly closer. Continuing operational improvements by FADWASC, with FaDWaSP support, have reduced the annual losses that the company makes. Financial sustainability can be attained if the company is ultimately able to exercise (through the Holding Company) its legal discretion to set tariffs at cost recovery levels. Until national policy makers are able to accept this, the financial sustainability of water and sanitation services in Fayoum is not assured – despite the recent improvement in prospects.
The key question then is whether these services are economically sustainable: whether government will continue to be able to provide the subventions that the Holding Company needs in order to meet its subsidiaries’ deficits. It is beyond the scope of this study to establish that, although the matter clearly concerns the Ministry of Finance, MHUUD and EWRA. Reducing the losses implicit in unaccounted-for water will not solve this problem, however. Companies’ costs will rise steeply as the urgently needed
Drinking water supply and sanitation programme in Fayoum, Egypt, 1990-2009
| 161 |
extra sanitation facilities are brought online. Related probable increases in water consumption should cover some, but not all, of the losses that the current tariff structure for waterborne sewerage services imposes. Once again, the conclusion must be that national policy decisions about tariffs and subsidies are a major determinant of sustainability for water and wastewater services in Fayoum and the rest of Egypt.
An equally important sustainability concern at national level is whether Egypt now has the economic capacity and systems to generate the massive additional investment capital still needed to bring water and wastewater facilities up to appropriate standards – or whether continued partial dependence on donor funding is likely. Capital financing arrangements for drinking water and wastewater systems are in transition. NOPWASD has for some time been responsible for planning, designing and supervising the construction of major infrastructure for the subsector. It receives capital subventions from the Ministry of Finance for this purpose, as well as donor contributions. Like the Holding Company, it falls under MHUUD. Unlike the Holding Company, it has been widely criticised for its inefficiency and accused of at least partial responsibility for the long delays that are often experienced in the completion and commissioning of new water and wastewater transfer and treatment facilities. It is likely to be superseded over the coming years by alternative capital finance arrangements. One possibility is for the Holding Company itself to raise development finance, underwritten by government guarantees. Public-private partnerships are already being piloted, although it remains to be seen whether they achieve net benefits for the state. They may relieve govern-ment of the need to finance construction of new facilities, but the Holding Company must then pay economic rates to the owners of such plant for the water or treatment services they provide – and may require state subsidy in order to be able to do this.
One indicator of NOPWASD’s decline is the current master planning process for the subsector, up to 2037. This is being co-ordinated by the Holding Company, not by NOPWASD, and has been organised on the basis of individual master plans by each subsidiary company. Although it has provided a welcome opportunity to provide new structure and direction for the subsector, this master plan will have weaknesses, arising in part from the rather hasty and inadequately resourced way in which subsidiary companies had to prepare it. Another obvious constraint on the new master plan is the lack to date of an integrated policy for the drinking water and sanitation subsector (section 2.6). One key role the master plan should play concerns medium to long-term budget forecasts, for which the Holding Company is again taking stronger responsibility in consultation with the Ministry of Finance.
6.4 Summaryandconclusions
Despite being one of the poorest governorates in Egypt, Fayoum has been in the fore front of local policy and institutional development for water and sanitation, largely because of the advisory support that the five phases of FaDWaSP have provided. Since 1990, there
6 Sustainability assessment
| 162 |
has been a constant exchange of ideas and experience between Fayoum, Cairo and the rest of the country. Egypt has learned many lessons from Fayoum; and Fayoum’s progress cannot, of course, be viewed in isolation from the ongoing national debate and developments regarding appropriate policy for the sector.
Fayoum’s experience mirrors that of the rest of the country in showing that the conversion of a water and sanitation utility into a commercially oriented and structured parastatal company is viable and improves standards of service. This is a profound transformation that requires the reorientation of minds and working practice as well as of structures and systems. It takes time. It requires a stable institutional and policy framework over at least twice the six year life of FADWASC to date. Needless to say, success depends also on the quality of management and leadership that the company receives, both internally and in the relevant agencies in Cairo.
FADWASC’s largely encouraging progress means that institutional sustainability is a likely prospect for the water and sanitation sector in Fayoum, provided that the stable institutional context required for continued progress is indeed maintained. Similar sustainability can be achieved by water and sanitation companies elsewhere in Egypt, as long as the policy framework remains conducive and the required resources and leadership are in place. Indeed, FADWASC is not the only company making good progress in this regard.
Financial and economic sustainability remain uncertain, however. Present national policy on tariffs precludes financial sustainability for FADWASC and the other compa-nies, although FADWASC has shown that deficits can be significantly narrowed by enhanced technologies, systems and procedures. Fayoum’s experience also confirms that of national studies: financial sustainability could be attained fairly easily with tariff adjustments. A recent tariff increase improves the prospects of covering O&M costs. From the state’s perspective, the economic sustainability of current levels of subsidy is uncertain. Affordability studies suggest that the large majority of rural Egyptians could afford water and sanitation tariffs that would permit cost recovery by the companies. Alternative social protection approaches could be explored for the relatively small numbers who could not afford to pay.
Although not the focus of this study, the environmental sustainability of Fayoum water and wastewater services is not assured either. Even with more conservative management, demand is likely to rise significantly, as it will elsewhere in Egypt. Supply will not. Especially in the conditions of Fayoum, the polluting impacts of drinking and waste-water treatment must be carefully managed. It is uncertain whether they can be kept within ecologically sustainable limits. The integrated governorate water resources plans that are currently being piloted through the National Water Resource Plan Co-ordination Project are one of the measures being taken to try to address this challenge.Fayoum’s experience shows that the company, its customers and local institutions
Drinking water supply and sanitation programme in Fayoum, Egypt, 1990-2009
| 163 |
must work their way through a lengthy and challenging process of transition in order to achieve the satisfactory and sustainable service to which they all aspire. It also highlights several issues that need focused attention during this transition.
• Rural people take a long time to understand and accept the shift in governance arrangements that the creation of the water and sanitation company implies. Many still see it a as a government service. Most still believe that their Local Units have a major role to play in the planning, operation and maintenance of these systems – either through direct practical action or through liaison with the company. Local Units, of course, are keen to play such a role, and may fear the loss of influence that the company’s mandate implies. Confusion and potential conflict can be reduced during the lengthy transition phase, through structured, regular arrange-ments to brief, consult and where appropriate involve Local Units in the develop-ment and maintenance of water and sanitation services;
• As in all sectors and societies, communication is the key to progress. Within FADWASC or any similar company, enhanced communications between departments at head-quarters and district levels would enhance operations. Even more important is communication between the company and the public. Ignorance and rumour about what the company is trying to do, and about how its maintenance and billing systems work, are bound to slow its achievement of universal, high quality service. Foundations for stronger public relations and information programmes have been laid by the recent expansion of FADWASC’s Public Awareness Department. The company’s new chairman has started a programme of weekly district visits. Such enhancements are a priority for this or any similar company;
• Over this long transition period, the full health benefits of enhanced water supplies are only slowly realised because of the extra time needed to install adequate wastewater arrangements. Although waterborne sewerage systems are urgently being expanded, it will still be some years before a majority of the rural population can enjoy this service. In the meantime, evacuation arrangements for household sewage tanks are generally inadequate. A variable mix of local institutions and private contractors provide evacuation services (and the company occasionally does so too), but this study has shown that the overall situation is still one of widespread discomfort and health risks, compounded by the disposal in canals and drains of much of what is collected from household tanks. Current policy seems to be just to focus on installing waterborne sewerage as fast as possible, so that the remaining period of transition will be minimised, and not to include short-term efforts to upgrade household tank evacuation services. Part of the national priority could be to assess, for each locality, what services are currently available, what institutions are involved, and how capacity and institutional co-ordination can be enhanced to reduce this significant constraint on rural standards of living.
6 Sustainability assessment
| 164 |
FADWASC has a range of technical and administrative achievements to share with its sister companies elsewhere in Egypt. Meetings with the other companies are already being held to transfer these lessons. Low cost wastewater treatment technologies are one area where Fayoum experience has been instructive. Another sanitation issue remains unresolved, however. This concerns strategies for small and remoter settle-ments that cannot easily be connected to the main sewerage networks. The challenges are both technical and institutional. They are likely to involve a significant role for other local institutions, while the water and sanitation company takes sole responsibility for services to the rest of the population.

Drinking water supply and sanitation programme in Fayoum, Egypt, 1990-2009
| 165 |

Annexes
Drinking water supply and sanitation programme in Fayoum, Egypt, 1990-2009
| 167 |
Annexe 1 About IOB
ObjectivesThe objective of the Policy and Operations Evaluation Department (IOB) is to increase insight into the implementation and effects of Dutch foreign policy. IOB meets the need for independent evaluation of policy and operations in all policy fields falling under the Homogenous Budget for International Cooperation (HGIS). IOB also advises on the planning and implementation of the evaluations for which policy departments and embassies are responsible. Its evaluations enable the Minister of Foreign Affairs and the Minister for Development Cooperation to account to parliament for policy and the allocation of resources. In addition, the evaluations aim to derive lessons for the future.
Efforts are accordingly made to incorporate the findings of evaluations into the Ministry of Foreign Affairs’ policy cycle. Evaluation reports are used to provide targeted feedback, with a view to improving both policy intentions and implementation. Insight into the outcome of implemented policy allows policymakers to devise measures that are more effective and focused.
ApproachandmethodologyIOB has a staff of experienced evaluators and its own budget. When carrying out evaluations, it calls on the assistance of external experts with specialised knowledge of the topic under investigation. To monitor its own quality, it sets up a reference group for each evaluation, which includes not only external experts but also interested parties from within the Ministry.
ProgrammeThe evaluation programme of IOB is part of the programmed evaluations annexe of the explanatory memorandum to the budget of the Ministry of Foreign Affairs.
AnorganisationindevelopmentSince IOB’s establishment in 1977, major shifts have taken place in its approach, areas of focus and responsibilities. In its early years, its activities took the form of separate project evaluations for the Minister for Development Cooperation. Around 1985, evaluations became more comprehensive, taking in sectors, themes and countries. Moreover, IOB’s reports were submitted to parliament, thus entering the public domain.
1996 saw a review of foreign policy and a reorganisation of the Ministry of Foreign Affairs. As a result, IOB’s mandate was extended to the Dutch government’s entire foreign policy. In recent years, it has extended its partnerships with similar depart-ments in other countries, for instance through joint evaluations.

Annexe 1 About IOB
| 168 |
Finally, IOB also aims to expand its methodological repertoire. This includes greater emphasis on statistical methods of impact evaluation. As of 2007 IOB undertakes policy reviews as a type of evaluation.
Drinking water supply and sanitation programme in Fayoum, Egypt, 1990-2009
| 169 |
Annexe 2 Terms of reference
TermsofReferenceforimpactevaluationofdrinkingwatersupplyandsanitationprogrammessupportedbytheNetherlandsinEgypt,FayoumGovernorate1990-2009
January2008
1 Rationale,scopeandpurposeoftheevaluationDutch development cooperation has been active in water supply for over 30 years. The Policy and Operations Evaluation Department (IOB) of the Netherlands Ministry of Foreign Affairs has initiated a series of impact evaluations of support to programmes for water supply and sanitary facilities. This impact evaluation examines the programmes in Egypt, Fayoum Governorate, which have been supported by the Netherlands since 1990.
The focus of the evaluation will be on the impact of the programmes at micro level. Egypt and the Netherlands are both signatories to the Millennium Development Goals, which include targets for reducing the proportion of people without sustained access to safe drinking water and to improved sanitary facilities. The ultimate purpose of support to water supply and sanitary facilities goes beyond access: this support is intended to improve the living conditions of the population, and health in particular. There is consensus on such ultimate impacts but conventional studies do not usually quantify them. Quantification is a key characteristic of the impact evaluation. In addition to studying the impact on the target population, the evaluation will assess the contribution of the institutions concerned to the quality of services and sustainable results.
The evaluation will cover the 1990-2009 period. In this period the Fayoum Drinking Water Supply and Sanitation Projects I-IV were implemented and Phase V was started up. Phase V runs up to 2012. As explained in section 4 the analyses of impact on health will be based on recall data for the 1990-2008 period and data kept at local health units for the effects of Phase V interventions on health in the 2008-2009 period. Dutch support consists of financial and technical assistance. The total Dutch contribution for Phases I to IV amounted to EUR 28,2 million. The contribution of the Government of Egypt to the projects has been calculated at LE 119,1 million (EUR 14,4 million at the current exchange rate). Phase V started at a projected Dutch contribution of EUR 17,4 million and an Egyptian contribution of LE 97,5 million.
The purpose of the impact evaluation is to account for the support provided as well as to draw lessons that will be useful for water supply and sanitation policy development and implementation. The study will be undertaken in consultation with Egyptian
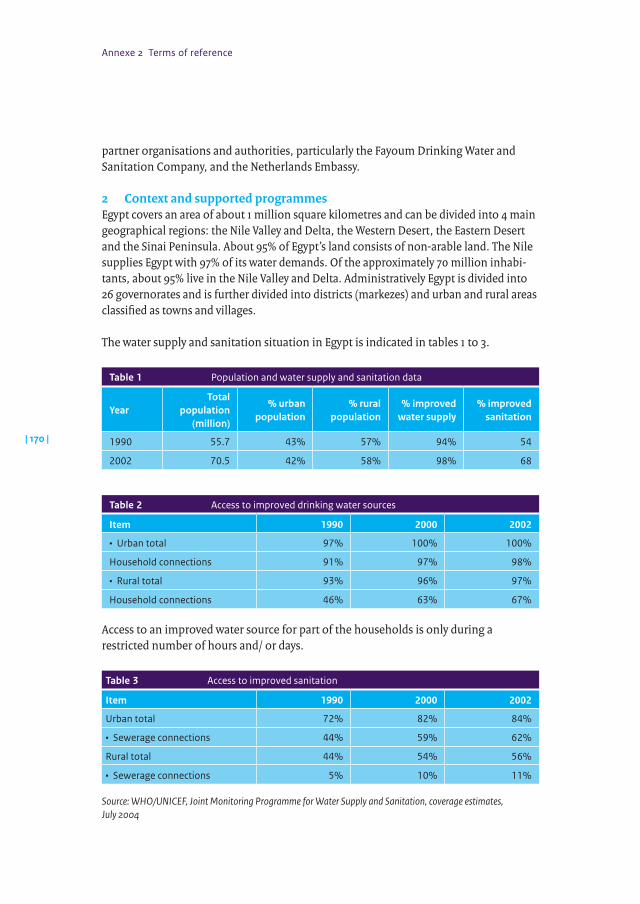
Annexe 2 Terms of reference
| 170 |
partner organisations and authorities, particularly the Fayoum Drinking Water and Sanitation Company, and the Netherlands Embassy.
2 ContextandsupportedprogrammesEgypt covers an area of about 1 million square kilometres and can be divided into 4 main geographical regions: the Nile Valley and Delta, the Western Desert, the Eastern Desert and the Sinai Peninsula. About 95% of Egypt’s land consists of non-arable land. The Nile supplies Egypt with 97% of its water demands. Of the approximately 70 million inhabi-tants, about 95% live in the Nile Valley and Delta. Administratively Egypt is divided into 26 governorates and is further divided into districts (markezes) and urban and rural areas classified as towns and villages.
The water supply and sanitation situation in Egypt is indicated in tables 1 to 3.
Table 1 Population and water supply and sanitation data
YearTotal
population(million)
% urban population
% rural population
% improved water supply
% improved sanitation
1990 55.7 43% 57% 94% 54
2002 70.5 42% 58% 98% 68
Table 2 Access to improved drinking water sources
Item 1990 2000 2002
• Urban total 97% 100% 100%
Household connections 91% 97% 98%
• Rural total 93% 96% 97%
Household connections 46% 63% 67%
Access to an improved water source for part of the households is only during a restricted number of hours and/ or days.
Table 3 Access to improved sanitation
Item 1990 2000 2002
Urban total 72% 82% 84%
• Sewerage connections 44% 59% 62%
Rural total 44% 54% 56%
• Sewerage connections 5% 10% 11%
Source: WHO/UNICEF, Joint Monitoring Programme for Water Supply and Sanitation, coverage estimates, July 2004
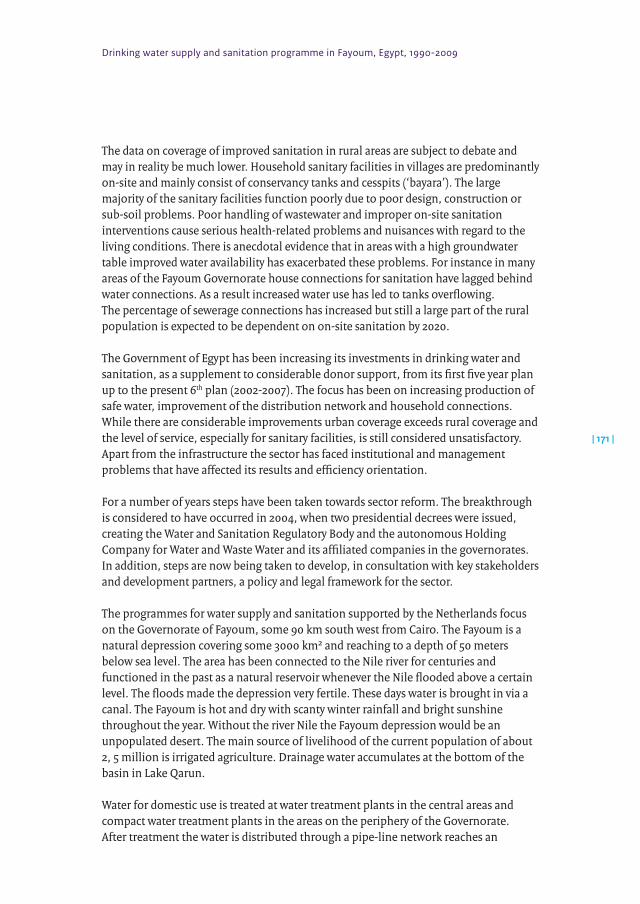
Drinking water supply and sanitation programme in Fayoum, Egypt, 1990-2009
| 171 |
The data on coverage of improved sanitation in rural areas are subject to debate and may in reality be much lower. Household sanitary facilities in villages are predominantly on-site and mainly consist of conservancy tanks and cesspits (‘bayara’). The large majority of the sanitary facilities function poorly due to poor design, construction or sub-soil problems. Poor handling of wastewater and improper on-site sanitation interventions cause serious health-related problems and nuisances with regard to the living conditions. There is anecdotal evidence that in areas with a high groundwater table improved water availability has exacerbated these problems. For instance in many areas of the Fayoum Governorate house connections for sanitation have lagged behind water connections. As a result increased water use has led to tanks overflowing. The percentage of sewerage connections has increased but still a large part of the rural population is expected to be dependent on on-site sanitation by 2020.
The Government of Egypt has been increasing its investments in drinking water and sanitation, as a supplement to considerable donor support, from its first five year plan up to the present 6th plan (2002-2007). The focus has been on increasing production of safe water, improvement of the distribution network and household connections. While there are considerable improvements urban coverage exceeds rural coverage and the level of service, especially for sanitary facilities, is still considered unsatisfactory. Apart from the infrastructure the sector has faced institutional and management problems that have affected its results and efficiency orientation.
For a number of years steps have been taken towards sector reform. The breakthrough is considered to have occurred in 2004, when two presidential decrees were issued, creating the Water and Sanitation Regulatory Body and the autonomous Holding Company for Water and Waste Water and its affiliated companies in the governorates. In addition, steps are now being taken to develop, in consultation with key stakeholders and development partners, a policy and legal framework for the sector.
The programmes for water supply and sanitation supported by the Netherlands focus on the Governorate of Fayoum, some 90 km south west from Cairo. The Fayoum is a natural depression covering some 3000 km² and reaching to a depth of 50 meters below sea level. The area has been connected to the Nile river for centuries and functioned in the past as a natural reservoir whenever the Nile flooded above a certain level. The floods made the depression very fertile. These days water is brought in via a canal. The Fayoum is hot and dry with scanty winter rainfall and bright sunshine throughout the year. Without the river Nile the Fayoum depression would be an unpopulated desert. The main source of livelihood of the current population of about 2, 5 million is irrigated agriculture. Drainage water accumulates at the bottom of the basin in Lake Qarun.
Water for domestic use is treated at water treatment plants in the central areas and compact water treatment plants in the areas on the periphery of the Governorate. After treatment the water is distributed through a pipe-line network reaches an
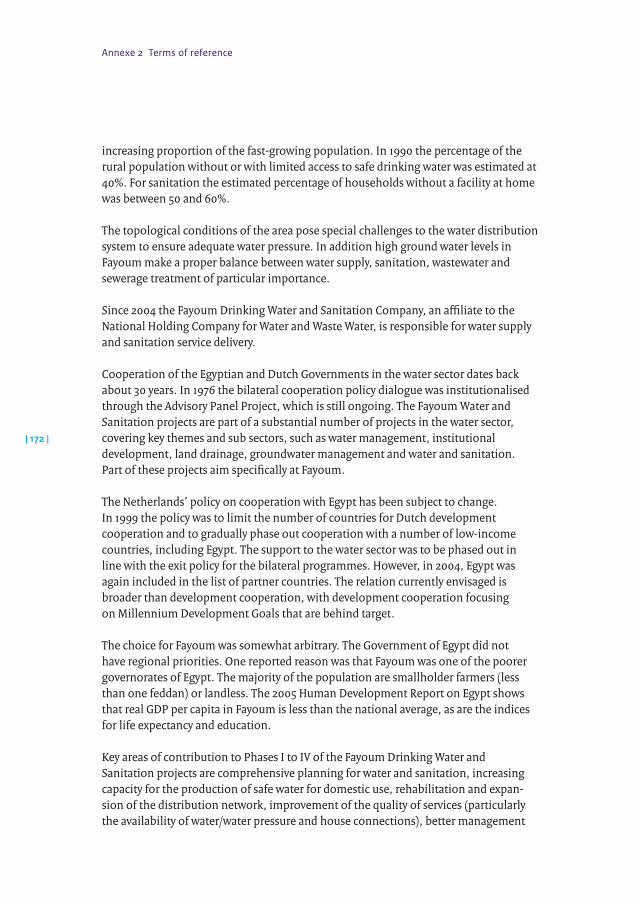
Annexe 2 Terms of reference
| 172 |
increasing proportion of the fast-growing population. In 1990 the percentage of the rural population without or with limited access to safe drinking water was estimated at 40%. For sanitation the estimated percentage of households without a facility at home was between 50 and 60%.
The topological conditions of the area pose special challenges to the water distribution system to ensure adequate water pressure. In addition high ground water levels in Fayoum make a proper balance between water supply, sanitation, wastewater and sewerage treatment of particular importance.
Since 2004 the Fayoum Drinking Water and Sanitation Company, an affiliate to the National Holding Company for Water and Waste Water, is responsible for water supply and sanitation service delivery.
Cooperation of the Egyptian and Dutch Governments in the water sector dates back about 30 years. In 1976 the bilateral cooperation policy dialogue was institutionalised through the Advisory Panel Project, which is still ongoing. The Fayoum Water and Sanitation projects are part of a substantial number of projects in the water sector, covering key themes and sub sectors, such as water management, institutional development, land drainage, groundwater management and water and sanitation. Part of these projects aim specifically at Fayoum.
The Netherlands’ policy on cooperation with Egypt has been subject to change. In 1999 the policy was to limit the number of countries for Dutch development cooperation and to gradually phase out cooperation with a number of low-income countries, including Egypt. The support to the water sector was to be phased out in line with the exit policy for the bilateral programmes. However, in 2004, Egypt was again included in the list of partner countries. The relation currently envisaged is broader than development cooperation, with development cooperation focusing on Millennium Development Goals that are behind target.
The choice for Fayoum was somewhat arbitrary. The Government of Egypt did not have regional priorities. One reported reason was that Fayoum was one of the poorer governorates of Egypt. The majority of the population are smallholder farmers (less than one feddan) or landless. The 2005 Human Development Report on Egypt shows that real GDP per capita in Fayoum is less than the national average, as are the indices for life expectancy and education.
Key areas of contribution to Phases I to IV of the Fayoum Drinking Water and Sanitation projects are comprehensive planning for water and sanitation, increasing capacity for the production of safe water for domestic use, rehabilitation and expan-sion of the distribution network, improvement of the quality of services (particularly the availability of water/water pressure and house connections), better management
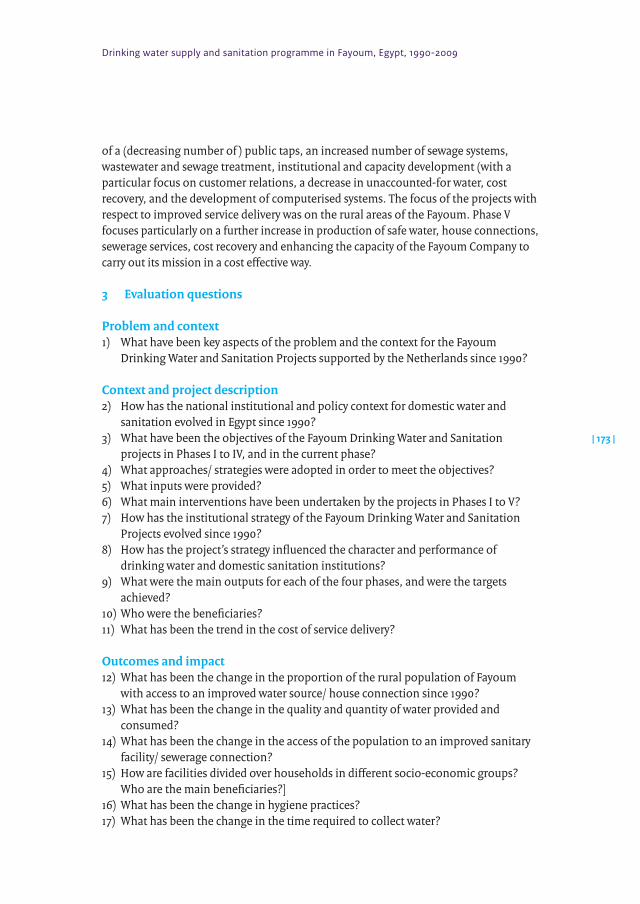
Drinking water supply and sanitation programme in Fayoum, Egypt, 1990-2009
| 173 |
of a (decreasing number of ) public taps, an increased number of sewage systems, wastewater and sewage treatment, institutional and capacity development (with a particular focus on customer relations, a decrease in unaccounted-for water, cost recovery, and the development of computerised systems. The focus of the projects with respect to improved service delivery was on the rural areas of the Fayoum. Phase V focuses particularly on a further increase in production of safe water, house connections, sewerage services, cost recovery and enhancing the capacity of the Fayoum Company to carry out its mission in a cost effective way.
3 Evaluationquestions
Problemandcontext1) What have been key aspects of the problem and the context for the Fayoum
Drinking Water and Sanitation Projects supported by the Netherlands since 1990?
Contextandprojectdescription2) How has the national institutional and policy context for domestic water and
sanitation evolved in Egypt since 1990?3) What have been the objectives of the Fayoum Drinking Water and Sanitation
projects in Phases I to IV, and in the current phase?4) What approaches/ strategies were adopted in order to meet the objectives?5) What inputs were provided?6) What main interventions have been undertaken by the projects in Phases I to V?7) How has the institutional strategy of the Fayoum Drinking Water and Sanitation
Projects evolved since 1990?8) How has the project’s strategy influenced the character and performance of
drinking water and domestic sanitation institutions?9) What were the main outputs for each of the four phases, and were the targets
achieved?10) Who were the beneficiaries? 11) What has been the trend in the cost of service delivery?
Outcomesandimpact12) What has been the change in the proportion of the rural population of Fayoum
with access to an improved water source/ house connection since 1990?13) What has been the change in the quality and quantity of water provided and
consumed?14) What has been the change in the access of the population to an improved sanitary
facility/ sewerage connection?15) How are facilities divided over households in different socio-economic groups?
Who are the main beneficiaries?] 16) What has been the change in hygiene practices?17) What has been the change in the time required to collect water?
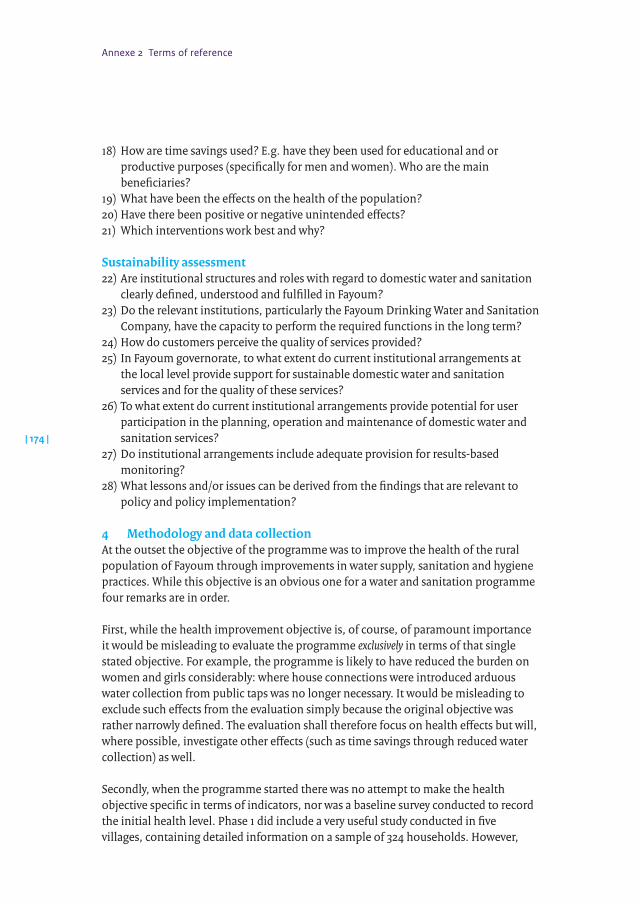
Annexe 2 Terms of reference
| 174 |
18) How are time savings used? E.g. have they been used for educational and or productive purposes (specifically for men and women). Who are the main beneficiaries?
19) What have been the effects on the health of the population?20) Have there been positive or negative unintended effects?21) Which interventions work best and why?
Sustainabilityassessment22) Are institutional structures and roles with regard to domestic water and sanitation
clearly defined, understood and fulfilled in Fayoum?23) Do the relevant institutions, particularly the Fayoum Drinking Water and Sanitation
Company, have the capacity to perform the required functions in the long term?24) How do customers perceive the quality of services provided?25) In Fayoum governorate, to what extent do current institutional arrangements at
the local level provide support for sustainable domestic water and sanitation services and for the quality of these services?
26) To what extent do current institutional arrangements provide potential for user participation in the planning, operation and maintenance of domestic water and sanitation services?
27) Do institutional arrangements include adequate provision for results-based monitoring?
28) What lessons and/or issues can be derived from the findings that are relevant to policy and policy implementation?
4 MethodologyanddatacollectionAt the outset the objective of the programme was to improve the health of the rural population of Fayoum through improvements in water supply, sanitation and hygiene practices. While this objective is an obvious one for a water and sanitation programme four remarks are in order.
First, while the health improvement objective is, of course, of paramount importance it would be misleading to evaluate the programme exclusively in terms of that single stated objective. For example, the programme is likely to have reduced the burden on women and girls considerably: where house connections were introduced arduous water collection from public taps was no longer necessary. It would be misleading to exclude such effects from the evaluation simply because the original objective was rather narrowly defined. The evaluation shall therefore focus on health effects but will, where possible, investigate other effects (such as time savings through reduced water collection) as well.
Secondly, when the programme started there was no attempt to make the health objective specific in terms of indicators, nor was a baseline survey conducted to record the initial health level. Phase 1 did include a very useful study conducted in five villages, containing detailed information on a sample of 324 households. However,
Drinking water supply and sanitation programme in Fayoum, Egypt, 1990-2009
| 175 |
this study unfortunately provided almost no health information. It only records the most prominent diseases in the five villages. Notably, it did not record the incidence of diarrhoea, in the public health literature the measure most often used for evaluations of water and sanitation interventions.25
Thirdly, the programme affected rural households in more than one way: by providing them with access to a public water or a house connection, providing them with water more frequently or in greater quantity or of better quality, exposing them to public awareness messages and practices on water use and hygiene, and connecting them to the sewerage system. There is therefore not a single intervention (as in standard impact evaluations where treatment and control groups are compared). Instead, households in different locations in the governorate have been exposed to different components of the programme, at different points in time and to different extents. This situation of ‘heterogeneous treatment’ is not unusual. A regression approach will be used to deal with heterogeneity. A preparatory mission for the study has established that statistical analyses of the impact of the programmes and specific interventions on health for the period from 1990 is not feasible due to lack of location-specific data on the incidence of water and sanitation-related diseases. As a second best option this part of the study will focus on the impact of interventions planned for the coming year. For further details, see the section on sampling, data collection and statistical analyses.
This study is part of a series of studies conducted by IOB to investigate the impact of water and sanitation programmes, where statistical techniques are used to assess whether observed changes (in use of safe water sources, health ..) can be attributed to interventions aimed at those targets or whether they reflect the impact of other changes in the period considered. Another part of the study will use more conventional (non-statistical) evaluation techniques to assess the programme’s achievements in other areas, notably in terms of institutional development and the contribution to quality of services and sustainable results.
InstitutionalissuesThe institutional development of the responsible agency, in this case the Fayoum Drinking Water and Sanitation Company, was the focus of much of the Netherlands’ support through four phases of the project, and will be a key theme for institutional analysis during this study. The evolution through various institutional and organisatio-nal forms to the current structure and mandate has required intensive effort to restructure and build human resources, enhance technical competence and – most importantly – develop the ethos of customer service. At the same time, the company has to maximise its recurrent cost recovery in a policy environment that still constrains its freedom of action.
25 ‘Considerations and health statistics related to impact evaluation of programs for water supply and sanitary facilities in Egypt’, mimeo, no author, no date (November 2007), Fayoum Drinking Water and Sanitation Company; literature references in footnotes 1-5 of that paper.
Annexe 2 Terms of reference
| 176 |
The focus of this study is on the impact of the Netherlands’ support on rural people in Fayoum as well as assessment of the contribution of the evolving institutional and policy frameworks to sustainable results – notably, the role of the various ministries involved in the water sector, the capacity, influence and sustainability of the new Holding Company, and the influence of national pricing policy on domestic water supply and sanitation. The recently established Water and Sanitation Regulatory Authority has a key role to play in many of these areas, and the study should serve as a useful input to its future strategies.
The Egyptian domestic water and sanitation sector already recognises the importance of the Fayoum Company’s experience, which is often cited as a model to which other governorates should refer. This study will assess the progress that this core institution has made towards sustainability and the ways in which its evolution has influenced the quality of drinking water and domestic sanitation services over the period.
Linked to these concerns is the question of how rural people in Fayoum perceive the performance of the sector. While the approach in Egypt has not involved the formation of local user institutions, rural people do – in theory – have various ways in which to engage the responsible agencies. The study will investigate what role, if any, Local Councils and Local Units play in this regard; whether citizens’ voices are heard at the level of the governorate, either through direct contact or via these local institutions; and, of course, how effectively consumers can influence the company’s planning and performance through direct contact with it (notably, though not only, through its customer relations offices). It will also review potential differentials in institutional structure and performance across the spectrum from more isolated rural hamlets to the comparatively large ‘villages’ and towns that have also been served by the project.
Again partly with Dutch support, there have been important developments in community institutions during the study period. Large numbers of community-based organisations (often locally called NGOs) have emerged for a variety of local development purposes, and enthusiastic adoption of farmer field school approaches has significantly strengthened rural people’s organisational capacity. These developments have not focused on domestic water and sanitation, but their relevance – notably to hygiene practices, solid waste management and thus human health – will be assessed.
The parallel sector of water resource management is all-important for Egyptian livelihoods. It has been the scene of intensive institutional development efforts, supported in Fayoum by the Netherlands. This study will assess the relevance of water management institutions to the achievement of satisfactory and sustainable outcomes in the drinking water and domestic sanitation sector. One clear linkage concerns the growing role of irrigation water user organisations in the operation and management of sewage systems for small rural settlements.
Drinking water supply and sanitation programme in Fayoum, Egypt, 1990-2009
| 177 |
MethodologyforinstitutionalanalysisInstitutional developments in Fayoum appear largely to have reflected the evolution of national policy and strategy - although Fayoum is to some extent seen as an institutional model by the central authorities, and there has certainly been much interaction between Fayoum and national strategy. For these reasons, this study’s institutional enquiries will be balanced across the central level, the company (and other institutions) at the level of Fayoum governorate, and the user level.
Questions for the institutional analysis will be answered in the following ways:
• a review of documentation;• discussions with key informants in Cairo and Fayoum City;• interviews with local government authorities and company officials at district and local
levels, including Local Councils, Local Units and company customer relations staff;• investigation into rural people’s perceptions through the main survey instrument
and focus group discussions, with particular reference to • views of the company’s structure and performance;• views on the role and performance of local government institutions with regard to
domestic water and sanitation;• views on the role of other water management institutions and CBOs in domestic
water supply and sanitation.• the above issues may also be discussed in additional focus groups linked to farmer
field schools or water user organisations.
Sampling,datacollectionandstatisticalanalysesBoth parts of the study will make use of data to be collected by a questionnaire and focus group discussions with households for a sample of Fayoumi locations. These data will cover: • the history of interventions;• changes in water use (for drinking and other purposes): sources used (tap, canals,
house connection, neighbour’s water supply, groundwater) and quantities;• changes in sanitation (notably a switch to house connection to the sewer);• changes in water availability (pressure);• perceived changes in the incidence of water and sanitation-related diseases such as
diarrhoea and eye infections;• messages on hygiene received and changes in practices;• household perceptions of the quality of service delivery and the effectiveness of the
institutional arrangements.
A total of about 150 locations will be selected. Fifty locations will be selected randomly from Fayoum governorate to answer questions on programme outcomes retrospectively. Another 100 locations (50 affected and another 50 not affected by programme activities)
Annexe 2 Terms of reference
| 178 |
will be sampled to assess the water and sanitation-related interventions during the first half of 2008 and health outcomes in 2009. Households in the prospective study will be interviewed twice: a baseline will be held early in 2008 and households will be revisited in 2009.
The statistical analysis of impact on health will focus on the impact of interventions planned for the coming year. These might be new house connections (for water or sewerage) or improved water availability. Provisional indications are that improve-ments in sanitation will be the most important interventions. Which locations would be affected by these changes can be established in consultation with the company. Accordingly, the sample can be designed so to ensure an adequate representation of these locations. A baseline will be conducted early in 2008. For sample locations diarrhoea incidence (and other health indicators) will be recorded in the baseline and again a year later. The statistical analysis will then indicate how the various interventions in that period improved health.
To the extent that similar interventions were used in the earlier period (1990-2007) these results can show the effectiveness of the programme. However, it should be noted that the evaluation may not do full justice to the programme since the impact of particular interventions may have been greater initially than now, with a large number of households already having house connections. Also, in Phase V, there now is much emphasis on sanitation; this was less so in the early 1990s. These drawbacks are unavoidable: since disaggregated health records are not systematically kept at health centres it is impossible to record changes in health ex post. On the other hand the proposed approach involves a baseline, making the results more reliable and therefore convincing. It also provides a baseline for future impact studies.
It is envisaged that the impact will be estimated by a variant of the method of ’double differencing’. There are differences in impact over both time (2008-09) and space, and it is the way two locations differ in the changes they have experienced over time which can be used to identify the impact of the programme. To take a simple example, suppose there are two locations and diarrhoea incidence has fallen in both. This partly reflects a change which has affected the two locations in the same manner, say an improvement in health knowledge unrelated to the programme. It partly reflects the programme, for example one of the locations has received training in hygiene practices and this has led to an additional reduction in diarrhoea. Clearly, only the second change can be attributed to the programme. Changes (over time) in diarrhoea on a number of measured determinants would be regressed, including a variable indicating whether a location had received an intervention for hygiene promotion in the period considered. The general reason (the unmeasured general improvement in health knowledge) would then end up in the constant of the regression while the specific reason would be measured by the coefficient on the hygiene intervention variable. If that coefficient is statistically significant that is evidence that that
Drinking water supply and sanitation programme in Fayoum, Egypt, 1990-2009
| 179 |
intervention has resulted in an improvement in health. (Note that the confounding effect of other determinants of health is eliminated by the differencing procedure).
There is no reason to include only a single intervention variable amongst the explanatory variables in the regression for diarrhoea incidence. We can allow for the heterogeneity of the programme by including variables which characterise the intervention for a particular location, e.g. in addition to hygiene the availability of water, the extent of house connections (for water and for sanitation) and so on. In each case the coefficient on such a variable indicates how much impact (in terms of reduced diarrhoea) may be expected from a change in that variable. The results therefore not only indicate what works but also by how much.
Annex 1 to the Terms of Reference provides the evaluation matrix that will guide the selection of variables, data collection and analysis.
5 OrganisationandtimingThe impact evaluation will be a joint effort of the Policy and Operations Evaluation Department of the Netherlands Ministry of Foreign Affairs (IOB), the Amsterdam Institute for International Development (AIID) and the American University in Cairo. IOB will be responsible for overall supervision, funding the study, and the final report. AIID is the main consultant for the implementation of the study and will establish collaboration with the Egyptian research organisation for this purpose.
The major activity of the study will be the village-level data collection. This requires sophisticated quantitative and qualitative data-collection techniques. A substantial involvement of Egyptian researchers is envisaged, both in the data collection and in the subsequent analysis.
The tentative planning of the study is as follows:
2008 January-March questionnaire development, sample selection (50+100 locations)
report section on description of programme 2008 April field test of questionnaire2008 May – July fielding survey, data entry and cleaning mission for
institutional assessment2008 September preliminary report section on statistical analysis of
retrospective impact questions report section on institutional analysis 2009 May-June revisit of households and local health units from
100 locations data entry and cleaning2009 September draft report
Annexe 2 Terms of reference
| 180 |
2009 October workshop in Egypt finalisation of report
A reference group will be appointed for the impact evaluation. This group will comment and advise on the main draft documents for the impact evaluation.
The group will include three members who will also serve on reference groups for other impact evaluations of Dutch support to the water supply and sanitation sector:
• a representative of the Netherlands Ministry of Foreign Affairs department for environment and water;
• a representative of the Ministry’s department of effectiveness and quality of development cooperation;
• an expert from the IRC International Water and Sanitation Centre.
The reference group will also include (one or two) members who can offer specific expertise for the impact evaluation in Egypt.
The draft report of the study of the programmes will be shared with the Fayoum Drinking Water and Sanitation Company, the Fayoum Drinking Water and Sanitation project Phase V, and the Netherlands Embassy for comments. IOB has final responsibility for the report.
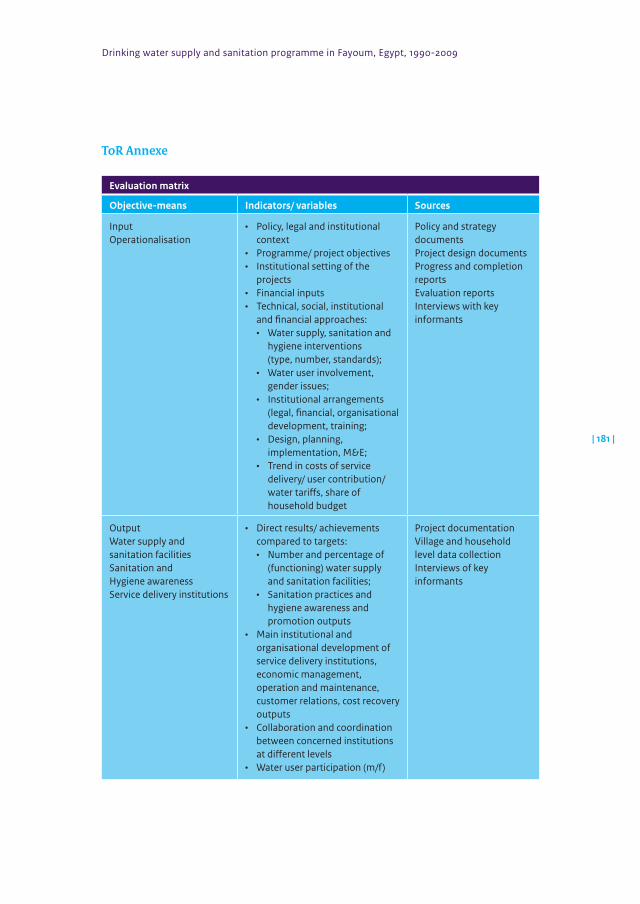
Drinking water supply and sanitation programme in Fayoum, Egypt, 1990-2009
| 181 |
ToRAnnexe
Evaluation matrix
Objective-means Indicators/ variables Sources
InputOperationalisation
• Policy, legal and institutional context
• Programme/ project objectives• Institutional setting of the
projects• Financial inputs• Technical, social, institutional
and financial approaches:• Water supply, sanitation and
hygiene interventions (type, number, standards);
• Water user involvement, gender issues;
• Institutional arrangements (legal, financial, organisational development, training;
• Design, planning, implementation, M&E;
• Trend in costs of service delivery/ user contribution/ water tariffs, share of household budget
Policy and strategy documentsProject design documentsProgress and completion reportsEvaluation reportsInterviews with key informants
OutputWater supply and sanitation facilitiesSanitation and Hygiene awarenessService delivery institutions
• Direct results/ achievements compared to targets:• Number and percentage of
(functioning) water supply and sanitation facilities;
• Sanitation practices and hygiene awareness and promotion outputs
• Main institutional and organisational development of service delivery institutions, economic management, operation and maintenance, customer relations, cost recovery outputs
• Collaboration and coordination between concerned institutions at different levels
• Water user participation (m/f)
Project documentationVillage and household level data collectionInterviews of key informants
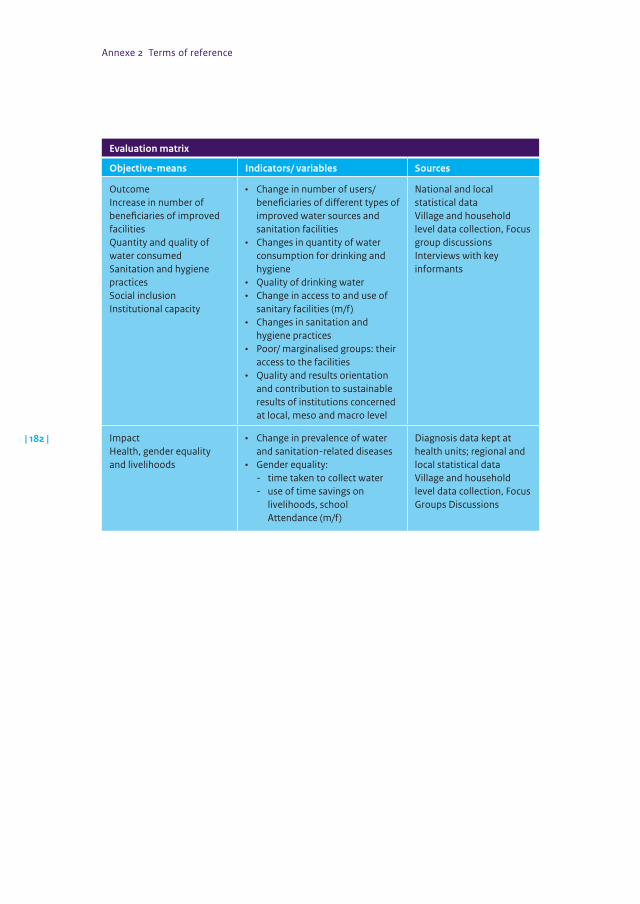
Annexe 2 Terms of reference
| 182 |
Evaluation matrix
Objective-means Indicators/ variables Sources
OutcomeIncrease in number of beneficiaries of improved facilities Quantity and quality of water consumedSanitation and hygiene practicesSocial inclusionInstitutional capacity
• Change in number of users/ beneficiaries of different types of improved water sources and sanitation facilities
• Changes in quantity of water consumption for drinking and hygiene
• Quality of drinking water• Change in access to and use of
sanitary facilities (m/f)• Changes in sanitation and
hygiene practices• Poor/ marginalised groups: their
access to the facilities • Quality and results orientation
and contribution to sustainable results of institutions concerned at local, meso and macro level
National and local statistical dataVillage and household level data collection, Focus group discussionsInterviews with key informants
Impact Health, gender equality and livelihoods
• Change in prevalence of water and sanitation-related diseases
• Gender equality: - time taken to collect water - use of time savings on
livelihoods, school Attendance (m/f)
Diagnosis data kept at health units; regional and local statistical dataVillage and household level data collection, Focus Groups Discussions
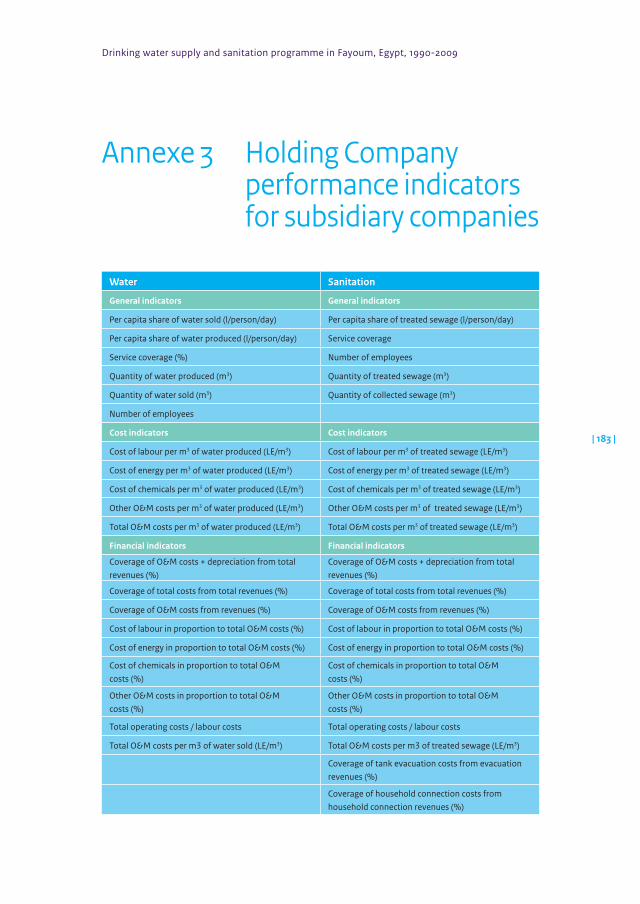
Drinking water supply and sanitation programme in Fayoum, Egypt, 1990-2009
| 183 |
Annexe 3 Holding Company performance indicators for subsidiary companies
Water Sanitation
General indicators General indicators
Per capita share of water sold (l/person/day) Per capita share of treated sewage (l/person/day)
Per capita share of water produced (l/person/day) Service coverage
Service coverage (%) Number of employees
Quantity of water produced (m3) Quantity of treated sewage (m3)
Quantity of water sold (m3) Quantity of collected sewage (m3)
Number of employees
Cost indicators Cost indicators
Cost of labour per m3 of water produced (LE/m3) Cost of labour per m3 of treated sewage (LE/m3)
Cost of energy per m3 of water produced (LE/m3) Cost of energy per m3 of treated sewage (LE/m3)
Cost of chemicals per m3 of water produced (LE/m3) Cost of chemicals per m3 of treated sewage (LE/m3)
Other O&M costs per m3 of water produced (LE/m3) Other O&M costs per m3 of treated sewage (LE/m3)
Total O&M costs per m3 of water produced (LE/m3) Total O&M costs per m3 of treated sewage (LE/m3)
Financial indicators Financial indicators
Coverage of O&M costs + depreciation from total revenues (%)
Coverage of O&M costs + depreciation from total revenues (%)
Coverage of total costs from total revenues (%) Coverage of total costs from total revenues (%)
Coverage of O&M costs from revenues (%) Coverage of O&M costs from revenues (%)
Cost of labour in proportion to total O&M costs (%) Cost of labour in proportion to total O&M costs (%)
Cost of energy in proportion to total O&M costs (%) Cost of energy in proportion to total O&M costs (%)
Cost of chemicals in proportion to total O&M costs (%)
Cost of chemicals in proportion to total O&M costs (%)
Other O&M costs in proportion to total O&M costs (%)
Other O&M costs in proportion to total O&M costs (%)
Total operating costs / labour costs Total operating costs / labour costs
Total O&M costs per m3 of water sold (LE/m3) Total O&M costs per m3 of treated sewage (LE/m3)
Coverage of tank evacuation costs from evacuation revenues (%)
Coverage of household connection costs from household connection revenues (%)
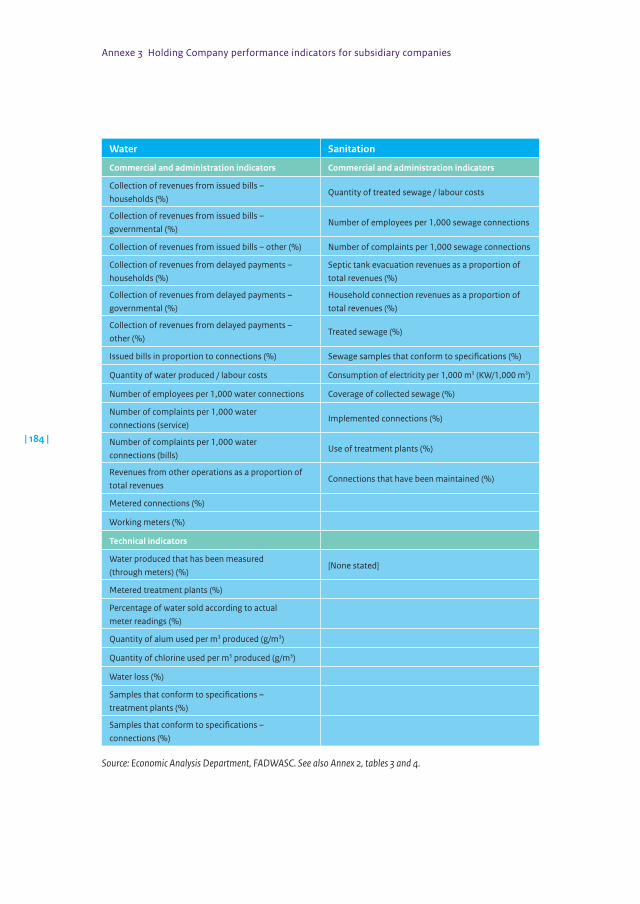
Annexe 3 Holding Company performance indicators for subsidiary companies
| 184 |
Water Sanitation
Commercial and administration indicators Commercial and administration indicators
Collection of revenues from issued bills – households (%)
Quantity of treated sewage / labour costs
Collection of revenues from issued bills – governmental (%)
Number of employees per 1,000 sewage connections
Collection of revenues from issued bills – other (%) Number of complaints per 1,000 sewage connections
Collection of revenues from delayed payments – households (%)
Septic tank evacuation revenues as a proportion of total revenues (%)
Collection of revenues from delayed payments – governmental (%)
Household connection revenues as a proportion of total revenues (%)
Collection of revenues from delayed payments – other (%)
Treated sewage (%)
Issued bills in proportion to connections (%) Sewage samples that conform to specifications (%)
Quantity of water produced / labour costs Consumption of electricity per 1,000 m3 (KW/1,000 m3)
Number of employees per 1,000 water connections Coverage of collected sewage (%)
Number of complaints per 1,000 water connections (service)
Implemented connections (%)
Number of complaints per 1,000 water connections (bills)
Use of treatment plants (%)
Revenues from other operations as a proportion of total revenues
Connections that have been maintained (%)
Metered connections (%)
Working meters (%)
Technical indicators
Water produced that has been measured (through meters) (%)
[None stated]
Metered treatment plants (%)
Percentage of water sold according to actual meter readings (%)
Quantity of alum used per m3 produced (g/m3)
Quantity of chlorine used per m3 produced (g/m3)
Water loss (%)
Samples that conform to specifications – treatment plants (%)
Samples that conform to specifications – connections (%)
Source: Economic Analysis Department, FADWASC. See also Annex 2, tables 3 and 4.
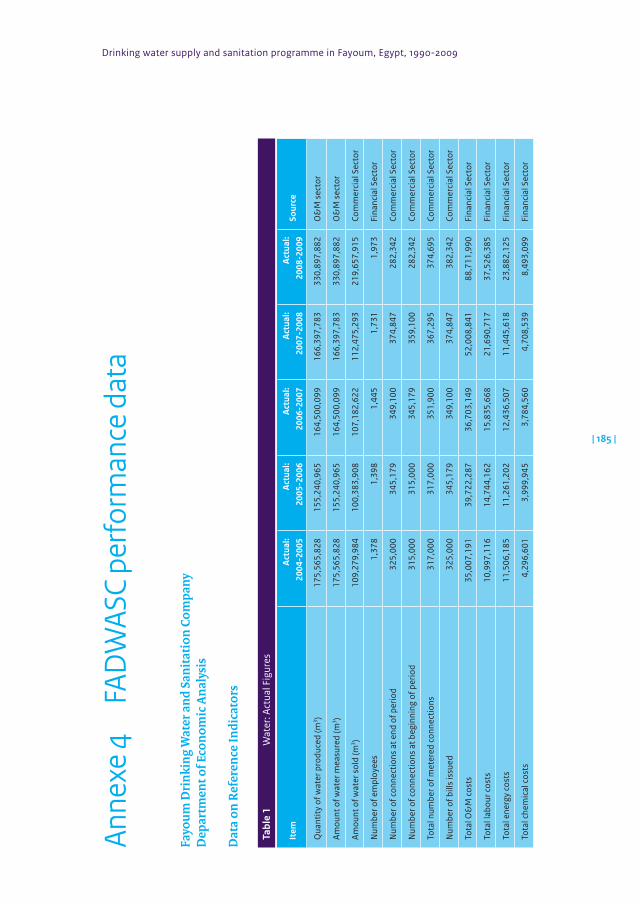
Drinking water supply and sanitation programme in Fayoum, Egypt, 1990-2009
| 185 |
Anne
xe 4
FA
DW
ASC
perf
orm
ance
dat
a
Fayo
umD
rink
ing
Wat
era
ndS
anit
atio
nCo
mpa
nyD
epar
tmen
tofE
cono
mic
Ana
lysi
s
Dat
aon
Ref
eren
ceIn
dica
tors
Tabl
e 1
Wat
er: A
ctua
l Fig
ures
Item
Act
ual:
2004
-200
5A
ctua
l:20
05-2
006
Act
ual:
2006
-200
7A
ctua
l:20
07-2
008
Act
ual:
2008
-200
9So
urce
Qua
ntity
of w
ater
pro
duce
d (m
3 )17
5,56
5,82
815
5,24
0,96
516
4,50
0,09
916
6,39
7,78
333
0,89
7,88
2O
&M
sec
tor
Amou
nt o
f wat
er m
easu
red
(m3 )
175,
565,
828
155,
240,
965
164,
500,
099
166,
397,
783
330,
897,
882
O&
M s
ecto
r
Amou
nt o
f wat
er s
old
(m3 )
109,
279,
984
100,
383,
908
107,
182,
622
112,
475,
293
219,
657,
915
Com
mer
cial
Sec
tor
Num
ber o
f em
ploy
ees
1,37
81,
398
1,44
51,
731
1,97
3Fi
nanc
ial S
ecto
r
Num
ber o
f con
nect
ions
at e
nd o
f per
iod
325,
000
345,
179
349,
100
374,
847
282,
342
Com
mer
cial
Sec
tor
Num
ber o
f con
nect
ions
at b
egin
ning
of p
erio
d31
5,00
031
5,00
034
5,17
935
9,10
028
2,34
2Co
mm
erci
al S
ecto
r
Tota
l num
ber o
f met
ered
con
nect
ions
317,
000
317,
000
351,
900
367,
295
374,
695
Com
mer
cial
Sec
tor
Num
ber o
f bill
s is
sued
325,
000
345,
179
349,
100
374,
847
382,
342
Com
mer
cial
Sec
tor
Tota
l O&
M c
osts
35,0
07,1
9139
,722
,287
36,7
03,1
4952
,008
,841
88,7
11,9
90Fi
nanc
ial S
ecto
r
Tota
l lab
our c
osts
10,9
97,1
1614
,744
,162
15,8
35,6
6821
,690
,717
37,5
26,3
85Fi
nanc
ial S
ecto
r
Tota
l ene
rgy
cost
s11
,506
,185
11,2
61,2
0212
,436
,507
11,4
45,6
1823
,882
,125
Fina
ncia
l Sec
tor
Tota
l che
mic
al c
osts
4,29
6,60
13,
999,
945
3,78
4,56
04,
708,
539
8,49
3,09
9Fi
nanc
ial S
ecto
r
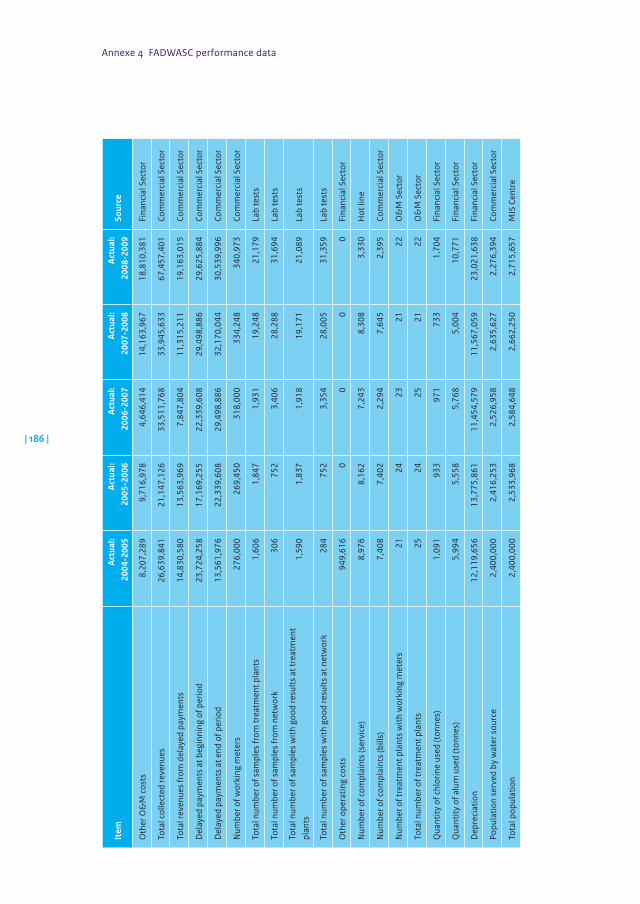
Annexe 4 FADWASC performance data
| 186 |
Item
Act
ual:
2004
-200
5A
ctua
l:20
05-2
006
Act
ual:
2006
-200
7A
ctua
l:20
07-2
008
Act
ual:
2008
-200
9So
urce
Oth
er O
&M
cos
ts8,
207,
289
9,71
6,97
84,
646,
414
14,1
63,9
6718
,810
,381
Fina
ncia
l Sec
tor
Tota
l col
lect
ed re
venu
es26
,639
,841
21,1
47,1
2633
,511
,768
33,9
45,6
3367
,457
,401
Com
mer
cial
Sec
tor
Tota
l rev
enue
s fr
om d
elay
ed p
aym
ents
14,8
30,5
8013
,563
,969
7,84
7,80
411
,315
,211
19,1
63,0
15Co
mm
erci
al S
ecto
r
Del
ayed
pay
men
ts a
t beg
inni
ng o
f per
iod
23,7
24,2
5817
,169
,255
22,3
39,6
0829
,498
,886
29,6
25,8
84Co
mm
erci
al S
ecto
r
Del
ayed
pay
men
ts a
t end
of p
erio
d13
,561
,976
22,3
39,6
0829
,498
,886
32,1
70,0
4430
,539
,996
Com
mer
cial
Sec
tor
Num
ber o
f wor
king
met
ers
276,
000
269,
450
318,
000
334,
248
340,
973
Com
mer
cial
Sec
tor
Tota
l num
ber o
f sam
ples
from
trea
tmen
t pla
nts
1,60
61,
847
1,93
119
,248
21,1
79La
b te
sts
Tota
l num
ber o
f sam
ples
from
net
wor
k30
675
23,
406
28,2
8831
,694
Lab
test
s
Tota
l num
ber o
f sam
ples
with
goo
d re
sults
at t
reat
men
t pl
ants
1,59
01,
837
1,91
819
,171
21,0
89La
b te
sts
Tota
l num
ber o
f sam
ples
with
goo
d re
sults
at n
etw
ork
284
752
3,35
428
,005
31,3
59La
b te
sts
Oth
er o
pera
ting
cost
s94
9,61
60
00
0Fi
nanc
ial S
ecto
r
Num
ber o
f com
plai
nts
(ser
vice
)8,
976
8,16
27,
243
8,30
83,
330
Hot
line
Num
ber o
f com
plai
nts
(bill
s)7,
408
7,40
22,
294
7,64
52,
395
Com
mer
cial
Sec
tor
Num
ber o
f tre
atm
ent p
lant
s w
ith w
orki
ng m
eter
s21
2423
2122
O&
M S
ecto
r
Tota
l num
ber o
f tre
atm
ent p
lant
s25
2425
2122
O&
M S
ecto
r
Qua
ntity
of c
hlor
ine
used
(ton
nes)
1,09
193
397
173
31,
704
Fina
ncia
l Sec
tor
Qua
ntity
of a
lum
use
d (t
onne
s)5,
994
5,55
85,
768
5,00
410
,771
Fina
ncia
l Sec
tor
Dep
reci
atio
n12
,119
,656
13,7
75,8
6111
,454
,579
11,5
67,0
5923
,021
,638
Fina
ncia
l Sec
tor
Popu
latio
n se
rved
by
wat
er s
ourc
e2,
400,
000
2,41
6,25
32,
526,
958
2,63
5,62
72,
276,
394
Com
mer
cial
Sec
tor
Tota
l pop
ulat
ion
2,40
0,00
02,
533,
968
2,58
4,64
82,
662,
250
2,71
5,65
7M
IS C
entr
e
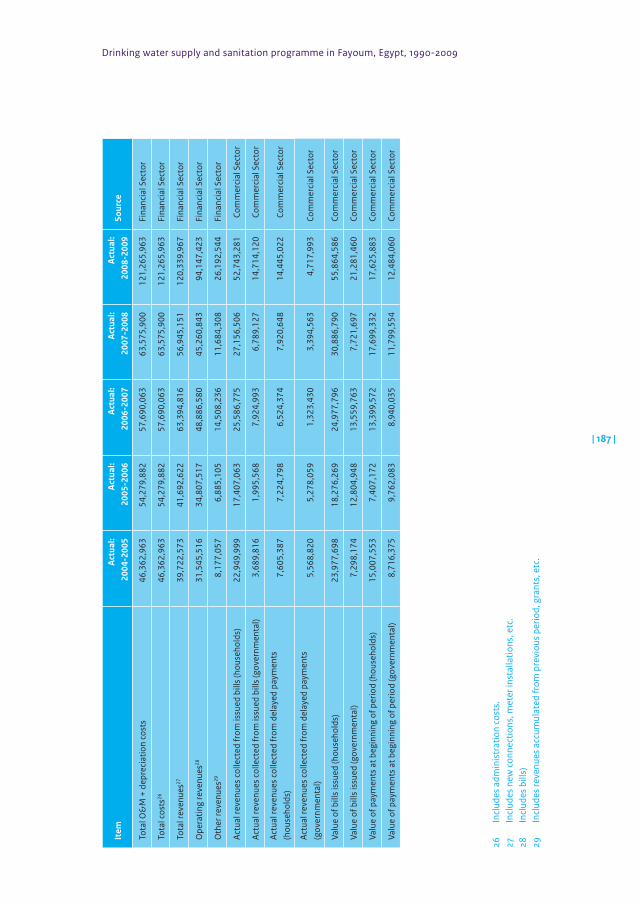
Drinking water supply and sanitation programme in Fayoum, Egypt, 1990-2009
| 187 |
Item
Act
ual:
2004
-200
5A
ctua
l:20
05-2
006
Act
ual:
2006
-200
7A
ctua
l:20
07-2
008
Act
ual:
2008
-200
9So
urce
Tota
l O&
M +
dep
reci
atio
n co
sts
46,3
62,9
6354
,279
,882
57,6
90,0
6363
,575
,900
121,
265,
963
Fina
ncia
l Sec
tor
Tota
l cos
ts26
46,3
62,9
6354
,279
,882
57,6
90,0
6363
,575
,900
121,
265,
963
Fina
ncia
l Sec
tor
Tota
l rev
enue
s2739
,722
,573
41,6
92,6
2263
,394
,816
56,9
45,1
5112
0,33
9,96
7Fi
nanc
ial S
ecto
r
Ope
ratin
g re
venu
es28
31,5
45,5
1634
,807
,517
48,8
86,5
8045
,260
,843
94,1
47,4
23Fi
nanc
ial S
ecto
r
Oth
er re
venu
es29
8,17
7,05
76,
885,
105
14,5
08,2
3611
,684
,308
26,1
92,5
44Fi
nanc
ial S
ecto
r
Actu
al re
venu
es c
olle
cted
from
issu
ed b
ills
(hou
seho
lds)
22,9
49,9
9917
,407
,063
25,5
86,7
7527
,156
,506
52,7
43,2
81Co
mm
erci
al S
ecto
r
Actu
al re
venu
es c
olle
cted
from
issu
ed b
ills
(gov
ernm
enta
l)3,
689,
816
1,99
5,56
87,
924,
993
6,78
9,12
714
,714
,120
Com
mer
cial
Sec
tor
Actu
al re
venu
es c
olle
cted
from
del
ayed
pay
men
ts
(hou
seho
lds)
7,60
5,38
77,
224,
798
6,52
4,37
47,
920,
648
14,4
45,0
22Co
mm
erci
al S
ecto
r
Actu
al re
venu
es c
olle
cted
from
del
ayed
pay
men
ts
(gov
ernm
enta
l)5,
568,
820
5,27
8,05
91,
323,
430
3,39
4,56
34,
717,
993
Com
mer
cial
Sec
tor
Valu
e of
bill
s is
sued
(hou
seho
lds)
23,9
77,6
9818
,276
,269
24,9
77,7
9630
,886
,790
55,8
64,5
86Co
mm
erci
al S
ecto
r
Valu
e of
bill
s is
sued
(gov
ernm
enta
l)7,
298,
174
12,8
04,9
4813
,559
,763
7,72
1,69
721
,281
,460
Com
mer
cial
Sec
tor
Valu
e of
pay
men
ts a
t beg
inni
ng o
f per
iod
(hou
seho
lds)
15,0
07,5
537,
407,
172
13,3
99,5
7217
,699
,332
17,6
25,8
83Co
mm
erci
al S
ecto
r
Valu
e of
pay
men
ts a
t beg
inni
ng o
f per
iod
(gov
ernm
enta
l)8,
716,
375
9,76
2,08
38,
940,
035
11,7
99,5
5412
,484
,060
Com
mer
cial
Sec
tor
2626
2728
29
26
Incl
udes
adm
inis
trat
ion
cost
s.27
In
clud
es n
ew c
onne
ctio
ns, m
eter
inst
alla
tions
, etc
. 28
In
clud
es b
ills)
29
Incl
udes
reve
nues
acc
umul
ated
from
pre
viou
s pe
riod,
gra
nts,
etc
.
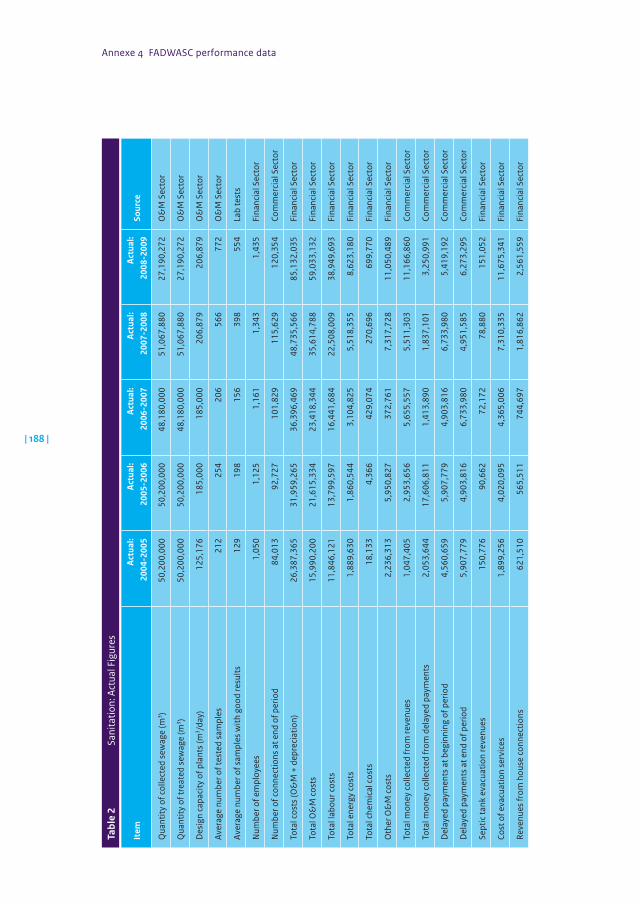
Annexe 4 FADWASC performance data
| 188 |
Tabl
e 2
Sani
tatio
n: A
ctua
l Fig
ures
Item
Act
ual:
2004
-200
5A
ctua
l:20
05-2
006
Act
ual:
2006
-200
7A
ctua
l:20
07-2
008
Act
ual:
2008
-200
9So
urce
Qua
ntity
of c
olle
cted
sew
age
(m3 )
50,2
00,0
0050
,200
,000
48,1
80,0
0051
,067
,880
27,1
90,2
72O
&M
Sec
tor
Qua
ntity
of t
reat
ed s
ewag
e (m
3 )50
,200
,000
50,2
00,0
0048
,180
,000
51,0
67,8
8027
,190
,272
O&
M S
ecto
r
Des
ign
capa
city
of p
lant
s (m
3 /day
)12
5,17
618
5,00
018
5,00
020
6,87
920
6,87
9O
&M
Sec
tor
Aver
age
num
ber o
f tes
ted
sam
ples
212
254
206
566
772
O&
M S
ecto
r
Aver
age
num
ber o
f sam
ples
with
goo
d re
sults
129
198
156
398
554
Lab
test
s
Num
ber o
f em
ploy
ees
1,05
01,
125
1,16
11,
343
1,43
5Fi
nanc
ial S
ecto
r
Num
ber o
f con
nect
ions
at e
nd o
f per
iod
84,0
1392
,727
101,
829
115,
629
120,
354
Com
mer
cial
Sec
tor
Tota
l cos
ts (O
&M
+ d
epre
ciat
ion)
26,3
87,3
6531
,959
,265
36,3
96,4
6948
,735
,566
85,1
32,0
35Fi
nanc
ial S
ecto
r
Tota
l O&
M c
osts
15,9
90,2
0021
,615
,334
23,4
18,3
4435
,614
,788
59,0
33,1
32Fi
nanc
ial S
ecto
r
Tota
l lab
our c
osts
11,8
46,1
2113
,799
,597
16,4
41,6
8422
,508
,009
38,9
49,6
93Fi
nanc
ial S
ecto
r
Tota
l ene
rgy
cost
s1,
889,
630
1,86
0,54
43,
104,
825
5,51
8,35
58,
623,
180
Fina
ncia
l Sec
tor
Tota
l che
mic
al c
osts
18,1
334,
366
429,
074
270,
696
699,
770
Fina
ncia
l Sec
tor
Oth
er O
&M
cos
ts2,
236,
313
5,95
0,82
737
2,76
17,
317,
728
11,0
50,4
89Fi
nanc
ial S
ecto
r
Tota
l mon
ey c
olle
cted
from
reve
nues
1,04
7,40
52,
953,
656
5,65
5,55
75,
511,
303
11,1
66,8
60Co
mm
erci
al S
ecto
r
Tota
l mon
ey c
olle
cted
from
del
ayed
pay
men
ts2,
053,
644
17,6
06,8
111,
413,
890
1,83
7,10
13,
250,
991
Com
mer
cial
Sec
tor
Del
ayed
pay
men
ts a
t beg
inni
ng o
f per
iod
4,56
0,65
95,
907,
779
4,90
3,81
66,
733,
980
5,41
9,19
2Co
mm
erci
al S
ecto
r
Del
ayed
pay
men
ts a
t end
of p
erio
d5,
907,
779
4,90
3,81
66,
733,
980
4,95
1,58
56,
273,
295
Com
mer
cial
Sec
tor
Sept
ic ta
nk e
vacu
atio
n re
venu
es15
0,77
690
,662
72,1
7278
,880
151,
052
Fina
ncia
l Sec
tor
Cost
of e
vacu
atio
n se
rvic
es1,
899,
256
4,02
0,09
54,
365,
006
7,31
0,33
511
,675
,341
Fina
ncia
l Sec
tor
Reve
nues
from
hou
se c
onne
ctio
ns62
1,51
056
5,51
174
4,69
71,
816,
862
2,56
1,55
9Fi
nanc
ial S
ecto
r

Drinking water supply and sanitation programme in Fayoum, Egypt, 1990-2009
| 189 |
Item
Act
ual:
2004
-200
5A
ctua
l:20
05-2
006
Act
ual:
2006
-200
7A
ctua
l:20
07-2
008
Act
ual:
2008
-200
9So
urce
Cost
of h
ouse
con
nect
ion30
00
056
2,70
056
2,70
0Fi
nanc
ial S
ecto
r
Elec
tric
ity c
onsu
mpt
ion
(KW
/hr f
or e
very
100
0 cm
)5
55
55
O&
M S
ecto
r
Tota
l ene
rgy
cost
s fo
r tre
atm
ent p
lant
s (c
m/d
ay)
125,
176
185,
000
185,
000
206,
879
206,
879
O&
M S
ecto
r
Leng
th o
f net
wor
ks p
lann
ed fo
r mai
nten
ance
(km
)48
052
054
060
518
3O
&M
Sec
tor
Leng
th o
f net
wor
ks th
at h
ave
been
mai
ntai
ned
durin
g
the
perio
d (k
m)
480
520
540
605
183
O&
M S
ecto
r
Tota
l net
wor
k le
ngth
(km
)48
052
054
063
573
0O
&M
Sec
tor
Num
ber o
f hou
se c
onne
ctio
ns im
plem
ente
d du
ring
th
e pe
riod
10,0
007,
900
8,19
27,
017
15,2
09Co
mm
erci
al S
ecto
r
Num
ber o
f pla
nned
hou
se c
onne
ctio
ns12
,000
12,0
009,
102
7,39
416
,496
Com
mer
cial
Sec
tor
Tota
l num
ber o
f im
plem
ente
d co
nnec
tions
84,0
1392
,727
10,8
2910
8,84
612
0,35
4Co
mm
erci
al S
ecto
r
Tota
l rev
enue
s9,
044,
080
7,78
1,90
414
,750
,111
24,7
21,9
6439
,472
,075
Com
mer
cial
Sec
tor
Tota
l cur
rent
ope
ratin
g re
venu
es5,
220,
455
4,33
9,35
27,
886,
317
9,24
4,14
717
,130
,464
Com
mer
cial
Sec
tor
Oth
er o
pera
ting
reve
nues
3,82
3,62
53,
442,
553
6,86
3,79
416
,577
,817
22,3
41,6
11Co
mm
erci
al S
ecto
r
Tota
l num
ber o
f com
plai
nts31
14,5
8213
,278
16,9
8520
,273
37,2
58H
ot li
ne
3031
30
Unt
il th
e pe
riod
betw
een
1/7/
2007
and
30/
6/20
08, t
he c
osts
of h
ouse
con
nect
ions
wer
e co
vere
d by
eac
h ho
useh
old
31
Thes
e ar
e m
ainl
y re
late
d to
tech
nica
l pro
blem
s an
d do
not
con
cern
bill
ing.
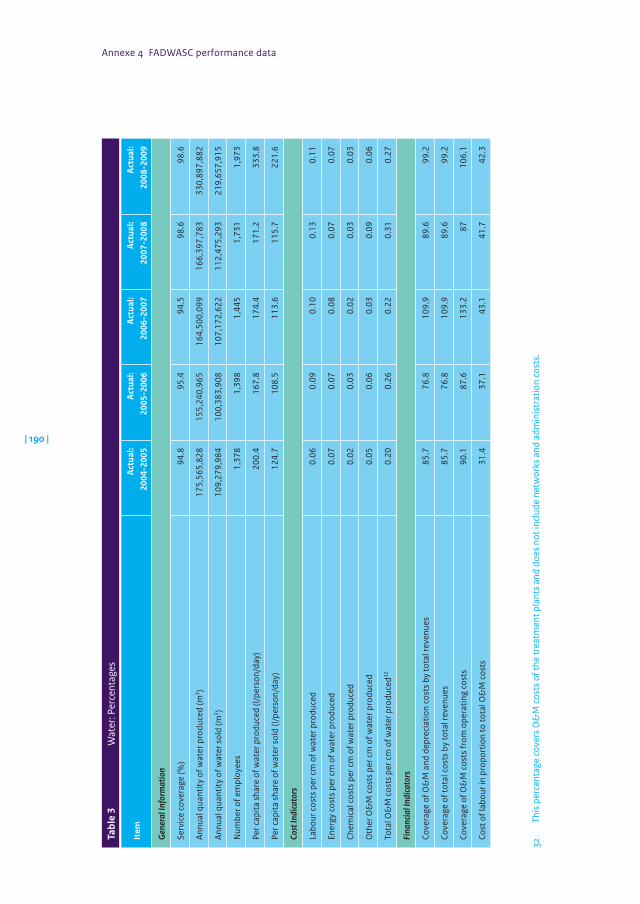
Annexe 4 FADWASC performance data
| 190 |
Tabl
e 3
Wat
er: P
erce
ntag
es
Item
Act
ual:
2004
-200
5A
ctua
l:20
05-2
006
Act
ual:
2006
-200
7A
ctua
l:20
07-2
008
Act
ual:
2008
-200
9
Gen
eral
Info
rmat
ion
Serv
ice
cove
rage
(%)
94.8
95.4
94.5
98.6
98.6
Annu
al q
uant
ity o
f wat
er p
rodu
ced
(m3 )
175,
565,
828
155,
240,
965
164,
500,
099
166,
397,
783
330,
897,
882
Annu
al q
uant
ity o
f wat
er s
old
(m3 )
109,
279,
984
100,
383,
908
107,
172,
622
112,
475,
293
219,
657,
915
Num
ber o
f em
ploy
ees
1,37
81,
398
1,44
51,
731
1,97
3
Per c
apita
sha
re o
f wat
er p
rodu
ced
(l/pe
rson
/day
)20
0.4
167.
817
4.4
171.
233
3.8
Per c
apita
sha
re o
f wat
er s
old
(l/pe
rson
/day
)12
4.7
108.
511
3.6
115.
722
1.6
Cost
Indi
cato
rs
Labo
ur c
osts
per
cm
of w
ater
pro
duce
d0.
060.
090.
100.
130.
11
Ener
gy c
osts
per
cm
of w
ater
pro
duce
d0.
070.
070.
080.
070.
07
Chem
ical
cos
ts p
er c
m o
f wat
er p
rodu
ced
0.02
0.03
0.02
0.03
0.03
Oth
er O
&M
cos
ts p
er c
m o
f wat
er p
rodu
ced
0.05
0.06
0.03
0.09
0.06
Tota
l O&
M c
osts
per
cm
of w
ater
pro
duce
d320.
200.
260.
220.
310.
27
Fina
ncia
l Ind
icato
rs
Cove
rage
of O
&M
and
dep
reci
atio
n co
sts
by to
tal r
even
ues
85.7
76.8
109.
989
.699
.2
Cove
rage
of t
otal
cos
ts b
y to
tal r
even
ues
85.7
76.8
109.
989
.699
.2
Cove
rage
of O
&M
cos
ts fr
om o
pera
ting
cost
s90
.187
.613
3.2
8710
6.1
Cost
of l
abou
r in
prop
ortio
n to
tota
l O&
M c
osts
31.4
37.1
43.1
41.7
42.3
32
This
per
cent
age
cove
rs O
&M
cos
ts o
f the
trea
tmen
t pla
nts
and
does
not
incl
ude
netw
orks
and
adm
inis
trat
ion
cost
s.
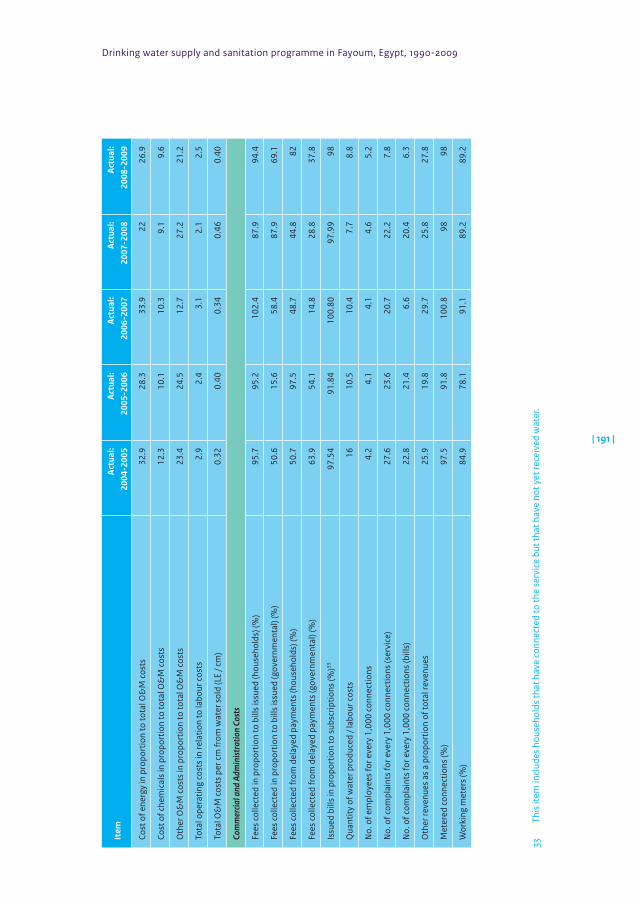
Drinking water supply and sanitation programme in Fayoum, Egypt, 1990-2009
| 191 |
Item
Act
ual:
2004
-200
5A
ctua
l:20
05-2
006
Act
ual:
2006
-200
7A
ctua
l:20
07-2
008
Act
ual:
2008
-200
9
Cost
of e
nerg
y in
pro
port
ion
to to
tal O
&M
cos
ts32
.928
.333
.922
26.9
Cost
of c
hem
ical
s in
pro
port
ion
to to
tal O
&M
cos
ts12
.310
.110
.39.
19.
6
Oth
er O
&M
cos
ts in
pro
port
ion
to to
tal O
&M
cos
ts23
.424
.512
.727
.221
.2
Tota
l ope
ratin
g co
sts
in re
latio
n to
labo
ur c
osts
2.9
2.4
3.1
2.1
2.5
Tota
l O&
M c
osts
per
cm
from
wat
er s
old
(LE
/ cm
)0.
320.
400.
340.
460.
40
Com
mer
cial a
nd A
dmin
istra
tion
Cost
s
Fees
col
lect
ed in
pro
port
ion
to b
ills
issu
ed (h
ouse
hold
s) (%
)95
.795
.210
2.4
87.9
94.4
Fees
col
lect
ed in
pro
port
ion
to b
ills
issu
ed (g
over
nmen
tal)
(%)
50.6
15.6
58.4
87.9
69.1
Fees
col
lect
ed fr
om d
elay
ed p
aym
ents
(hou
seho
lds)
(%)
50.7
97.5
48.7
44.8
82
Fees
col
lect
ed fr
om d
elay
ed p
aym
ents
(gov
ernm
enta
l) (%
)63
.954
.114
.828
.837
.8
Issu
ed b
ills
in p
ropo
rtio
n to
sub
scrip
tions
(%)33
97.5
491
.84
100.
8097
.99
98
Qua
ntity
of w
ater
pro
duce
d / l
abou
r cos
ts16
10.5
10.4
7.7
8.8
No.
of e
mpl
oyee
s fo
r eve
ry 1
,000
con
nect
ions
4.2
4.1
4.1
4.6
5.2
No.
of c
ompl
aint
s fo
r eve
ry 1
,000
con
nect
ions
(ser
vice
)27
.623
.620
.722
.27.
8
No.
of c
ompl
aint
s fo
r eve
ry 1
,000
con
nect
ions
(bill
s)22
.821
.46.
620
.46.
3
Oth
er re
venu
es a
s a
prop
ortio
n of
tota
l rev
enue
s25
.919
.829
.725
.827
.8
Met
ered
con
nect
ions
(%)
97.5
91.8
100.
898
98
Wor
king
met
ers
(%)
84.9
78.1
91.1
89.2
89.2
33
This
item
incl
udes
hou
seho
lds
that
hav
e co
nnec
ted
to th
e se
rvic
e bu
t tha
t hav
e no
t yet
rece
ived
wat
er.
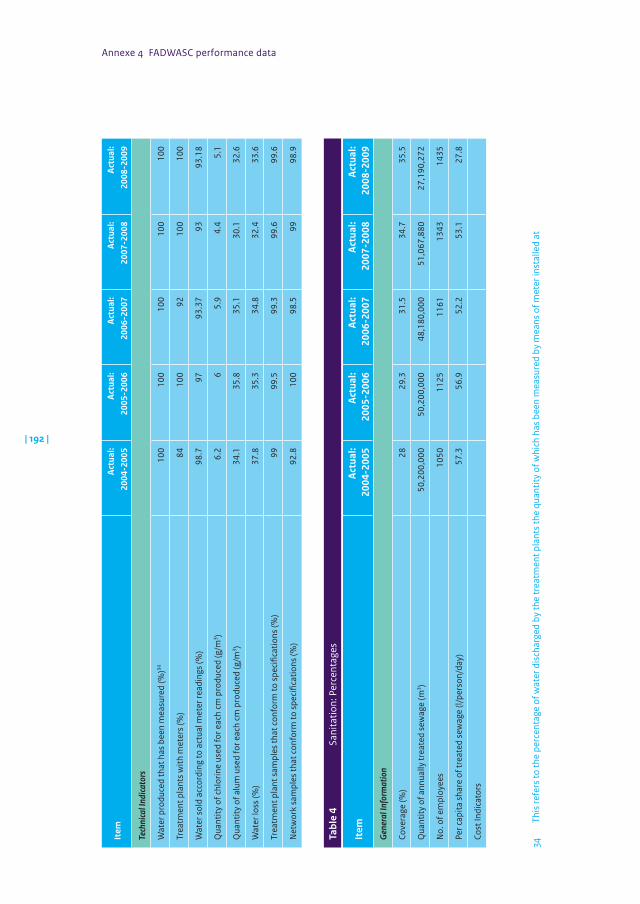
Annexe 4 FADWASC performance data
| 192 |
Item
Act
ual:
2004
-200
5A
ctua
l:20
05-2
006
Act
ual:
2006
-200
7A
ctua
l:20
07-2
008
Act
ual:
2008
-200
9
Tech
nica
l Ind
icato
rs
Wat
er p
rodu
ced
that
has
bee
n m
easu
red
(%)34
100
100
100
100
100
Trea
tmen
t pla
nts
with
met
ers
(%)
8410
092
100
100
Wat
er s
old
acco
rdin
g to
act
ual m
eter
read
ings
(%)
98.7
9793
.37
9393
.18
Qua
ntity
of c
hlor
ine
used
for e
ach
cm p
rodu
ced
(g/m
3 )6.
26
5.9
4.4
5.1
Qua
ntity
of a
lum
use
d fo
r eac
h cm
pro
duce
d (g
/m3 )
34.1
35.8
35.1
30.1
32.6
Wat
er lo
ss (%
)37
.835
.334
.832
.433
.6
Trea
tmen
t pla
nt s
ampl
es th
at c
onfo
rm to
spe
cific
atio
ns (%
)99
99.5
99.3
99.6
99.6
Net
wor
k sa
mpl
es th
at c
onfo
rm to
spe
cific
atio
ns (%
)92
.810
098
.599
98.9
Tabl
e 4
Sani
tatio
n: P
erce
ntag
es
Item
Act
ual:
2004
-200
5A
ctua
l:20
05-2
006
Act
ual:
2006
-200
7A
ctua
l:20
07-2
008
Act
ual:
2008
-200
9
Gen
eral
Info
rmat
ion
Cove
rage
(%)
2829
.331
.534
.735
.5
Qua
ntity
of a
nnua
lly tr
eate
d se
wag
e (m
3 )50
,200
,000
50,2
00,0
0048
,180
,000
51,0
67,8
8027
,190
,272
No.
of e
mpl
oyee
s10
5011
2511
6113
4314
35
Per c
apita
sha
re o
f tre
ated
sew
age
(l/pe
rson
/day
)57
.356
.952
.253
.127
.8
Cost
Indi
cato
rs
34
This
refe
rs to
the
perc
enta
ge o
f wat
er d
isch
arge
d by
the
trea
tmen
t pla
nts
the
quan
tity
of w
hich
has
bee
n m
easu
red
by m
eans
of m
eter
inst
alle
d at
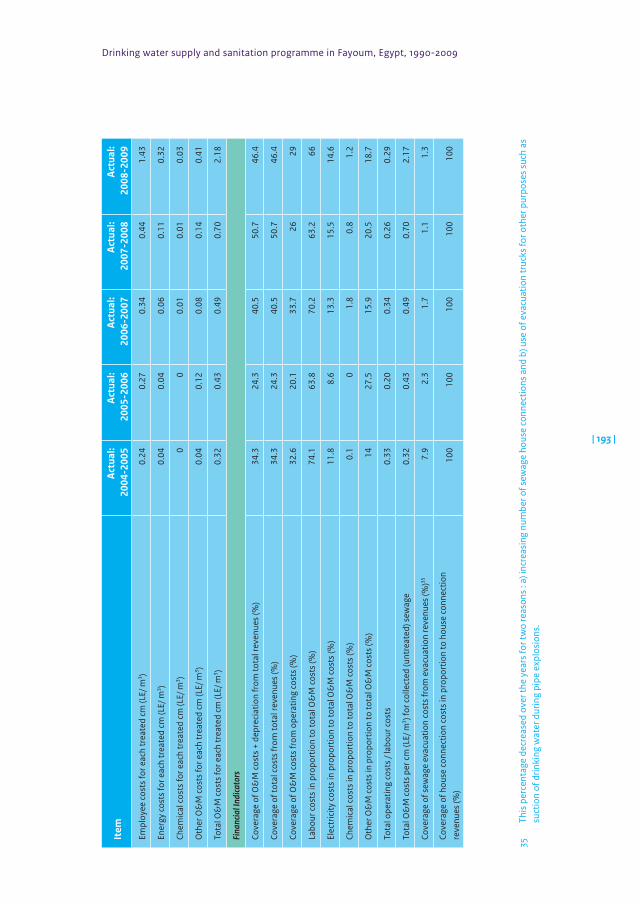
Drinking water supply and sanitation programme in Fayoum, Egypt, 1990-2009
| 193 |
Item
Act
ual:
2004
-200
5A
ctua
l:20
05-2
006
Act
ual:
2006
-200
7A
ctua
l:20
07-2
008
Act
ual:
2008
-200
9
Empl
oyee
cos
ts fo
r eac
h tr
eate
d cm
(LE/
m3 )
0.24
0.27
0.34
0.44
1.43
Ener
gy c
osts
for e
ach
trea
ted
cm (L
E/ m
3 )0.
040.
040.
060.
110.
32
Chem
ical
cos
ts fo
r eac
h tr
eate
d cm
(LE/
m3 )
00
0.01
0.01
0.03
Oth
er O
&M
cos
ts fo
r eac
h tr
eate
d cm
(LE/
m3 )
0.04
0.12
0.08
0.14
0.41
Tota
l O&
M c
osts
for e
ach
trea
ted
cm (L
E/ m
3 )0.
320.
430.
490.
702.
18
Fina
ncia
l Ind
icato
rs
Cove
rage
of O
&M
cos
ts +
dep
reci
atio
n fr
om to
tal r
even
ues
(%)
34.3
24.3
40.5
50.7
46.4
Cove
rage
of t
otal
cos
ts fr
om to
tal r
even
ues
(%)
34.3
24.3
40.5
50.7
46.4
Cove
rage
of O
&M
cos
ts fr
om o
pera
ting
cost
s (%
)32
.620
.133
.726
29
Labo
ur c
osts
in p
ropo
rtio
n to
tota
l O&
M c
osts
(%)
74.1
63.8
70.2
63.2
66
Elec
tric
ity c
osts
in p
ropo
rtio
n to
tota
l O&
M c
osts
(%)
11.8
8.6
13.3
15.5
14.6
Chem
ical
cos
ts in
pro
port
ion
to to
tal O
&M
cos
ts (%
)0.
10
1.8
0.8
1.2
Oth
er O
&M
cos
ts in
pro
port
ion
to to
tal O
&M
cos
ts (%
)14
27.5
15.9
20.5
18.7
Tota
l ope
ratin
g co
sts
/ lab
our c
osts
0.33
0.20
0.34
0.26
0.29
Tota
l O&
M c
osts
per
cm
(LE/
m3 ) f
or c
olle
cted
(unt
reat
ed) s
ewag
e0.
320.
430.
490.
702.
17
Cove
rage
of s
ewag
e ev
acua
tion
cost
s fr
om e
vacu
atio
n re
venu
es (%
)357.
92.
31.
71.
11.
3
Cove
rage
of h
ouse
con
nect
ion
cost
s in
pro
port
ion
to h
ouse
con
nect
ion
re
venu
es (%
)10
010
010
010
010
0
35
This
per
cent
age
decr
ease
d ov
er th
e ye
ars
for t
wo
reas
ons
: a) i
ncre
asin
g nu
mbe
r of s
ewag
e ho
use
conn
ectio
ns a
nd b
) use
of e
vacu
atio
n tr
ucks
for o
ther
pur
pose
s su
ch a
s su
ctio
n of
drin
king
wat
er d
urin
g pi
pe e
xplo
sion
s.
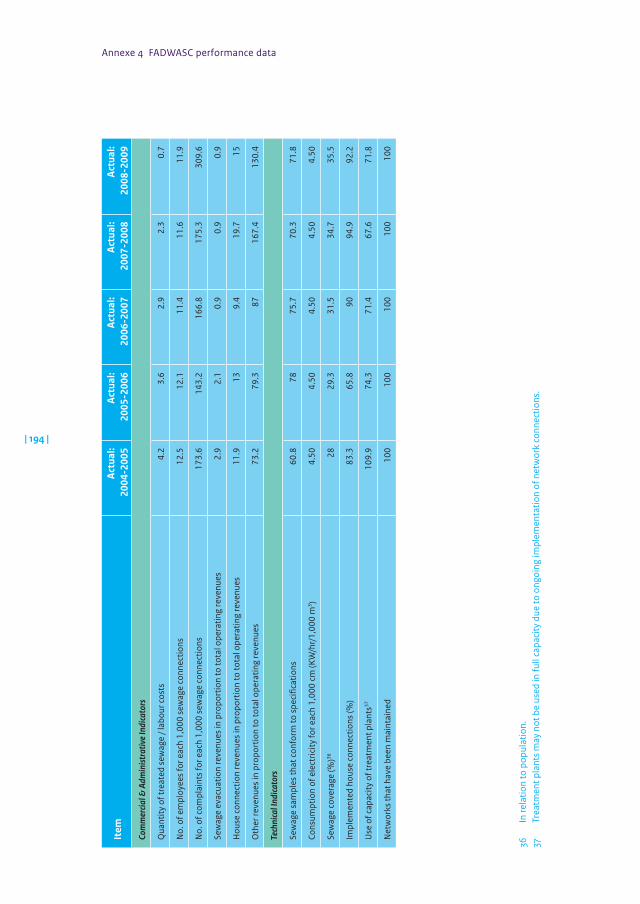
Annexe 4 FADWASC performance data
| 194 |
Item
Act
ual:
2004
-200
5A
ctua
l:20
05-2
006
Act
ual:
2006
-200
7A
ctua
l:20
07-2
008
Act
ual:
2008
-200
9
Com
mer
cial &
Adm
inist
rativ
e In
dica
tors
Qua
ntity
of t
reat
ed s
ewag
e / l
abou
r cos
ts4.
23.
62.
92.
30.
7
No.
of e
mpl
oyee
s fo
r eac
h 1,
000
sew
age
conn
ectio
ns12
.512
.111
.411
.611
.9
No.
of c
ompl
aint
s fo
r eac
h 1,
000
sew
age
conn
ectio
ns17
3.6
143.
216
6.8
175.
330
9.6
Sew
age
evac
uatio
n re
venu
es in
pro
port
ion
to to
tal o
pera
ting
reve
nues
2.9
2.1
0.9
0.9
0.9
Hou
se c
onne
ctio
n re
venu
es in
pro
port
ion
to to
tal o
pera
ting
reve
nues
11.9
139.
419
.715
Oth
er re
venu
es in
pro
port
ion
to to
tal o
pera
ting
reve
nues
73.2
79.3
8716
7.4
130.
4
Tech
nica
l Ind
icato
rs
Sew
age
sam
ples
that
con
form
to s
peci
ficat
ions
60.8
7875
.770
.371
.8
Cons
umpt
ion
of e
lect
ricity
for e
ach
1,00
0 cm
(KW
/hr/
1,00
0 m
3 )4.
504.
504.
504.
504.
50
Sew
age
cove
rage
(%)36
2829
.331
.534
.735
.5
Impl
emen
ted
hous
e co
nnec
tions
(%)
83.3
65.8
9094
.992
.2
Use
of c
apac
ity o
f tre
atm
ent p
lant
s3710
9.9
74.3
71.4
67.6
71.8
Net
wor
ks th
at h
ave
been
mai
ntai
ned
100
100
100
100
100
36
In re
latio
n to
pop
ulat
ion.
37
Trea
tmen
t pla
nts
may
not
be
used
in fu
ll ca
paci
ty d
ue to
ong
oing
impl
emen
tatio
n of
net
wor
k co
nnec
tions
.
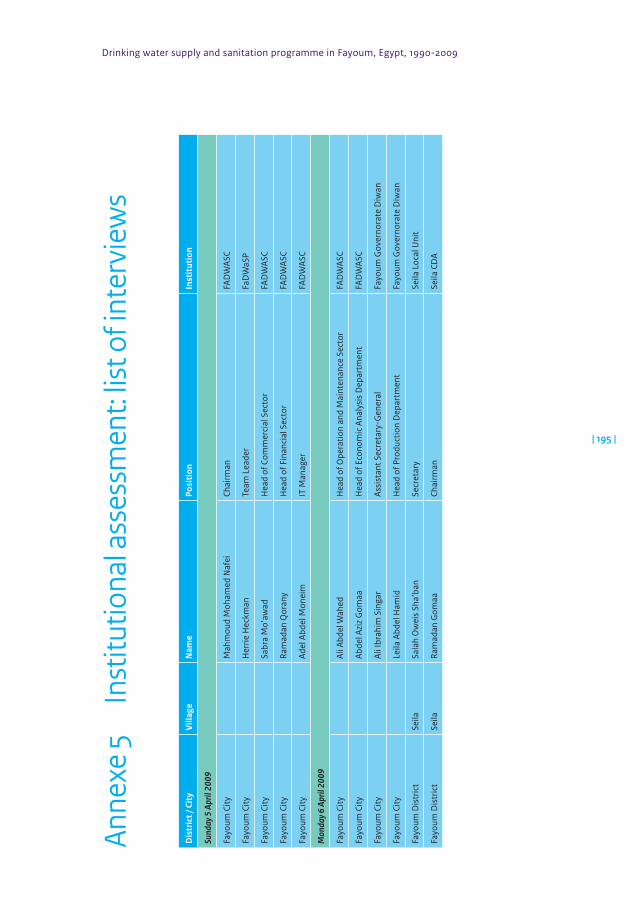
Drinking water supply and sanitation programme in Fayoum, Egypt, 1990-2009
| 195 |
Anne
xe 5
In
stitu
tiona
l ass
essm
ent:
list o
f int
ervi
ews
Dis
tric
t / C
ity
Vill
age
Nam
ePo
siti
onIn
stit
utio
n
Sund
ay 5
Apr
il 20
09
Fayo
um C
ityM
ahm
oud
Moh
amed
Naf
eiCh
airm
anFA
DW
ASC
Fayo
um C
ityH
errie
Hec
kman
Team
Lea
der
FaD
WaS
P
Fayo
um C
itySa
bra
Mo’
awad
Hea
d of
Com
mer
cial
Sec
tor
FAD
WAS
C
Fayo
um C
ityRa
mad
an Q
oran
yH
ead
of F
inan
cial
Sec
tor
FAD
WAS
C
Fayo
um C
ityAd
el A
bdel
Mon
eim
IT M
anag
erFA
DW
ASC
Mon
day 6
Apr
il 20
09
Fayo
um C
ityAl
i Abd
el W
ahed
Hea
d of
Ope
ratio
n an
d M
aint
enan
ce S
ecto
rFA
DW
ASC
Fayo
um C
ityAb
del A
ziz
Gom
aaH
ead
of E
cono
mic
Ana
lysi
s D
epar
tmen
tFA
DW
ASC
Fayo
um C
ityAl
i Ibr
ahim
Sin
gar
Assi
stan
t Sec
reta
ry-G
ener
alFa
youm
Gov
erno
rate
Diw
an
Fayo
um C
ityLe
ila A
bdel
Ham
idH
ead
of P
rodu
ctio
n D
epar
tmen
tFa
youm
Gov
erno
rate
Diw
an
Fayo
um D
istr
ict
Seila
Sala
h O
wei
s Sh
a’ba
nSe
cret
ary
Seila
Loc
al U
nit
Fayo
um D
istr
ict
Seila
Ram
adan
Gom
aaCh
airm
anSe
ila C
DA
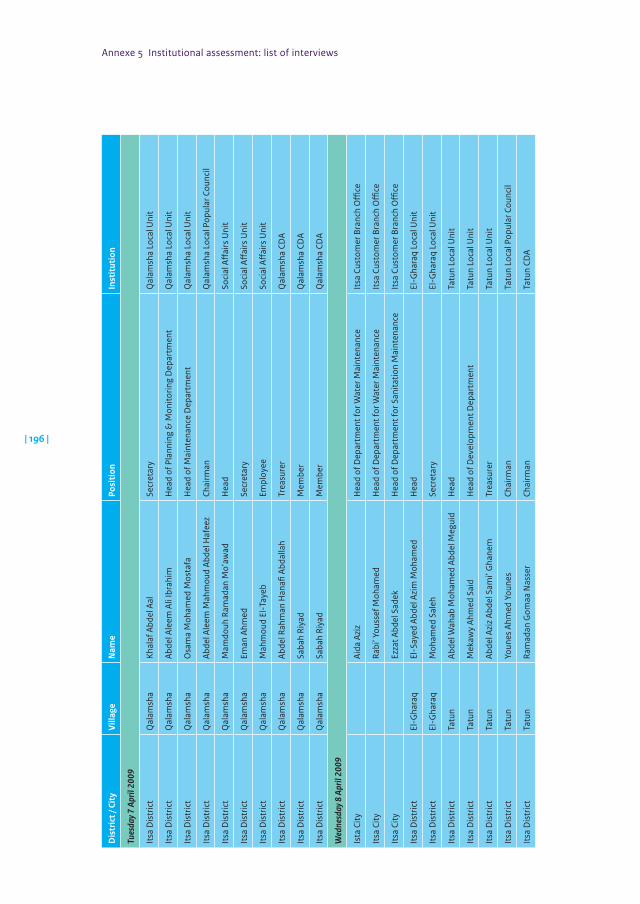
Annexe 5 Institutional assessment: list of interviews
| 196 |
Dis
tric
t / C
ity
Vill
age
Nam
ePo
siti
onIn
stit
utio
n
Tues
day 7
Apr
il 20
09
Itsa
Dis
tric
tQ
alam
sha
Kha
laf A
bdel
Aal
Secr
etar
yQ
alam
sha
Loca
l Uni
t
Itsa
Dis
tric
tQ
alam
sha
Abde
l Ale
em A
li Ib
rahi
mH
ead
of P
lann
ing
& M
onito
ring
Dep
artm
ent
Qal
amsh
a Lo
cal U
nit
Itsa
Dis
tric
tQ
alam
sha
Osa
ma
Moh
amed
Mos
tafa
Hea
d of
Mai
nten
ance
Dep
artm
ent
Qal
amsh
a Lo
cal U
nit
Itsa
Dis
tric
tQ
alam
sha
Abde
l Ale
em M
ahm
oud
Abde
l Haf
eez
Chai
rman
Qal
amsh
a Lo
cal P
opul
ar C
ounc
il
Itsa
Dis
tric
tQ
alam
sha
Mam
douh
Ram
adan
Mo’
awad
Hea
dSo
cial
Aff
airs
Uni
t
Itsa
Dis
tric
tQ
alam
sha
Eman
Ahm
edSe
cret
ary
Soci
al A
ffai
rs U
nit
Itsa
Dis
tric
tQ
alam
sha
Mah
mou
d El
-Tay
ebEm
ploy
eeSo
cial
Aff
airs
Uni
t
Itsa
Dis
tric
tQ
alam
sha
Abde
l Rah
man
Han
afi A
bdal
lah
Trea
sure
rQ
alam
sha
CDA
Itsa
Dis
tric
tQ
alam
sha
Saba
h Ri
yad
Mem
ber
Qal
amsh
a CD
A
Itsa
Dis
tric
tQ
alam
sha
Saba
h Ri
yad
Mem
ber
Qal
amsh
a CD
A
Wed
nesd
ay 8
Apr
il 20
09
Ista
City
Aida
Azi
zH
ead
of D
epar
tmen
t for
Wat
er M
aint
enan
ceIt
sa C
usto
mer
Bra
nch
Offi
ce
Itsa
City
Rabi
’ You
ssef
Moh
amed
Hea
d of
Dep
artm
ent f
or W
ater
Mai
nten
ance
Itsa
Cus
tom
er B
ranc
h O
ffice
Itsa
City
Ezza
t Abd
el S
adek
Hea
d of
Dep
artm
ent f
or S
anita
tion
Mai
nten
ance
Itsa
Cus
tom
er B
ranc
h O
ffice
Itsa
Dis
tric
tEl
-Gha
raq
El-S
ayed
Abd
el A
zim
Moh
amed
Hea
dEl
-Gha
raq
Loca
l Uni
t
Itsa
Dis
tric
tEl
-Gha
raq
Moh
amed
Sal
ehSe
cret
ary
El-G
hara
q Lo
cal U
nit
Itsa
Dis
tric
tTa
tun
Abde
l Wah
ab M
oham
ed A
bdel
Meg
uid
Hea
dTa
tun
Loca
l Uni
t
Itsa
Dis
tric
tTa
tun
Mek
awy
Ahm
ed S
aid
Hea
d of
Dev
elop
men
t Dep
artm
ent
Tatu
n Lo
cal U
nit
Itsa
Dis
tric
tTa
tun
Abde
l Azi
z Ab
del S
ami’
Gha
nem
Trea
sure
rTa
tun
Loca
l Uni
t
Itsa
Dis
tric
tTa
tun
Youn
es A
hmed
You
nes
Chai
rman
Tatu
n Lo
cal P
opul
ar C
ounc
il
Itsa
Dis
tric
tTa
tun
Ram
adan
Gom
aa N
asse
rCh
airm
anTa
tun
CDA
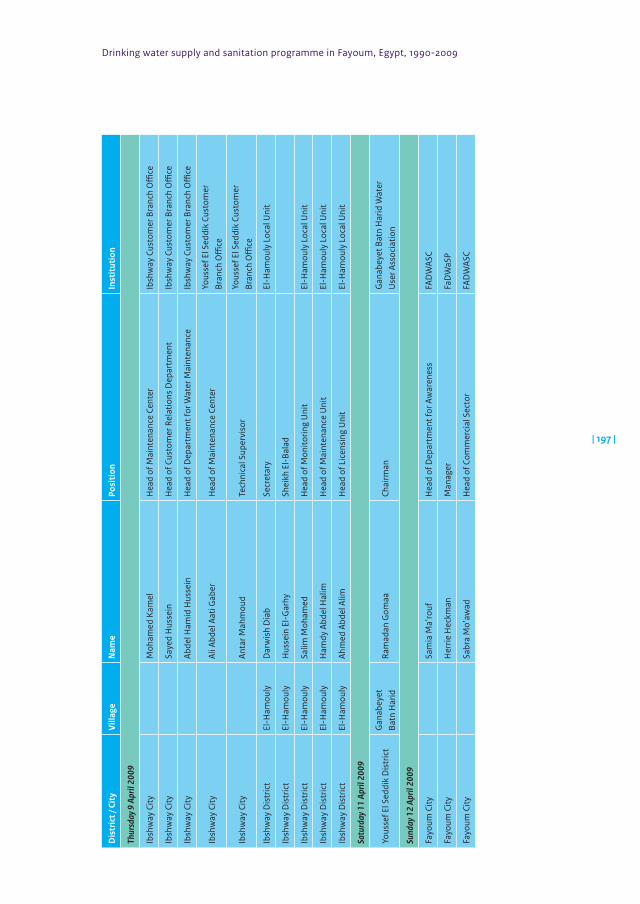
Drinking water supply and sanitation programme in Fayoum, Egypt, 1990-2009
| 197 |
Dis
tric
t / C
ity
Vill
age
Nam
ePo
siti
onIn
stit
utio
n
Thur
sday
9 A
pril
2009
Ibsh
way
City
Moh
amed
Kam
elH
ead
of M
aint
enan
ce C
ente
rIb
shw
ay C
usto
mer
Bra
nch
Offi
ce
Ibsh
way
City
Saye
d H
usse
inH
ead
of C
usto
mer
Rel
atio
ns D
epar
tmen
tIb
shw
ay C
usto
mer
Bra
nch
Offi
ce
Ibsh
way
City
Abde
l Ham
id H
usse
inH
ead
of D
epar
tmen
t for
Wat
er M
aint
enan
ceIb
shw
ay C
usto
mer
Bra
nch
Offi
ce
Ibsh
way
City
Ali A
bdel
Aat
i Gab
erH
ead
of M
aint
enan
ce C
ente
rYo
usse
f El S
eddi
k Cu
stom
er
Bran
ch O
ffice
Ibsh
way
City
Anta
r Mah
mou
dTe
chni
cal S
uper
viso
rYo
usse
f El S
eddi
k Cu
stom
er
Bran
ch O
ffice
Ibsh
way
Dis
tric
tEl
-Ham
ouly
Dar
wis
h D
iab
Secr
etar
yEl
-Ham
ouly
Loc
al U
nit
Ibsh
way
Dis
tric
tEl
-Ham
ouly
Hus
sein
El-
Gar
hySh
eikh
El-
Bala
d
Ibsh
way
Dis
tric
tEl
-Ham
ouly
Salim
Moh
amed
Hea
d of
Mon
itorin
g U
nit
El-H
amou
ly L
ocal
Uni
t
Ibsh
way
Dis
tric
tEl
-Ham
ouly
Ham
dy A
bdel
Hal
imH
ead
of M
aint
enan
ce U
nit
El-H
amou
ly L
ocal
Uni
t
Ibsh
way
Dis
tric
tEl
-Ham
ouly
Ahm
ed A
bdel
Alim
Hea
d of
Lic
ensi
ng U
nit
El-H
amou
ly L
ocal
Uni
t
Satu
rday
11
April
200
9
Yous
sef E
l Sed
dik
Dis
tric
tG
anab
eyet
Ba
tn H
arid
Ram
adan
Gom
aaCh
airm
an
Gan
abey
et B
atn
Har
id W
ater
U
ser A
ssoc
iatio
n
Sund
ay 1
2 Ap
ril 2
009
Fayo
um C
itySa
mia
Ma’
rouf
Hea
d of
Dep
artm
ent f
or A
war
enes
sFA
DW
ASC
Fayo
um C
ityH
errie
Hec
kman
Man
ager
FaD
WaS
P
Fayo
um C
itySa
bra
Mo’
awad
Hea
d of
Com
mer
cial
Sec
tor
FAD
WAS
C
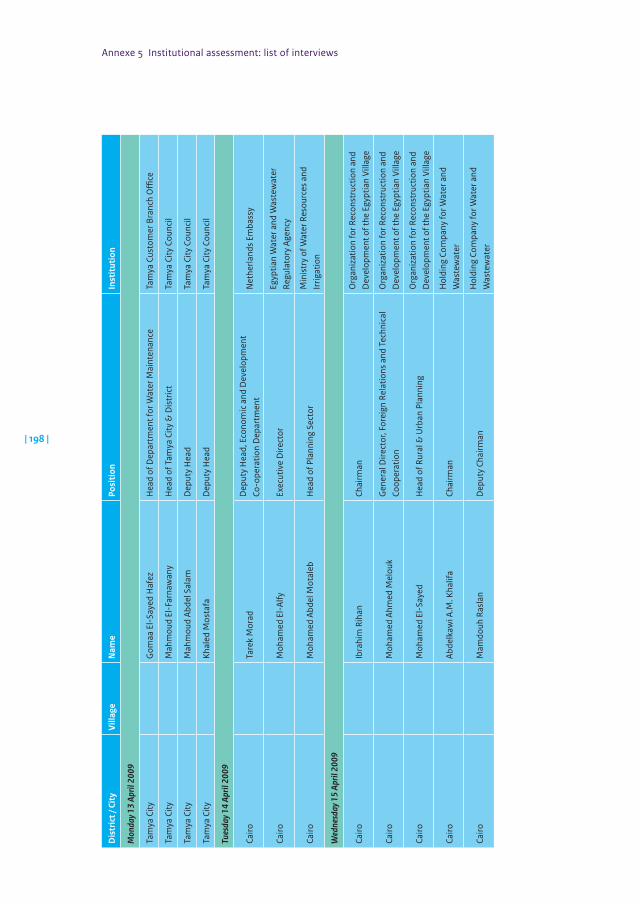
Annexe 5 Institutional assessment: list of interviews
| 198 |
Dis
tric
t / C
ity
Vill
age
Nam
ePo
siti
onIn
stit
utio
n
Mon
day 1
3 Ap
ril 2
009
Tam
ya C
ityG
omaa
El-
Saye
d H
afez
Hea
d of
Dep
artm
ent f
or W
ater
Mai
nten
ance
Tam
ya C
usto
mer
Bra
nch
Offi
ce
Tam
ya C
ityM
ahm
oud
El-F
arna
wan
yH
ead
of T
amya
City
& D
istr
ict
Tam
ya C
ity C
ounc
il
Tam
ya C
ityM
ahm
oud
Abde
l Sal
amD
eput
y H
ead
Tam
ya C
ity C
ounc
il
Tam
ya C
ityK
hale
d M
osta
faD
eput
y H
ead
Tam
ya C
ity C
ounc
il
Tues
day 1
4 Ap
ril 2
009
Cairo
Tare
k M
orad
Dep
uty
Hea
d, E
cono
mic
and
Dev
elop
men
t Co
-ope
ratio
n D
epar
tmen
tN
ethe
rland
s Em
bass
y
Cairo
Moh
amed
El-
Alfy
Exec
utiv
e D
irect
orEg
yptia
n W
ater
and
Was
tew
ater
Re
gula
tory
Age
ncy
Cairo
Moh
amed
Abd
el M
otal
ebH
ead
of P
lann
ing
Sect
orM
inis
try
of W
ater
Res
ourc
es a
nd
Irrig
atio
n
Wed
nesd
ay 1
5 Ap
ril 2
009
Cairo
Ibra
him
Rih
anCh
airm
anO
rgan
izat
ion
for R
econ
stru
ctio
n an
d D
evel
opm
ent o
f the
Egy
ptia
n Vi
llage
Cairo
Moh
amed
Ahm
ed M
elou
kG
ener
al D
irect
or, F
orei
gn R
elat
ions
and
Tec
hnic
al
Coop
erat
ion
Org
aniz
atio
n fo
r Rec
onst
ruct
ion
and
Dev
elop
men
t of t
he E
gypt
ian
Villa
ge
Cairo
Moh
amed
El-
Saye
dH
ead
of R
ural
& U
rban
Pla
nnin
gO
rgan
izat
ion
for R
econ
stru
ctio
n an
d D
evel
opm
ent o
f the
Egy
ptia
n Vi
llage
Cairo
Abde
lkaw
i A.M
. Kha
lifa
Chai
rman
Hol
ding
Com
pany
for W
ater
and
W
aste
wat
er
Cairo
Mam
douh
Ras
lan
Dep
uty
Chai
rman
Hol
ding
Com
pany
for W
ater
and
W
aste
wat
er
Drinking water supply and sanitation programme in Fayoum, Egypt, 1990-2009
| 199 |
Annexe 6 References
Chemonics Egypt, 2009. Affordability assessment to support the development of a financing strategy for the water supply and sanitation sector in Egypt. Cairo: Chemonics Egypt (Ahmad Gaber and Associates).
El Azab Water Works and Fayoum Sanitation Department, 1993. Fayoum governorate: masterplan drinking water supply and waste water. Fayoum: EAWW and Fayoum Sanitation Department.
El Shorbagi, M., 2008. Fayoum Drinking Water and Sanitation Project Phase V: identification of sewerage solutions for small and remote villages: draft study to assess the social feasibility of community owned communal sewerage systems. Nijmegen: Haskoning Nederland BV.
Esrey SA, Potash JB, Roberts L, Shiff C. 1991. Effects of improved water supply and sanitation on ascariasis, diarrhea, dracunculiasis, hookworm infection, schistosomiasis and trachoma. Bull.WHO 69:609–21
Euroconsult/Darwish Consulting Engineers, 1992. Environmental profile: Fayoum governorate, Egypt: background study. Fayoum: Environmental Affairs Department.
FADWASC, nd. Economic Management Plan: EMP – overview. Fayoum: FADWASC.
FaDWaSP, 1992a. Fayoum Drinking Water and Sanitation Project: quarterly report April – June 1992, including status report mid 1992. Fayoum: FaDWaSP.
FaDWaSP, 1992b. Fayoum Drinking Water and Sanitation Project: year plan 1993. Fayoum: FaDWaSP.
FaDWaSP, 1992c. Socio-economic aspects of drinking water and sanitation in Fayoum rural communities. Results of a survey in five villages and attached hamlets. Fayoum: FaDWaSP.
FaDWaSP, 1993a. Fayoum governorate masterplan drinking water supply and waste water. Volume I: executive summary. Fayoum: FaDWaSP.
FaDWaSP, 1993b. Fayoum Drinking Water and Sanitation Project: plan of operations phase II. Fayoum: FaDWaSP.
FaDWaSP, 1993c. El Azab Water Company: water tariff proposals for an autonomous water company. Fayoum: FaDWaSP.
Annexe 6 References
| 200 |
FaDWaSP, 1994a. Fayoum Drinking Water and Sanitation Project: inception report, Phase II. Fayoum: FaDWaSP.
FaDWaSP, 1994b. Fayoum Drinking Water and Sanitation Project: Phase II: community hygiene component. Fayoum: FaDWaSP.
FaDWaSP, 1995. Fayoum Drinking Water and Sanitation Project phase II: year plan 1995. Fayoum: FaDWaSP.
FaDWaSP, 1996a. Fayoum Drinking Water and Sanitation Project phase III, 1.1.1997 – 31.12.1999: project document. Fayoum: FaDWaSP.
FaDWaSP, 1996b. Fayoum Drinking Water and Sanitation Project: plan of operations phase III 1997 – 1998 – 1999: including yearplan 1997. Fayoum: FaDWaSP.
FaDWaSP, 1996c. Cost recovery strategy 1995-2000. Fayoum: FaDWaSP.
FaDWaSP, 1999. Fayoum Drinking Water and Sanitation Project phase II: final report. Fayoum: FaDWaSP.
FaDWaSP, 2000a. Project document: Phase IV of FaDWaSP, 2000-2004. Fayoum: FaDWaSP.
FaDWaSP, 2000b. Final report, January 1997 to December 1999: Fayoum Drinking Water and Sanitation Project phase III; New El Azab treatment plant (contracts EG00454 and EG010202). Fayoum: FaDWaSP.
FaDWaSP, 2004. Progress report VIII: Fayoum Drinking Water and Sanitation Project phase IV (contracts EG4506 and EG45407). Fayoum: FaDWaSP.
FaDWaSP, 2005. Progress report X: 1 July – 31 December 2004: Fayoum Drinking Water and Sanitation Project Phase IV (contracts EG4506 and EG45407). Fayoum: FaDWaSP.
FaDWaSP, 2007. Fayoum Drinking Water and Sanitation Project Phase V: progress report II: 1 July – 31 December 2007. Fayoum: FaDWaSP.
FaDWaSP, 2008a. Fayoum Drinking Water and Sanitation Project Phase IV.Fayoum: FaDWaSP: unpublished draft.
FaDWaSP, 2008b. Plan of operations 2007-2012. Fayoum: FaDWaSP.
FaDWaSP, 2008c. Fayoum Drinking Water and Sanitation progress report 3. Fayoum: FaDWaSP.
FaDWaSP, 2009a. Fayoum Drinking Water and Sanitation progress report 4. Fayoum: FaDWaSP.
Drinking water supply and sanitation programme in Fayoum, Egypt, 1990-2009
| 201 |
FaDWaSP, 2009b. Fayoum Drinking Water and Sanitation Project final report Phase IV (2000-2008). Fayoum: FaDWaSP.
FEGAWS, nd. Press release open house FEGAWS. Fayoum: FEGAWS.
Government of the Arab Republic of Egypt, 2005. National Water Resources Plan for Egypt – 2017. Cairo: Ministry of Water Resources and Irrigation.
Government of the Arab Republic of Egypt, 2006. Summary of the National Water Resources Plan. Cairo: Ministry of Water Resources and Irrigation.
Government of the Netherlands, 1989. Beoordelingsmemorandum, Fayoum Drinkwater en Sanitatie, Fase 1. The Hague: DGIS.
Government of the Netherlands, 1994. Egypte/beoordelingsmemorandum EG004502 en EG004503, Fayoum Drinking Water Supply and Sanitation (FADWS) Fase II. The Hague: DGIS.
Government of the Netherlands, 2000. FaDWaSP-IV beoordelingsmemorandum. The Hague: DGIS.
Government of the Netherlands, 2001. Abridged BEMO: Fayoum Drinking Water and Sanitation – Phase IV (additional commitment). Cairo: EKN.
Government of the Netherlands, 2008a. Voorblad slotdocument: EG004506. The Hague: DGIS.
Government of the Netherlands, 2008b. Voorblad slotdocument: EG004507. The Hague: DGIS.
Government of the Netherlands, 2008c. Request for quotations: drinking water and sanitation Fayoum. Cairo: Embassy of the Kingdom of the Netherlands.
Governorate of Fayoum, 2004. Memorandum: continued support: the drinking water and sanitation sector: Governorate of Fayoum: 2005-2009: final proposal. Fayoum City: Governorate of Fayoum.
Governorate of Fayoum, 2008. Environmental action plan: Fayoum governorate. Fayoum City: Governorate of Fayoum and Ministry of Environment.
IOB, 1998. Egypt: evaluation of the Netherlands development programme with Egypt, 1975-1996. The Hague: Policy and Operations Evaluation Department, Ministry of Foreign Affairs.
IMF, 2009. World economic outlook database, April 2009. www.imf.org [accessed 16 June, 2009]
Annexe 6 References
| 202 |
Institute of National Planning, 2005. Egypt human development report 2005. Cairo: UNDP.
Jousilahti, P., S.M. Madkour, T. Lambrechts and E. Sherwin, 1997. ‘Diarrhoeal disease morbidity and home treatment practices in Egypt’: Public Health, Vol. 111(1), p 5-10.
MFAN, 1989a. Sector memorandum on water supply and sanitation. The Hague: Ministry of Foreign Affairs.
MFAN, 1989b. Women, water and sanitation. The Hague: Ministry of Foreign Affairs.
MFAN, 1998. Drinking water supply and sanitation. The Hague: Ministry of Foreign Affairs.
MFAN, 2002. Sector wide approach for water and sanitation development.The Hague: Ministry of Foreign Affairs.
MFAN, 2005. Letter to the Dutch Parliament on progress of the water programme 2004. The Hague: Ministry of Foreign Affairs.
MOLD, 2003. Fayoum human development report, 2003. Cairo: MOLD.
Rachid, A.R.H., 1990. Public policy, bureaucracy and local administration in Egypt. Cairo: Fulbright Commission.
Radwan, H.H., 1994. Democratisation in rural Egypt: a study of the Village Popular Council. Cairo Papers in Social Science 17: Monograph 1.
Schemm, P., 2008. Small Fayoum town thrives on Italian money of illegal immigrants. Daily News, 18 January. http://www.thedailynewsegypt.com/article.aspx?ArticleID=11394 [accessed 15 June, 2009].
World Bank, 2005a. Cost-effectiveness and equity in Egypt’s water sector. Egypt public expenditure review Policy Note 3. Washington, D.C.: Social and Economic Development Group, Middle East and North Africa Region, World Bank.
World Bank, 2005b. Arab Republic of Egypt: operational framework for integrated rural sanitation service delivery. Washington, D.C.: Water, Environment, Social and Rural Development Department, The Middle East and North Africa Region, World Bank: Report 32230-EG.
World Bank, 2009. Millennium Development goals: goal tables. http://ddp-ext.worldbank.org/ext/GMIS/gdmis.do?siteId=2&menuId=LNAV01HOME3 [accessed 16 June, 2009]
Drinking water supply and sanitation programme in Fayoum, Egypt, 1990-2009
| 203 |
WHO, 2006a. Report on the fifth intercountry meeting of national malaria programme managers – countries free of malaria or with residual transmission, Damascus, Syrian Arab Republic, 21-23 June. Cairo: WHO Regional Office for the Eastern Mediterranean.
WHO, 2006b. Division of Communicable Disease control newsletter 8.http://www.emro.who.int/pdf/dcdnewsletter8.pdf [accessed 16 June, 2009]
WHO, 2009a. Country cooperation strategy at a glance: Egypt. http://www.who.int/countryfocus/cooperation_strategy/ccsbrief_egy_en.pdf [accessed 16 June, 2009]
WHO, 2009b. Operational research in tropical and communicable diseases: malaria: achievements.http://www.emro.who.int/tdr/TDR-Malaria-Achievements-Epidemiology.htm
| 204 | Published by:
Ministry of Foreign Affairs of the NetherlandsP.O. Box 20061 | 2500 eb The Hague | The Netherlandswww.minbuza.nl/iob
Photo cover: Construction New El Azab Water Treatment Plant, Herrie Heckman (Royal Haskoning)Photo’s: Herrie Heckman (Royal Haskoning), Stephen TurnerISBN: 978-90-5328-381-3
© Ministry of Foreign Affairs of the Netherlands | May 2010
IOB Im
pact Evaluation | no. 327 D
rinking water supply and sanitation program
me in Fayoum
, Egypt, 1990-2009
Policy and Operations Evaluation Department | IOB Impact Evaluations | no. 327 | May 2010 | Policy and Operations Evaluation Department | IOB Impn Department | IOB Impact Evaluations | no. 327 | May 2010 | Policy and Operations Evaluation Department | IOB Impact Evaluations | no. 327 | May 2010
IOB Impact Evaluation
Drinking water supply and sanitation programme supported by the Netherlands in Fayoum Governorate, Arab Republic of Egypt, 1990-2009
Published by:
Ministry of Foreign Affairs of the Netherlands
P.O. Box 20061 | 2500 EB The Hague
The Netherlands | www.minbuza.nl
© Ministry of Foreign Affairs of the Netherlands | May 2010
10BUZ281478|E
Support to water supply and sanitary facilities
has been a priority for Netherlands development
co-operation for many years. The purpose of
support goes beyond sustainable access to
improved facilities: it is intended to reduce the
burden of water collection, improve health, raise
school enrolment; improve livelihoods and
ultimately reduce poverty. IOB is undertaking a
series of impact studies in five countries to
measure the effects of supported programmes,
using a combination of quantitative and
qualitative methods and techniques. Dutch
support provided to the drinkwater supply and
sanitation programme in Fayoum Governorate,
Arab Republic of Egypt started in 1990. The
impact evaluation report is the third report
published in the series.