100th Inaugural Lecture - 2013 by Prof. Francis D. Sikoki
100
UNIVERSITY OF PORT HARCOURT “FISHES IN NIGERIAN WATERS: NO PLACE TO HIDE” An Inaugural Lecture by PROFESSOR FRANCIS D. SIKOKI ffs. Department of Animal and Environmental Biology Faculty of Biological Sciences College of Natural & Applied Sciences. INAUGURAL LECTURE SERIES NO. 100 31st January, 2013
Transcript of 100th Inaugural Lecture - 2013 by Prof. Francis D. Sikoki

i
UNIVERSITY OF PORT HARCOURT
“FISHES IN NIGERIAN WATERS:
NO PLACE TO HIDE”
An Inaugural Lecture
by
PROFESSOR FRANCIS D. SIKOKI ffs. Department of Animal and Environmental Biology
Faculty of Biological Sciences
College of Natural & Applied Sciences.
INAUGURAL LECTURE SERIES
NO. 100
31st January, 2013

ii
CONTENTS
1.0 PREAMBLE
2.0 INTRODUCTION
2.1 History of Human – Fish Relationship
2.1.1. Religion
2.1.2. Early Uses of Fish (Place of Fish in human Society).
2.1.3. Current uses of fisheries resources
2.2 Evolution of Fisheries Management Concept
2.3 Evolution of Nigerian Fisheries Management
2.4 Fish Vs Fisheries
3.0 FISHERIES RESOURCES OF NIGERIA
3.1. Marine fishes
3.2. Freshwater fishes
3.3. Endangered species
3.4. Climate change
3.5. Habitat disruption
3.5.1. Industrial activities

iii
3.5.2. Oil spills
3.5.3. Ballast water
4.0 PRESENT STATUS OF FISHERIES
4.1. World Fish Trade
4.1.1. Fish as food
4.1.2. Sustainability
4.2. Status of Nigerian Fisheries
4.2.1. Fish and Protein Food Demand in Nigeria. 4.2.2. Contribution to National economy 4.2.3. Fish production in Nigeria
5.0 MY CONTRIBUTIONS TO KNOWLEDGE OF
FISHERIES
5.1 Contributions from my PhD thesis
5.2 Post-doctoral contributions
5.2.1. Enhancement of Aquacultural Production 5.2.1. 1. Year-round Production of Catfish Fingerlings. 5.2.1.2. Use of Anabolic Hormones for Production of All- male Tilapia and Growth Enhancement in Catfish. 5.2.1.3. Breeding experiments for selection of growth enhancement traits 5.2.1.4. Studies on environmental contamination and

iv
Degradation 5.2.1.5. Limnological and Stock assessment studies.
6.0 CURRENT RESEARCH
6.1 Pollution Trends Analysis
6.1.1. Seafood Safety
6.2 Aquatic Ecosystem integrity (Health)
6.3 Utilization of Nuisance Aquatic Resources for Wealth
Creation.
7.0 . FUTURE RESEARCH
8.0 . RECOMMENDATIONS
8.1. Fisheries monitoring, Control and Surveillance
8.2. Protection of Fish Stocks from Environmental
Degradation.
8.3. Adoption of Traditional Approaches to Fisheries Conservation and Management.
8.4. Allocation of Resources by Government. 8.5. Reduction of Waste. 8.6. Introduction of Value added Products 8.7. Enhancement of Extension Services.
9.0 . CONCLUSIONS
10.0 REFERENCES

v
11.0 CITATION
List of Tables. Table 1: Mangrove conversion in Rivers State (source, IEOD – WACD, 1995 Table 2: Oil spill in three states in the Niger Delta between 1991-1993 Table 3: World fish trade Table 4: Key Fisheries facts. Table 5: Nigeria’s fin and shell fish yield potential (Source: FDF, 2008) Table 6: Contribution of Fisheries to National economy. Source: FDF, 2008 Table 7: Fish supply by sector (mt) between 1995 and 2007 in Nigeria. Source : FDF, 2008. Table 8: Fish Production from inshore fishing and shrimping (mt) from 1980 to 1989

vi
Source: FDF, 2008. Table 9: Fish Catch from inshore fishing and shrimping (mt) 1995 – 2007. Source: FDF, 1990. Table 10: Sources of variation in growth parameters of T. guineensis.
Table 11: Estimated exploitation rates and ratios from total
natural and fishing mortality data in the Nun River.
Table 12: Exploitation ratios of fish species from the Andoni River System in 1999 Table 13: Effective dose to the adult public due to consumption
of selected seafood from the Bonny estuary. List of Figures Fig 1: How we got here: vertebrate phylogeny Fig 2: Oil Production Process Fig. 3: Contribution of fish to human diet: fish as a percentage of total animal protein intake 1995 (Source: FAO, 2003)
vii
Fig. 4: Value of fish export and import 1986-2002 Fig. 5: A typical fish production function for a fish stock. Fig 6: Comparison of some water quality parameters in Shiroro
Lake with desirable levels for fish production in tropical
lakes. Fig. 8: Heavy metals profile and pH of core sample from Bonny
estuary over 74 years. Fig. 7: Sediment accumulation rates and sedimentation rates in the Bonny estuary of the last 66 years.
List of plates
Plate 1. Representative Marine Fishes.
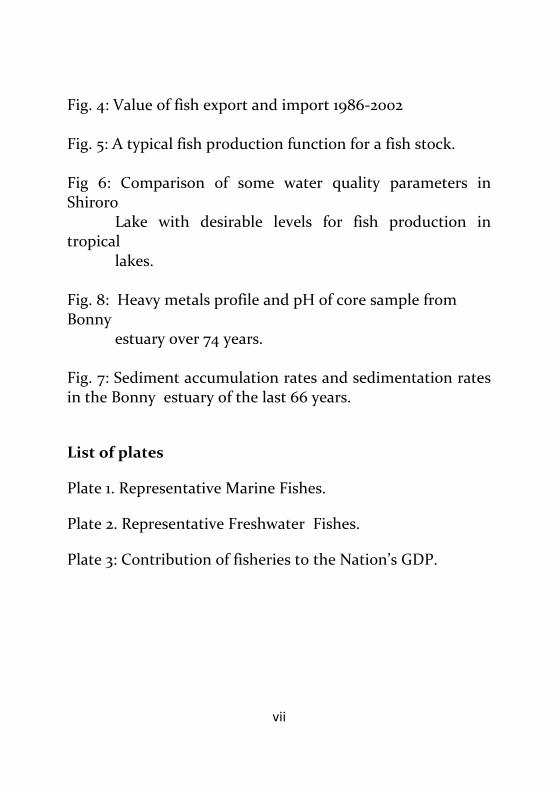
Plate 2. Representative Freshwater Fishes.
Plate 3: Contribution of fisheries to the Nation’s GDP.

1
FISHES IN NIGERIAN WATERS: NO PLACE TO HIDE
“When we can drain the ocean into mill-ponds, and bottle up the Force of Gravity, to be sold by retail, in gas jars; then we may hope to comprehend the infinitudes of man’s soul under formulas of Profit and Loss; and rule over this too, as over a patent engine, by checks, and valves, and balances. - Thomas Carlyle (1795 – 1881), Scottish essayist and Historian.
1.0 PREAMBLE It is a real honour to be asked to give the 100th Inaugural Lecture of this great University which incidentally is also the first in the series of Inaugural Lectures slated for this year. I share in the view that an inaugural lecture is a debt a Professor owes the University Community and which must be paid at some point during his career. The lecture is intended to provide an insight into the current state of knowledge, thereby contributing to the history of the discipline and the professional/academic contributions of the lecturer. I commend the University administration and in particular the Vice Chancellor, Prof J.A. Ajienka for institutionalizing this culture in the University of Port Harcourt. It is therefore my hope and prayer that this diverse and august audience would benefit from this lecture which I have titled: “Fishes in Nigerian Waters: No Place to Hide” Permit me Mr Chairman to use this opportunity to acknowledge and thank all those who have contributed in various ways to the actualization of my academic dreams. Let me particularly acknowledge Prof Karl L. Lagler, Prof of Zoology and Fisheries at the University of Michigan, who supervised both my BSc and MSc Theses; thereby laying the foundation for my academic career. Let me also single out Prof Chinyewite Ejike, former Pro – Chancellor of the Enugu State University and former Dean of the Faculty of Science at the University of Jos who

2
supervised my PhD Thesis with Prof Larry Curtis of the Oregon State University serving as external supervisor. I’ll continue to cherish the interest and love he showed me and his exemplary life style which have impacted positively in me. Let me acknowledge my numerous research associates and former and present post-graduate students for their immense contributions to my research achievements. Let me also place on record my appreciation for the love, support and kindness shown to me by many of my colleagues in the University of Port Harcourt in general, and the Faculty of Science in particular. In this regard, I want to specially thank Professors Okoro, Alagoa, Okiwelu, Arene, Okoli, Oti, Amajor and Efebo among others for their friendship, support and encouragement. I also thank my numerous guests, friends and family members who have come from far and near to honour my invitation. I appreciate your coming and hope that the time spent here would be a fulfilling experience. May I also thank in a very special way, my brother, friend and colleague Professor Nelson Brambaifa who graciously accepted to serve as my orator. Finally, and most importantly let me thank my wife, Mrs Bondan Sikoki who had to put up with my frequent periods of absence from home on account of my work. I appreciate all your sacrifices and would continue to admire your patience and understanding. In order to make my presentation easy to follow, I have divided it into three broad components as follows:
(i) Historical perspectives; (ii) Present status; and (iii) Research Contributions/Recommendations.

3
2.0 INTRODUCTION
2.1 History of Human/Fish Relationship Among vertebrates, fish has the closest relationship with humans. The relationship between humans and fish is not only phylogenetic but also religious, cultural and socio-economic. Phylogenetically, the subclass of ancient fishes, Sarcopterygii appeared in the fossil record during the Devonian period of the Paleozoic era and were from the start divided into two orders, Dipnoi – lungfish; and Crossopterygii – lopefinned fishes. The Crossopterygii were divided into two groups, Rhipidistii and the Coelacanthini. The Rhipidistii gave rise in the very late Devonian to the first amphibians, and thus are the common ancestors of all teterapods including man (Figure 1.).
2.1.1 Religion In Christianity and other religions, fish is a symbol of abundance and faith. Christ and his disciples were described as “fishers of men.” Here man is presented as the transformational fish and the ocean, a symbol of the abyss of sin in which man lives. Fish is also given symbolic meaning in the Gospels. Several of Jesus 12 disciples were fishermen. Jesus commissioned them as fishers of men and when Jesus fed 5,000 people, it was with fish and bread Matthew 14:15-21; Luke 9:12-17. Even before the birth of Christianity, fish may have been used as symbols representing several goddesses. Barbara Walker in her book, “The Woman’s Dictionary of Symbols and Sacred Objects, suggested that Ichthy, Greek word for fish was the son of the sea goddess, Atargatis. In Buddhism, fish symbolizes happiness and freedom and is one of the eight sacred symbols of the Buddha. Some pagan traditions also recognized fish as a femine symbol of fertility and attribute of the goddess. Here, water is regarded as a natural

4
emblem of the flow of the Divine Mother Principal, and as a consequence, all creatures of the water are regarded as components of the fertility and power of the female deity.
Ancient Celts believed that the Salmon, a fish, derived its wisdom from consuming the sacred hazel nuts from the well of knowledge (Segais). They therefore believed that if one eat the salmon, he would gain the wisdom of the well too. Here, fish symbolically meant wisdom, knowledge inspiration and prophesy.
Fig 1: Vertebrate phylogeny

5
Similarly, ancient Eastern Indian mythology regarded the fish as a symbol of transformation and creation. We see this in an ancient flood myth in which Vishnu transformed himself into a fish (Matsya) to save the world from a great flood. In China, fish is regarded as a symbol of unity and fidelity. It derives from the fact that the fish (particularly Koi) swim in pairs. For this reason, fishes are often given as wedding presents in the form of charms to newly–wed couples since they represent fertility and abundance due to their high reproductive potential (speed and volume). Many ancient European cultures gave symbolic meanings of adaptability determination and flow of life to fish. Salmon were particularly revered for their determination in their annual spawning migrations usually against the water current. There are also ancient African creation myths that talk of mangala, the creator, planting seeds in the cosmic womb from which two fish erupted and set forth into the cosmos upon the waters of creation. 2.1.2 Early Uses of Fish (Place of Fish in human Society). From archeological records, fishes have occupied important places in human societies for several thousands of years. The earliest documented human communities that engaged in fishing occurred near lake Mungo, Australia, some 30,000 BP followed by Crete in 8,000 BP. However, archeological records documenting the use of fish spears for fishing date back to 90,000 BP. This was followed by nets in 40,000 while fish hooks appeared 35,000 BP. Fishing for leisure was first reported among the Egyptian aristocracy as far back as 4000 BP. However, it was not until the middle ages, when better preservation techniques, particularly drying, smoking and salting and improved transportation, that fishing activity shifted from local, small scale operations to large scale, commercial enterprises.

6
2.1.3 Current Uses of Fisheries Resources. At present, some 4,000 species of fish are harvested worldwide totaling approximately 120 metric tons of fish annually. The harvest from capture fisheries quadrupled between 1950 and 1990 but has since leveled off and even declined. However, aquaculture production has continued to increase and is expected to continue to play a key role in bridging the gap between supply and demand. Five countries are the leading world producers of fish (capture and culture) with China leading the pack with 32.5% of total world production. The others are Japan, 5.1%; India, 4.5%; U.S.A. 4.4% and Russia 3.9%. Similarly, per caput consumption of fish has nearly doubled since the 1960s. The highest per caput consumption is among Europeans and Asians. Worldwide, per caput consumption of fish and shellfish is put at approximately 15kg but the value varies among the various regions of the world and countries. In the United States, per caput consumption is approximately 7kg with Tuna, shrimp, Pollock, salmon and catfish being the most favoured. Aside its meat, fish is used for a variety of purposes. First, it can be used for aesthetic purposes such as in aquaria or stuffed and placed on display for people to admire. In fact, ornamental fish trade is a big business worldwide and Nigeria has great potential to participate. Approximately 10 million marine ornamental fish are imported annually worldwide. The freshwater species involved are over 5000 and the value of US retail in ornamental fish market is USD 3 billion. Secondly, several useful substances can be extracted from fish. An impotence curing medicine produced by sharks and cod liver oil are among the best known. Thirdly, fishes are used for certain exotic purposes including sending a fish by post to a member of a gang to alert

7
him or her that they have fallen out of favour with the gang and may soon be killed. In addition to the above, many useful products are produced from fish. Some of these include:
(i) Fish Glue: made by boiling the skin, bones and swim
bladder of fish. The glue is highly valued for its use in many products such as illuminated manuscripts and Mongolian war bow.
(ii) Fish Oil: Fish oils are highly recommended for their
Omega – 3 fatty acid content, aicosapentaenoic acid (EPA) and docosahexaenotic acid (DHA) precursors to eicosanoids which are known to reduce inflammation in the body.
(iii) Fish Emulsion: This is a fertilizer emulsion that is
produced from the fluid remains of processed fish for fish oil and fish meal.
(iv) Fish Hydrolysate: This is the ground up fish remains
after the edible portion has been removed. (v) Fish Meal: Used as a high protein feed supplement in
fish culture.
2.2 Evolution of Fisheries Management Concepts. The fishing profession is one of the world’s oldest but fisheries management is still in its infant stage owing to a number of reasons:

8
(i) Prior to 1850, the fisheries of the Oceans and large lakes were essentially considered inexhaustible and in fact this notion persists in some areas up to the present day.
(ii) For centuries, fishing activities had been carried out in
coastal areas and in inland lakes, and the supply of fish seemed infinite.
(iii) Owing to this supposed infinity, Hugo Grocius in 1608
founded the principle of the “freedom of the seas.” His reasoning was that if fishes and other resources could be exploited without limit, maintaining exclusive rights to oceanic resources was unnecessary (Christy and Scott, 1965).
It should however be noted that not all fisheries were considered inexhaustible. Restrictive regulations existed in the British Isles since at least 1278 and were enacted in North America shortly after the arrival of the pilgrims (Nielsen, 1976). The first to question the inexhaustibility of coastal fisheries were British fishermen, who complained of stock depletion even before 1850. They accused competing types of fishing gear particularly “trawling” as being responsible for the depletion. It is now widely recognized that overfishing and improper fishing methods are responsible for depletion of marine fisheries. In freshwater systems, a wider variety of causes including overfishing, improper fishing methods, habitat degradation and pollution are implicated. However, the rationale for regulating fisheries had evolved even before any dramatic scientific investigations. The realization that depletion had occurred as fishing effort increased provided empirical evidence that instead of infinite effort generating infinite yields, there was some intermediate effort which yielded the

9
greatest amount of fish. This thinking brought about two general principles:
(i) that an adequate supply of eggs was needed for future
generations of fish and as such fish should not be caught until they have at least spawned once;
(ii) that small fish would continue to grow if allowed to
live longer and the yield in weight could be sustained only if small fish are not captured.
This approach suggested the need for length limits for landed fish and minimum mesh size restrictions on fishing nets to guarantee sustainable fisheries. A British Select Committee in 1893 recommended these regulations and they have since become the standard methods for fishery regulation. However, a more direct approach is to limit the total annual catch by means of a quota system. This way, the harvest would not exceed the production capacity, and in instances where rebuilding the stock was imperative, some production could be reinvested to provide for increased future yields. An empirical evidence that regulated fishing allowed recuperation of stocks was seen during world war I. The catch of plaice in the North Sea increased for some years after war as the recuperated stocks from the war years were again exploited (fig 3). (Russel, 1942). Alongside these explanations were developing other logical and empirical ideas. During the 1930, E.S. Russell developed a mathematic equation relating stock abundance to additions through growth and recruitment and losses via natural and fishing mortality (Russel, 1942).

10
The outcome of both empirical and theoretical principles was the generalization that for a stock of fish, there exists a Maximum Sustainable Yield, MSY and an associated fishing level to achieve that yield. Unfortunately, as a theoretical objective, MSY does not consider the SOCIAL, POLITICAL and ECONOMIC problems. Michael Graham (1943) in his book, “The Fish Gate” stated the Great Law of Fishing which essentially opinned that unregulated fisheries becomes unprofitable. In the early 1950s a large body of economic literature had portrayed fisheries as a classical example of “Common Property Resources.” The essential features of such a resource are that:
(i) no one pays for its use; and (ii) no one assesses the yields derived from additional units of effort.
Consequently, as long as any profit is being made, additional effort will be expended either by more fishing per fisherfolk or by more fisherfolks until profits decline to zero. This essentially is the situation in Nigerian waters. Therefore, to properly manage, regulations must be directed at harvest and effort to achieve maximum net economic revenue. Unfortunately, the application of economic principles in fisheries management is faced with difficulties relating to property rights. Property rights encounter social and political problems concerning:
(i) proper allocation of the resource among fisheries; and (ii) the displacement and compensation of those denied access.
Political considerations in fisheries management also run counter to those of biologists and economists. Thus, when a

11
British Commission saw the need for management in 1893, Parliament ignored their recommendations. Similarly, the recommendations of the plaice Committee of the International Council for the Exploration of the Sea were embroiled in political problems. Even the 1958 Law of the Sea Conference which accepted MSY in a formal resolution has not been ratified by all participating nations.
These actions are essentially at the core of current fisheries managements policies. The idea that regulation is impractical gave rise to several year of Laissez faire – policy of none interference and importance attached to personal liberty of fisherfolks which have inhibited necessary changes in the fishery sector.
2.3 Evolution of Nigerian Fisheries A formal fisheries service was established in Nigeria by the British Colonial Government in the early 40s with a vision for fisheries research. Later, the department was split into two – the Federal Department of Fisheries (FDF) with responsibility for development activities and the Nigerian Institute for Oceanography and Marine Research, (NIOMR) for marine fisheries research. Fisheries administration started in 1942 in earnest in response to wide spread protein shortages occasioned by world war II. It is generally believed that fisheries sub – sector lagged behind other sectors because during periods of food shortages, carbohydrate supply is given priority over protein supply. This probably explains why even when it was established it was placed in the Agriculture department of the colonial office. However, it received greater attention following the creation of the 12 state structure in 1967. During this period the Federal Fisheries performed mainly coordination functions among the states. Later, in 1975, the Federal Military Government created 22 Research Institutes including two new fisheries Institutes at Maiduguri –

12
Lake Chad Research Institute and at New Bussa – Kainji Lake Research Institute, now National Institute for Freshwater Fisheries Research (NIFFR). 2.4 Fish Vs Fisheries Fish and Fisheries have several meanings but as traditionally used in Fisheries Management, fish typically includes the entire array of aquatic animals that are harvested (for example – tuna, tilapia, sea turtles, seals, whales, clams squid and frogs. A fishery on the other hand is generically defined as a system composed of three interacting components namely:
the aquatic biota
the aquatic habitat; and
the human users of the resources.
There are many kinds of fisheries which may be classified in several ways: For example, on the basis of:
(i) Type of Environment: - freshwater habitats such as
lakes, reservoirs, rivers; or salt – water habitats such as estuarine, brackish, Coastal and open ocean.
(ii) Method of Harvest:- (Seining, trawling, hook and line etc.)
(iii) Type of Access: Open access, open access with regulation, limited or purchased, private property.
iv) Organism Targeted: (e.g. salmon, catfish, shrimp, turtle, whale, tilapia etc)
v) Type of Fishing: commercial/industrial, artisanal, or

13
recreation.
vi) Degree of wildness of organism concerned: e.g. totally wild, captive, etc.
In biology per se, the term fish is strictly used to describe any animal with backbone that has gills throughout life and has limbs, if any, in the form of fins. In fisheries however, fish is used as a collective term to include – Cruteceans, mollusks, and other aquatic animals that are harvested. The true fish, the strict biological definition is referred to as finfish and are distinguished from other animals such as the crustaceans and molluscs which are called shellfish.
3.0 FISHERIES RESOURCES OF NIGERIA. Nigeria is highly endowed with both fresh and marine fishery resources. It is generally believed that if these resources are rationally managed and exploited, the country can attain self sufficiency in fish production. There are an estimated 12,478,818 hectres of inland water bodies made up of reservoirs, lakes, rivers, ponds and perennial swarms (Ita et al., 1985) and some 741,509 ha of brackish waters, most of which are suitable for aquaculture. At present only about 5,476 ha of these waters are utilized for fish culture (Sikoki and Oyero, 1994). In addition to the above, the nations 200 nautical mile Exclusive Economic Zone (EEZ) within which she has absolute jurisdiction over all the living resources spans 853km of coastline and covers 192,000 km2 in area. Bayagbona (1979) estimated that the shellfish potential of the country is approximately 3,500 tonnes; of which she harvests only 2,000 tonnes losing the rest to poachers.

14
There is, however, very little room for expansion in this area as recent data seem to suggest that operations are approaching their maximum sustainable yield. In the fin fish fishery sub-sector, the biomass of the Nigerian continental shelf is estimated at 37,700 metric tons (Williams, 1968). Given that maximum sustainable yield (MSY) is 37 percent of the biomass, Fox (1970) estimated a potential yield of about 12,950 tonnes of tuna. At present, some 10,000 tonnes of tuna and other fishes are said to be harvested yearly. In the inland waters, artisanal and culture fisheries operations are the predominant activities and account for over 90 percent of domestic fish production. These operations cover small – Scale canoe fisheries, and aquaculture activities. 3.1 Marine Fishes Our coastal zone is home to some 104 species of fish belonging to 50 families. Some of the species of commercial importance include: Croaker, Pseudotolithus typus, P. senegalensis, P.elongathus; soles, Cynoglossus spp; Shinnose, Polydactylus quadrifilis; Sea catfish, Arius spp; Grouper, Epinephelus spp; large tarpons, Megalops atlantica and various sparids (breams). Other commercially important species include: moonfishes, Vomer setapinnis, Trichiurus lepturus; Jack fish, Carranx spp and Bigeye, Brachydeuterus auritus (Plate 1). 3.2 Freshwater Fishes Commercially important freshwater fish families in Nigerian waters include the mormyridae (43 species); Cyprinidae (32); Mochokidae (27); characidae (25) and Cichlidae (19). However, the catfishes appear to be more commercially important. (Plate 2). In all some 196 species belonging to 105 genera representing 46 families have been recovered in the freshwater sector (Leveque et al., 1991).

15
3.3 Endangered Species The 2006 International Union for the Conservation of Nature, IUCN Red List names 1,173 fish species world wide that are threatened with extinction. The list includes the Atlantic cod, Devils Hole pup fish, the coelacanths and the great white shark. Many freshwater fish are particularly threatened because they live in smaller water bodies that are more prone to pollution and habitat degradation. The mudskipper, Periothalmus papilio in our coastal areas has probably suffered more in this regard. This fish is not only of great evolutionary significance but of great biological value. Its pectoral fins are modified to enable it skip through the mud flats and from jumping from one tree branch to another in the coastal zone. According to Egborge (1992), in the 1960s and 70s, it was extremely abundant in many lagoon beaches and other water bodies but is currently being threatened by activities such as land reclamation, dredging and oil spills.
16
Plate 1. Representative Freshwater Fishes.
Oreochromis niloticus (Tilapia)
Gymnarchus niloticus
Mormyrus rume (Trunk fish)
Polypterus senegalus
Protopterus annectens
Arias species
Citharinus citharus
Hetoritis niloticus

17
(6) CARANGIDAE: (Ph: Bianchi)
Alectis a lexa ndrines (Juvenile) 230mm SL
(8) CARANGIDAE: (Ph: Bellemans)
Campogramma glay cos
(7) CARANGIDAE: (Ph Bellemans
Alectis a lex andrines (adult) : )
(5) CARANGIDAE: (Ph: Bellemans)
Branchiostegus semifasc iatus
(3) BALISTIDAE: Balistes puncta tus(Ph: Bellemans)
(4) BOTHIDAE: (Ph: Bellemans)
Bothus podas africanus
(2 ) BAL ISTID AE: Baliste s c apriscu s
(Ph : Be lle ma n s)(1) ACANTHURIDAE: Acanthurus monroviae 230m m SL
(Ph: Bianchi)
Plate 2. Representative Marine Fishes.
P. papilio and some other families among marine fishes contain only one species. These include Gerridae, lobotidae, Liognathidae, oxynotidae and scombrescidae which require special protection on account of this fact.

18
Freshwater fish families having only one species include: (i) Albula vulpes (Albulidae) – Warri River (ii) Phractura clauseni (Amphillidae) – Ogun River (iii) Lates niloticus (Centropomidae) – widely distributed (iv) Gymnarchus niliticus (Gymnarchidae) – do – (v) Cromeria niloticus occididentalis (kneridae) -Northern Nigeria (vi) Protopterus annectens (Lepidoserenidae) - Fairly dist. (vii) Malapterurus electricus (Malapteruridae) – Widely dist (viii) Mastercemblus loennbergi (Mastacemblidae) – Fairly dist (ix) Polycentropsis abbreviate (Ophiocepphalidae) – Oguta Lake (x) Heterotis niloticus (Osteoglossidae) – widely dist (xi) Pantodon bucholzi (Pantodntidae) – fairly dist (xii) Phractolaemis ansorgei (Phractolaemidae) – do –
(xiii) Synbrachus afer (Synbranchidae) – Fairly dist (xiv) Trigon margarita (Trigonidae) – do – Source: Egborge, 1992. According to Tobor (1990) the estimated maximum sustainable yield of the Nigerian fishery resources is 240,000 metric tons but official catch figures have consistently exceeded this value. The consequences therefore of fishing at the current level are grave as this would undoubtedly lead to a decline not only in catch volume but to a total disappearance of some of the most valuable fish species. Other factors responsible for the decline in fish production include:
Changing climatic and limnological factors;
Habitat disruption;
Pollution; and

19
Improper or irrational fishing methods.
3.4 Climate Change Globally, the period 2000 to 2009 is said to be the warmest decade since records began in 1850. The average temperature near the earth’s surface has risen by about 0.7500C since 1900. Most scientists believe that if we continue to emit green house gases at current rates, global temperatures may rise by between 1.10 and 1.400C above 1980 to 1999 levels by the end of this century. This phenomenon could cause floods, droughts and tropical storms. Nigeria has already witnessed several such disasters as shown below in the last 30 years or so:
No. of events 94
No. of people killed 21,002
Average killed per year 677
Average affected per year 203,434
Economic damage (USD) 188,025,000 = Similarly, a number of natural disasters have been witnessed in the country each year including:
Drought 0.03
Epidemic 1.58
Extreme temperature 0.06
Flooding 1.13
Storm 0.06 Furthermore, changes in rainfall patterns induced by climate change would adversely affect many plants and animals. Those species which may not be able to adapt may become extinct. It is estimated that if global temperatures increase by 20C, 30 percent of all land animals and plants may be threatened by increased risk of extinction.

20
In fact, the International Union for the Conservation of Nature, IUCN reported that:
One out of eight birds;
One out of four mammals;
One out of four conifers;
One out of three amphibious; and
Six marine turtles out of seven are threatened with extinction.
In addition, the report stated that:
75% of genetic diversity of agricultural crops has been lost;
75% of the worlds fisheries are fully or over exploited;
Up to 70% of the world’s known species risk extinction if global temperatures rise by more than 3.50C;
One third of reef – building corals are threatened with extinction; and
A parcel of rainforest, the size of a football field disappears every second.
3.5 Habitat Disruption
It has been estimated that some 50 percent of mangrove trees in the coastal zone have been felled (World Resources, 1990). The result of this action has been increased erosion and flooding. Furthermore, the mangrove ecosystem provides a conducive environment for the spawning of various kinds of fish and as nursery ground. Its removal therefore results in loss of habitat, biodiversity and breeding/nursery grounds for fish. Similarly, sand mining and dredging had adverse effects on the hydro – dynamics of the affected areas. These include increased depth and wave action, and altered hydrodynamics.

21
These processes could adversely affect living resources such as the benthic organisms which would lose their substrates. Furthermore, the dredging of harbours and channels has deleterious effects on coastal environments to which bottom materials are carried in suspension. While in suspension, such materials cause waters to be turbid, reduce light penetration which may restrict photosynthetic activity of plants and the vision of animals (Sikoki, 1979). Finely divided materials at high concentrations are known to interfere with feeding of animals that obtain their food by filtration. They may also be abrasive to sensitive structures such as gills of fish. On settling to the bottom, solid materials often alter the aquatic habitat making the substrate unsuitable for several bottom dwelling animals such as oysters. Rocky bottoms providing habitat for some animals may be buried as well.
3.5.1 Industrial Activities Industries are a major source of environmental pollution and degradation. Their infrastructures modify the environment and their effluents and emissions adversely affect the environment. In this regard, the oil industry is a major contributor to resource depletion and environmental degradation. Its exploration and exploitation involve many steps – Exploration, drilling, flowlines and flowstations (Figure 2). The major environmental impacts of oil activities from extraction to its arrival at an oil terminal or refinery include:
physical impacts on the environment;
air emissions;
water effluents; and
waste materials.

22
(i) Exploration: This process begins by creating a subsurface “picture” through the generation of sound waves and recording their reflection from underground layers. It involves setting off small explosive charges along a grid of narrow paths or lines over the area to be surveyed. These surveys require a large number of people to cut lines through the area to collect exploration data. Although the environmental impacts are largely temporary, they cover thousands of kilometers and many of the older lines are still visible on the land scape.
(ii) Drilling: When seismic survey has been completed, the presence of oil can only be confirmed by drilling a well. The process involves the circulation of clay mud down a drill pipe and back to the surface to balance:
Underground pressure;
Cool the drill bit; and
Flush out rock cuttings.
Drilling operations require the acquisition of land for access roads. The construction of roads (on land) and canals (in swamps) involve land clearing, dredging and sandfilling. The environmental consequences of these activities include:
increased turbidity of surface waters;
loss of vegetation due to acidic slurry;
accidental oil spills; and
noise.
(iii) Flowlines: Oil from each producing well is carried to the nearest flowstation in small diameter pipelines. The land acquired for this purpose ranges from 10 to 15 metres in width.

23
(iv) Flowstations: The oil, water and gas produced together in a mixture from each well is transported to central production facilities called flowstations. At the flowstation, the gas is separated from the fluids. Most of the separated gas is flared while the oil and water mixture is pumped through delivery pipelines to oil terminals. At the terminals, the water is separated from the oil and discharged. These operations have destroyed substantial areas
vegetation, particularly mangrove. According to the IEOD – WCAD (1995) SPDC alone has removed about one percent of mangrove forest in Rivers State alone. (table 1).

24
Fig 2: Oil Production Process: Source, SPDC
Table 1: Mangrove conversion in Rivers State (source, IEOD – WACD, 1995
S/N Operation Facility Area Converted (km2)
1. Seismic Surveys
56,000km of seismic lines
56.4
2. Drilling Operations
349 sites 4.5
3. Production 700km of flowlines 400km of pipelines 22 flowstations 1 terminal
10.5
Total 71.40km2
In addition, the construction of oil facilities and transportation canals create a wide range of environmental problems including:
destruction of fishing grounds;
alteration of salinity;
alteration of flow regime leading to erosion and sedimentation;
temporary increase in turbidity;
decrease in dissolved oxygen;
increase in acidity;

25
reduce agricultural yields resulting from run – off of dredge spoil; and
water logging of fields.
3.5.2 Oil Spills Each year, some 2,300 m3 of oil are spilled in about 300 incidents in Rivers, Bayelsa and Delta States (table 2)
Table 2: Oil spill in three states in the Niger Delta between 1991-1993
Year No. of spills Vol. Spilled (Barrels)
1991 176 6,053
1992 352 34,064
1993 348 9,010
Total 875 43,770
Mean/Year 292 14,590
It is widely believed that the actual figures may be higher as the reported ones do not include small spills that occur frequently. Crude oil contains water soluble toxic materials (Sikoki and Enajekpo, 2001). Powell (1994) reported that oil spills cause mortality of fish and bivalves such as oysters. Gunderlach (1981) developed a sensitivity index for various ecosystems and reported that sheltered tidal flats, salt marshes and mangroves are the most sensitive ecosystems.

26
3.5.3 Ballast Water Powell (1986) reported that discharge of ballast water from oil tankers is responsible for the introduction of exotic species of marine organisms into Nigerian waters. The Indopacific sea urchin, Temnopleuras toreumaticus, previously unknown in Nigerian waters was probably introduced through this source. The animals presently constitute a major nuisance to artisanal fishers in some estuaries where they remove bait from long – line hooks, eat fish caught in nets and entangle set and cast nets. They also injure fishfolk with their spines.
4.0 PRESENT STATUS OF FISHERIES Fish has been an important source of protein throughout recorded history. The modern English word for fish comes from the old English word fisc (plural: fiscas pronounced as it is today. More than 32,000 species of fish have been described, making them the most diverse group of vertebrates. Approximately 90% of world fish catches come from oceans and seas, these catches have remained relatively constraint since the mid 1990s at between 80 and 86million tonnes. This is primarily because most marine fisheries are based in the coastal waters which are easier to exploit on account of:
their being shallow;
fish being more abundant near the continental shelf; and
abundance of nutrients from coastal upwelling and land runoff.
The primary production operations in the fisheries sector provide direct employment for some 38 million people worldwide. It is also estimated that over 200 million people, mostly those living in landless communities depend on fisheries for their livelihood. It is also a source of income for millions of women and children, who engage in processing, marketing and transportation of fish and fish products.

27
Fish is the principal animal protein consumed by about one billion people worldwide (figure 3). In many coastal rural communities, fishing is the occupation of last resort; a situation that makes rational exploitation of the resource difficult.
4.1 World Fish Trade The food and Agriculture Organization, FAO, 2012 estimated that total fish imports exceeded USD 100 billion in 2008. The value of exports was placed a little lower at USD 99.5 million. Of this figure, approximately half originated in developing countries while approximately 80% of world imports went to the developed countries. Nigeria’s share of exports was placed at 0.10% while imports were 0.5% (Table 3 )
Some 38% of world fish production is exported.

28
Fig. 3: Contribution of fish to human diet: fish as a percentage of total animal protein intake 1995 (Source: FAO, 2003)

29
Table 3: World fish trade
Exports Imports
2006 2007 2008 2006 2007 2008
Estim. Estim.
US$ billion
US$ billion
ASIA China of which Hong Kong SAR & Taiwan PC India Indonesia Japan Korea, Rep. of Philippines Thailand Viet Nam AFRICA Ghana Morocco Namibia Nigeria Senegal South Africa CENTRAL AMERICA Mexico Panama
29.0 10.8 0.4 1.4 1.8 2.0 1.4 0.9 0.4 5.2 3.4 4.1 0.1 1.2 0.5 0.1 0.3 0.4 1.8 0.7 0.4
30.9 10.9 0.4 1.2 1.7 2.1 1.7 1.1 0.5 5.7 3.8 4.5 0.1 1.4 0.5 0.1 0.3 0.5 2.1 0.8 0.4
34.0 12.2 0.5 1.5 1.7 2.5 1.6 1.3 0.5 6.5 4.0 4.8 0.0 1.7 0.5 0.1 0.2 0.5 2.2 0.9 0.4
28.5 6.7 2.0 0.5 0.0 0.1 14.0 2.8 0.1 1.5 0.3 2.0 0.1 0.1 0.0 0.5 0.0 0.2 0.9 0.4 0.0
29.5 7.4 2.2 0.6 0.0 0.1 13.2 3.1 0.1 1.7 0.4 2.4 0.2 0.1 0.0 0.5 0.0 0.2 1.1 0.5 0.0
32.6 8.4 2.4 0.7 0.0 0.2 14.5 2.9 0.1 2.4 0.4 2.8 0.1 0.1 0.0 0.5 0.0 0.2 1.2 0.6 0.0

30
SOUTH AMERICA Argentina Brazil Chile Ecuador Peru NORTH AMERICA Canada United State of America EUROPE European Union Iceland Norway Russian Federation OCEANIA Australia New Zealand WORLD 3 Developing Countries Developed countries LIFDCs LDCs NFIDCs
8.8 1.3 0.4 3.6 1.3 1.8 8.2 3.7 4.1 31.9 21.6 1.8 5.5 2.1 2.1 0.9 0.9 85.9 42.6 43.3 17.1 2.3 6.9
9.0 1.1 0.3 3.7 1.4 2.0 8.4 3.7 4.4 35.7 24.2 2.0 6.2 2.4 2.2 0.9 0.9 92.8 45.1 47.6 18.0 2.5 7.6
9.7 1.0 0.3 3.9 1.8 2.1 8.5 3.8 4.5 38.0 25.5 1.7 7.4 2.5 2.3 0.9 1.0 99.5 49.5 50.0 19.8 2.4 8.2
1.0 0.1 0.5 0.2 0.0 0.0 15.1 1.8 13.3 41.3 37.4 0.1 0.8 1.4 1.1 0.9 0.1 89.9 18.6 71.3 6.2 0.6 1.9
1.4 0.1 0.6 0.2 0.1 0.0 15.6 2.0 13.6 46.7 41.8 0.1 1.1 2.0 1.3 1.1 0.1 98.0 21.3 76.7 6.9 0.9 2.5
1.7 0.1 0.7 0.2 0.2 0.0 16.2 2.0 14.1 49.0 43.2 0.1 1.3 2.3 1.3 1.1 0.1 104.7 23.9 80.9 7.9 1.0 3.0

31
Source: FAO-FIES
Fig. 4: Value of fish export and import 1986-2002 In 2002, the value of net fish exports from developing countries was reported to be higher than the combined value of coffee, cocoa, bananas, rubber, rice and tea. Although the expanding

32
global fish creates opportunities for developing countries, it also encourages overfishing and places fish beyond the reach of the poor. Table 4: Presents key fisheries facts.
Table 4: Key Fisheries facts.
1. Total value of world trade in fisheries
2. Percent of global fish production from aquaculture
3. Net receipts from fish by
developing countries
4. Fish exports from developing countries
5. Value of global fish
imports
6. Status of capture fisheries stock
USD 58.2 billion 4% and 30% USD 17.4 billion 22 million tons USD 61 billion – 80% accounted for by dev. Countries 24% over – exploited/depleted or recovering; 52% fully exploited; 24% under or moderately exploited.

33
Table 4 (cont’d)
7. No. of people for whom fish is the principal animal protein
8. No. of livelihoods
supported by fisheries
9. No. of decked vessels in the global fishing fleet
10. No. of undecked vessels in
the global fishing fleet 11. Global per capita supply of
fisheries products
>1 billion worldwide
38 million
1.3 Million
2.8 million, 65% without power. Declined by 2.5kg/person/year since mid 1980 (from 11.8kg in 1986 to 9.3kg in 1999.
Source – FAO, 2004, Delgado et al., 2003.
4.1.1. Fish as Food Fish plays an important role in global food supplies and its demand is expected to increase considerably as living standards increase in Asia and population grows in Africa.
34
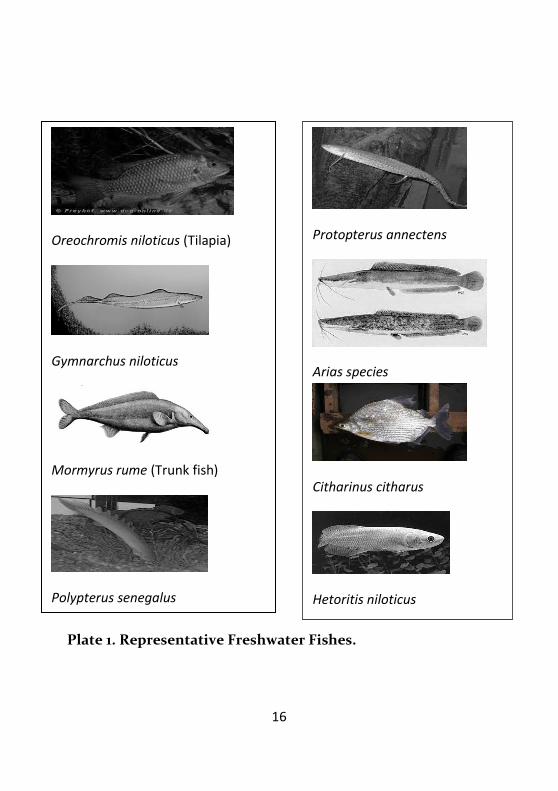
Global fish consumption has doubled since 1973 with China, India and Southeast Asia accounting for nearly all the increase. On the other hand, global per capita supply of fish products has declined by 2.5kg since the mid 1980 (from 11.8 kg in 1986 to 9.3 kg in 1999) essentially on account of fish production not keeping pace with population growth. It is widely believed that capture fisheries would not be able to meet global demand and aquaculture holds the promise to bridge the supply demand gap. It is estimated that by 2020, 90% of fish consumed in sub – Saharan Africa would be low – value food fish, mainly small pelagic fish. Furthermore, by this date, increasing fish prices driven population growth and declining incomes would reduce per capita fish consumption in Africa from 7.6 to 6.6 (FAO; 2004). These statistics are highly worrisome because fish provides a good source of high quality protein and several minerals and vitamins. It is classified as either whitefish, oily or shellfish. Whitefish is low in fat (<1%) while oily fish such as sardines contain between 10 and 25% fat. The fatty fish contain a wide range of fat soluble vitamins (A, D, E & K) and essential fatty acids which are needed for healthy functioning of the body. Recent studies suggest that the amount of fatty acids in the diet of a pregnant woman affects her child’s intelligence, fine motor skills and the propensity for antisocial behavior. For instance, children born to women who consume little amounts of Omega – 3 fatty acids during their pregnancies had verbal IQ six points lower than average. Therefore, widespread deficiencies within a country would have serious implications for its human resource potential. 4.1.2. Sustainability.

35
Despite the existence of several international conventions which provide framework for the rational management of fisheries resources among which are:
the United Nations, UN Convention on the Law of the Sea (UNCLOS); and
UN fish stocks Agreement, there are serious concerns over the sustainability of many capture fisheries. This is due to the “common property” and “open access” nature of many fish resources. A fishery without limits to access will attract more and more fishers until the aggregate cost of fishing approaches the aggregate value of the catch.
On account of these concerns, FAO member states in 1995 adopted the Code – of Conduct for Responsible Fisheries. The objectives of the code are to:
(i) establish principles in accordance with the relevant rules of International Law for responsible fishing and fisheries activities;
(ii) establish principles and criteria for the elaboration and
implementation of national policies for responsible conservation of fisheries resources and fisheries management and development;
(iii) serve as an instrument of reference to help states
establish or improve the legal and institutional framework required for the exercise of responsible fisheries;
(iv) Provide guidance that may be used where appropriate in
formulating international agreements and other legal instruments;

36
(v) facilitate and promote technical, financial and other cooperation in the conservation of fisheries resources;
(vi) promote the contribution of fisheries to food security
and food quality; (vii) promote protection of living aquatic resources and their environment; (viii) promote trade in fish and fishery products in conformity
with relevant international rules; (ix) promote research on fisheries; and (x) Provide standards of conduct for all persons involved in
the fisheries sector. Mr. Vice Chancellor distinguished guests, Ladies and Gentlemen; the realization of the lofty ideas embodied in this code is the major challenge facing the Nigerian Fisheries Sector. The key issues therefore that require urgent attention are:
access limitation to fisheries resources;
allocation of the resources in an equitable manner between competing interest groups; and
ensuring rational exploitation of the living aquatic resources in a manner that is compatible with ecosystem integrity and conservation of biodiversity.
4.2. STATUS OF NIGERIAN FISHERIES Despite its high potential for fish production, (37,934 km2
continental shelf area 853 km coastline, 210, 900km2 EEZ, 14m ha
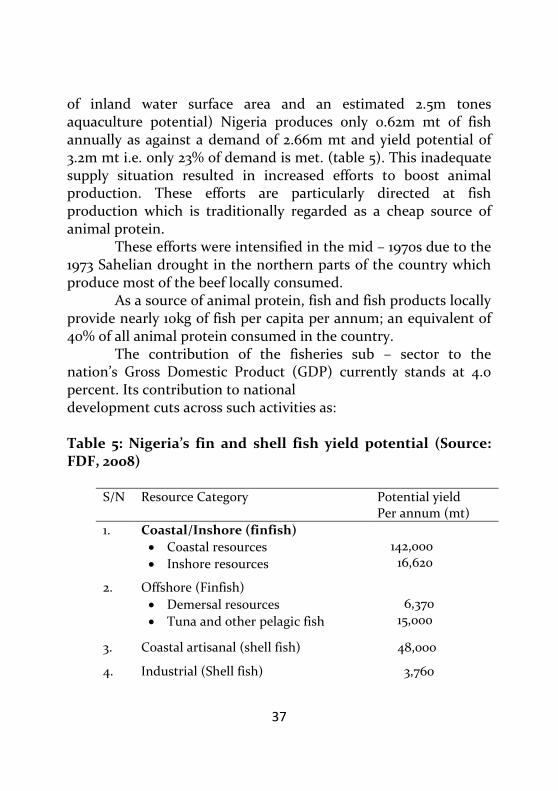
37
of inland water surface area and an estimated 2.5m tones aquaculture potential) Nigeria produces only 0.62m mt of fish annually as against a demand of 2.66m mt and yield potential of 3.2m mt i.e. only 23% of demand is met. (table 5). This inadequate supply situation resulted in increased efforts to boost animal production. These efforts are particularly directed at fish production which is traditionally regarded as a cheap source of animal protein. These efforts were intensified in the mid – 1970s due to the 1973 Sahelian drought in the northern parts of the country which produce most of the beef locally consumed. As a source of animal protein, fish and fish products locally provide nearly 10kg of fish per capita per annum; an equivalent of 40% of all animal protein consumed in the country. The contribution of the fisheries sub – sector to the nation’s Gross Domestic Product (GDP) currently stands at 4.0 percent. Its contribution to national development cuts across such activities as:
Table 5: Nigeria’s fin and shell fish yield potential (Source: FDF, 2008)
S/N Resource Category Potential yield
Per annum (mt)
1. Coastal/Inshore (finfish)
Coastal resources
Inshore resources
142,000 16,620
2. Offshore (Finfish)
Demersal resources
Tuna and other pelagic fish
6,370 15,000
3. Coastal artisanal (shell fish) 48,000
4. Industrial (Shell fish) 3,760

38
5. Fresh – Water Resources
Rivers and flood plains
Lake Chad
Kainji Lake
226,550 160,000 30,000
6. Aquaculture 2,500,000
employment generation, income generation and household food security (Plate 3). The sector is also a high foreign exchange earner, generating about US 38.3 million dollars annually the rough export of fisheries products. In addition the sector, provides 8.23m direct and 18.27 million indirect employment opportunities for Nigerians.
4.2.1. Fish and Protein Food Demand in Nigeria. Between 1970 and 1974, the Nigerian cattle, Sheep and Goat industry was heavily affected by drought. In the Northern parts of the country, about 90% of the cattle and 70% of the sheep and goat populations were adversely affected by the drought. The rinderpest outbreak of 1983/84 further reduce the cattle population in Nigeria which resulted in massive importation of frozen meat, fish and chicken in order to meet the demand for protein foods. Efforts were also made to increase the country’s fish ad poultry production to bridge the gap between supply and demand. Some of the programmes directed at increasing fish production include:

39
Social benefits
Income from community managed fisheries can provide community income to improve infrastructural such as school leo PDR
Reduced vulnerabilityFishing often form part of a diverse livelihood strategy reducing vulnerability to poverty and food insecurity
Employment benefits
Over 38 million peopleworldwide are employed full time in fishing, and a further
88 million in other related sectors such as processing and trading
Cash Income
The money received from selling dish provides accent to other goods and services such as health, clothing, education and the purchase of other assets
Cultural benefitsFishing in often a very social activity, strengthening community cohesion
Household food security Fish provide important nutritional benefits to
consumers
Plate 3: Contribution of fisheries to the Nation’s GDP.
In-shore fisheries development project to enhance fish production and generate employment opportunities;
National Accelerated Fish Production project (NAFPP) and Canoe Mechanization Scheme (CMS)
Special Fisheries Development Project; and
Processing and Marketing Project among others.
40
The implementation of these projects initially brought about increased fish production but owing to policy shifts and unsustainable implementation, fish supply has declined steadily over the years. Nevertheless, fishing and related occupations remain the mainstay of most rural coastal economics. In these communities, fishing is the occupation of last resort; a situation that prevents rational management and sustainability. Coincidentally, small scale fisheries which include some of the poorest members of our society are also the most neglected groups. It is common knowledge that the level of poverty in these fishing communities is most pathetic and is often compounded by geographic isolation and a lack of social amenities. Left with no alternatives, most fisherfolk feel obliged to exploit these resources irrespective of any consequences to satisfy their basic needs. It is therefore, no surprise that today overfishing is probably the most serious environmental problem on fisheries; causing changes in the composition of fish populations and ultimately entire ecosystems. For these reasons, Mr Chairman, the sustainable development of our fisheries resources has become imperative. It is my considered opinion that this goal can be achieved if we reconcile economic growth with environmental protection and address poverty – induced causes of environmental degradation. The question we need to ask ourselves is: for how long can the current rate of fish utilization continue without causing irreversible damage to the resource base and limiting long – term economic development? At many international fora such as the 20th session of the FAO Committee on fisheries in 1993 and the International Conference on Responsible fishing in 1992, concern have been raised about the overexploitation and economic losses being incurred by world fisheries.

41
It is now widely recognized that over – exploitation undermines fisheries conservation and management efforts, threatens the long – term sustainability of fisheries and harms the contribution of fisheries to food security. These concerns were instrumental in the adoption of five fisheries resolutions at the 49th session of the United Nations General Assembly (UNGA) in 1994. They are:
(i) The continuing use of large – scale pelagic driftnets in
some countries;
(ii) The continuation of the UN Conference on straddling fish stocks and highly migratory fish stocks in 1995;
(iii) The implementation of the 1982 UN Convention on the Law of the Sea;
(iv) Fisheries by-catch and discards; and
(v) Unauthorized fishing in zones of national jurisdiction.
Agriculture in general and fisheries in particular are the sectors for sustainable development because hunger is the most visible manifestation of poverty in any society. Hence, any effort in these sectors is not only a fight against hunger but a necessary ingredient for economic development as well. In Nigeria, fish plays an important part in the diet of many communities and a large number of families earn a living from fishing, fish processing and marketing. As a source of protein, fish and fish products provide 9.68kg of fish per person per year; an equivalent of approximately 49 percent of all animal protein consumed in the country. The importance of fish in the human diet therefore cannot be over – emphasized. Apart from being a cheap source of highly nutritive

42
protein, it also contains other essential nutrients required by the body. The FAO recommends that minimum protein intake by the average person should be 65/day of which 35 should come from animal sources. In our country, per caput intake of protein is only 51.70gm and only 4.0 gm are of animal origin; a sharp contrast with the situation in developed countries where the figures are 90 and 65gm respectively (Sikoki and Otobotekere, 1995). 4.2.2. Contribution to National Economy The contribution of the fisheries sub – sector to the Agricultural Gross Domestic Product, (GDP) is 4.0% (FDF, 2008). Furthermore, the sector is a high foreign exchange earner, generating about USD 38.3 million annually. It also provides direct and indirect employment to 8.23 and 18.27 million Nigerians (table 6). Table 6: Contribution of Fisheries to National economy. Source: FDF, 2008
(i) Contribution to Agricultural GDP (2007) 4.0%
(ii) Total fish Demand 2.66m mt
(iii) Domestic Production 0.62m mt
(iv) Per caput fish consumption 9.68kg/person/yr
(v) Est. Employment, Primary Sector 8.23m
(vi) Est. Employment, Secondary Sector (Male, 7.16m; Female, 19.34m)
18.27m
(vii) Total Import (2007) 0.74m mt
(viii) Total Exports (2007) 0.005m mt
(ix) Value of fish Imports (2007) USD 596.4 million
(x) Value of Exports (2007) USD 38.3 million (xi) Estimated Aquaculture potential 2.5m mt
(xii) Min. Fingerling requirement 4.3 billion
(xiii) Total fingerling supply (all sources) 55.8 million

43
4.2.3. Fish Production in Nigeria Despite its high potential for fish production, the demand for fish in Nigeria is yet to be met through domestic production. The fishing industry in Nigeria comprises both artisanal and industrial or commercial fisheries. The more labour intensive artisanal fishery employs simple gear crafts, and is carried out in coastal, brackish and inland waters. Table 7 below shows fish supply by sector between 1995 and 2007. Although the total landings have increased gradually from 371,053 in 1995 to 615,507 tonnes in 2007, Table 7. The industrial sector has witness a decline 33,479 to 26,193 mt during the same period. In addition, the average catch per trawler has dropped considerably. For example, the average catch per trawler dropped from 170.38 in 1980 to 76.47 mt in 1989 (table 8). From the foregoing, it can be seen that the catch per unit effort (C.P.U.E.) has drastically reduced because when more fish are removed from a body of water than can be replaced, the water body is being overfished (figure 5). This is due to the fact that as effort increases, catches also increase until a point is reached when increase in effort will no longer increase the catch.

43
Table 7: Fish supply by sector (mt) between 1995 and 2007 in Nigeria. Source : FDF, 2008.
Subsector/ Year
1995 1996 1997 1998 1999 2000 2001 2002 2003 2004 2005 2006 2007
Artisanal 320,955 309,200 360,219 433,070 426,736 418,069 433,537 450,965 446,203 434,830 490,594 518,537 504,227
% 86.5 86.9 87.2 89.6 89.0 89.5 89.1 88.1 87.4 85.4 84.7 81.4 81.9
Aquaculture 16,619 19,490 25,265 20,458 21,738 25,720 24,398 30,664 30,677 43,950 56,355 84,533 85,087
% 4.5 5.5 6.0 4.2 4.5 5.5 5.0 6.0 6.0 8.6 9.7 13.3 13.8
Industrial 33,479 27,244 27,703 29,955 31,139 23,309 28,378 30,091 33,882 30,421 32,595 33,778 26,193
% 9.0 7.7 6.7 6.2 6.5 5.0 5.8 5.9 6.6 6.0 5.6 5.3 4.3
Grand Total
371,053
355,934
413,188
483,482
479,663
467,098
436,313
511,720
510,762
509,201
579,544
636,848
615, 507

44
Table 8: Fish Production from inshore fishing and shrimping (mt) from 1980 to 1989 Source: FDF, 1990.
YEAR Total Landing
No. of Trawlers
Average Landing
1980 13,631
80
170.38
81 9,611
81
118.65
82 18,861
86
219.31
83 19,245
120 160.37
84 25,650
133 192.85
85 26,142
163 160.37
86 25,650
250
100.16
87 24,900
252
98.80
88 35,608
372
95.72
89 33,645
440
76.46

45
Table 9: Fish Catch from inshore fishing and shrimping (mt) 1995 – 2007. Source: FDF, 2008.
YEAR INSHORE SHRIMPING
INSHORE FISHING
1995 26,755.0 6,688.0
1996 19,333.0 5,642.7
1997 20,919.2 5,214.2
1998 24,124.1 4,539.8
1999 26,981.0 2,448.5
2000 21,043.7 3,889.5
2001 21,810.5 6,361.0
2002 23,004.50 5,857.6
2003 23,118.31 5,840.08
2004 23,391.45 5,140.66
2005 26,420.03 4,250.90
2006 27,278.71 5,617.06
2007 20,630.14 3,405.16
In the figure 5, the fishing effort; measured by number of fishing vessels at effort “B” is twice that at A and half that at C. The catch at the peak of the yield curve represents the Maximum Sustainable Yield (MSY). A level of fishing higher than that at point “B” is

46
considered as overflowing but at point “D” the stock would go into extinction. Unfortunately, most fishermen in our country, unaware of these basic principles, employ obnoxious and irrational/illegal practices to maximize their catch. Some of these practices are:
24,000
9,000
7,000
Fishing effort
Fig. 5: A typical fish production function for a fish stock.
(i) Use of Poisonous Chemicals: These include – Gamalin 20 Adrex 40 and Didimac 25. These poisons when introduced into a water body are not selective in their actions - killing fish, shellfish and plankton. The poisons
C
B
Catc
h i
n t
on
nes
A B C D

47
also pollute the water and contaminate fish muscles making them unsafe for human consumption.
(ii) Ichthyotoxic plants: These are plants which contain chemicals that can narcotize or kill fish and shellfish. Their roots, leaves or bark are grinded up with tobacco or lime to form a paste which is introduced into the water body. Hot pepper is also used with clay in some cases to produce the above effects. Ichthyotoxic plants commonly used include:
Accacia pen - leaves or bark
Baillonella toxisperma - leaves
Mundulea sericea - - do –
Tephrosia vogelli - - do –
Tetrapleura tetraptera - - do – (iii) Dynamites, Hand Grenades and Bombs: These
explosives also narcotize fish making them easy to capture by hand, net or spear. They are especially destructive when used in areas where fish breed as they kill both the adults and young.
(iv) Castnets with Small Meshes: These nets with
stretched mesh size less than 25mm catch both the old and young of several fish species such as the croakers, Pseudotolithus spp and Polydactylus quadrifilis in river mouths. It is recommended that the ideal mesh size for castnets should be 40mm stretched but many fisherfolk use much smaller mesh sizes.
(v) Beach Seines: These are commonly used in lagoons and creeks where they cause great havoc to immature

48
fishes on account of their small mesh sizes – typically 10 – 20 mm. The recommend mesh sizes are 44 and 51mm for cod-end and wings respectively.
(vi) Stow Nets: These are also commonly used in lagoons and and estuaries. The conical bags made from multifilament nylon fibres having mesh sizes of 10 to 30mm with the cod – end mesh size measuring 10mm. They are particularly efficient in catching juvenile shrimps.
(vii) Traps: Traps are commonly used in fresh water
bodies. They are equipped with non-return values which capture all sizes of fish including the immature ones.
(viii) Trawl Nets: Some fisherfolks employ trawl nets with cod-end mesh size smaller than the legal cod-end mesh size of 44mm for shrimping. These Nets catch large numbers of immature fish which some estimates put at about 45 percent of the total catch. Such practices are highly destructive and are capable of destroying the inshore demersal trawl fishery. Unfortunately, no laws exist in Nigeria for the prohibition of the landing of juveline fish.
(ix) Poaching: Illegal fishing by foreign vessels in
Nigerian waters is a serious problem making management and conservation of marine resources in our waters extremely difficult.
Mr Chairman, distinguished ladies and gentlemen, there is general consensus today that:

49
Knowledge of the state of fish stocks; and
Knowledge of the aquatic environment or fundamental to rational management of fisheries resources as advocated by the World Summit on Sustainable Development in 2002. Further more, poor sector governance is a primary cause of the crisis in world fisheries in general and Nigerian fisheries in particular.
Policies and institutional frameworks are often deficient because overfishing and economic losses generate stymied fiscal measures constrain financing of compliance measures and undermine enforcement of regulations. Awareness of the social and economic drivers of overfishing and aquatic environmental degradation is also required to design solutions. The application of solutions similarly requires building stakeholder knowledge, creating awareness and reaching consensus on best practices and approvals. Finally, it is generally believed that capture fisheries cannot meet future demands for fish and major expansion of aquaculture production is needed to fill the gap between supply and demand. I recognized these facts early in my academic career and my research activities have been directed at these areas right from my doctoral Thesis which examined the hormonal and environmental control of reproductive cycling in the common carp, Cyprinus carpio. Subsequently, I and my collaborating scientists/students directed our attention at examining exploitation patterns of the living aquatic resources and their compatibility with ecosystem integrity and conservation measures
50
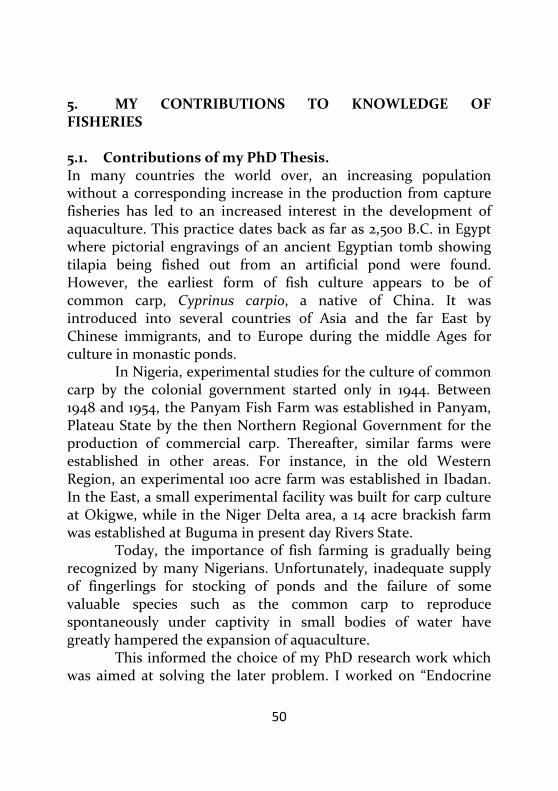
5. MY CONTRIBUTIONS TO KNOWLEDGE OF FISHERIES
5.1. Contributions of my PhD Thesis. In many countries the world over, an increasing population without a corresponding increase in the production from capture fisheries has led to an increased interest in the development of aquaculture. This practice dates back as far as 2,500 B.C. in Egypt where pictorial engravings of an ancient Egyptian tomb showing tilapia being fished out from an artificial pond were found. However, the earliest form of fish culture appears to be of common carp, Cyprinus carpio, a native of China. It was introduced into several countries of Asia and the far East by Chinese immigrants, and to Europe during the middle Ages for culture in monastic ponds. In Nigeria, experimental studies for the culture of common carp by the colonial government started only in 1944. Between 1948 and 1954, the Panyam Fish Farm was established in Panyam, Plateau State by the then Northern Regional Government for the production of commercial carp. Thereafter, similar farms were established in other areas. For instance, in the old Western Region, an experimental 100 acre farm was established in Ibadan. In the East, a small experimental facility was built for carp culture at Okigwe, while in the Niger Delta area, a 14 acre brackish farm was established at Buguma in present day Rivers State. Today, the importance of fish farming is gradually being recognized by many Nigerians. Unfortunately, inadequate supply of fingerlings for stocking of ponds and the failure of some valuable species such as the common carp to reproduce spontaneously under captivity in small bodies of water have greatly hampered the expansion of aquaculture. This informed the choice of my PhD research work which was aimed at solving the later problem. I worked on “Endocrine
51
and Environmental Control of Reproductive Cycling in the common carp, Cyprinus carpio and published four papers from it. In the first paper, we demonstrated that under confinement, there were no simple relationships between plasma sex steroid hormone concentrations and the activity of hepatic microsomal UDP-glucuronyltransferase activity in the common carp. However, injection of pituitary extract induced final gonadal maturation and transient elevation of (within 24 hours) of both plasma sex steroid concentrations and UDPGT activity (Sikoki et al, 1989). In rats, pregnancy is associated with impaired hepatic xenobiotic biotransformation and biliary excretion and inhibited biotransformation occurred during gonadal maturation in rainbow trout (Curtis, 1983). In the second paper, we examined the relationship between reproductive state and UDP-glucuronic transferase activity. It was found that in either sex, gonadal development was facilitated by elevated plasma sex steroids and reduced hepatic UDP-GT activity (Sikoki et al, 1990). The correlation between these parameters was stronger in male specimens than females. Endogenous periodicities of physiological processes are said to be responsible in part for seasonal reproductive patterns (Sundararaj, 1978). Some proximate environmental factors that act as cues for the approaching favourable season for reproduction impinge on the exteroceptors, and through them the central nervous system, pituitary and the gonads are affected. Thus, in the males, during the months of March and April when the majority of the fish were in mid recrudescence, UDP-GT activity levels were relatively low. The pattern was similar in females except that the activity levels were relatively lower. The third paper reported on the role of environmental factors on gonadal recrudescence maturation and spawning. We discovered that both gonadal and breeding activity in the common carp were closely attuned to changes in environmental variables (Sikoki and

52
Ejike, 1997). As temperature and mean hours of sunshine increased, a rise in spermatogenic activity was observed. Spawning occurred in March as the temperature of the water attained its maximum value of 24.750C, and the rains commenced. During the second breeding period in July, maximum temperature was still sustained but rainfall values had just attained their maximum level. Although the roles of temperature and sunshine in reproductive cycling is relatively clear, the influence of rainfall on peak reproductive activity is not so clear. However, Swingle (1965) suggested that the mechanism by which rainfall induces spawning may be related to the dilution of certain inhibitory factors in the water.
The final paper from my PhD thesis was an invited paper presented to the Annual Meeting of the American Society of Toxicology (New Orleans, LA) 1986. It examined the mechanisms by which hepatic UDP-Glucuronyl Tranferase (UDP-GT) is inhibited during gonadal maturation. We found inhibition of the activity of this enzyme in the presence of elevated plasma sex steroid concentrations (Sikoki et. al, 1986).
Taken together, our work showed that biotransformation activity in the liver varies not only between the seasons (environment) but with the reproductive status of the animal. While the seasonal oscillations act as time signal in fish for reproduction, the biotransformation enzymes carryout reactions which control the levels of many endogenous compounds including the sex steroids.
5.2. Post Doctoral Contributions Upon my return to the country, I identified three major areas of research in respect of fisheries production and stock management/conservation. These are:
Enhancement of Aquacultural Production;
Environmental Pollution and Degradation; and

53
Assessment of fish stocks.
Consequently, most of my research efforts in collaboration with my research associates and PhD students have been directed at these areas.
5.2.1. Enhancement of Aquacultural Production Current aquacultural practices in Nigeria emphasize the catfishes and tilapias. However, while catfishes do not breed all year round and so fingerling supply is largely restricted to the rainy season months, tilapia has the opposite problem of uncontrolled reproduction; leading to stunted growth. In order to solve these problems, we designed research projects aimed at:
(i) ensuring year-round production of catfish
fingerlings; (ii) controlling uncontrolled reproduction of tilapia
using anabolic hormones; (iii) enhancement of growth through breeding
experiments; and (iv) studies on the biology of potential aquacultural fish
species. 5.2.1.1. Year-round Production of Catfish Fingerlings. The catfishes, Claria gariepinus and Heterobranchus spp are the most popular candidates for aquaculture today in Nigeria. Unfortunately, inadequate supply on account of their seasonal breeding pattern has severely hampered their culture. My PhD student and I, worked on this problem using a combination of nutritional, environmental manipulation and brood stock management practices to produce off-season fingerlings. In our nutrition experiments using Claria gariepinus, we demonstrated that feeding/maintaining the broodstock on a high protein diet and mimicking the environmental conditions

54
prevalent during their breeding season under controlled conditions ensured natural spawning of the fish off season (Ibim and Sikoki, 2009). The spawning act can be further enhanced when pituitary extract is administered to ripe females. Unfortunately, this practice is not standardized and various fish farmers hitherto administered the extract half hazardly. Again, my research associates and I worked on the standardization of the practice and reported our results at the Triennial Conference of the World Aquaculture Society in Buena Vista, Florida, USA (Omozusi et al., 2001). Our work showed that a priming dose of the extract, half the decisive dose given 12 hours prior gave the best results. 5.2.1.2. Use of Anabolic Hormones for Production of All-male Tilapia and Growth Enhancement in Catfish. The tilapia, Oreochromis niloticus has a high fecundity; breeding at least once every 4 to 6 weeks and a high degree of parental care which ensures survival of the progeny. This efficiency of reproduction precipitates overcrowding, competition for food, stunted growth and ultimately poor yield. In our studies using two strains, red and grey tilapia, we were able to achieve 97% and 96% males respectively through feeding the fish with the androgen, 1700 – methyltestosterone (Ekwu & Sikoki, 2001). This work has therefore eliminated the problem of undesirable reproduction, thereby controlling over – population and ultimately increased yield. In a similar work, Sikoki and Eneh (1993) used the same adrogenic hormone, 1700-methyltestosterone to enhance growth and food utilization in the African catfish, Claria gariepinus. Methyl-testosterone and other anabolic hormones generally speed up metabolic reactions and increase growth rate and feed conversion efficiency in treated fish.

55
We have also used non – conventional feeds such as Mucuna spp (Sikoki and Komi, 2012) with a view to sparing animal protein for human consumption and reduce the cost of feeding fish. The results obtained were quite encouraging, as the growth rates in the test and control groups were comparable.
5.2.1.3. Breeding Experiments for Selection of Growth Enhancement Traits. Through genetic selection, useful traits in a fish can be selected for either to enhance growth, general appearance or hardness. We therefore first determined sources of variation in growth parameters in Tilapia guineensis (table 10). Using this information we were able to demonstrate that heritability of total length (0.35) was moderate and hence can be improved through mass selection experiments (Sikoki and Uka, 2012). Body weight however, had a very low heritability value (0.03) and so cannot be improved through mass selection.
As a follow up of the above study, we looked at the effects of salinity of larval dimensions of T. guineensis and found that the heaviest and largest larvae were hatched in 12 ppt saline water. This finding is of significant practical importance as it can be used for the efficient and economic production of T. guineensis seeds. 5.2.1.4. Studies on Environmental Contamination and Degradation. When I transferred my services to the University of Port Harcourt, my interest shifted to issues relating to fisheries depletion on account of industrial activities, particularly oil. Consequently, my PhD students and I devoted considerable attention to:
direct effects of oil spills;
the effects of drilling muds and dredge spoils;
the effects of dispersants on fish communities; and

56
exploration activities involving dredging.
Table 10: Sources of variation in growth parameters of T. guineensis.
Total Length Body Weight
Parameter/Components Value % Value %
Genetic Variance (VG) 0.655 55.3 0.023 3.3
Environmental Variance (VE) 0.53 44.7 0.67 96.7
Genetic effect P<0.01 P<0.05
Variance due to Dam (VD) 0.41 62.6 0.012 52.2
Variance due to Sire (VS) 0.21 37.4 0.011 47.8
Total variance (VT) 1.185 100 0.693 100
h2 (Dam) 0.55 55 0.03 3.0
h2 (Sire) 0.69 69 0.04 4.0
H2 0.35 35 0.03 3.0
The direct effects of oil spills are largely known but details of their effects on various stages of fish, bioaccumulation patterns and pathology have been the thrust of our work. Sikoki and Enajekpo, (2000) found that the red blood cell count (RBC) and haematocrit values of oil exposed fish were significantly lower than those of control fish. Furthermore, moisture content and percentage protein of the carcasses of exposed fish were also significantly lower. However, the adverse effects of dredge spoils and drilling fluids are even of greater concern as these are produced/used regularly in oil exploitation activities. Before now, oil based drilling fluids were commonly used but they were replaced with

57
water based ones which the oil companies claimed were not harmful to the environment. Vincent – Akpu, my former PhD student and I investigated this claim by the oil companies and found that at high concentrations, the drilling fluid – XP – 07 caused fish mortality and damaged their gills (Vincent – Akpu et. al, 2010). The use of chemicals for dispersing spilled oil is another widely used method which has not been properly investigated. We therefore set out to determine the environmental effects of a dispersant, Goldcrew commonly employed in the Niger Delta. We discovered that this dispersant increased the toxicity of Bonny light crude oil by as much as 57 times, thereby causing increased fish kills. In addition, fish exposed to the dispersant showed varying degrees of histopathological changes in their gills, liver, muscles and brain tissues (Sikoki and Lelei, 2012). Dredging of river basins is another widespread practice employed by oil companies and others either to enable them to transport materials or for the mining of sand. My PhD student and I studied the impact of dredging on the fisheries and water qualities variables in the upper Nun River between 2009 and 2011. Aside the obvious changes this activity caused on the hydrodynamics of the river – flow regime and depth profile, it resulted in increased turbidity and the values of NO3, NO2, SO4
2- and BOD5. With respect to the fisheries only 23 species were recovered from the dredged site as against 29 from the undredged area. In addition, the growth patterns and condition factors of fish species were generally lower than those from the undredged (Sikoki and Seiyaboh, Unpublished). Sikoki and Babatunde (2010) reviewed trace metal contamination of marine resources following dredging of the Warri River in Delta State. The data revealed that dredging caused several hundred fold increase in Lead, Zinc, Copper, Iron,

58
Chromium, Maganese and Cadmium concentrations in the water. In the biota, both fin and shellfish tissues accumulated considerable amounts of the above metals with values higher than FEPA limits. 5.2.1.5. Limnological and Stock Assessment Studies. I have devoted the greater part of my academic career to studies on the limnological characteristics and assessment of fish stocks in various water bodies. This is because knowledge of the state of fish stocks and the aquatic environment is fundamental to sustainable exploitation of a fishery. The over – exploitation of a particular fish species or particular size group will lead to serious depletion of stock. On the other hand, under – exploitation may cause depletion of food organisms due to high population density, resulting in migration of a large number of individuals to other suitable sites. Thus, for management purposes, a fish biologist is concerned with two major factors, viz:
(i) the size of the stock, that is the number of
individuals in a given area; and (ii) assessment of optimal fishing activity, that is the
maximum number of fishes that can be harvested without affecting the population size.
Given the dearth of information in the two factors in many
of our numerous water bodies, I secured a research grant from the
Dutch government (International Cooperation) in 1991 to
undertake an assessment of Shiroro lake, in Niger State. Later in
1997, I secured World Bank assistance for the same purpose in the
Niger Delta Basin. I was appointed the same year as the Joint
National Coordinator, South of the Nationally Coordinated

59
Research Project of the National Agricultural Research Project
(NARP).
In the course of these studies, I have undertaken
Limnological/stock assessment exercises in the following 17 water
bodies nation – wide and elsewhere.
(i) Shiroro Lake, Niger State, Nigeria.
(ii) River Jamieson, Delta State, Nigeria.
(iii) Burrow Pits, Rivers State, Nigeria.
(iv) Brass River Estuary, Bayelsa State.
(v) Umuoseriche Lake, Abia State.
(vi) Onu-Iyi Ukwu Stream, Imo State.
(vii) Oguta Lake, Imo State (on-going)
(viii) Andoni River, Rivers State.
(ix) New Calabar River, Rivers State.
(x) Nun River, Bayelsa State.
(xi) Orashi River, Rivers State (on-going)
(xii) Bonny River Estuary, Rivers State.
(xiii) Epie Creek flood plains, Bayelsa State.
(xiv) Cross River Estuary, Cross River State.
(xv) Imo River, Imo State.
(xvi) Andoni Mud flats, Rivers State.
(xvii) Lake Michigan, USA.
A general feature of most of the lakes and rivers that we
have studied is their high productivity but most of them face
increasing problems of pollution, dams that restrict fish spawning
migrations and poor management (Sikoki and Veen, 2003; Ekwu
and Sikoki, 2010; Sikoki et. al, 2009. Yakubu et. al, 1998). Figure 6

60
shows water quality parameters in Shiroro Lake with desirable
levels for fish production in the tropics (Sikoki and Veen, 2003).
Similarly our studies on plankton densities showed ranges
of 67 to 26,000 org/L for phytoplank and 67–733 org/L for
zooplankton in lower reaches of the Nun River (Yakubu et. al,
1998).
In the Cross River Estuary, Ekwu and Sikoki (2010)
reported temporal variations but rated the system as being high in
primary productivity.

61
Fig 6: Comparison of some water quality parameters in Shiroro
Lake with desirable levels for fish production in tropical lakes.
1. TOTAL HARDNESS (mg/L CaCO3)
Shiroro Lake Desirable Range
2. ALKALINITY (mg/L HCO3)
Shiroro Lake
Desirable Range –
3. DISSOLVED OXYGEN (mg/L) Shiroro Lake
Desirable range
4. CONDUCTIVITY (µ mhom/cm)
Shiroro Lake Desirable range
5. TEMPERATURE (0C)
Shiroro Lake
Desirable range
6. NITRATE NITROGEN
Shiroro Lake
Desirable range
7. PHOSPHATE – PHOSPHORUS (mg/L)
Shiroro Lake Desirable range
8. pH
Shiroro Lake
Desirable range
S - 30
20 - 30
22 - 83
20 - 300
22 - 120
5 and above
3.8 – 10.0
Variable
20.1 – 34.0
25 – 32
9.0 – 86.0
9.8 – 49
5 - 212
3.2 – 630
5.9 - 7.0
6.5 - 90

62
Unfortunately, the results of our studies on the fisheries of the
various water bodies indicated over–exploitation and consequent
stock depletion. We provide below summary of our stock
assessment results.
(i) Shiroro Lake: Data regarding the estimated total
standing crop of fish using the Morpho – Edaphic
Index (MEI) approach revealed that some 293 mt of
fish are produced in the lake each year. The total
fish catch per year based on a survey of
fishermen/canoes and the average fish caught per
fisherman/canoe gave approximately 298 mt.
Theoretically therefore, it can be concluded that all the fish
produced in the lake are taken each year (Sikoki et. al; 1997).
However, this is not the case as fish migrate from the numerous
tributaries flowing into the lake. However, the results clearly
indicate that the fish populations are severely over exploited.
(ii) The Nun and the Andoni River Systems: Our
work in these two systems emphasized natural and
fishing mortality, and exploitation ratios. The
exploitation ration (Eopt) assesses whether or not a
stock is overfished on the assumption that the
optimal value of E is 0.5. The use of this value itself
is based on the assumption that the sustainable
yield is optimized when F (fishing mortality) = m
(Natural mortality). In the Nun River, we found
three species, Synodontis clarias (0.54), sphraena

63
barracuda (0.54) and Schilbe mystus (0.67)
exceeding the optimal value for sustainable yield
(Sikoki and Abowei, 2002). These populations
therefore stand the risk of over exploitation if
urgent measures are not taken to protect the
fishery (Table 11).
Data from our work in Andoni River presented in table 12 show a much more worrisome picture. Out of eleven species we evaluated in this River, a total of five showed exploitation rates exceeding the optimal for sustainable yield (Francis et. al; 2007). When the values were expressed as percentages, death due to fishing operations ranged between 46 and 68% (8 fishes) while three fishes recorded values between 20 and 30 percent. Table 11: Estimated exploitation rates and ratios from total
natural and fishing mortality data in the Nun River. Fish Species Z(yr -1) M(yr -
1) F(yr -1) E U(yr -
1) E%
1. Clarotes laticeps 1.2 0.87 0.33 0.27 0.29 27
2. Alestes baremose 1.6 1.43 0.17 0.11 0.04 11
3. Alestes dentex 1.1 0.63 0.49 0.43 0.43 43
4. Distichodus rostratus 1.5 0.97 0.52 0.35 0.19 35
5. Synodontis schall 2.1 1.82 0.30 0.14 0.28 14
6. Synodontis clarias 1.2 0.57 0.67 0.54 0.29 54 *
7. Synodontis membranaceus
1.5 1.28 0.22 0.15 0.09 15
8. Grathonemus tamandua 1.3 0.93 0.40 0.30 0.31 30
9. Schilbe mystus 1.4 0.55 0.87 0.67 0.58 67 *

64
10. Sphyraena barracuda 1.6 0.79 0.81 0.54 0.69 54 *
Key: Z = Total mortality; m = Natural mortality,
E = Exploitation Ratio; U = Rate of Exploitation
F = Fishing mortality; E% = Exploitation Ratio
Table 12: Exploitation ratios of fish species from the Andoni River System in 1999.
S/N Fish Species Exploitation Ratio (E)
Exploitation rate %
1. Chrysicthys nigrodigitatus
0.250 25.00
2. Ethmalosa fimbriata 0.524 52.40
3. Eucinostomus melanopterus
0.459 46.00
4. Galeoides decadactylus
0.200 20.00
5. Uisha africana 0.554 55.40
6. Liza grandisquamis 0.456 46.00
7. Lutjanus goreensis 0.514 51.40
8. Pamadasys jubelini 0.529 52.90
9. Pseudotolithus elongatus
0.681 * 68.14
10. Sarotherodon melanotheron
0.315 32.00
11. Tilapia guinensis 0.482 48.20

65
(iii) The Brass and Bonny Estuaries: These two estuaries located in Bayelsa and Rivers State respectively are centres of high anthropogenic activities including oil and gas operations and fishing. In the Brass estuary, Sikoki and Hart (1999) carried out a frame survey of fishing communities and fish stock assessment. We recorded 22 species of fish belonging to eleven families.
The estimated mean catch per boat was 160.40kg of fish with clupeids accounting for 52.62% of the catch. The estimated annual fish production was 610.93 mt or 1.19 metric tons per km2. The fisherman density was 9 persons per square kilometer; nearly five times the recommended density of two persons per square kilometer. This situation clearly indicates that the area is being over – exploited. Although our stock assessment work at the Bonny estuary is ongoing, we studied aspects of the reproductive Biology of Mugil cephalus. The fish attained first sexual maturity at 17.0cm TL at age 0.5 yr. The maturation ratios were: males (0.697) and females (0.646). These values indicate that the fish is not stunted in this estuary as low values are indicative of stunted growth. Consequently, if well managed and exploited, this estuary can support sustainable fisheries.
(iv) Epie Creek flood plains and River Jamieson: In
these systems, we elucidated the composition and aspects of the biology of selected fish species of commercial importance.

66
At the Epie Creek flood plain, we recovered twenty six fish families containing 63 species from the creek, 43 from a lake in the flood plains and 36 from the swamps. A significant contribution from this study was the discovery for the first time in the Niger Delta, the presence of the catfish, Clarias albopunctatus, sub genus Clarias (Clariodes), (Tengels, 1986) (Elakhame and Sikoki, 1996). Similarly, at the River Jamieson, we recovered fifty five species (Ikomi and Sikoki, 1998). Our work here also elucidated aspects of the biology and ecology of Brycinus nurse (Ikomi and Sikoki, 2001) Brycinus nurse (Ikomi and Sikoki, 2001) and Brycinus longipimis (Ikomi and Sikoki, 2003).
(v) Umuoseriche Lake and Onu – Iyi Ukwu Stream:
Our contributions in these two systems were in the areas of the biology of selected fish species and fish communities respectively.
At the Umuoseriche Lake, where we studied the biology of Labeo senegalensis, we obtained three age groups – 0+, 1+ and 2+ with length–at–relative age of 195, 265 and and 310mm respectively. (Anene and Sikoki, 1996). These results were at variance with data from kainji lake where Blake and Blake (1978) reported six age groups. The implication of these findings is that this species does not live as long as their counterparts in Kainji Lake. In the Onu – Iyi Ukwu stream, we produced a checklist of fish assemblages (Sikoki et. al; 2009) and the spatial and temporal variation of physico-chemical variables of the water (Sikoki and Anyanwu, 2010).
(vi) Imo New Calabar and Cross Rivers: In these river and systems, our major contributions have been in

67
areas of establishing seasonal variations in plankton, benthic communities and physico-chemical variables. In the Imo River, Sikoki and Zabbey (2006) recorded poor benthic community with only 14 representative species and low margalef diversity values of 0.362 to 1.086.
Similarly, in the Cross River system, we recorded substantial algal blooms during the dry season months which coincided with massive mortality of Heterotis niloticus (Ekwu and Sikoki, 2010). Ekeh and Sikoki (2002 and 2004) reported on the status and seasonal variability of phytoplankton and physico-chemical parameters in the New Calabar River.
(vii) Lake Michigan: My work in this lake was
undertaken during my MSc programme in the late 1970s and it is highly significant in my academic career as it introduced me into the subject of environmental studies. We investigated the effects of depth on the temporal and spatial distribution of a burrowing and deposit – feeding macrobenthic invertebrate, Pontoporeia hoyi. Among and amphipods, it believed to be exceptional because it migrates extensively into the pelagic zone at night and is stenothermally restricted to only cold, deep and oligotrophic temperate lakes.
We discovered that this animal was most abundant at the interval 30 – 40m depth interval (Sikoki and Lagler, 1986). A possible explanation for its low densities at shallow waters (10 – 20m) in the lake is probably due to proximity to sources of organic enrichment.
68
6.0 CURRENT RESEARCH My current research is centered on:
evaluation of pollution trends in the coastal waters of Nigeria;
assessment of aquatic ecosystem integrity in the Niger Delta basin; and
studies on utilization of nuisance aquatic resources for wealth creation.
For the evaluation of pollution trends in the coastal waters, we secured a grant from the INTERNATIONAL ATOMIC ENERGY AGENCY, IAEA for the deployment of nuclear techniques for the assessment of contamination of coastal waters. I am also the National Coordinator of this project, RAF/7008 and 7009 in Nigeria. Under it we have four aquatic monitoring stations along the Nigerian Coastline as follows:
(i) South – Central I Station – Centre for Marine
Pollution Monitoring and Seafood Safety University of Port Harcourt.
(ii) South – Central II Station – Koluama, Bayelsa State.
(iii) South – West Station – Nigerian Institute of Oceanography and Marine Research, (NIOMR), Lagos.
(iv) South – East Station – Institute of Oceanography, University of Calabar, Calabar.
At the Centre for Marine Pollution Monitoring and Seafood
Safety at this university where I am also the Director, we are
currently undertaking the following activities:

69
Reconstruction of pollution data dating back more than 70
years;
taking of pollution stocks of radionuclides, trace metals,
organochlorines and nutrients; and
determination and mapping of pollution “hot-spots” in the
coastal waters.
We have already trained two of my PhD students each in
Radiometry and Sediment core dating in off-shore institutions in
Germany, Brazil, Morocco and Egypt in trace metal and
organochlorine pollution analysis in Egypt and Spain under the
IAEA – FGN Projects RAF/7008 and 7009.
6.1 Pollution Trends
Following these developments, we now have preliminary
data on radioactivity concentrations in the sediment and selected
seafoods from the Niger Delta basin.
In the sediment of the Bonny estuary, radioactivity levels
ranged from below detection levels to 812 Bq kg-1 for 238U; 370 to
849 Bq Kg-1 for 232Th; 175 to 484 Bq Kg-1 for 226Ra; 1032 to 9800 Bq
Kg-1 for 40k and <39 Bq Kg-1 to 67 Bq kg-1 for 137Cs. The 226Ra/238U
ratio was less than one in all the locations, indicating that there
were anthropogenic inputs of 238U (Babatunde and Sikoki, 2012).
Furthermore, the activity levels of radionuclides we measured
were higher than those reported elsewhere in the Niger Delta and
global averages.
The sediment ages determined through 210Pb Constant Rate of
Supply (CRS) and Constant Initial Concentration models revealed
that average annual sediment mass accumulation rate in the

70
Bonny estuary was influenced by environmental perturbations in
1971, 1975, 1979, 1987, 1995, 2003, 2005 and 2008 Fig 7. These
periods correspond to increased oil and urbanization activities in
the Niger Delta.
The average sedimentation rate in the Bonny estuary was
0.16cm yr-1. However, while sedimentation rate increased by only 5
percent between 1952 and 1957, it increased by 40 percent between
2006 and 2008. It is predicted that sediment rates as high as 4.226
cm yr-1 are likely by 2020 resulting in complete reclamation of
shallow areas in the next 100 years (Babatunde & Sikoki, 2012) Fig
7.
Our data also showed steady increases in pH values and
heavy metal contamination of the sediment of Bonny estuary from
1971 with peak values occurring in 1979, 1987, 1995, 2005 and 2008
a period corresponding to heightened oil and gas production and
urbanization in the Niger Delta Fig 8.
We have also analysed organic matter (OM) content in the
inter-layers of the sediment profile in the Bonny estuary. Two
peaks corresponding to increased OM in 1940 and 1971 as a result
of high decompositional activities were observed. The 1940 peak
may have been as a result of organic matter input from early
developmental activities in the Niger Delta area and the second
peak in 1971 corresponds to the oil boom period which may have
resulted to increased input of organic matter from oil production
activities (Omos and Sikoki, 2012).

71
Fig. 7: Sediment accumulation rates and sedimentation rates in
the Bonny estuary of the last 66 years.
2008
1978
1987
1971 1969
2005
1942
1955: 0.0359
1950: 0.0341 5%
2008: 0.4427
2006: 0.2656
39.97%

72
Fig. 8: Heavy metals profile and pH of core sample from Bonny estuary
over 74 years.
1971
1971

73
6.1.1 Seafood Safety
Radioactive doses received by humans from consuming fish
showed that highest and least effective doses of 1757µSv yr-1 and
656 µSv yr-1 can be delivered by the water snail, Ergeria radiata and
macrobrachium spp (shrimp) respectively. These doses are higher
than those recommended as safe by the ICRP and UNSCEAR
(Babatunde and Sikoki, 2012) Table 13.
Table 13: Effective dose to the adult public due to consumption of selected seafood from the Bonny estuary.
Samples Common
name Consumption
rate (kg y-1)
% contribution
by seafood
Effective
dose (μSv y-1)
Mollusc
Lower limit
Upper limit
T.fuscatus var.radula periwinkle 25 12.1 744 1203
T.fuscatus var.fuscatus periwinkle 25 12.8 772 1266
Ergeria radiata clam 25 17.9 1113 1787
Thais sp dog whelk 25 10.5 661 1085
G. gasar oyster 25 9.3 579 927
Crustaceans
6.2
Macrobrachium sp shrimp 25 9.2 431 656
Penaeus notialis cray fish 25 6.6 571 947
Portonus sp crab 25 15.4 431 691
Fin fish
Ethmalosa fimbriata bonga fish 25 28.3±1.5 845 1532

74
6.2 Aquatic Ecosystem Integrity (Health) This study is born out of the realization that 48 percent of fish
species in the IUCN Red List are freshwater inhabitants. The
continued degradation therefore and persisting claims by fishers
of declining catches informed the work.
Consequently, my research associate, Mr Osunkpe and I
have designed a project to evaluate the ecological integrity of the
Lower Orashi River employing bioassessment techniques. It is
hoped that the results of the study would empirically determine
the claims of environmental in this and other water bodies in the
Niger Delta.
6.2.1 Utilization of Nuisance Aquatic Resources for Wealth
Creation.
Water hyacinth, Eichhornia crassipes is a free floating aquatic that
constitutes a nuisance to fishing and transportation activities in
many river communities. Due to its high growth rate, the plant
outpaces all efforts directed at containing it.
Consequently, my research associates and I have designed
a programme for utilizing it to produce crafts and furniture. Our
major research effort in this regard concerns efficient and cost
effective means of harvesting and processing the plant. We have
already made an assortment of crafts from the plant and are
exploring ways of commercializing it for youth empowerment
through job creation.

75
7 FUTURE RESEARCH
Our plans for the future include:
the development of a web-based GEORAD for the
archiving of pollution stocks; and
the establishment of a Coastal Resources Centre at the
University of Port Harcourt.
The Nigerian Information Technology Development Centre
has shown interest in the GEORAD project and we have already
submitted a proposal to it for funding.
With regard to the Coastal Resource Centre, the National
Action Plan (NAP) Committee of the Guinea Current Large Marine
Ecosystem Project has invited us to submit Concept Notes. The
main objectives of this project are to establish a Centre that would
continuously monitor coastal resource status, identify possible
marine Protection Areas (MPAs) and establish a Coastal Resource
Park for the benefit of host communities.
8 RECOMMENDATIONS
The key to a healthy fisheries sector is establishing good
fisheries governance which involves:
Control over fishing fleets;
Enforcing limits on catches;
Stakeholder participation;
Technology transfer; and
Community awareness.
At a cross – sector level, it also involves the promotion of economic diversification, and alternative livelihoods for fishers and fishing communities to reduce pressure on over-exploited

76
resources. Without limiting access, the economic rents and benefits from a fishery would be dissipated among increasing numbers of fishers which would lead to increase in fishing effort and result in increased resource depletion.
Furthermore, there is need to protect inshore and coastal fisheries on which the poor and subsistence fisher depend. There is also the need to eliminate subsidies which contribute to over – capacity and subsequent depletion of fish stocks. Based on the above, the following specific recommendations are made.
8.2 Fisheries monitoring, Control and Surveillance. Appropriate monitoring, control and surveillance are necessary for effective fisheries conservation and management. Such programmes should ensure that government policies and laws are implemented, and appropriate enforcement measures taken to ensure compliance. 8.3 Protection of Fish Stocks from Environmental Degradation. There is need for stricter monitoring of pollution, protection of nursery and feeding grounds, and general habitat improvement schemes. 8.4 Adoption of Traditional Approaches to Fisheries Conservation and Management. In many traditional communities, communal control of fishery resources with a wide range of conservation and management oriented measures are practiced. Considering the mixed results that have accompanied the introduction of other measures, it is opined that these traditional approaches hold greater promise for voluntary regulation and sustainable exploitation of fisheries resources.

77
It is therefore suggested that government should transfer the custody of fisheries resources to indigenous communities through the insurance of a special permit which would allow the affected community to allocate fishing rights to its members for a fee during designated seasons.
8.5 Allocation of Resources by Government. In order to stem the rapid depletion of fishery resources, it would be necessary in some situations for government intervention to allocate the resources. However, one possible fallout from such an approach would be the fisher who would be displaced. Some developing countries have successfully adapted compensation schemes to assist such fishers but in the long term, such a scheme would require programmes that would provide alternative employment opportunities for fishers.
8.6 Reduction of Waste. On a world – wide basis, only about 20 percent of fish caught is lost due to spoilage and poor handling practices. In Nigeria, some estimates indicate up to 50 percent loss due to these factors. Suggested strategies to reduce losses include:
research, education and improved extension services in post-harvest technology; and
introduction of more practical and economic post-harvest technologies for artisanal fishers.
8.7 Introduction of Value added Products Adding value to fishery products intended for export purposes have the potential of creating employment and earning more foreign exchange. These measures would impact positively on protecting fishery resources.

78
8.8 Enhancement of Extension Services. Extension services are severely limited in the Agricultural sector in general. Consequently, extension workers are not only poorly paid but transportation facilities are also grossly inadequate. In Asia, where extension services are said to be most successful, it is observed that technical services available and educational standards are generally high (FAO, 1995). The provision therefore of a special revolving fund to ensure basic extension programmes is highly recommended.
9.0 CONCLUSIONS Mr. Chairman, distinguished guests, Ladies and gentlemen, I have spent the last 90 minutes or so describing my modest contributions to fisheries research in Nigeria which informed the University of Port Harcourt to elevate me to the rank of Professor in Fishery Biology back in 2001. I am indeed profoundly grateful to the authorities of the University for this honour. However, let me conclude by saying that the recognition of the concept of exhaustibility was not the direct outcome of either theoretical or scientific investigations. Instead, they represent the forced acceptance of new ideas after established ones had collapsed. Finally, fisheries Biologists and managers should see themselves as evaluators of knowledge from diverse disciplines and sources including
Sociology;
Economics;
Politicians; and
Interest groups/individuals and adopt an integrated approach to fisheries management/conservation practices.
THANK YOU

79
REFERENCES
A. Francis, F. D. Sikoki and E. J. Ansa, 2007. Exploitation of fishes from the Andoni River System, Niger Delta, Nigeria and conservation strategies. Journal of Fisheries International. 2(1):17-21.
A. Uka and F.D. Sikoki, 2011. Effects of salinity on the reproduction of Tilapia guineensis in the Niger Delta, Nigeria. J. Aqua Sciences (26 (1) : 43 – 48.
A. Uka, F.D. Sikoki and M.O. Edun, 2012. Effects of salinity on larval dimensions of Tilapia guineensis, J. Fisheries& Aquatic Sciences. D01; 10.3923:1-6.
Allison, M.E., F.D. Sikoki, and Vincent-Akpu, 2008. Fecundity, sex ratio, maturity stages, size at first maturity, breeding and spawning of Palailiapellucida (Boulenger, 1901) in lower reaches of the Nun River, Niger Delta. Ceramo de pesquisaSeriebiologia Cruz do sul 2(20):31-47.
Amiye Francis and Francis D. Sikoki, 2007b.Condition factor of fishes from the Andoni River System, Niger Delta, Nigeria. Environ. & Ecology 25(2):411-415.
Anene, V.A. and F.D. Sikoki, 1996.Some aspects of the biology of Labeosenegalensis, (Cuvier and Valenceinnes, 1817) in Umuoseriche Lake, Nigeria.Delta Agric. 3:106-114.
Babatunde, B.B. and F.D. Sikoki, 2012.Baseline data on radioactivity in sediment and seafood from Bonny Estuary, Niger Delta, Nigeria.J. Environmental Radioactivity (in press).
Bayagbona, E.O. 1979. Survey of shrimp resources of Nigeria. NIOMR. Occ. Paper No. 24. Ibim A., and Sikoki, F. D. 2009. Effect of protein level on the catfish, Claria gariepinus. Paper presented at the Pan African Fisheries Association. 1st – 6th October, 2009 at Adis Ababa.

80
Christy, F.T. (Jr) and A. Scott, 1965. The common wealth in ocean fisheries: some problems of growth and economic allocation. Johns Hopkins Press, Inc. Baltimore, 281pp.
Delgado, C.N. Wada, M. Rosegranmt, S. Meijer, and M. Ahmed., 2003. Fish to 2020. Supply and Delta, Nigeria and their aquaculture implications Jour. of Fish Intern. 2(1):22-66.
Demand in changing global markets. Washington, D.C. and Penang: IFPRI (International Food Policy Research Institute) and World Fish Centre.
E.J. Ansa and F.D. Sikoki, 2006.Composition, distribution and abundance of benthic macrofauna in the Andoni flats, Niger Delta, Nigeria.Envir.& Ecology, 24(4):784-791.
Egborge, A.B.M. 1993 Biodiversity of aquatic fauna of Nigeria. Natural Resources Conservation Council, Publ. Abuja. 173pp.
Ekeh, I.B. and F.D. Sikoki, 2003.The status and seasonal variability of some physico-chemical parameters in the New Calabar River, Nigeria. Suppl. Ad. ActaHydrobiologica 5(2003):45-60.
Ekeh, I.B. and F.D. Sikoki, 2004.Diversity and distribution of phytoplankton in the New Calabar River, Nigeria.J. Living Syst. Sust. Dev. Vol1:5-12.
Ekwu, A. O. and Sikoki, F. D., 2010.The distribution of phytoplankton and chlorophyll in the Cross River Estuary, Nigeria.Asian J. Microbiol.Biotech &Envir. Sc. 12(2):239-244.
Ekwu, A.O. and Sikoki, F.D., 2001. Comparison of hormonally induced sex direction in two strains of Oreachromis niloticus (Trewavas). Jour. Of Aquatic Sciences 16 (2): 147 – 149.

81
Elakhame, L.A. and F.D. Sikoki, 1996.Composition and distribution of fish species around the Epic Creek of the Niger Delta, Nigeria.Delta Agric. 3:115-123.
FAO, 2003. The state of food insecurity in the world (SOF). Rome: Food and Agriculture Organization, 36pp.
FAO, 2004. The state of world fisheries and aquaculture (SOFIA).
Part 1: World review of fisheries and aquaculture, fishers and fish farmers. FAO. Rome.
Francis A. and F.D. Sikoki, 2007a.Growth coefficient of fish species within the Andoni River, Niger Delta.
Francis A. and Sikoki, F.D., 2004a. Frame survey of fishing communities in the Andoni River system, Niger Delta, Nigeria. J. Voc. Sci. & Educ. Dev.Vol 5(1):150-155.
Francis A. and Sikoki, F.D., 2004 b. Fishes of the Andoni River system brackish waters – Niger Delta, Nigeria. Afri J. Interdisciplinary studies. 5(1) 123-130.
Graham, M. 1943. The fish gate. Faber and Faber, Ltd. London, 196pp.
Ikomi, R.B. and F.D. Sikoki, 1998.Fish Communities of the River Jamieson, Niger Delta, Nigeria.Trop. Freshwater Biol. 7:37-51
Ikomi, R.B. and F.D. Sikoki, 2001. Studies on the distribution,
abundance, growth pattern and dietary habits of Brycimus nurse (Ruppel, 1832) Osteichthyes:Characidae) in River Jamieson, Nigeria. ActaIchthyalPiscat. 31(1):27-44.
Ikomi, R.B. and F.D. Sikoki, 2003.Studies on the ecology of the African longfin, Brycinuslongipinis (Gunther, 1864) in the Jamieson River, Niger Delta, Nigeria.FascVol Xxxiii (1) 17-35.
Ita, E.O., E.K. Sado, J.K. Balogun, A. Pandogari and B. Ibitoye, 1985. Inventory Survey of Nigeria inland waters and their

82
resources: A preliminary checklist of inland water bodies in Nigeria with special reference to ponds, lakes, reservoirs and major rivers. Kainji Lake Research last. Tech. Report Srries No. 14. 51pp.
Komi, G.W., Sikoki, F.D., A. Wokoma and D.O. Bekibele, 2012. growth enhancement potential of Mucuna puriene utilis on the Nile tilapia, Oreochromis niloticus (L). Paper presented at the 27th Annual Confr. of FISON. 25th to 30 Nov; 2012 in Yenagoa, Bayelsa State.
Nielsen, L.A. 1976. The evolution of fisheries management
philosophy.Marine Fisheries Review, Vol. 38(12):15-23. Okon, E.A., Sikoki, F.D. and Komi, G.W. 2011.The effect of
dissolved oxygen on zooplankton distribution in Mbo River, Niger Delta, Nigeria.Intl J. Zoology, Vol. 3(1):14-20.
Powell, C.B., 1990. The ecological effects of human activities on the value and resources of Nigerian wetlands in: T.V.I. Akpata and D. U.U. Okali (Eds) Nigerian wetlands. UNESCO/MAB. Port Harcourt, Nigeria. pp 35 – 46.
Russel, E.S. 1942. The overfishing problem. Cambridge Univ. Press. Cambridge, 130pp.
Shiroro Reservoir, Nigeria. Liv. Systs and Sust. Dev. 2 : 1 – 7. Sikoki F.D. and J.Oyero, 1994. The status of aquaculture in Nigeria.
Gratte Ciel Public Port Sikoki F.D., I.N. Anyanwu, 2010. Spatial and temporal variation of
physico-chemical variations in a small “pristine” stream in Niger.Proc. FISON Ann Confr. 2010:pp 168-174.
Sikoki, F. D. and S. Hart, 1999.Studies on the fish and fisheries of the Brass River system and adjoining coastal waters.J. Appl. Sc. &Env.Biol.
Sikoki, F. D. and S. Sadiku, 1999. Fish catch composition and gear selectivity in Shirorolake. Trans. Nig. Soc. of Biol. Consr.

83
Sikoki, F. D., I.N. Anyanwu and N. Zabbey, 2009.Fish assemblages of Onu-IyiUkwu stream in south eastern Nigeria.Trop. Freshwater Biol. 17(2):41-51
Sikoki, F.D. and A. Osuamkpe, 2012.Evaluation of the Ecological integrity of the lower Orashi River using Bioassessment techniques. (Unpublished)
Sikoki, F.D. and A.J. Otobotekere, 1999. Fisheries (Chapter 22) In: The land and people of Bayelsa State, Central Niger Delta E.J. Alagoa (ed) Onyoma Research Publications, Port Harcourt. 411pp.
Sikoki, F.D. and B.B. Babatunde, 2010. Assessment of trace metal contamination of marine resources for an integrated catchment management scheme for the Niger Delta, Nigeria. Proceedings of the International Confr. on Marine Isotopes, Vienna Austria. 123 – 128.
Sikoki, F.D. AND C. Ejike, 1997. Influence of Envionmental factors on gonadal recrudescence, maturation and spawning in the common carp, Cyprinus carpio in a high altitude tropical lake. Delta Agric 4:28 – 50.
Sikoki, F.D. and E.I. Seiyabo, 2012. Impact of dredging on the fisheries of Igbedi Creek, upper Nun River, Central Niger Delta (Unpublished).
Sikoki, F.D. and H. Enajekpo, 2001. Effects of Water Soluble Fraction (WSF) of crude oil on some haematological factors and liver glucose in Oreochromis miloticus (Trewavas) J. Sci & Envir.2(1) : 10 – 14.
Sikoki, F.D. and J.F. Abowei, 2002.Estimation of the rate of Exploitation of a fishery using data from fishing and total mortality. Paper presented at the 1st International Mathematical Sciences Summit held at the University of Port Harcourt, 29 July to 2nd Aug., 2002.
Sikoki, F.D. and K.F. Lagler, 1986. The effects of depth on the abundance and spatial distribution of Pontoporeia hoyi

84
(Crustacea: amphipoda). Nig. J. Appl. Fish and Hydrobiol. 1 : 37 – 40.
Sikoki, F.D. and N. Zabbey, 2006. Environmental gradients and benthic community of the middle reaches of Imo River, South Eastern Nigeria. Environment and Ecology 24(1) 32-36.
Sikoki, F.D. and V.O. Eneh, 1992. The effects of an anabolic hormone, methyltestosterone on growth and food conversion efficiency of the catfish, Claria gariepinus. Nig. J. Tech. Res. Vol. 3 No. 1: 6 – 10.
Sikoki, F.D. and Veen, J.V. 2004. Aspects of water quality and the potential for fish production of shiroro reservois, Nigeria. Live Sys. Sus. Dev. II:1-7
Sikoki, F.D., A.I. Hart and J.F. Abowei, 1998. Gillnet selectivity and fish abundance in the lower Nun River, Bayelsa State, Nigeria. J. Appl. Sci & Environmental Mgt. 1(1) : 13 – 19.
Sikoki, F.D., Egemba, M.T. and Komi, G.W., 2012. The effects of crude oil on the population structure of plankton. Paper presented at the 27th Annual Confr. Of FISON held in Yenagoa, 25th to 30th Nov., 2012.
Sikoki, F.D., L.R. Curtis and R.A. Tubb, 1990. The relationship between reproductive state and uridine dispho – glucuronic transferase activity in the common carp, Cyprinus Carpio. Nig. J. of Tech. Res. 2(1): 103 – 106.
Sundararaj, B.I. 1978. Environmental regulation of annual reproductive cycles in the catfish, Heteropnoustes fossils. In Environmental Endocrinology. (Assenniacker, I. and D.S. Farner, eds) Berlin Springer – Verlag pp. 26 – 27.
Tobor, J.G. 1990. The fishing industry in Nigeria: status and potential for self sufficiency in fish production. NIOMR Tech. Paper No. 54
Vincent-Akpu, I.F., Allison, M.E. and Sikoki F.D., 2010. Survival and gill morphology of different life stages of Tilapia

85
guineensis exposed to drilling fluid XP-07. Ciencia Rural, Santa Marie, Online.
Williams, F., 1968. Report on Guinean trawling survey. Publ. Organ. Afr. Unity Sci. Tech. Res. Comm
World resources Institute, 2003. Earth trends environmental information portal. Harcourt. 117pp. http://earthtrends.wri.org/COA/data.tables/datatable/htm
Yakubu, A.F., F.D. Sikoki, J.F. Abowei and S.A. Hart, 1999.A comparative study of phytoplankton communities of some rivers, creeks and burrow pits in the Niger Delta Area.JASEM, 4(2):41-46.
CITATION ON
Professor Francis David Sikoki, FFs, UPF Ambassador of Peace
100th Inaugural Lecturer of the University of Port Harcourt

86
Mr Vice Chancellor Sir, distinguished guests, Ladies and Gentlemen. It is my honour and privilege to read the citation of my colleague, friend and brother with whom I have associated closely for some 30 years now. During this period, I have had the opportunity of relating with him both professionally and socially.
Professor Francis D. Sikoki became a great scholar and teacher of international repute not by accident but by a conscious desire and painstaking determination to pursue a career in teaching, which he has been doing for the past 31 years now. This is because in 1973, after completing his Advanced School Certificate Course at the Baptist High School, Port Harcourt, he was one of three students selected by the Rivers State Government to undergo a course of study in Radiography in the United Kingdom. He turned down the offer on the grounds that he wanted to become a Teacher, not a Radiographer. His decision made the then Principal Medical Officer (PMO), Ministry of Health, Port Harcourt in utter disbelief of this young man’s decision to remark thus: “I have not seen such manifestation of naivety all my life. May the good Lord bless you.” With that determination, the young Francis set out to accomplish his goal of becoming a Teacher!
Born some 60 years ago to the family of Mr and Mrs David T. Sikoki of Angiama in Southern Ijaw Local Government Area of Bayelsa, Francis had his primary education in various schools in the old Eastern Region from 1957 to 1963 where his father served as a Court Registrar. From there, he proceeded to the Niger Grammar School and later to Baptist High School both in Port Harcourt for his Secondary and Higher School education.
Thereafter, he proceeded to the United States of America for his tertiary education. He attended Northland College, Wisconson and the prestigious University of Michigan, Ann Arbor from 1974-1979. He later attended the University of Jos and the Oregon State University, Corvallis, Oregon, USA for his doctoral

87
degree from 1983 to 1987. During this period, he received several awards scholarships and fellowships including:
Citation in the Dean’s list for outstanding academic performance; 1975
Academic Achievement award, Kiwanis of Grand Forks, USA 1980.
Letter of commendation for maintenance of clean and healthy Environment, Unijos – 1986
Academic Noble Award of the Institute of Administration in Nigeria. – 2008
Fellow, Institute of Administration, Nigeria - 2008
Fellow, Fisheries Society of Nigeria - 2010
Rivers State Government Scholarship - 1974–1979
Federal Government of Nigeria Scholarship – 1980
University of Jos Study Fellowship - 1984–1985
Member, Board of the American Biographic Institute - 2007 to date Professor Sikoki returned to Nigeria in September in 1980
and after his National Youth Service, began his teaching career as an Assistant Lecturer in 1981 at the University of Jos. He left Unijos for the Federal University of Technology, Minna in 1988 but retained his position at the University of Jos as a Visiting Lecturer for two years. In August 1993, Professor Sikoki transferred his services to the University of Port Harcourt where he was elevated to the rank of Professor in 2001.
His well deserved elevation to this rank is the manifestation of an impressive scholarly career in the University system with an international perspective. First, from January, 1984 to May, 1985, he was visiting Assistant Professor at the Oregon State University. His research work while there elucidated the sequence of events (endocrine and enzymatic) leading to the spawning act in the common carp, Cyprinus carpio. The

88
significance of this work earned him an invitation to the annual conference of the American Society of Toxicology in 1986 to present a paper. His other scholarly works include:
Over eighty published works in reputable Journals and Conference Proceedings;
Six books;
Five chapters in books; and
Several monographs/technical reports. Professor Sikoki also successfully combined his research
activities with a productive teaching/students supervision programme in the University. In the course of his 32 year career, he has produced 18 PhD holders among whom are two Professors – one being a Deputy Vice Chancellor in a Nigerian University. He has also supervised 32 MSc students and over 60 BSc holders. Many of his former students currently hold high positions of authority in Government and in the organized private sector.
Professor Sikoki has held several administrative positions in the Nigerian University system over the years.
(i) Member, Governing Council, Federal University of
Technology, Minna (1991–1993). (ii) Member, Governing Council of Niger Delta University,
Wilberforce Island (2005–2012). (iii) Head, Department of Animal Production and Fisheries,
FUT, Minna (1991 – 1993) (iv) Head, Department of Animal and Environmental
Biology, Uniport (1997 – 1999) (v) Coordinator, Post Graduate Programmes in Fisheries and
Hydrobiology (1999 – date) (vi) Member, Board of Institute of IAR & D, Uniport (2007 –
2009)

89
(vii) Chairman, Department Laboratory Manuals Committee (2012 to date)
(viii) Chairman, SLT, University of Jos (1986 – 1988) (ix) Director, Centre for Marine Pollution Monitoring and
Seafood Safety (2012 to Date) (x) Chairman, Housing Committee, Uniport (2010 to date) (xi) Member, Council Committee on Honourary degrees
(2003 to 2005) (xii) Chairman/Member of Several University-wide Ad-hoc
Committees at FUT, Minna; Unijos and Uniport. (xiii) Faculty Coordinator, Community Service Programme
(2000 – 2002) (xiv) Member Capital Projects Committees (1998 to 2000) (xiv) Member, World Bank Project Implementation
Committee (FUT, Minna, 1990-1993) His contributions to national development are equally very impressive. He has served as a member of four NUC Accreditation Panels including:
University of Ibadan;
Federal University of Technology, Akure;
Tafawa Belewa University, Bauchi; and
Usman Dan Fodio University, Sokoto. He has also chaired two NUC Resource Verification Panels to:
Anambra State University, Uli, and
Federal University of Technology, Owerri. Some of his other national and international assignments include:
(i) Membership of a Fisheries Development Mission of the World Bank Asssisted NS/ADP in 1991;
(ii) Membership of a World Bank Review Mission of the National Agricultural Research Project (NARP) in 1995;
90
(iii) Chairman/Member (FEPA/FMEnv) Review Panels for Oil Field Development Plans (from 1999 to Date);
(iv) Member, National Agricultural Land Resources Development Committee (NALDAC) (1991 to 1998);
(v) Member, Fisheries Sub-Committee, National Advisory Committee on Agricultural Research (NACAR), 1993-1999;
(vi) Joint National Coordinator, (South), Nationally Coordinated Agric Research Programme (NCRP), 1996 to 1999;
(vii) Member, Capital Market Bond Committee, Bayelsa State Govt., 2011.and
(viii) National Cordinator, IAEA-FGN, project RAF/7009 on Marine Pollution Monitoring and Seafood Safety. (2009 to date).
While serving at the Federal University of Technology,
Minna, Prof Sikoki attracted a grant from the Directorate of International Development of the Netherlands for the establishment of a Dutch- FUT training programme for Post-graduate Fisheries Research at FUT, Minna. He served as the local Coordinator for the programme which involved the exchange of Post Graduate Students between the Wageningen Agricultural University in the Netherlands and FUT, Minna from 1991 to 1993. Professor Sikoki has contributed to the development of other universities through his participation as External Examiner to:
Federal College of Fisheries, New Bussa (1992)
R/S University of Science and technology, (1993 to date)
University of Uyo, Uyo, (1995 to date)
University of Benin, Benin, (2000 to date)
Federal University of Agriculture, Umudike, (2001-2010)
Federal University of Agriculture, Markurdi (2009 to date)
Federal University of Technology, Minna, (2010 to date).

91
Professor Sikoki also has considerable industry experience
through sabbatical placement in the Shell Petroleum Development Company, SPDC in 1995 where he served as an Environmental Adviser. He was attached to the Special Studies Unit of the department of Health, Safety and Environment where he was involved in the design and execution of scientific investigations on Environmental issues. Since then, he has provided consultancy services to several other private companies.
Mr. Chairman, distinguished Ladies and Gentlemen, while most people would have felt satisfied and content with the above professional achievements, Prof Sikoki felt otherwise, saying that “pursuing a career in teaching cannot be complete with emancipating your people culturally, socially and economically. It is therefore no surprise that this erudite academic devoted considerable effort to community service. He served as chairman of the Southern Ijaw Consultative forum, SICOF from 1995 to 2007 and is currently a member of the National Representative Council of the Ijaw National Congress, INC. Without question, his activities and contributions in these positions have touched the lives of several people, who in turn, have influenced the attitudes of others. It is therefore, no surprise that when the INC inaugurated the Action Committees for the Socio-economic development of Ijaw land, he was appointed to all important Wetlands Study Group. Mr Chairman, Your Excellencies, distinguished Ladies and Gentlemen, permit me at this juncture to mention that the greatest attributes of Prof Sikoki are his exemplary Christian life and love for the under – privileged member of his community. He is a Licensed Lay Reader of the Anglican Communion. During visits to his home community, he regularly visits with the elderly and identifies with the youth; encouraging them to pay attention

92
to their studies and providing counseling for those who may be experiencing difficulties. His love for the youth further manifested some five – years ago when he established a scholarship scheme under the auspices of his late father’s Foundation, the DAVID SIKOKI FOUNDATION through which some indigent students from his community in tertiary institutions receive limited financial support. Prof Sikoki is happily married to Bondan Sikoki who has created a conducive environment for a stable family. A great researcher in her own right; she is currently engaged in an International study family life in Jarkata, Indonesia. They have one son, Miebi who is also resident in Jakarta. Mr Chairman, distinguished Ladies and Gentlemen, I am delighted to present to you our 100th Inaugural Lecturer as a distinguished international fisheries expert, an apostle of fisheries conservation, a fighter for the elimination of hunger, a great teacher and a fine gentleman, Professor Francis David Sikoki. Prof Nelson Brambaifa Professor of Pharmacology, University of Port Harcourt, Port Harcourt. ORATOR